Abstract
(1) Background: The percentage of breast augmentations has increased in recent years alongside the frequency of implant removals. Musculoskeletal and postural disorders are often overlooked during this removal process. Research indicates that excess anterior load from breast implants can disrupt postural control and potentially lead to short- or long-term musculoskeletal dysfunction. This study aims to evaluate the immediate changes in postural control after artificial breast augmentation in healthy female volunteers. (2) Methods: Spinal angles, the center of pressure (CoP), and electromyographic activity of the spinal muscles were recorded in the static position and during the functional reach test (FRT) without and with implants of different volumes (220 mL, 315 mL, and 365 mL). Subjective perceptions of effort, comfort, weight, and performance in the FRT were also assessed. (3) Results: Statistical differences were significant in the scapular elevator during the one-minute standing position (lower activation with the 220 mL implant compared to the control and 315 mL) and in the trapezius muscles during the FRT (lower activation in the upper trapezius in the 315 mL vs. control in the reach phase and 220 mL vs. control in the return phase and higher activation in the lower trapezius in the 315 and 365 mL vs. control in the reach phase). Additionally, significant differences were identified in the performance of the FRT and the associated subjective perceptions. (4) Conclusions: Breast implants with sizes of 220, 315, and 365 mL can alter scapular neuromuscular control, but these differences do not seem substantial enough to result in negative biomechanical effects in the short-term analysis.
1. Introduction
Postural control combines two major concepts, postural orientation and postural stability. The first one is related to the control of body alignment with the influence of gravity, which is based on the association of multiple systems, like the visual, proprioceptive, and vestibular. The second one refers to the capacity to control the body’s center of mass within its base of support against internal or external disturbances [1,2]. Effective postural control results from the merging of multiple factors, such as physiological, biomechanical, psychological, sociocultural, and environmental, and from the conjunction of multiple systems, such as the central nervous, vestibular, somatosensory, visual, and musculoskeletal systems. Moreover, the balance between the systems is crucial for maintaining posture and preventing falls [2]. Biomechanical analysis using force plates, motion capture systems, inertial sensors, electromyography, and functional balance tests is frequently tied up to the assessment of postural orientation and stability. This extensive analysis allows for researchers to comprehend the motor control capacities of different groups of people [2,3].
While numerous factors influence postural control, such as decreased movement variability, older age, and low levels of physical activity, some authors have highlighted the role of gender-specific factors, particularly in women. For example, in healthy female individuals, breast volume is a factor that can affect postural control [2,4,5]. Increased breast volume can influence postural control in women, with larger breast sizes potentially requiring postural adjustments and increased muscle load to support anterior weight displacement [4,5]. Excessive breast volume, as seen in macromastia, can lead to discomfort and pain, often alleviated through breast reduction surgery, which improves the quality of life [6,7,8,9,10]. Conversely, breast augmentation, often for aesthetic reasons or even for post-mastectomy reconstruction, can also affect postural stability by altering the center of gravity and weight distribution. Such changes may require adjustments in body alignment and muscle activation, highlighting the impact of breast size modifications on postural control [11,12]. In some cases, due to breast removal or body image concerns, women search for breast augmentation to increase their current size, which can significantly improve their self-esteem and well-being [13,14]. However, if the implant size is not adequately chosen, it is possible that the same postural change seen in macromastia can be noticed in the breast augmentation population.
Generally, breast implants are available in sizes ranging from 100 mL to 800 mL. In Europe, plastic surgeons typically use implant volumes lower than 300 mL, the average breast implant volume used worldwide. However, other regions, such as the United States and Oceania, can usually apply implants above 300 mL [15,16]. According to the most recent global data from 2022, breast augmentation was the second most common surgical procedure, but it is noteworthy that breast implant removal has also seen significant growth in the most recent data [17].
Some reasons associated with the removal or revision of augmentation breast surgeries are major complications, such as infection or capsular contracture. Other issues, such as sudden musculoskeletal dysfunctions or postural control changes, are well-documented problems associated with macromastia and breast cancer but are not usually seen as the main issue when discussing the necessity of removal of breast implants [18]. Even so, early studies have shown a direct correlation between breast size and musculoskeletal spine conditions [9,19]. According to Michalik and colleagues (2022), women with D cup sizes have shown higher thoracic kyphosis and lumbar lordosis than women with lesser cup sizes, showing a positive correlation between the breast cup size and physiological spinal curvature [19]. The hypothesis under consideration suggests that breast volume disproportionate to the body can lead to certain alterations in an individual’s center of gravity and potentially musculoskeletal changes that include an increase in thoracic kyphosis or other postural shifts, muscular changes, or pain related to the cervical and lumbar spine muscles [19,20,21].
Even though prior research has explored the implications of anterior load on musculoskeletal dysfunctions and quality of life of women, a gap remains in the literature regarding the direct effects of increased anterior load, with size increase associated with the placement of breast implants on postural control during static and dynamic postures [9,19,20,21]. In addition, current research focuses primarily on individuals who have faced breast augmentation for reconstructive purposes, such as breast cancer following mastectomy or asymmetry issues, and there is not much information about healthy individuals who undergo this surgery for cosmetic purposes [22,23].
Therefore, this study aims to fill this gap in the literature by assessing the direct changes in postural control parameters in the upright position as a static postural condition and in the functional reach test (FRT) performance as a dynamic postural condition following artificial breast augmentation among healthy female volunteers. Specifically, the influence of breast implants artificially imposed with an appropriate sports bra to isolate the anterior effect of the implants’ volume on postural stability and orientation and the neuromuscular control by analyzing parameters such as center of pressure (CoP) displacement and mean velocity, spinal curvatures, and the activity levels of muscles such as sternocleidomastoid, erector spinal cervical, elevator scapular, pectoralis major, upper trapezius, lower trapezius, lumbar multifidus, and transversus abdominis/internal oblique muscles were assessed.
2. Materials and Methods
2.1. Study Design
According to the STROBE guidelines, a cross-sectional design study was developed.
2.2. Sample Eligibility Criteria
This study was carried out between May 2024 and September 2024 at the Human Movement Analysis Lab of the Center for Rehabilitation Research located at the School of Health of P. PORTO after the ethical committee of the School of Health of P. PORTO approval (CE0071D).
This study included healthy female volunteers recruited by convenience sampling from the School of Health of P. PORTO based on their responses to an online questionnaire that provided information on the inclusion criteria. Only participants meeting the eligibility criteria and who consented to further communication were considered. The study population included healthy female adults (age ≥ 18 years old). Participants were excluded if they had undergone breast surgery; were pregnant; or had musculoskeletal, neurological, proprioceptive, visual, or vestibular disorders that interfered with the performances of tasks that involved movements related to the vertebral column and cervical, shoulder, and/or lumbar muscle activation. In addition, individuals with a body mass index (BMI) of 30 kg/m2 or greater and those who had consumed alcohol within 24 h before data collection were excluded [20,21,24]. Before testing, each participant read and signed the informed consent form. After exclusion based on the eligibility criteria, 35 females participated in the present study (Figure 1).
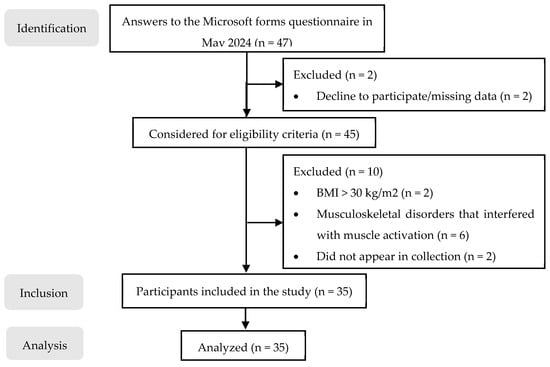
Figure 1.
Sample flow chart.
2.3. Instruments and Procedures
2.3.1. Pilot Study
Before the final data collection, a pilot study was conducted with three individuals who were not part of the study sample but had the same characteristics. The purpose of the pilot study was to assess the methodology and procedure implementation. No modifications were necessary for the main study.
For data collection, the implants used were anatomically shaped implants sponsored by LineaMédica® (Dispositivos Médico-Cirúrgicos, S.A, Porto, Portugal). The selected implant sizes for evaluation were intended to reflect those commonly used by European plastic surgeons. To meet this requirement, the company provided pairs of demonstration implants with volumes of 220 mL, 315 mL, and 365 mL. These implants were placed in a pocket of an adjustable sports bra so that they did not come in direct contact with the participants’ skin and to assess the anteriorly imposed volume in the participants’ postural and neuromuscular control.
2.3.2. Anthropometric Measurements
The participants underwent preliminary anthropometric measurements, including height and body mass, which were used to calculate the participants’ body mass index (BMI) and mammary volume (MV). BMI was calculated using the following formula:
Individuals were categorized as underweight if their BMI was less than 18.5 kg/m2, normal weight if their BMI was between 18.5 and 24.9 kg/m2, overweight if their BMI was between 25.0 and 29.9 kg/m2, and obese if their BMI was 30.0 kg/m2 or more by the worldwide standard for BMI [25].
The percentage of implant weight in relation to the total weight of the body was calculated using the following formula:
MV was calculated using the Qiao et al. (1997) formula:
where MP is the mammary projection, which corresponds to the horizontal distance between the thoracic wall and the nipple, MR is the distance between the nipple and the medial terminal crest (medial breast radius), LR is the distance between the nipple and the lateral terminal crest (lateral breast radius), and IR is the distance between the nipple and the inframammary fold (inferior breast radius) [26]. The breast distances were measured in centimeters with standard tape. The MP was measured by subtracting the horizontal distance measured from a fixed point to the nipple and the horizontal distance measured from the same fixed point to the thoracic wall [21]. The participants were in a standing position with arms along their bodies when measured.
2.3.3. Physical Activity Level Assessment
For characterization of the participants’ physical activity (PA) levels as one of the factors that influence individual postural control, the International Physical Activity Questionnaire—Short Form (IPAQ-SF) was used, as it is a brief and efficient method for estimating PA levels. This instrument has an acceptable level of reliability of around 0.77 (Spearman’s p’s) and a validity criterion of around 0.49 [27,28].
The subjects’ PA levels were scored using the formula of the metabolic equivalent task (MET) [29]:
where Total MET represents the total amount of energy expended throughout a whole week and is expressed by min/week. Walk METs, Mod METs, and Vig METs represent, respectively, the total amount of energy expended walking (3.3 METs), doing moderate (4.0 METs) or vigorous (8.0 METs). PA throughout a week was calculated by multiplying each representative METs by minutes and by the number of days (Mets × min × day) [29]. According to the scoring protocol, individuals were classified as low active if no activity was reported or if activity was recorded but not enough to fit into one of the following categories. An individual was classified as moderately active if the person reported five or more days of walking, moderate-to-vigorous exercise, or vigorous exercise and at least 600 MET-minute per week. An individual was classified as highly active if the person met either of the following two requirements: walking, moderate-intensity exercise, or vigorous-intensity activity on at least three days and accumulating at least 1500 MET-minute per week or seven or more days of any combination of walking, moderate-intensity exercise, or vigorous-intensity activity achieving at least 3000 MET-minute per week [29].
2.3.4. Scapular Dyskinesia Type Characterization
The Kibler’s Scapular Dyskinesia Type Characterization was used to characterize the participants’ scapular position at rest and during the abduction and adduction movements of the shoulder. This scapular classification was used to assess and categorize scapular dysfunctions that may interfere with the participant’s performance. The Kibler Scapular Classification has a K coefficient of 0.49–0.64 [30].
Based on visual observation, a trained physiotherapist categorized each participant’s scapular presentation according to the criteria set out in Table 1. The scapular classification was initially performed with the participant in a resting standing position, followed by the abduction of both arms [30].

Table 1.
Scapular Dyskinesia Type Characterization.
2.3.5. Subjective Perception of Comfort, Effort, and Implant Weight
To evaluate the subjective perceptions of comfort, effort, and implant weight, each participant was asked to characterize her experiences; Linkert qualitative scales were designed.
For comfort, the scale included the following labels: “very comfortable”, “comfortable”, “slightly uncomfortable”, “uncomfortable”, “moderately uncomfortable”, and “extremely uncomfortable”. For effort, the labels were as follows: “effortless”, “very light effort”, “light effort”, “a little intense effort”, “intense effort”, and “very intense effort”. For implant weight, the scale included the following: “very light”, “light”, “a little heavy”, “heavy”, “moderately heavy”, and “very heavy”. The participants completed these assessments during each task (orthostatic and reach performance tests) and with each implant weight after the three repetitions.
2.3.6. Kinematic Assessment
The Qualisys Motion Capture System 2021.2 from Qualisys AB®, Gothenburg, Sweden, was used to assess the head and spine kinematics during the FRT and in the one-minute standing position test. This system included 13 cameras, (8 Oqus and 4 Miqus, operating with a sampling rate of 100 Hz, and 1 Miqus video camera, operating with a sampling rate of 25 Hz). Based on the studies of Guan et al. (2015) and Cacciatore et al. (2011), to evaluate the kinematics of the cervical spine in the sagittal plane, a set of three reflective markers were placed unilaterally on the dominant side of the lateral orbital margin (LOM), the tragus of the ear (TRG), and the seventh cervical spinous process (C7) [31,32]. Based on the study by Muyor et al. (2022), a set of six reflective markers were placed on the spinous processes of the first, third, and eleventh thoracic vertebrae (T1, T3, and T11) as well as at the first and fourth lumbar vertebrae (L1 and L4) and the second sacral vertebra (S2) to assess the kinematics of the thoracic and lumbar curvature and sacral tilt in the sagittal plane [33] (Figure 1) [34,35,36,37,38,39,40,41].
Finally, a marker was placed in the third metacarpophalangeal joint (3-MCF) to measure the distance traveled by the dominant arm in space when the participant reached forward.
The setup of markers was standardized across all participants to reduce the individual variation of the placement of markers.
A single force plate [model FP4060-08 connected to amplifier AM 6300 Bertec Corporation (Columbus, OH, USA) and an analog board b from Qualisys AB®, Gothenburg, Sweden] with a sampling frequency of 1000 Hz was used to assess CoP displacement and velocity in both the anteroposterior (CoPAP) and mediolateral (CoPML) directions. The participant’s foot position on the platform was also initially established to standardize individually and comfortably the participant position for each evaluation.
Before each participant evaluation, the Qualisys Motion Track Manager System and the Bertec force plate were calibrated [42].
2.3.7. Electromyographic Assessment
The surface electromyographic (sEMG) signal was recorded using the Trigno Wireless System (Delsys Inc., Natick, MA, USA) integrated into the Qualisys Motion Capture System via analog board outputs. The sEMG signal was obtained through pre-amplified bipolar differential electrodes (Trigno Avanti Sensor model, Delsys Inc., Natick, MA, USA). The electrodes had a rectangular configuration of two parallel Ag bars with an interelectrode distance of 10 mm, a gain of 1000, a common mode rejection coefficient > 80 dB, and an acquisition frequency of 2000 Hz.
Before electrode placement, the skin was shaved and wiped with 70% isopropyl alcohol to reduce skin impedance [43]. Eight electrodes were positioned on the muscles of the dominant side landmarks of each participant (Figure 2).
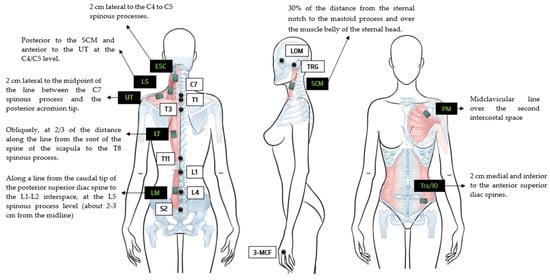
Figure 2.
Representation of reflective marker placements of the lateral orbital margin (LOM); the tragus of the ear (TRG); seventh cervical spine process (C7); first, third, and eleventh thoracic vertebrae (T1, T3, and T11); one and four lumbar vertebrae (L1 and L4); and the second sacral vertebra (S2) as well as the electromyography sensor placements with anatomical landmarks of the sternocleidomastoid (SCM) [34], erector spinae cervical (ESC) [34], elevator scapulae (LS) [35,36], upper trapezius (UT) [37,38], lower trapezius (LT) [37], pectoralis major (PM) [39], lumbar multifidus (LM) [40], and transversus abdominis/internal oblique (Tra/IO) [41].
The sEMG signals of the sternocleidomastoid (SCM), erector spinae cervical (ESC), elevator scapulae (LS), upper trapezius (UT), lower trapezius (LT), pectoralis major clavicular portion (PM), lumbar multifidus, (LM) and transversus abdominis/internal obliques (Tra/IO) were positioned according to anatomic references as stated in Figure 2. Each electrode was placed in the most prominent portion of each muscle belly confirmed by palpation during an isometric contraction [37,44].
The quality of the sEMG signal was checked using EMG Works software version 4.7.9 (Delsys Inc., Natick, MA, USA). Only values of SNR greater than 1.2, baseline noise less than 15 microvolts root mean square (µVrms), and line interference less than 2 were considered acceptable [45].
2.4. Testing Procedure
After the sample characterization measurements, the participants were asked to wear an adjustable sports bra with pockets for the implants. The participants were blinded to the implant size used at each stage of the study. Then, the sEMG electrodes and the reflective markers were placed for kinematic and electromyographic assessments during the one-minute standing position test and the FRT.
For the one-minute standing position test, the participants were instructed to stand on the force plate with their arms alongside their body and their head facing forward and remain still for the full minute. For the FRT, the participants started with their dominant arm in a 90° shoulder flexion and their hands closed. Then, the participants were asked to reach forward as far as possible without moving their feet or bending their knees [46]. To return to the starting position, the participants were asked to reverse the movement in a controlled manner, returning to 90° of shoulder flexion. To standardize the FRT, an anterior reference point was placed at two times the participant’s arm length when flexed at a 90° angle. Three repetitions of each task were performed with each implant and without an implant, which served as a control [46].
Each participant was evaluated with each implant in the same data collecting session, in a randomized order, with one minute of rest between tests.
2.5. Data Processing
The kinematic from the spinal angles and the AP and ML CoP displacement and velocity were extracted from Qualisys Motion Capture Software 2021.2 from Qualisys AB®, Gothenburg, Sweden, and then managed and analyzed via Microsoft Excel.
Before data extraction, all markers from each participant were identified, labeled, and filtered with a 4th order Butterworth filter of 6Hz with the smoothing tool from Qualisys software as recommended by their manual to reduce high-frequency marker noise [42,47,48].
Data from the angles of the head (LOM-TRG), cervical spine (TRG-C7), thoracic spine (T1-T3; T11-L1), lumbar spine (T11-L1; L4-S2), and sacral tilt (L4-S2) in the sagittal plane were extracted along with data from the position of the 3-MCF and the force plates.
A 2nd order Butterworth filter of 20 Hz using AcqKnowledge® (Version 3.9.0) was applied only in the channels related to the AP and ML CoP data to reduce high-frequency noises.
The FRT was divided into three phases: the reach phase, the maintenance phase, and the return phase. The onset of the reach phase (T0) was identified as the instant when the signal value from the 3-MCF position along the x-axis reached a value higher than 5% of the maximum value obtained during the task above the baseline. The end of the phase was defined as the instant of the maximum value of the 3-MCF trajectory. The maintenance phase consisted of a 5-s hold at the maximum reach position. The beginning of the return phase was defined as the instant when the signal value from the 3-MCF position along the x-axis reached a value lower than 5% of the maximum value. The end of this phase was defined as the instant when the shoulder had returned to a 90° flexion angle, and the trajectory had returned to its minimum value and initial position (Figure 3).
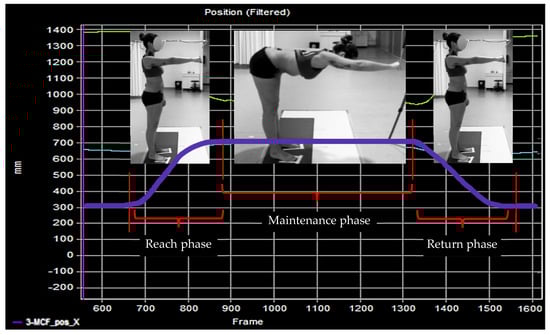
Figure 3.
Phases of the FRT are illustrated by a Qualisys plot.
The electromyographic data were analyzed using AcqKnowledge® (Version 3.9.0), Python (Version 3.12.4), and Microsoft Excel. The sEMG signal was submitted to a bandpass 2nd order Butterworth digital filter of 20–450 Hz to remove electrical noise and electrode movement. If the signal exhibited cardiac activity, the digital filters applied were 50–450 Hz. Thereafter, the root mean square (RMS) was calculated with a sliding window of 100 samples [24,44,49]. The mean of the three maximum peaks of the voluntary isometric contraction was used as a reference to normalize the test values as described in Table 2. A five-second isometric contraction was performed for each with a one-minute rest period between each repetition [35,50].
To automate data processing, a script was developed to apply the filtering and the RMS to all the electromyographic data. In the pilot study, the data extracted from the script were compared with the data analyzed using AcqKnowledge to verify the accuracy of the extraction process and ensure that the system functioned correctly. This comparison was conducted to confirm the consistency of the extracted data with the manual analysis performed in AcqKnowledge.
For each extracted file, Visual Basic for Applications (VBA) in Microsoft Excel was used to automatically calculate various metrics related to the FRT.
The means of the amplitude range for each angular segment, 3-MCF distance traveled, and the AP and ML CoP displacement were calculated with the following formula [51]:
Amplitude range = Maximum Value − Minimum Value
The mean velocity of the CoP in both AP and ML directions was calculated using the following formula [52]:
This parameter was obtained by dividing the sum of the absolute variations in the CoP displacement (ΔCoPi) at each time interval (Δti) by the total number of samples, where n represents the total number of samples collected. Finally, the mean of each muscle activity was also calculated. Then, the data for each participant were extracted for each Excel ID, and the average of the three repetitions was determined. The final Excel file contained data in degrees for the angles, centimeters (cm) for the distance from the 3-MCF, cm for the CoP AP and CoP ML displacement, centimeters per millisecond (cm/ms) for the AP and ML CoP velocity, and percentage (%) for the muscle mean activity.
Table 2.
MVIC muscle testing.
2.6. Statistical Analysis
The sample size was calculated using the statistical program G*Power v. 3.1.9.4 (FranzFaul, Universität Kiel, Kiel, Germany, accessed on 30 September 2023) to achieve a statistical power of 80%, with an effect size (f) of 0.25 (calculated based on a partial η2 = 0.06) and a statistical significance of α = 0.05 [21,58]. It was found that a sample of 28 was sufficient to detect significant differences.
For descriptive and inferential statistical analysis, the Statistical Package for the Social Sciences (SPSS®) software (Version 28.0) was used, with a significance level of 0.05 and a confidence interval of 95%. To assess the normality of data distribution, the Shapiro–Wilk test was initially applied, followed by a visual inspection of histograms. Depending on the data, violations of statistical assumptions of normality required logarithmic or inverse transformations. The presence of extreme outliers was checked, with the criterion of three standard deviations used to consider an extreme outlier. These cases were considered measurement errors or atypical exceptions and were reported as missing.
The homogeneity of variance between groups and the sphericity of covariates were determined based on Levene’s test and Mauchly’s test, respectively. The Greenhouse–Geisser correction was used when sphericity demands were not assumed.
Variables normally distributed were described as the mean ± SD, and data with deviations from normality were expressed as the median with the interquartile range.
Data that followed the assumptions of normality, homogeneity, and sphericity underwent analysis of variance (ANOVA) repeated measures to analyze the effects of breast implants on COP displacement and mean velocity, angles of spinal curvatures, and the activity levels of SCM, ESC, LS, UT, LT, LM, and Tra/IO muscles.
In variables where the repeated measures ANOVA showed statistical significance, pairwise comparisons with Bonferroni post hoc were conducted to identify specific differences between the implant conditions.
Data that did not follow the assumptions of normality and homogeneity underwent non-parametric analysis. Friedman’s test was then used to assess the significant differences between the conditions. When statistical differences were verified, the Wilcoxon paired test with Bonferroni correction was used to identify whether the pair of conditions differed.
3. Results
The mean age of the participants was 24 years old, ranging between 19 and 38 years. A total of 77.1% of the sample presented normal BMI, while 22.9% of the sample was overweight. The average PA level of the participants ranged between moderate and high. Only 11.4% presented a low PA level, 48.6% presented a moderate PA level, and 40% presented a high PA level. The average MV was 271 mL, ranging between 22.51 and 1112.12 mL. The implants of 220 mL, 315 mL, and 365 mL represented an average of 0.71 ± 0.07%, 1.01 ± 0.11%, and 1.18 ± 0.12% of the participant’s total body weight, respectively. This study included only three left-handed women. In terms of resting and dynamic scapular positions, most participants presented type IV (symmetrical scapulohumeral), followed by type II (prominent medial border) scapular positions. Descriptive statistics for sample characterization are presented in Table 3.
Table 3.
Mean, standard deviation (SD), minimum (Min) and maximum (Max) of age, MV, BMI, IPAQ, and each Body%implant. Number (N) and percentage (%) for each categorical variable as BMI, IPAQ, dominant arm, and scapular classification.
3.1. One-Minute Standing Position Test
In the one-minute standing position, no statistically significant differences in spinal angles were observed between implant conditions. The average values of the angles remained relatively constant regardless of the added implant volume (Figure 4) (see Appendix A for Table A1 contents).
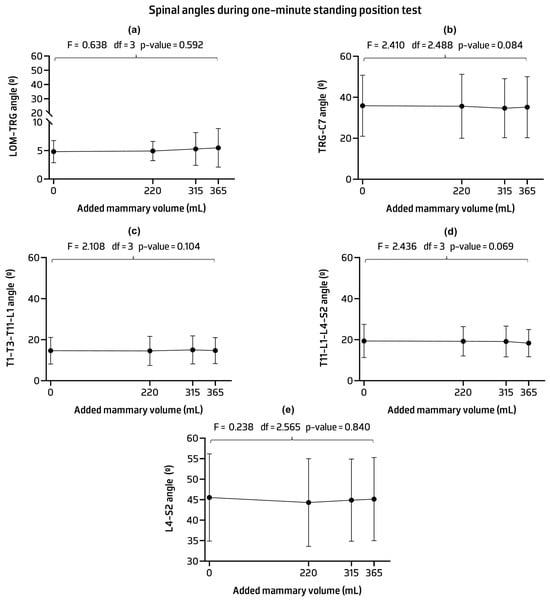
Figure 4.
Mean and standard deviation and p-values of the lateral orbital margin (LOM) and tragus of the ear (TRG) angle (a); TRG and seventh cervical process (C7) angle (b); first, third, and eleventh thoracic vertebrae (T1, T3, and T11) and the first lumbar vertebrae (L1) angle (c); L1 and four lumbar vertebrae (L1 and L4) angle (d); and L4 and second sacral vertebra (S2) angle (e) across implant conditions.
No statistically significant differences were found in the CoP measurements between implant conditions. The AP and ML CoP displacements and velocities showed mean values similar across implant volumes with most having similar standard deviations (Figure 5) (see Appendix B for Table A2 contents).
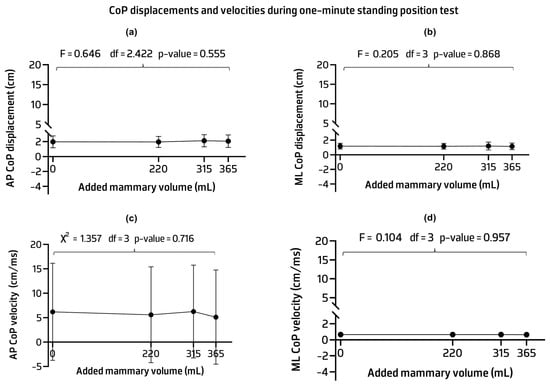
Figure 5.
Mean, standard deviation, and p-values of the anteroposterior (AP) (a) and mediolateral (ML) (b) center of pressure (CoP) displacements and ML CoP velocity (c). Median, interquartile range, and p-value of the AP CoP velocity (d) across implant conditions.
The sEMG activity results showed no statistically significant differences in the activity of the ECM, ESC, PM, UT, LT, LM, and Tra/IO muscles across implant conditions. The mean activation levels of these muscles were similar between the control and other implant volumes, even when an anterior load was added. Significant statistical differences were found in the LS activity associated with an observed power of 0.864 (F = 4.416, p-value = 0.006). Pairwise comparison analysis revealed statistical differences between the 220 mL implant condition and the control and 315 mL condition. Specifically, lower LS values were observed with the 220 mL implant compared to the two conditions. The group data generally showed a high standard deviation, especially in the LS muscle, indicating some variability between conditions within the group of adult females studied (Figure 6) (see Appendix C for Table A3 contents).
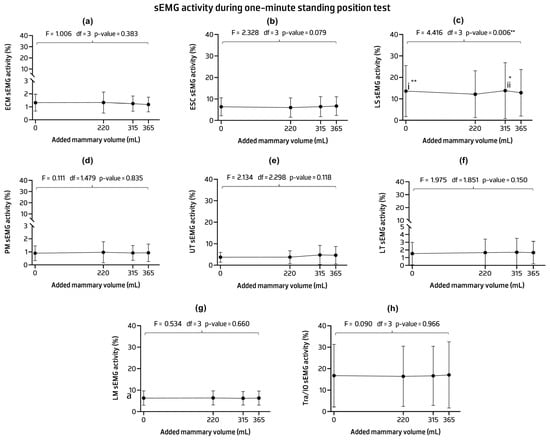
Figure 6.
Mean, standard deviation, and p-values of the sEMG activities of the sternocleidomastoid (SCM) (a), erector spinae cervicalis (ESC) (b), elevator scapulae (LS) (c), pectoralis major (PM) (d) upper trapezius (UT) (e), lower trapezius (LT) (f), lumbar multifidus (LM) (g), and transversus abdominis/internal oblique (Tra/IO) (h) muscles in the one-minute standing position. Post hoc comparisons with Bonferroni: (i) statistical differences were detected between the control and 220 mL implant condition (mean difference = 0.091; p-value = 0.003 **); (ii) between the 220 mL implant condition and 315 mL implant condition (mean difference = −0.106; p-value = 0.014 *). * p-value < 0.05, ** p-value < 0.01.
3.2. Functional Reach Performance Test
In the reach and return phases of the FRT, no statistically significant differences were observed in the spinal angles between the implant conditions. The implant conditions showed similar mean and standard deviation values compared to the control (Table 4).
Table 4.
Mean and standard deviation (SD) of vertebral column angles of the reach and return phases of the FRT. Statistics of repeated measures ANOVA between implant conditions are included.
No statistically significant differences were found in the post hoc analysis of the CoP measurements between implant conditions in the reach and return phases of the FRT. The CoP displacements and velocities showed similar mean values across implant volumes. However, a significant main effect was found in the CoP ML displacement with a power of 0.314 (Table 5).
Table 5.
Mean and standard deviation (SD) of center of pressure (CoP) displacements and velocities of the reach and return phases of the FRT. Statistics of repeated measures ANOVA between implant conditions are included.
In both phases, the sEMG activity results showed that the mean between implant conditions was not variable enough to see statistically significant differences in muscle activity of ECM, ESC, PM, LS, LM, and Tra/IO.
In the reach phase, pairwise comparisons of UT and LT mean activity levels showed statistical differences between conditions. Specifically, only the 315 mL implant condition showed statistically decreased UT activity and increased LT activity compared to the control condition. Increased LT activity was also seen when comparing the 365 mL implant condition to the control.
In the return phase, pairwise comparisons showed that the mean UT activity of the 220 mL implant had a significantly lower mean compared to the control. High within-group standard deviations were found for all muscles, especially those with significant differences (Table 6).
Table 6.
Mean and standard deviation (SD) of the muscle activity percentage of the reach and return phases of the FRT. Statistics of repeated measures ANOVA and Bonferroni post hoc comparisons between implant conditions are included.
FRT Performance
The averaged values of the participants reaching performance in each condition are presented in Figure 7. Statistically significant differences were observed between conditions (F = 4.105, p-value = 0.009). The post hoc analysis showed that the mean reach capacity was lower in all implant conditions compared to the control one (Figure 7) (see Appendix D for Table A4 contents).
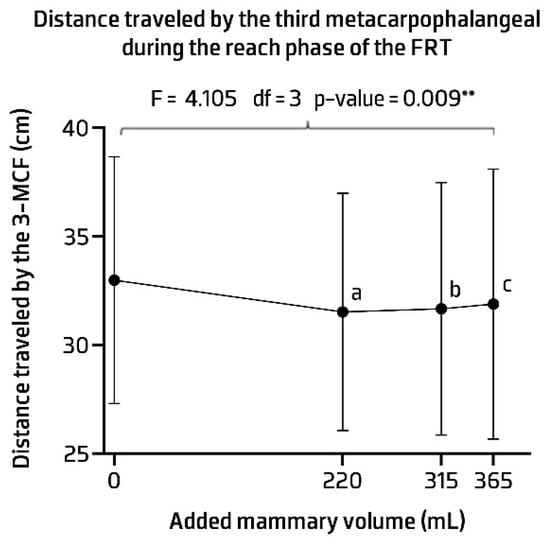
Figure 7.
Distance travelled by the third metacarpophalangeal (3-MCF) during the functional reach performance test (FRT). ** p-value < 0.01. Post hoc comparisons with Bonferroni: (a) statistical differences were detected between the control and 220 mL implant condition (mean difference = 1.457; p-value = 0.007); (b) between the control condition and 315 mL implant condition (mean difference = 1.325; p-value = 0.040); (c) between the control condition and 365 mL implant condition (mean difference = 1.104; p-value = 0.024).
3.3. Subjective Perception of Comfort, Effort, and Implant Weight
Statistically significant differences between implants were found for all three subjective perceptions, even with the Bonferroni correction applied, with a trend toward worse subjective perception with increasing implant weight. During testing, nearly all participants described the control as “very comfortable”, “effortless”, and “very light”, reporting optimal levels of comfort and minimal perceived effort and weight in the absence of an implant. With the 220 mL implant condition, the participants still considered the task “very comfortable” and “effortless”. However, the participants were more likely to describe the weight as “light” rather than “very light”. With the 315 mL implant, the participants revealed some more changes in perception. The participants considered the tasks “comfortable with “very light effort” and maintained the perception of “lightweight” as with the 220 mL implant. Finally, the 365 mL implant conditions resulted in the most pronounced differences compared to the control. The perception of comfort and effort remained consistent with the 315 mL implant conditions, reported as “comfortable” and “very light effort”. However, the 365 mL implant was considered “a little heavy”, marking a shift where the weight was no longer perceived as merely light. Table 7 shows the statistics for subjective perceptions of effort, comfort, and weight according to various implant volumes.
Table 7.
Median, interquartile range (IQR) of subjective perception of effort, comfort, and implant weight. Statistics from the Friedman test and Wilcoxon test post hoc comparisons (with Bonferroni correction) between implant conditions are included.
4. Discussion
This study evaluated a group of healthy and active young adult women with an average age of 24 years, with an average BMI of 22.78 kg/m2, most without scapular dysfunction followed by medial scapular border tilts, and 88.6% with moderate to high PA levels. The average age in this study is consistent with the 2022 global data for breast augmentation surgeries, with women between 18 and 34 years old being the most common age group seeking breast augmentation, representing 54.6% of the total, followed by women between 35 and 50 years old, representing 33.6% [17]. This study included adults between the ages of 19 and 38 years, with a limited number of participants over the age of 35 years, which may affect the generalizability of our results to the 35–50 year old age group, making the results more representative of the 18–34 year old age group. In addition, the elevated PA level and normal BMI range observed in our sample may not be entirely representative of all breast augmentation patients. It is possible that these patients may engage in different PA activities and have different BMIs than those included in this study, which could result in disparate postural and muscular adaptations to implants. This makes the sample homogeneous in terms of age, BMI, and PA levels, increasing the internal validity of our results, which provides reliable insights within this group of women. However, it also limits the generalizability of our findings to other groups of women, so future research could explore this, especially including individuals with older age and different PA levels and BMI, to understand the needs of these groups and adapt clinical approaches and postoperative recommendations regarding increased anterior volume.
In terms of MV, this study showed some variability, with a high standard deviation of 259.18 from a mean of 270.46 milliliters. The diversity of MV in this study makes it representative of the general young adult population and reflects results for a wider range of breast sizes. Future stratification of MV, with a larger sample size, may be helpful to fully understand the impact of implants in different breast sizes on women’s bodies.
Relative to the kinematic and electromyographic results, significant differences were observed, primarily in the electromyographic data, with most variations occurring in the LS, UT, and LT muscles under different implant conditions.
Spinal angles and CoP measurements did not show significant differences between implant conditions in any tests, indicating that vertebral postural orientation and postural stability remained consistent as the additional weight was imposed. This suggests that the weight was neutral and did not seem to interfere with the natural biomechanics of the spine and have a noticeable impact on stability during the additional anterior load. These results are consistent with the findings of Nicoletti et al. (2015), who concluded that spinal curvature and CoP in the standing position were only affected by implants weighing more than 400 g, with an increase in physiological lordosis and worsening stability in a short-term analysis (24 h of implant use) [20]. They concluded that weights under 400 g should be considered when choosing the implant weight, especially in patients with scoliosis or other spinal curvature affections.
In the one-minute standing position, differences between conditions were found only in the LS muscle, mainly in the 220 mL implant, which showed a lower percentage of muscle activation compared to the control and with the 315 mL condition. As expected, muscle activity was higher in the 315 mL condition than in the 220 mL condition, likely due to the increased load requiring more muscle effort to maintain stability. Unexpectedly, no significant differences were found with the 365 mL implant despite its greater volume, and the 220 mL condition showed lower LS activity than the control. These results could be influenced by high variability within the group, as indicated by substantial standard deviations across all conditions, suggesting LS individual differences among the participants that may overshadow the effects of implant volume, a factor that was not explored in this study. Another possibility is a complex muscle adaptation strategy by the LS in response to lower anterior loads. No previous studies have reported such differences, and with our results, we cannot conclusively attribute them to muscle adaptation. These findings emphasize the need for further research to better understand how different implant volumes or external loads affect muscle activity, particularly in the LS.
During the reaching phase of FRT, the 315 mL and 365 mL implant conditions showed lower sEMG activity in the LT muscle and higher sEMG activity in the UT muscle when comparing the 315 mL with the control condition. These muscles did not show a linear trend across implant conditions but only a variability of muscle activity between conditions, also with a high standard deviation. Overall, the added implants did not demonstrate a clear negative trend toward muscle imbalance compared to the control condition, as expected for functional, active, and healthy individuals. These results suggest that most participants counterbalanced for the additional weight with increased LT muscle activity for scapular stability accompanied by decreased UT muscle sEMG activity, but only in the 315 mL implant condition, representing reduced UT muscle overload. During the return phase, the percentage mean activities of the LT and UT decreased compared to the reaching phase for all conditions, as expected. Although the results across implants also showed a comparable pattern to those observed in the reaching phase, only one condition comparison was statistically significant, with the UT muscle showing a decreased percentage of sEMG muscle activity when comparing the 220 mL condition to the control.
A related research study by Kateina and Mandalidis (2022) looked at electromyographic changes in the thoracic and lumbar erector muscles as well as in the UT muscle [21]. They found that, when silicone gel implants were used to increase volume by six times in people with 200–250 mL mammary volumes, achieving volumes of 1200–1500 mL, UT sEMG activity increased during the sit-to-stand activity, a different activity that does not require the same muscle activation patterns than those in this study. This significant absolute increase in volume was beyond what the participants in the present study achieved with the 365 mL implant, which also can explain the differing results. In addition, the present study involved a group of young female volunteers who were mostly very active, which was not assessed in the study by Kateina and Mandalidis (2022) [21]. This could influence the results relative to UT and LT sEMG activity for potentially greater postural control capabilities.
Ultimately, an evaluation of the muscle activation timing would have provided a better insight into the dynamics of muscle coordination during FRT. Future studies should consider this evaluation to better understand the dynamic interactions between these muscles.
A potential factor contributing to these variable results between implant volumes could have been partly due to differences in scapular dyskinesia among the participants. Scapular dyskinesia could potentially alter muscle activation patterns, especially when additional loads are applied [59]. Most of the participants in this study had a normal to medial border scapular classification, with 18 having some type of scapular dyskinesia. It is important to note that, despite the presence of scapular dyskinesia, none of the participants reported pain related to the scapulohumeral joint, minimizing the likelihood of symptomatic confounding of the results. However, further investigation with this variable as a possible confounding variable may help to account for this heterogeneity and provide better insight into this influence on activation, as breast volume alone influences muscle activity patterns [59].
The average performance on the FRT in each condition was excellent, indicating a low risk of potential falls, as expected for a group of healthy women. However, there were some differences in performance when the control was compared with the other conditions. These differences in the group average appear to be subtle but still significant enough to affect performance. This means that, while the participants were generally stable, the added implant weights affected their ability to perform the FRT compared to the control condition.
On average, implants accounted for less than one percent of body weight across all implant conditions, which is a low percentage value. The results demonstrated that this increase in anterior weight percentage did not appear to exert an immediate influence on the overall postural control of young and active women. This percentage did not appear to be sufficient to cause significant problems with postural orientation and postural stability during daily activities, especially upper-limb activities.
Beyond these objective measurements, we also considered the participants’ subjective experiences to fully understand the impact of implants on their comfort, level of effort during tasks, and perception of weight. There was a gradual tendency for the subjective perception of comfort, effort, and weight to decrease with increasing implant weight. However, even with the 365 mL implant, the participants felt comfortable and light effort when performing the tasks, indicating good adaptability up to this implant weight. However, this subjective perception is individualized, and therefore, these results provide a general picture that may not be the same for other populations and may not show a linearly increased tendency with increasing implant weight.
Finally, although previous studies, such as Michalik et al. (2022) and McGhee et al. (2018), have identified associations between breast size and musculoskeletal dysfunction, the current study short-term analysis did not reveal significant biomechanical dysfunctions, including spinal curvature alterations, CoP velocity or displacement changes, or neuromuscular control issues in most muscles analyzed [9,19].
These findings have significant implications for clinical practice, particularly in the field of physiotherapy for postoperative reconstructive surgeries. They suggest that, in a healthy and active young female population, lower implant volumes (below 365 mL) may not have an immediate or significant impact on biomechanical or musculoskeletal parameters. Physiotherapy may not need to play an intensive role in the rehabilitation of these patients with implants below 300 mL in the case of immediate postural changes, although it remains essential to educate them about the potential need to improve postural control due to the additional weight of the implants.
These findings can also help surgeons around the world, especially in countries where the average implant volume tends to be above 300 mL, to make informed decisions about implant volume, especially in young women, to avoid any type of biomechanical dysfunction. It is important to note that these results are from a short-term analysis, and future studies are recommended to assess long-term effects and populations with varying activity levels or pre-existing musculoskeletal conditions to expand these insights.
Study Limitations
This study had a convenience sample, which increased selection bias and only evaluated immediate changes in kinematic and electromyographic variables. Therefore, the implementation of randomized samples and a prospective study with mammoplasty subjects should be considered to fully understand the long-term changes and mitigate the selection bias. A wider range of implant volumes should be considered in future research, given the new trends towards larger breasts, mainly outside of Europe. To increase external validity, future research should include larger and more diverse sample sizes, such as different age groups, body types, and those with pre-existing postural control conditions.
The Hawthorne bias is worth mentioning because of the possible change in behavior of the participants due to their awareness of being observed and the potential to perform better or differently than they would in real-life conditions. Blinding techniques can be used to reduce awareness and obtain more typical behavior.
Another possible limitation of this study was the potential influence of confounding variables in the analysis performed. The sample characterization data, such as the PA level, age, BMI, scapular dyskinesia, and MV, could have been confounding variables that biased the results. Future research should include methods to control and adjust for these confounding variables to isolate the effects of implant weights in the kinematic and electromyographic data.
It should also be noted that the present study did not address all the physical effects and symptoms of a real mammoplasty. The analysis focuses only on the effect of different implant weights on postural control. However, a comprehensive approach including surgical technique, soft tissue healing, scar adhesions, etc., must be considered when evaluating future postural control problems associated with mammoplasty.
5. Conclusions
This study found some influence of breast implants on kinematic and electromyographic variables in short-term analysis of a healthy and active female population. Specifically, variations were found considering the LS in the one-minute standing position, the UT and LT muscles in the reach phase of the FRT, and the UT muscle in the return phase of the FRT. The participants also showed differences in performance between implant conditions and a slight decrease in subjective perception of effort, comfort, and weight between implant conditions. Although these differences were observed, they did not appear substantial enough to establish a clear negative biomechanical effect.
Further research is needed, especially with a diversified sample size and over a longer period, to explore potential long-term effects and other contributing factors, such as type of surgery and scar healing.
Author Contributions
Conceptualization, D.C.G.; methodology, D.C.G., A.N. and A.S.P.S.; software, A.S.C.M., J.M. and B.C.; validation, A.S.P.S. and A.N.; formal analysis, D.C.G.; investigation, D.C.G., D.F.C., L.A.T.A., A.N. and A.S.P.S.; data curation, D.C.G.; writing—original draft preparation, D.C.G.; writing—review and editing, D.F.C., L.A.T.A., A.S.C.M., J.M., B.C., R.S., A.N. and A.S.P.S.; supervision, A.S.P.S. and A.N.; funding acquisition, R.S. and A.S.P.S.; project administration, R.S. All authors have read and agreed to the published version of the manuscript.
Funding
This research was supported by the Fundação para a Ciência e Tecnologia (FCT) through R&D Units funding [UIDB/05210/2020].
Institutional Review Board Statement
This study was conducted in accordance with the Declaration of Helsinki and approved by the Institutional Review Board Committee of the School of Health (CE0071D 15/05/2024).
Informed Consent Statement
Informed consent was obtained from all subjects involved in this study.
Data Availability Statement
Data are unavailable due to privacy.
Acknowledgments
The authors thank LineaMédica for providing the implants. DCG acknowledges the Center of Rehabilitation Research and FCT for the research grant ESS/CIR/UIDB/05210/2020/BI/2022/03.
Conflicts of Interest
The authors declare no conflicts of interest.
Appendix A. One-Minute Standing Position Test Spinal Angles Statistics
Table A1.
Mean and standard deviation (SD) of the lateral orbital margin (LOM); the tragus of the ear (TRG); the seventh cervical spine process (C7); the first, third, and eleventh thoracic vertebrae (T1, T3, and T11); the first and fourth lumbar vertebrae (L1 and L4); and the second sacral vertebra (S2) of the one-minute standing position test. Repeated measures ANOVA between implant conditions are included.
Appendix B. One-Minute Standing Position Test Center of Pressure Displacements and Velocities Statistics
Table A2.
Mean and standard deviation (SD) of anteroposterior (AP) and mediolateral (ML) center of pressure (CoP) displacements and velocity ML CoP velocity and median and interquartile range (IQR) of the AP CoP velocity of the one-minute standing position test. Statistics of repeated measures ANOVA and Friedmans test between implant conditions are included.
Appendix C. One-Minute Standing Position Test Electromyography Statistics
Table A3.
Mean and standard deviation (SD) of the sternocleidomastoid (SCM), erector spinae cervical (ESC), elevator scapulae (LS), upper trapezius (UT), lower trapezius (LT), pectoralis major (PM), lumbar multifidus (LM), and transversus abdominis/internal obliques (Tra/IO) of the one-minute standing position. Statistics of repeated measures ANOVA and Bonferroni post hoc comparisons between implant conditions are included.
Appendix D. Functional Reach Test Performance Statistics
Table A4.
Mean and standard deviation (SD) of the distance traveled by the third metacarpophalangeal (3-MCF) during the reach phase of the FRT. Statistics of repeated measures ANOVA and Bonferroni post hoc comparisons between implant conditions are included.
References
- Horak, F.B. Postural orientation and equilibrium: What do we need to know about neural control of balance to prevent falls? Age Ageing 2006, 35, ii7–ii11. [Google Scholar] [CrossRef] [PubMed]
- Shumway-Cook, A.; Woollacott, M. Motor Control: Translating Research into Clinical Practice, 5th ed.; International Edition; Wolters Kluwer: Alphen aan den Rijn, The Netherlands, 2017; ISBN 978-1-4963-0263-2. [Google Scholar]
- Thomas, S.J.; Zeni, J.A.; Winter, D.A. Winter’s Biomechanics and Motor Control of Human Movement, 5th ed.; Wiley: Hoboken, NJ, USA, 2022; ISBN 978-1-119-82702-3. [Google Scholar]
- Barbosa, A.F.; Raggi, G.C.; Dos Santos Cardoso Sá, C.; Costa, M.P.; De Lima, J.E.; Tanaka, C. Postural control in women with breast hypertrophy. Clinics 2012, 67, 757–760. [Google Scholar] [CrossRef] [PubMed]
- Schinkel-Ivy, A.; Drake, J.D.M. Breast size impacts spine motion and postural muscle activation. J. Back Musculoskelet. Rehabil. 2016, 29, 741–748. [Google Scholar] [CrossRef] [PubMed]
- Lonie, S.; Sachs, R.; Shen, A.; Hunter-Smith, D.J.; Rozen, W.M.; Seifman, M. A systematic review of patient reported outcome measures for women with macromastia who have undergone breast reduction surgery. Gland Surg. 2019, 8, 431–440. [Google Scholar] [CrossRef] [PubMed]
- Papanastasiou, C.; Ouellet, J.A.; Lessard, L. The Effects of Breast Reduction on Back Pain and Spine Measurements: A Systematic Review. Plast. Reconstr. Surg.—Glob. Open 2019, 7, e2324. [Google Scholar] [CrossRef]
- Barbosa, A.F.; Lavoura, P.H.; Boffino, C.C.; Siqueira, C.M.; Costa, M.P.; Lima Junior, J.E.; Tanaka, C. The Impact of Surgical Breast Reduction on the Postural Control of Women with Breast Hypertrophy. Aesthetic Plast. Surg. 2013, 37, 321–326. [Google Scholar] [CrossRef]
- McGhee, D.E.; Coltman, K.A.; Riddiford-Harland, D.L.; Steele, J.R. Upper torso pain and musculoskeletal structure and function in women with and without large breasts: A cross sectional study. Clin. Biomech. 2018, 51, 99–104. [Google Scholar] [CrossRef] [PubMed]
- Onuk, A.; Senen, D.; Arslan, B.; Muslu, U.; Tek, M.; Karslı, B. Effects of bilateral breast reduction on peak airway pressure and pulmonary function tests. Niger. J. Clin. Pract. 2018, 21, 949. [Google Scholar] [CrossRef] [PubMed]
- Hsieh, K.L.; Wood, T.A.; An, R.; Trinh, L.; Sosnoff, J.J. Gait and Balance Impairments in Breast Cancer Survivors: A Systematic Review and Meta-analysis of Observational Studies. Arch. Rehabil. Res. Clin. Transl. 2019, 1, 100001. [Google Scholar] [CrossRef]
- Mangone, M.; Bernetti, A.; Agostini, F.; Paoloni, M.; De Cicco, F.A.; Capobianco, S.V.; Bai, A.V.; Bonifacino, A.; Santilli, V.; Paolucci, T. Changes in Spine Alignment and Postural Balance After Breast Cancer Surgery: A Rehabilitative Point of View. BioResearch Open Access 2019, 8, 121–128. [Google Scholar] [CrossRef] [PubMed]
- Crerand, C.E.; Infield, A.L.; Sarwer, D.B. Psychological Considerations in Cosmetic Breast Augmentation. Plast. Surg. Nurs. 2007, 29, 49–57. [Google Scholar] [CrossRef]
- Nikolic, J.; Janjic, Z.; Marinkovic, M.; Petrovic, J.; Bozic, T. Psychosocial characteristics and motivational factors in woman seeking cosmetic breast augmentation surgery. Vojnosanit. Pregl. 2013, 70, 940–946. [Google Scholar] [CrossRef] [PubMed]
- Holmes, W.J.M.; Timmons, M.J.; Kauser, S. Techniques used by United Kingdom consultant plastic surgeons to select implant size for primary breast augmentation. J. Plast. Reconstr. Aesthet. Surg. 2015, 68, 1364–1369. [Google Scholar] [CrossRef]
- Heidekrueger, P.I.; Sinno, S.; Hidalgo, D.A.; Colombo, M.; Broer, P.N. Current Trends in Breast Augmentation: An International Analysis. Aesthet. Surg. J. 2018, 38, 133–148. [Google Scholar] [CrossRef]
- ISAPS. Global Survey 2022: Full Report and Press Release in English. Available online: https://www.isaps.org/discover/about-isaps/global-statistics/reports-and-press-releases/global-survey-2022-full-report-and-press-releases/ (accessed on 15 November 2023).
- Pelosi, M.A.; Pelosi, M.A. Breast Augmentation. Obstet. Gynecol. Clin. N. Am. 2010, 37, 533–546. [Google Scholar] [CrossRef] [PubMed]
- Michalik, R.; Kühlmann, B.; Wild, M.; Siebers, H.L.; Migliorini, F.; Eschweiler, J.; Betsch, M. The Effect of Breast Size on Spinal Posture. Aesthetic Plast. Surg. 2022, 48, 1331–1338. [Google Scholar] [CrossRef] [PubMed]
- Nicoletti, G.; Mandrini, S.; Finotti, V.; Dall’Angelo, A.; Malovini, A.; Chierico, S.; Faga, A.; Dalla Toffola, E. Objective Clinical Assessment of Posture Patterns after Implant Breast Augmentation. Plast. Reconstr. Surg. 2015, 136, 162e–170e. [Google Scholar] [CrossRef] [PubMed]
- Kateina, C.; Mandalidis, D. Effects of Artificially Induced Breast Augmentation on the Electromyographic Activity of Neck and Trunk Muscles during Common Daily Movements. J. Funct. Morphol. Kinesiol. 2022, 7, 80. [Google Scholar] [CrossRef] [PubMed]
- Cruz, N.I. Breast Asymmetry in Women Requesting Plastic Surgery of the Breast. P. R. Health Sci. J. 2018, 37, 230–238. [Google Scholar] [CrossRef]
- Saldanha, I.J.; Cao, W.; Broyles, J.M.; Adam, G.P.; Bhuma, M.R.; Mehta, S.; Dominici, L.S.; Pusic, A.L.; Balk, E.M. Breast Reconstruction After Mastectomy: A Systematic Review and Meta-Analysis. Agency for Healthcare Research and Quality (AHRQ). July 2021. Available online: https://effectivehealthcare.ahrq.gov/products/breast-reconstruction-mastectomy/research (accessed on 15 November 2023).
- Melo, A.S.C.; Taylor, J.L.; Ferreira, R.; Cunha, B.; Ascenção, M.; Fernandes, M.; Sousa, V.; Cruz, E.B.; Vilas-Boas, J.P.; Sousa, A.S.P. Differences in Trapezius Muscle H-Reflex between Asymptomatic Subjects and Symptomatic Shoulder Pain Subjects. Sensors 2023, 23, 4217. [Google Scholar] [CrossRef] [PubMed]
- Jan, A.; Connor, B. Weif BMI Classification Percentile And Cut Off Points. Available online: https://www.ncbi.nlm.nih.gov/books/NBK541070/ (accessed on 18 December 2024).
- Qiao, Q.; Zhou, G.; Ling, Y. Breast Volume Measurement in Young Chinese Women and Clinical Applications. Aesthetic Plast. Surg. 1997, 21, 362–368. [Google Scholar] [CrossRef] [PubMed]
- Craig, C.L.; Marshall, A.L.; Sjöström, M.; Bauman, A.E.; Booth, M.L.; Ainsworth, B.E.; Pratt, M.; Ekelund, U.; Yngve, A.; Sallis, J.F.; et al. International Physical Activity Questionnaire: 12-Country Reliability and Validity. Med. Sci. Sports Exerc. 2003, 35, 1381–1395. [Google Scholar] [CrossRef] [PubMed]
- Meh, K.; Jurak, G.; Sorić, M.; Rocha, P.; Sember, V. Validity and Reliability of IPAQ-SF and GPAQ for Assessing Sedentary Behaviour in Adults in the European Union: A Systematic Review and Meta-Analysis. Int. J. Environ. Res. Public Health 2021, 18, 4602. [Google Scholar] [CrossRef]
- Fan, M.; Lyu, J.; He, P. Guidelines for data processing and analysis of the International Physical Activity Questionnaire (IPAQ). Zhonghua Liuxingbingxue Zazhi 2014, 35, 961–964. [Google Scholar]
- Kibler, W.B.; Uhl, T.L.; Maddux, J.W.Q.; Brooks, P.V.; Zeller, B.; McMullen, J. Qualitative clinical evaluation of scapular dysfunction: A reliability study. J. Shoulder Elbow Surg. 2002, 11, 550–556. [Google Scholar] [CrossRef] [PubMed]
- Cacciatore, T.W.; Gurfinkel, V.S.; Horak, F.B.; Day, B.L. Prolonged weight-shift and altered spinal coordination during sit-to-stand in practitioners of the Alexander Technique. Gait Posture 2011, 34, 496–501. [Google Scholar] [CrossRef]
- Guan, X.; Fan, G.; Wu, X.; Zeng, Y.; Su, H.; Gu, G.; Zhou, Q.; Gu, X.; Zhang, H.; He, S. Photographic measurement of head and cervical posture when viewing mobile phone: A pilot study. Eur. Spine J. 2015, 24, 2892–2898. [Google Scholar] [CrossRef] [PubMed]
- Muyor, J.M.; Antequera-Vique, J.A.; Oliva-Lozano, J.M.; Arrabal-Campos, F.M. Evaluation of Dynamic Spinal Morphology and Core Muscle Activation in Cyclists—A Comparison between Standing Posture and on the Bicycle. Sensors 2022, 22, 9346. [Google Scholar] [CrossRef] [PubMed]
- Lascurain-Aguirrebeña, I.; Newham, D.J.; Irazusta, J.; Seco, J.; Critchley, D.J. Reliability of a Method to Measure Neck Surface Electromyography, Kinematics, and Pain Occurrence in Participants With Neck Pain. J. Manipulative Physiol. Ther. 2018, 41, 413–424. [Google Scholar] [CrossRef]
- Sommerich, C.M.; Joines, S.M.B.; Hermans, V.; Moon, S.D. Use of surface electromyography to estimate neck muscle activity. J. Electromyogr. Kinesiol. 2000, 10, 377–398. [Google Scholar] [CrossRef]
- Alizadeh, M.; Knapik, G.G.; Marras, W.S. Application of MR-derived cross-sectional guideline of cervical spine muscles to validate neck surface electromyography placement. J. Electromyogr. Kinesiol. 2018, 43, 127–139. [Google Scholar] [CrossRef] [PubMed]
- Hermens, H.J.; Freriks, B.; Disselhorst-Klug, C.; Rau, G. Development of recommendations for SEMG sensors and sensor placement procedures. J. Electromyogr. Kinesiol. 2000, 10, 361–374. [Google Scholar] [CrossRef] [PubMed]
- Cools, A.M.; Witvrouw, E.E.; Declercq, G.A.; Danneels, L.A.; Cambier, D.C. Scapular Muscle Recruitment Patterns: Trapezius Muscle Latency with and without Impingement Symptoms. Am. J. Sports Med. 2003, 31, 542–549. [Google Scholar] [CrossRef] [PubMed]
- Trebs, A.A.; Brandenburg, J.P.; Pitney, W.A. An Electromyography Analysis of 3 Muscles Surrounding the Shoulder Joint During the Performance of a Chest Press Exercise at Several Angles. J. Strength Cond. Res. 2010, 24, 1925–1930. [Google Scholar] [CrossRef] [PubMed]
- SENIAM. Available online: http://www.seniam.org/ (accessed on 12 December 2023).
- Marshall, P.; Murphy, B. The validity and reliability of surface EMG to assess the neuromuscular response of the abdominal muscles to rapid limb movement. J. Electromyogr. Kinesiol. 2003, 13, 477–489. [Google Scholar] [CrossRef] [PubMed]
- Qualysis. Qualysis Track Manager—User Manual; Qualisys: Gothenburg, Sweden, 2011. [Google Scholar]
- Delsys. How Does One Prepare the Skin Prior to Recording with Delsys EMG Sensors? Available online: https://delsys.com/faq-items/how-does-one-prepare-the-skin-prior-to-recording-with-delsys-emg-sensors/ (accessed on 10 May 2024).
- Konrad, P. The ABC of EMG. A Practical Introduction to Kinesiological Electromyography. 2005, Volume 1. Available online: https://www.researchgate.net/publication/270895853 (accessed on 10 May 2024).
- Delsys. How to Improve EMG Signal Quality. Available online: https://delsys.com/emgworks/signal-quality-monitor/improve/ (accessed on 2 January 2024).
- Duncan, P.W.; Weiner, D.K.; Chandler, J.; Studenski, S. Functional Reach: A New Clinical Measure of Balance. J. Gerontol. 1990, 45, M192–M197. [Google Scholar] [CrossRef] [PubMed]
- Nadeau, S.; McFadyen, B.J.; Malouin, F. Frontal and sagittal plane analyses of the stair climbing task in healthy adults aged over 40 years: What are the challenges compared to level walking? Clin. Biomech. 2003, 18, 950–959. [Google Scholar] [CrossRef]
- Couto, A.; Vaz, M.; Pinho, L.; Félix, J.; Moreira, J.; Pinho, F.; Mesquita, I.; Montes, A.; Crasto, C.; Sousa, A. Repeatability and Temporal Consistency of Lower Limb Biomechanical Variables Expressing Interlimb Coordination during the Double-Support Phase in People with and without Stroke Sequelae. Sensors 2023, 23, 2526. [Google Scholar] [CrossRef]
- Sousa, A.S.P.; Macedo, R.; Santos, R.; Sousa, F.; Silva, A.; Tavares, J.M.R.S. Influence of prolonged wearing of unstable shoes on upright standing postural control. Hum. Mov. Sci. 2016, 45, 142–153. [Google Scholar] [CrossRef]
- Sousa, A.S.P. Surface Electromyographic Amplitude Normalization Methods: A Review. 2012. Available online: https://repositorio-aberto.up.pt/handle/10216/64430 (accessed on 10 May 2024).
- Duarte, M.; Freitas, S.M.S.F. Revisão sobre posturografia baseada em plataforma de força para avaliação do equilíbrio. Rev. Bras. Fisioter. 2010, 14, 183–192. [Google Scholar] [CrossRef]
- Quijoux, F.; Nicolaï, A.; Chairi, I.; Bargiotas, I.; Ricard, D.; Yelnik, A.; Oudre, L.; Bertin-Hugault, F.; Vidal, P.; Vayatis, N.; et al. A review of center of pressure (COP) variables to quantify standing balance in elderly people: Algorithms and open-access code. Physiol. Rep. 2021, 9, e15067. [Google Scholar] [CrossRef]
- Tsang, S.M.; Chan, K.T.; Ho, P.L.; Kwok, J.C.; Tse, D.H.; Tsoi, H.H. Comparison between velocity-specific exercise and isometric exercise on neck muscle functions and performance: A randomised clinical trial. BMC Musculoskelet. Disord. 2021, 22, 81. [Google Scholar] [CrossRef] [PubMed]
- Castelein, B.; Cagnie, B.; Parlevliet, T.; Danneels, L.; Cools, A. Optimal Normalization Tests for Muscle Activation of the Levator Scapulae, Pectoralis Minor, and Rhomboid Major: An Electromyography Study Using Maximum Voluntary Isometric Contractions. Arch. Phys. Med. Rehabil. 2015, 96, 1820–1827. [Google Scholar] [CrossRef] [PubMed]
- Lauver, J.D.; Cayot, T.E.; Scheuermann, B.W. Influence of bench angle on upper extremity muscular activation during bench press exercise. Eur. J. Sport Sci. 2016, 16, 309–316. [Google Scholar] [CrossRef]
- Okubo, Y.; Kaneoka, K.; Imai, A.; Shiina, I.; Tatsumura, M.; Izumi, S.; Miyakawa, S. Electromyographic Analysis of Transversus Abdominis and Lumbar Multifidus Using Wire Electrodes During Lumbar Stabilization Exercises. J. Orthop. Sports Phys. Ther. 2010, 40, 743–750. [Google Scholar] [CrossRef] [PubMed]
- Oliva-Lozano, J.M.; Muyor, J.M. Core Muscle Activity during Physical Fitness Exercises: A Systematic Review. Int. J. Environ. Res. Public Health 2020, 17, 4306. [Google Scholar] [CrossRef] [PubMed]
- Kang, H. Sample size determination and power analysis using the G*Power software. J. Educ. Eval. Health Prof. 2021, 18, 17. [Google Scholar] [CrossRef] [PubMed]
- Jildeh, T.R.; Ference, D.A.; Abbas, M.J.; Jiang, E.X.; Okoroha, K.R. Scapulothoracic Dyskinesis: A Concept Review. Curr. Rev. Musculoskelet. Med. 2021, 14, 246–254. [Google Scholar] [CrossRef]


Disclaimer/Publisher’s Note: The statements, opinions and data contained in all publications are solely those of the individual author(s) and contributor(s) and not of MDPI and/or the editor(s). MDPI and/or the editor(s) disclaim responsibility for any injury to people or property resulting from any ideas, methods, instructions or products referred to in the content. |
© 2025 by the authors. Licensee MDPI, Basel, Switzerland. This article is an open access article distributed under the terms and conditions of the Creative Commons Attribution (CC BY) license (https://creativecommons.org/licenses/by/4.0/).