Abstract
This study introduces a non-destructive computer vision method for estimating postharvest quality parameters of oranges, including maturity index, soluble solid content (expressed in degrees Brix), and firmness. A novel image-based descriptor, termed Citrus Color Index—Gray Level Co-occurrence Matrix Texture Features (CCI–GLCM-TF), was developed by integrating the Citrus Color Index (CCI) with texture features derived from the Gray Level Co-occurrence Matrix (GLCM). By combining contrast, correlation, energy, and homogeneity across multiscale regions of interest and applying geometric calibration to correct image acquisition distortions, the descriptor effectively captures both chromatic and structural information from RGB images. These features served as input to an Adaptive Neuro-Fuzzy Inference System (ANFIS), selected for its ability to model nonlinear relationships and gradual transitions in citrus ripening. The proposed ANFIS models achieved R-squared values greater than or equal to 0.81 and root mean square error values less than or equal to 1.1 across all quality parameters, confirming their predictive robustness. Notably, representative models (ANFIS 2, 4, 6, and 8) demonstrated superior performance, supporting the extension of this approach to full-surface exploration of citrus fruits. The results outperform methods relying solely on color features, underscoring the importance of combining spectral and textural descriptors. This work highlights the potential of the CCI–GLCM-TF descriptor, in conjunction with ANFIS, for accurate, real-time, and non-invasive assessment of citrus quality, with practical implications for automated classification, postharvest process optimization, and cost reduction in the citrus industry.
1. Introduction
The agri-food industry has been increasingly challenged to adopt new strategies to assess fruit quality [1,2,3,4,5]. Traditionally, both producers and consumers have considered quality as an indicator of maturity [6,7], relying on sensory attributes such as shape, color, appearance, odor, taste, sound, texture, temperature, and firmness [6,8]. The ripening process is influenced by physiological, biochemical, molecular, sensory, and mechanical changes, as well as by climate and production conditions [9,10]. Among the wide variety of fruits worldwide, oranges stand out as one of the most relevant in the food industry due to their nutritional value, providing essential vitamins (A, C, and E), minerals, and dietary fiber [11,12]. In addition, its versatility in processed products such as jams, juices, and fermented products further highlights its economic and nutritional importance [13,14,15,16,17]. According to the FAO, global orange production in 2023 covered approximately 3,413,880 hectares, producing around 70 million tons [18].
Traditionally, orange quality assessment has been performed using analytical instruments such as HPLC, spectrophotometers, refractometers, and penetrometers, recognized for their precision, resolution, and versatility [19,20,21,22,23,24]. However, these methods often involve drawbacks such as high costs, complex operation, and sample destruction, limiting their applicability in rapid or large-scale analyses. In contrast, non-invasive methods, particularly those based on computer vision (CV), have emerged as promising alternatives [25,26]. CV systems offer advantages such as speed, low cost, and reproducibility, enabling the assessment of external attributes such as color, size, and shape, as well as internal qualities such as vitamin content, acidity, and soluble solids [4,27,28,29,30].
CV systems emulate human vision using cameras to extract spatial and spectral features from images [31]. Within these systems, color spaces play a key role in modeling fruit appearance and in classification tasks. These include hardware-oriented spaces (RGB), human perception-oriented spaces (HSV and HSI), and instrument-oriented spaces (CIE Lab*) [32]. The RGB model is widely used in various fruits, achieving classification accuracies between 73.33% and 100%, using classifiers such as Support Vector Machine (SVM), K-Nearest Neighbor (KNN), and Artificial Neural Network (ANN) [33]. HSV and HSI spaces have shown good performance in apples, tomatoes, and golden berries, with reported accuracies between 90.08% and 95.7%, mainly employing ANN, SVM, and KNN [34,35,36,37,38]. The CIE Lab* model, used for its perceptual uniformity, has shown high effectiveness in mango, banana, and persimmon classification, with accuracies above 93% [37,38].
In citrus analysis, the Citrus Color Index (CCI) = has been widely adopted due to its sensitivity to changes in peel pigmentation, maturity, and degreening [39,40,41,42,43,44]. The CCI has been associated with physicochemical parameters such as Brix, acidity, firmness, and vitamin content [45]. However, relying solely on color may overlook relevant structural patterns on the fruit surface.
One of the main challenges in CV is improving image quality and removing noise or irrelevant information. Algorithms focused on enhancing perceptual visibility and suppressing artifacts have significantly increased the reliability of texture-based descriptors. He et al. [46] proposed the Dark Channel Prior (DCP), enabling transmission estimation from a single image and recovering color and edges with soft matting refinement. Park et al. [47] introduced an entropy–fidelity objective function, achieving colorfulness = 38.2, GCF = 14.6, edge visibility rate , gradient ratio , and saturation . Zhang et al. [48] used self-supervised GANs, reaching PSNR = 27.4 dB and SSIM = 0.91. Liu et al. [49] developed the VNDHR model, obtaining PSNR = 28.6 dB, SSIM = 0.93, and NIQE = 3.12 under nighttime conditions.
To overcome the limitation of relying solely on color, texture analysis based on the Gray-Level Co-occurrence Matrix (GLCM) has gained interest. This technique calculates statistical descriptors such as contrast, correlation, energy, and homogeneity, capturing microstructural variations related to ripening, freshness, and deterioration [50,51]. Recent studies have used GLCM features for classification, quality prediction, and even training convolutional neural networks, achieving accuracy above 85% [33,52,53,54,55]. Despite these advances, most existing approaches process the color and texture features independently [33,50], which can limit the interpretability and predictive power.
Therefore, this study proposes a novel and integrative descriptor: Citrus Color Index—Gray Level Co-occurrence Matrix Texture Features (CCI–GLCM-TF), which fuses the CCI with four GLCM-derived statistical measures (contrast, correlation, energy, and homogeneity) [45,52]. By leveraging recent image enhancement techniques such as VNDHR and perceptual optimization [47,49], this integration allows color to focus on significant chromatic changes and texture to analyze relevant microstructural patterns, improving interpretability and increasing predictive capability compared to models that use only color or texture.
The ANFIS system combines the benefits of artificial neural networks and fuzzy logic, enabling nonlinear modeling and gradual interpretation of orange ripening processes [56,57,58,59]. It achieves optimized prediction of organoleptic variables with coefficients of determination [60], overcoming the data dependency of traditional machine learning models and the limited interpretability of CNN-based architectures.
Based on this development, a computer vision system and an ANFIS model were implemented to non-invasively estimate key internal parameters: maturity index, Brix, and firmness. This integrated approach aims to improve the accuracy, practicality, and scalability of citrus quality assessment for industrial applications. The research question guiding this study is as follows: Can the prediction of Brix content and firmness be improved using a CCI–GLCM-TF descriptor in an ANFIS-based model?
1.1. Motivations
- Current citrus quality assessments still rely mainly on destructive methods (HPLC, refractometry, and penetrometry), which are accurate but time-consuming, costly, and unsuitable for large-scale applications.
- The Citrus Color Index (CCI) has been widely used to monitor ripening, but since it only captures chromatic information, it ignores important structural attributes of the fruit surface.
- Texture features derived from the Gray Level Co-occurrence Matrix (GLCM) have been applied in fruit quality studies, but usually as standalone descriptors, limiting their predictive power.
- To date, there is no integrative descriptor that combines chromatic (CCI) and textural (GLCM) features for estimating internal quality parameters such as soluble solids content (°Brix) and firmness in citrus.
- There is a strong need for non-destructive, low-cost, and real-time methods to optimize postharvest handling and support decision-making in the citrus industry.
1.2. Contributions
- We introduce a novel hybrid descriptor: Citrus Color Index—GLCM Texture Features (CCI–GLCM-TF), which fuses color (CCI) with texture metrics (contrast, correlation, energy, and homogeneity).
- A multiscale approach is implemented (ROIs of 3 × 3, 5 × 5, 11 × 11, and 21 × 21 pixels) to capture surface variations at different resolutions.
- An Adaptive Neuro-Fuzzy Inference System (ANFIS) is employed to model nonlinear relationships and gradual transitions in citrus ripening, predicting maturity index, °Brix, and firmness.
- The proposed ANFIS models achieved and RMSE across all parameters, outperforming approaches based only on color or texture.
- The discriminative capacity of the descriptor was statistically validated, showing significant differences between maturity classes ().
- This study demonstrates the feasibility of implementing the approach in low-cost vision systems (e.g., webcams), enabling automatic classification, process optimization, and postharvest loss reduction.
2. Materials and Methods
2.1. Samples
The samples were acquired and analyzed during May and June 2024. A total of 75 Navel variety orange fruits were purchased in the morning from a small establishment at the Mercado Hidalgo in Irapuato, Guanajuato, Mexico. The name of the producer is unknown, as the fruits were commercialized by a small-scale vendor. Due to this, it was not possible to identify the batch, the prediction method used prior to sale, or the storage conditions before acquisition. As the fruits were sold in bulk, no batch number or exact acquisition date could be recorded. A limitation of this study is the pre-purchase storage conditions could not be controlled or verified. However, immediately after acquisition, the fruits were analyzed under stable ambient conditions to minimize the influence of external variations.
The fruits were classified into four visual maturity stages, as shown in Figure 1. Classification followed an adaptation of the USDA maturity guidelines and the methodology described by Jiménez-Cuesta et al. [40], based on peel color evolution during ripening: Class 1 corresponds to fruits with predominantly green skin; Class 2 to fruits transitioning from green to yellow; Class 3 to fruits mostly orange with residual green areas; and Class 4 to fully orange or dark orange fruits. Regarding morphology, the fruits were round to slightly oval, with medium-thick peel and a smooth to finely rough surface. Only fruits with uniform size, regular shape, and no visible external defects were selected to ensure homogeneity in the evaluations. Visual classification was performed by experts under controlled lighting and cross-validated with instrumental measurements, including the (CCI), soluble solid content (degree Brix), and firmness.
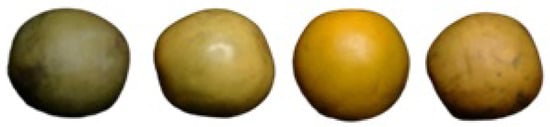
Figure 1.
Levels of maturity employed for classification of samples.
Firmness measurements were performed using a handheld GY3 penetrometer (DAHECINST, Valencia, Spain) with an 8 mm tip, a measuring capacity of 0.5 to 12 kg/cm2, a resolution of 0.1 kg/cm2, and an accuracy of ±2%. Although this device is mainly designed for field evaluations, it was employed under controlled laboratory conditions to ensure measurement repeatability. Each fruit was measured in triplicate, and the average value was used for analysis.
To determine the soluble solid content degree Brix, a 10 mL juice aliquot was extracted from each fruit using a Black & Decker citrus juicer (model CJ650; Black & Decker, Apodaca, Nuevo León, Mexico). The juice was analyzed using a Deosdum digital refractometer (model t1cq6gki47; Deosdum, Heze City, Shandong Province, China) with a measurement range of 0 to 55%. Degree Brix values were also obtained in triplicate, and the average of the three measurements was used for further analysis.
2.2. General Structure of the Computer Vision System
Figure 2 shows that the computer vision system comprises eight stages. The first stage is image acquisition, performed using the computer vision system (CVS) and MATLAB 2024 software. Images were captured with a Logitech webcam with a 3 MP resolution and a frame rate of 30 fps, under controlled lighting conditions to minimize specular reflections and ensure chromatic consistency across samples. The second stage involves geometric camera correction, during which the intrinsic parameters (focal lengths, principal point, and distortion coefficients) and extrinsic parameters were estimated using a checkerboard calibration pattern and subsequently integrated into the CVS to correct lens distortion and perspective artifacts.
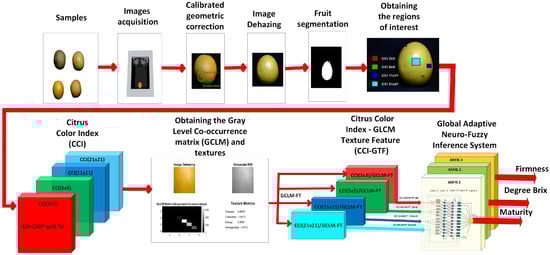
Figure 2.
The proposed method used a computer vision system to determine the ripeness, degree Brix, and firmness of the orange.
The third stage consists of image dehazing, which removes atmospheric distortion and enhances perceptual visibility, recovering chromatic and structural details relevant for analysis. The fourth stage corresponds to fruit segmentation, eliminating the background and objects smaller than 20,000 pixels using morphological filtering and connected component analysis.
The fifth stage consists of extracting the region of interest (ROI) of 31 × 31 pixels using the centroid of the fruit as a reference. This ROI serves as a localized window for chromatic and structural analysis. The sixth stage corresponds to the calculation of the Gray-Level Co-occurrence Matrix (GLCM) on the 21 × 21 ROI and the extraction of texture features such as contrast, correlation, energy, and homogeneity. The seventh stage involves obtaining the combined Citrus Color Index–GLCM–Texture Features descriptor (CCI–GLCM–TF), which integrates the CCI values computed from four subregions (3 × 3, 5 × 5, 11 × 11, and 21 × 21 pixels) with the texture features extracted from the 21 × 21 ROI. This integration enables simultaneous representation of multiscale chromatic variability and localized structural patterns, providing a robust and interpretable descriptor for citrus quality prediction.
Finally, the eighth stage includes the design of the Global Adaptive Neuro-Fuzzy Inference System, which consists of three ANFIS models trained with the combined descriptors (CCI–GLCM–TF) to predict maturity, Brix degrees, and firmness. This approach enables nonlinear mapping of quality variables and rule-based fuzzy interpretation, providing an adaptive and interpretable solution for citrus evaluation.
2.3. Image Acquisition
Figure 3 shows the image acquisition setup used for sample analysis. A total of 75 images were captured, 80% of which were used for training and the remaining 20% for validation and testing. The images were stored in JPG format with a resolution of 480 × 640 × 3 pixels.
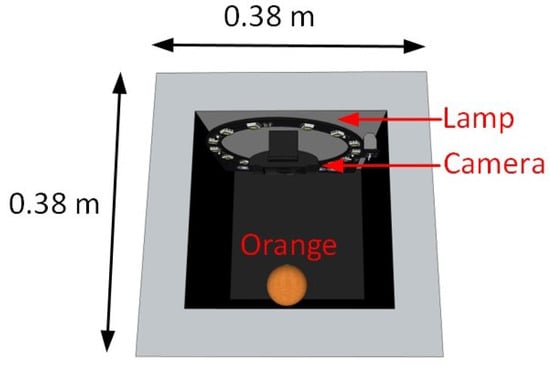
Figure 3.
Image acquisition setup.
The acquisition process was carried out in the morning to ensure consistency in the sample conditions. All measurements were performed in triplicate, and the average value was used for analysis. The image acquisition was performed from a single viewpoint, following the methodology proposed by Castro et al. [61]. This approach simplifies the capture process and reduces data processing time when evaluating multiple classification models using different machine learning techniques and color spaces. However, it is a limitation because not all variations of the fruit surface are captured; some morphological features or defects might not be detected, which could affect the generalization of the models. In future work, a multi-view acquisition could be implemented to improve data representativeness.
The image acquisition system consisted of four main subsystems:
- Isolation subsystem: A matte black chassis with internal dimensions of 38 cm × 38 cm × 43 cm was used to minimize external lighting disturbances.
- Lighting subsystem: A circular LED ring with a diameter of 30 cm and a power of 5.4 watts was placed 30 cm above the sample. This configuration provided uniform and diffuse illumination with an intensity of approximately 200 lux.
- Image capture subsystem: Images were captured using a Logitech C920 webcam (Logitech, Lausanne, Switzerland) with a resolution of 3 megapixels. The camera was mounted vertically and aligned to maintain a fixed distance of 30 cm from the fruit surface at an angle of 28.8°.
- Processing subsystem: The captured images were processed using an Acer Nitro AN515 laptop (Acer, Mexico City, Mexico) (Model: LAPTOP-5QVVUEQC), equipped with an Intel Core i5-11400H processor, 16 GB of RAM, and an NVIDIA GeForce RTX 3050 GPU.
2.4. Camera Geometric Calibration
A geometric camera calibration procedure was performed using five images of a 10 × 10 chessboard pattern with a physical cell size of 10 mm, captured from different viewing angles to ensure perspective variability. The calibration was carried out using the MATLAB Camera Calibrator tool, included in MATLAB R2020a (MathWorks, Natick, MA, USA), was used to perform the camera calibration process. The software is available at: https://www.mathworks.com (accessed on 23 September 2025).which estimated intrinsic parameters (camera matrix, focal lengths and , principal point and , and radial distortion coefficients and ) as well as extrinsic parameters (rotation and translation vectors for each image). Tangential distortion and skew factors were not considered.
The parameters obtained included focal lengths and radial distortion coefficients and . The calibrated model was validated through three automatically generated figures. Figure 4 shows the Mean Reprojection Error per Image, reporting an overall mean error of 0.15 pixels. Figure 5 presents the Extrinsic Parameters Visualization, illustrating the spatial position of the pattern with respect to the camera system. Figure 6 displays the Undistorted Image with Geometric Center, where the original center is marked in red and the corrected center in green.
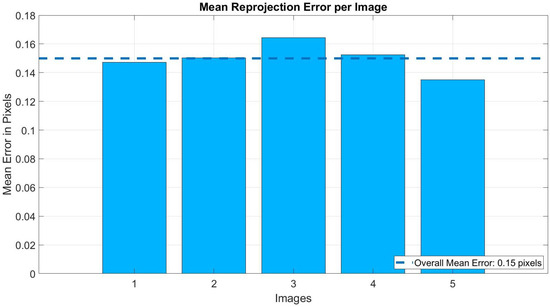
Figure 4.
Mean reprojection error per image (overall mean error: 0.15 pixels).
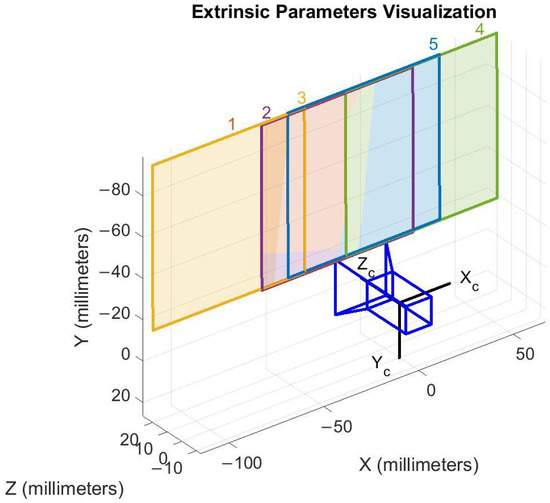
Figure 5.
Extrinsic parameter visualization. Each color in the figure represents a distinct pose of the calibration pattern, corresponding to five different positions of the chessboard used during the calibration process.
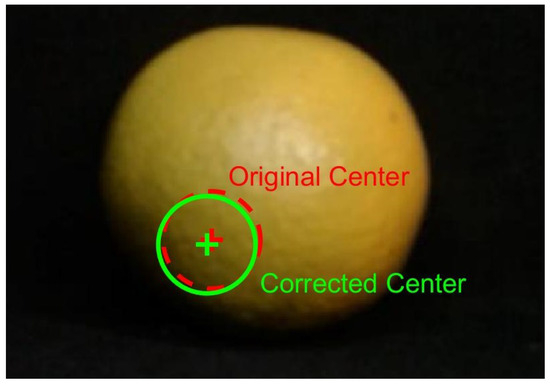
Figure 6.
Undistorted image with a geometric center. The original center is marked in red, and the corrected center in green.
These parameters were subsequently used to apply geometric correction to the sample images before descriptor computation.
3. Evaluation of Dehazing Methods
The presence of haze, fog, or unfavorable lighting conditions can significantly degrade the visual quality of agricultural images. This deterioration directly affects segmentation, edge detection, and extraction of chromatic and textural features, which are essential for quantitative analysis. To address this issue, five dehazing methods were evaluated, including deep learning–based approaches and classical techniques grounded in physical and statistical principles.
3.1. Characteristics of the Evaluated Methods
- FFA-Net (Feature Fusion Attention Network) [49]: A convolutional neural network with hierarchical attention. Its architecture includes three FAAttentionLayer blocks interleaved with convolutional layers and ReLU activations. The output is normalized using a tanh layer and rescaled to the range [0, 1]. This method is designed to preserve fine details through spatial attention mechanisms.
- VNDHR (Variational Nighttime Dehazing with Hybrid Regularization) [49]: A classical method that applies Gaussian smoothing (imgaussfilt) to obtain a smooth component S, extracts the detail , limits it to the range , and enhances it with bilateral filtering (imbilatfilt). The corrected image is reconstructed as and normalized with mat2gray. This method is effective for reducing noise without losing local contrast.
- GASSDN (Generative Adversarial Self-Supervised Dehazing Network) [48]: A simplified GAN-based self-supervised approach. A Gaussian smoothing() is applied, the residue is computed as , and the corrected image is reconstructed as , followed by normalization. It balances smoothness and edge preservation.
- ZID (Zero-Input Dehazing based on Dark Channel Prior) [49]: A classical method derived from the Dark Channel Prior proposed by He, Sun, and Tang. In this implementation, adaptive histogram equalization (adapthisteq) is applied independently on each RGB channel. Although simpler, it effectively improves contrast and saturation while preserving global structure.
- IMRH (Iterative Multiresolution Histogram-based Dehazing) [46]: Implemented in MATLAB, it estimates atmospheric light through quad-tree subdivision after white balance. The optimal transmission is computed by maximizing an entropy- and fidelity-based objective function, refined using Weighted Least Squares (WLS) filtering. It enhances contrast while maintaining chromatic fidelity, suitable for agricultural analysis.
Each image was processed individually and saved in JPG format for subsequent analysis. Table 1 illustrates a representative visual comparison of the evaluated methods.

Table 1.
Visual comparison of dehazing methods applied to a citrus image.
3.2. Comparative Performance Analysis of Samples
Five quantitative metrics were computed to evaluate the performance of each method: visibility e, inverted average gradient , artifacts , Structural Similarity Index (SSIM), and Peak Signal-to-Noise Ratio (PSNR). Table 2 summarizes the results.
Table 2.
Numerical comparison of dehazing methods on 75 citrus images.
The IMRH method was selected for subsequent analysis due to its balanced performance across the evaluated metrics. It provides moderate visibility enhancement () without excessive distortion, acceptable SSIM (0.6958) and PSNR (24.65), and controlled artifact levels (). These characteristics justify its choice as a representative preprocessing technique for citrus image analysis, ensuring a compromise between visual enhancement and structural stability.
3.3. Fruit Segmentation
The method used for sample segmentation was integrated into three stages, as shown in Figure 7.
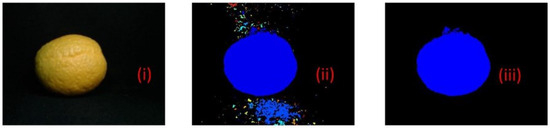
Figure 7.
The proposed method for segmenting the orange captured by the computer vision system: (i) image of the actual orange; (ii) sample binarization; and (iii) sample segmentation and noise removal for pixels smaller than 20,000.
The first stage was the sample segmentation, which was performed using the RGB color space model. The mask thresholds were for the red channel from 10 to 255 and for the green and blue channels, ranging from 0 to 255, respectively. The second stage was the binarization of the sample image and the labeling of the components with a connectivity of 8. In the third stage, the areas smaller than 20,000 pixels were eliminated, which is the background noise to extract the fruit.
3.4. Obtaining the Region of Interest and Citrus Color Index (CCI)
A generative artificial intelligence (GenAI) tool was used exclusively to visualize the image regions corresponding to the citrus color index (CCI) on the surface of the fruit. Specifically, Microsoft Copilot and ChatGPT-5 assisted in generating graphical outputs that highlighted these regions, facilitating interpretation and presentation within the manuscript.
The proposed method for obtaining the region of interest (ROI) and calculating the (CCI) consisted of three stages [40]. First, four subregions of sizes 3 × 3, 5 × 5, 11 × 11, and 21 × 21 pixels [62,63,64,65] were extracted. The 21 × 21 pixel subregion was always positioned at the centroid of the fruit to ensure a representative central measurement. In addition, multiple subregions of smaller sizes (3 × 3, 5 × 5, 11 × 11) were obtained randomly across the fruit surface, under the constraint that they did not overlap and remained fully contained within the fruit boundary. This strategy ensured a balance between systematic (central) and stochastic (random) sampling, thereby capturing both global and local color variations, as illustrated in Figure 8. The use of multiple window sizes allows for the capture of both fine local color details (small subregions) and broader spatial variations (larger subregions), which is essential for accurately characterizing peel color and assessing fruit ripeness [50,51].
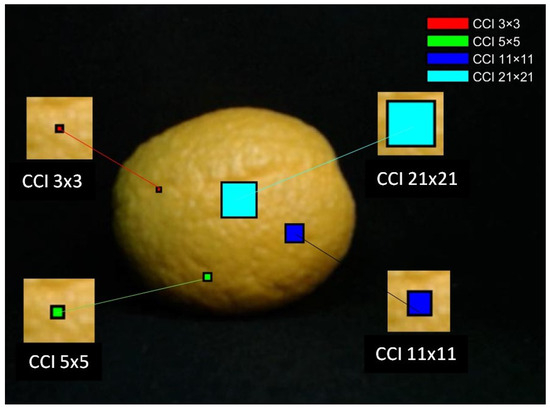
Figure 8.
Distribution of ROIs used for Citrus Color Index (CCI) estimation. The central ROI (21 × 21 pixels) was fixed at the fruit centroid, while the additional ROIs (3 × 3, 5 × 5, 11 × 11) were randomly distributed across the fruit surface, ensuring no overlap and containment within the peel area.
These subregions were then transformed from the RGB color space to the CIE-L*a*b*color model, which better reflects human color perception and facilitates index computation. The transformation was performed following the standard procedure described by Wu and Sun (2013) [28], involving a conversion from RGB to the CIEXYZ color space followed by a nonlinear transformation to obtain the components: L*, a*, and b*. This color space is widely used in food quality assessment due to its perceptual uniformity. Finally, the Citrus Color Index was calculated for each subregion using the formula , capturing color transitions from greenish to deep orange on the citrus peel [40].
The CCI values for the four subregions are presented in Table 3, showing clear differences across the four maturity classes. This multiscale and spatially distributed color representation enhances the robustness of maturity estimation models by incorporating surface heterogeneity into the descriptor.
Table 3.
Citrus Color Index (CCI) calculations for the four sub-regions of interest (ROI).
3.5. Obtaining the Gray Level Co-Cocurrence Matrix (GCLM) and Textures
After applying image pre-processing and obtaining the regions of interest, a 21 × 21 pixel subregion was selected to extract texture features. The subregion was then converted to grayscale, and texture statistics were calculated using the (GLCM) computed in the 0° horizontal direction. Four second-order texture features were extracted: Contrast, Correlation, Energy, and Homogeneity, calculated as shown in Equations (1)–(4).
In these equations:
- i and j denote the gray level values of pixel pairs in the co-occurrence matrix;
- is the normalized probability of the co-occurrence of gray levels i and j;
- and are the means of the marginal distributions of with respect to i and j;
- and are the corresponding standard deviations.
These texture features were calculated for each sample and subsequently used in the data analysis, as described in the Results section.
Table 4 presents the average texture values obtained from the Gray Level Co-occurrence Matrix (GLCM) for the four maturity levels of the orange samples. Regarding contrast, Class 2 (0.1236) shows the highest variation in pixel intensity, suggesting a more heterogeneous surface texture, while Class 4 (0.0929) exhibits the lowest contrast, associated with a smoother and more uniform surface. In terms of correlation, all classes show high values, with Class 1 (0.9443) showing the strongest relationship between neighboring pixels, indicating a more structured texture. For energy, Class 1 (0.2548) has the highest value, reflecting greater repetitiveness and uniformity, whereas Class 2 (0.2355) shows the lowest energy, suggesting less regularity. Finally, homogeneity values remain consistently high across all classes, with Class 4 (0.9545) being the most homogeneous and Class 3 (0.9416) the least. Overall, these results suggest that as oranges mature, their surface texture becomes more structured and uniform, with reduced contrast and increased homogeneity.
Table 4.
Average texture values for the four maturity levels obtained from the Gray Level Co-occurrence Matrix (GLCM).
3.6. Adaptive Neuro-Fuzzy Inference System (ANFIS)
Artificial intelligence is a discipline within computer science that focuses on the development of algorithms capable of learning, reasoning, and making decisions, emulating human cognition [66]. Among its various areas, machine learning (ML) has gained relevance due to its predictive accuracy, ease of evaluation, and fast convergence. In this work, an ANFIS model is proposed, which is a multilayer feedforward neural network. This model is characterized by combining the inference rules used in Fuzzy Inference Systems with the learning capacity of artificial neural networks [67].
Figure 9 shows the architecture of the ANFIS employed to generate three models aimed at predicting the variables maturity, Brix degrees, and firmness. The proposed architecture uses the descriptor Citrus Color Index—Gray Level Co-occurrence Matrix Texture Features (CCI–GLCM-TF) as input, obtained from the ratio between the (CCI) magnitude and each of the texture features derived from GLCM: contrast, correlation, energy, and homogeneity. These descriptors were calculated in regions of interest (ROIs) of sizes 3 × 3, 5 × 5, 11 × 11, and 21 × 21, resulting in four CCI–GLCM-TF descriptors.
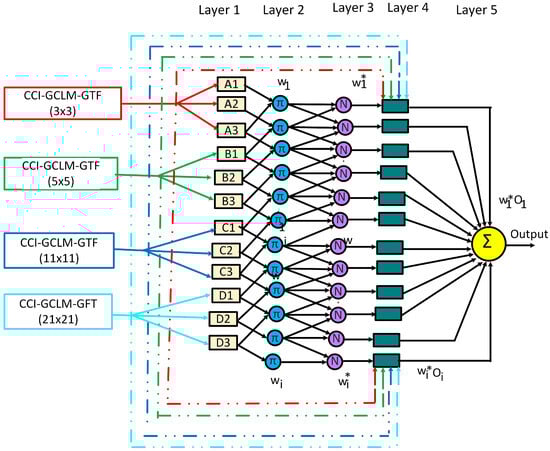
Figure 9.
Adaptive Neuro-Fuzzy Inference System (ANFIS) architecture proposed to predict maturity, Brix degrees, and firmness.
The first layer corresponds to fuzzy nodes, where the linguistic variables are associated through Gaussian Combination membership functions, defined as , , , and . The second layer consists of a set of 81 fuzzy rules, derived from the combination of the membership functions of each node, where each node represents a rule. These rules reflect the node weight, defined by the activation intensity of each combination. The third layer normalizes the rule weights, adjusting them to a range between 0 and 1. The fourth layer computes the output of the rules using linear or constant functions. Finally, the last layer integrates all rule outputs to generate the final system output.
The training of the models was carried out using the Fuzzy Logic Toolbox of MATLAB. The dataset was divided into 80% for training and 20% for validation. The input patterns corresponded to the CCI–GLCM-TF descriptors for each texture feature (contrast, correlation, energy, and homogeneity), while the outputs corresponded to the three variables of interest: maturity, degree Brix, and firmness. This procedure generated a total of 12 models, corresponding to the combinations of the four ROI sizes and the three output variables, enabling non-destructive prediction of fruit quality across different ripening stages.
4. Results
Table 5 summarizes the updated performance of ANFIS models for predicting the maturity, degree Brix, and firmness of the Navel oranges using Gaussian combination membership functions. Each model was configured with 3 membership functions per input and 81 inference rules and evaluated using texture features extracted from the Gray-Level Co-occurrence Matrix (GLCM). For maturity prediction (Models 1–4), contrast and homogeneity yielded the highest values, both above 0.87. In the case of °Brix prediction (Models 5–8), contrast and homogeneity again stood out, achieving values of 0.8786 and 0.8137, respectively. For firmness prediction (Models 9–12), energy provided the best fit with , while homogeneity maintained competitive performance with the lowest MAE of 0.1686.
Table 5.
Updated performance metrics of ANFIS models using texture features to predict fruit maturity, degree Brix, and firmness.
4.1. Maturity Prediction
Figure 10 illustrates the maturity predictions generated by ANFIS Models 1 to 4. Maturity classes were color-coded using circular markers: green (Class 1), yellow (Class 2), orange (Class 3), and brown (Class 4). The model symbols are as follows: green square (ANFIS 1, contrast, , MSE = 0.1421), blue diamond (ANFIS 2, correlation, , MSE = 0.2534), red upward triangle (ANFIS 3, energy, , MSE = 0.3120), and pink downward triangle (ANFIS 4, homogeneity, , MSE = 0.2533). Additionally, Figure 11 displays the mean squared error (MSE) values corresponding to each ANFIS model.
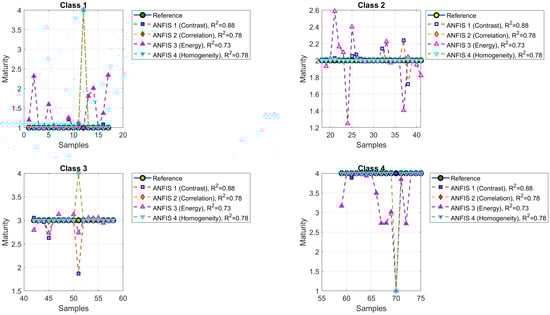
Figure 10.
The maturity levels predicted by ANFIS Models 1 to 4.
Figure 11.
Mean squared error (MSE) values corresponding to the maturity predictions generated by ANFIS Models 1 to 4.
4.2. Degree Brix Prediction
Figure 12 shows the predictions of °Brix values generated by ANFIS Models 5 to 8. Classes were represented with the same color scheme as before. The model symbols are green square (ANFIS 5, contrast, , MSE = 0.7401), blue diamond (ANFIS 6, correlation, , MSE = 1.5691), red upward triangle (ANFIS 7, energy, , MSE = 1.3539), and pink downward triangle (ANFIS 8, homogeneity, , MSE = 1.1357). Figure 13 presents the mean squared error (MSE) values for °Brix prediction.
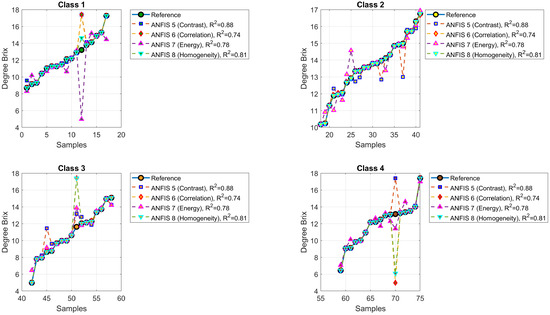
Figure 12.
Predicted versus actual °Brix values for ANFIS Models 5 to 8.
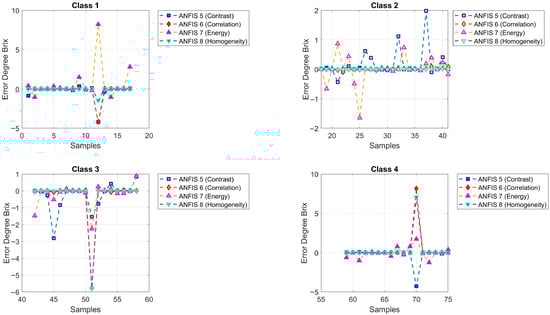
Figure 13.
Mean squared error (MSE) values corresponding to the degree Brix predictions generated by ANFIS Models 5 to 8.
4.3. Firmness Prediction
Figure 14 illustrates the predictions of firmness obtained by ANFIS Models 9 to 12. The model symbols are green square (ANFIS 9, contrast, ), blue diamond (ANFIS 10, correlation, ), red upward triangle (ANFIS 11, energy, ), and pink downward triangle (ANFIS 12, homogeneity, ). Figure 15 displays the corresponding MSE errors.
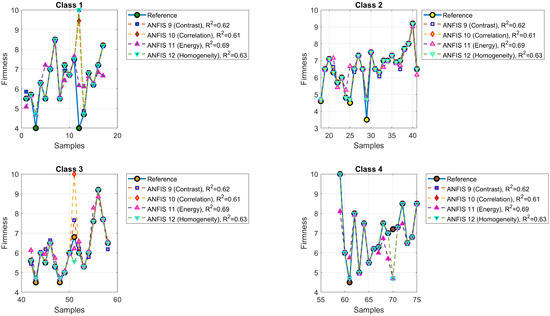
Figure 14.
Predicted versus actual firmness values for ANFIS Models 9 to 12.
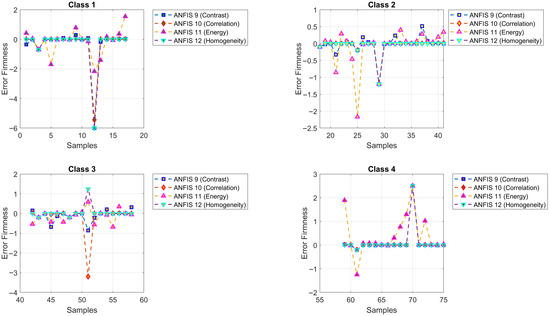
Figure 15.
Mean squared error (MSE) values corresponding to the firmness predictions generated by ANFIS Models 9 to 12.
4.4. Comparison of RMSE and MAE
To further evaluate the prediction accuracy of the ANFIS models, Figure 16, Figure 17 and Figure 18 present a comparative analysis of RMSE and MAE values for each texture descriptor (contrast, correlation, energy, and homogeneity) across the three target variables: maturity, degree Brix, and firmness. For maturity prediction, ANFIS 1 (contrast) achieved the lowest RMSE (0.3770) and MAE (0.0803), indicating high precision. In the case of degree Brix, ANFIS 8 (homogeneity) yielded the lowest MAE (0.1939), while ANFIS 5 (contrast) showed the lowest RMSE (0.8603). For firmness prediction, ANFIS 12 (homogeneity) exhibited the lowest MAE (0.1686), and ANFIS 11 (energy) achieved the lowest RMSE (0.7105). These histograms highlight the relative performance of each texture-based model and support the selection of descriptors with superior predictive accuracy.
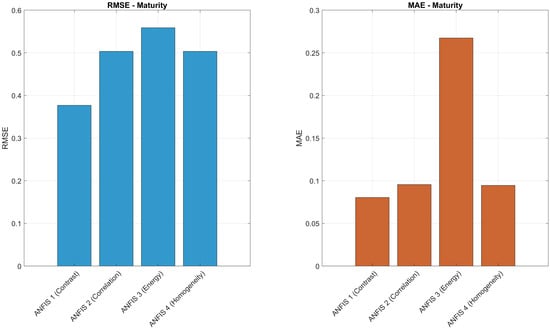
Figure 16.
Comparison of RMSE and MAE values for ANFIS Models 1–4 in predicting maturity using contrast, correlation, energy, and homogeneity.
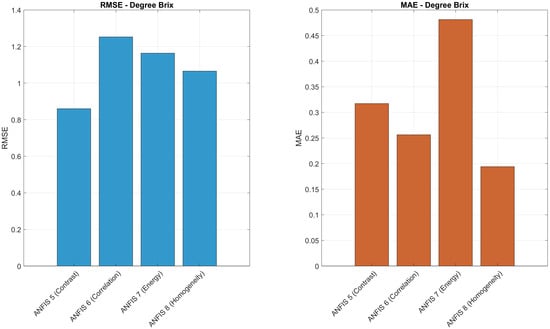
Figure 17.
Comparison of RMSE and MAE values for ANFIS Models 5–8 in predicting Brix degrees using contrast, correlation, energy, and homogeneity.
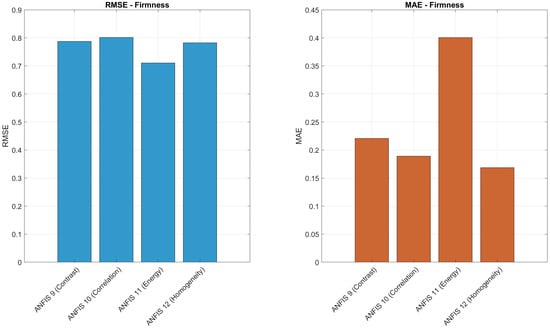
Figure 18.
Comparison of RMSE and MAE values for ANFIS Models 9–12 in predicting firmness using contrast, correlation, energy, and homogeneity.
4.5. Statistical Significance and Robustness Analysis
As part of the quantitative comparison and robustness validation, Table 6 summarizes the statistical validation and the selection of tests applied to each variable. The analysis was conducted in MATLAB using a dataset of seventy-five samples distributed across four maturity classes. Each sample included texture features derived from the Gray-Level Co-occurrence Matrix (GLCM)—specifically, contrast, correlation, energy, and homogeneity—as well as conventional parameters such as Brix degrees, firmness, and color coordinates (, , ).
Table 6.
Statistical validation and test selection per variable.
An adaptive statistical testing strategy was implemented as follows:
- Normality was assessed for each class group using the Lilliefors test.
- Homogeneity of variances was evaluated using Levene’s test.
- Depending on the assumptions, either classical one-way ANOVA, Welch ANOVA, or Kruskal–Wallis was applied.
The results confirmed that the GLCM-based texture descriptors showed significant differences across the four maturity classes. All relevant variables yielded p-values below 0.001 under their respective tests, confirming their discriminative strength. In contrast, conventional parameters such as degree Brix and L* did not consistently achieve statistical significance, reinforcing the reliability of the image-based approach.
5. Discussion
The ANFIS models developed in this study, combining the Citrus Color Index (CCI) with texture features derived from the Gray-Level Co-occurrence Matrix (GLCM)—including contrast, correlation, energy, and homogeneity—demonstrated reliable predictive capabilities for estimating maturity, degrees Brix, and firmness in oranges. As shown in Table 7, the coefficients of determination () ranged from 0.6089 to 0.8137, with moderate RMSE values, confirming the robustness of the models.
Table 7.
Comparative performance of citrus quality prediction models.
Compared to methodologies reported in the literature, including fuzzy systems, deep neural networks, and spectral-based models, the ANFIS models present competitive performance, particularly for maturity and Brix prediction. Some spectral approaches report values between 0.83 and 0.98, while the ANFIS models reach up to without requiring specialized imaging systems.
This analysis highlights the importance of integrating texture features with color indices, enabling the capture of additional spatial information that enhances prediction accuracy. Moreover, since this type of combined descriptor has not been extensively explored in previous studies, this work represents a novel contribution to non-destructive citrus quality assessment.
A statistical significance and robustness analysis was conducted, including normality testing; homogeneity of variances; and the application of ANOVA, Welch ANOVA, or Kruskal–Wallis depending on the assumptions met for each variable. The analysis confirmed that the texture descriptors used in the models show statistically significant differences across the four maturity stages (p-values consistently below 0.001), validating their discriminative power. In contrast, conventional traits such as degrees Brix and color parameters did not consistently reach statistical significance, confirming the superiority of the proposed feature selection strategy.
Future work will involve the validation of the method under field conditions, allowing for more accurate biological calibration and improved data representativeness. Advanced image enhancement techniques, such as Generative Adversarial Networks, Self-Supervised Dehazing Networks, and Semantic-Aware Dehazing with Adaptive Feature Fusion, will be explored to optimize data acquisition under variable lighting. In addition, further comparative analysis will be conducted using state-of-the-art dehazing models, including FFA-Net, VNDHR, GASSDN, ZID, and IMRH, to improve image quality and descriptor reliability. This approach has direct practical applications, as it could be implemented in low-cost devices for on-site assessments, improving production treatments and enabling rapid decision-making in crop management. Finally, the method will be extended to other citrus fruits—such as lemons, mandarins, tangerines, and different orange varieties—to validate its robustness across species.
6. Conclusions
This study presents the Citrus Color Index—GLCM Texture Feature (CCI–GLCM-TF) descriptor, which combines the peel color index (CCI) with texture features derived from the GLCM—contrast, correlation, energy, and homogeneity. This descriptor captures color variations, uniformity, and surface structure, enabling the non-destructive assessment of maturity, firmness, and physicochemical composition of oranges.
The ANFIS model developed, along with multiscale ROI sampling (3 × 3, 5 × 5, 11 × 11, and 21 × 21 pixels), showed robust correlations between the descriptors and target variables, with values greater than 0.81 for the most representative models. This demonstrates the predictive capability of the method and highlights its potential for full-surface exploration of the fruit.
An important advantage is that the approach allows for real-time evaluations using low-cost devices, such as webcams, facilitating rapid decision-making for fruit handling and postharvest treatment without causing damage.
Although the results were consistent for Navel oranges, it is necessary to extend the study to other citrus species and varieties to validate the generalizability of the method. Additionally, it is recommended to complement the analyses with further physiological and biochemical measurements, such as chlorophyll and carotenoid content, and cell wall firmness, as well as using more precise firmness assessment tools, such as compression tests or acoustic sensors.
In direct response to the research question—Can the prediction of Brix content and firmness be improved using a CCI–GLCM-TF descriptor in an ANFIS-based model?—the findings confirm that such improvement is indeed achievable. By integrating chromatic and textural information, the descriptor provides a more complete representation of the fruit’s physiological state. The ANFIS models achieved values above 0.81 and RMSE values below 1.1, outperforming approaches based solely on color or texture.
Future work will explore additional GLCM-derived textures and other chromatic descriptors (a, a/b, hue, and chroma) to further improve model accuracy and robustness. A comparative analysis will also be conducted using advanced image enhancement models, including FFA-Net, VNDHR, GASSDN, ZID, and IMRH, to optimize visual quality under variable lighting conditions. The ultimate goal is to develop a practical, low-cost, non-destructive system for real-time citrus fruit quality evaluation.
Author Contributions
M.J.V.-A., D.G.-L. and A.I.B.-G.: methodology; M.C.-L. and C.G.M.-P.: validation; A.R.L. and M.C.-L.: formal analysis; H.R.-G. and A.I.B.-G.: investigation; A.R.L.: writing—original draft preparation; C.G.M.-P. and M.J.V.-A.: writing—review and editing; D.G.-L. and M.J.V.-A.: supervision. All authors have read and agreed to the published version of the manuscript.
Funding
This research was funded by the Tecnológico Nacional de México (TecNM), Grant No. 21809.25-PD, Official Letter No. M00.2.2/2565/2025; the Secretaría de Educación, Ciencia, Tecnología e Innovación (SECIHTI); and the Programa para el Desarrollo Profesional Docente (PRODEP).
Institutional Review Board Statement
Not applicable.
Informed Consent Statement
Not applicable.
Data Availability Statement
Supporting data for these findings is accessible at https://drive.google.com/drive/folders/1KxfRcoeh82f0Tr99Nd_iMrHYWL_kJal1?usp=drive_link (accessed on 3 July 2024).
Acknowledgments
The authors sincerely acknowledge the institutional support provided by the Tecnológico Nacional de México (TecNM), the Autonomous University of Queretaro (AUQ), Ramon Llull University, the University of Guanajuato, the Secretaría de Ciencia, Tecnología e Innovación (SECIHTI), and the PRODEP program, which were instrumental in enabling the development of this research. Furthermore, we acknowledge the use of Microsoft Copilot (Microsoft Corporation) and ChatGPT (OpenAI) as GenAI tools during the algorithm visualization stage of this work, specifically for highlighting image regions corresponding to the Citrus Color Index (CCI). Additionally, DeepL Translate and Grammarly were employed to refine technical writing, facilitate multilingual translation, and enhance grammatical accuracy throughout the manuscript preparation process.
Conflicts of Interest
The authors declare no conflicts of interest.
References
- Chen, Y.R.; Chao, K.; Kim, M.S. Machine vision technology for agricultural applications. Comput. Electron. Agric. 2002, 36, 173–191. [Google Scholar] [CrossRef]
- Brosnan, T.; Sun, D.W. Inspection and grading of agricultural and food products by computer vision systems—A review. Comput. Electron. Agric. 2002, 36, 193–213. [Google Scholar] [CrossRef]
- Barrett, D.M.; Beaulieu, J.C.; Shewfelt, R. Color, flavor, texture, and nutritional quality of fresh-cut fruits and vegetables: Desirable levels, instrumental and sensory measurement, and the effects of processing. Crit. Rev. Food Sci. Nutr. 2010, 50, 369–389. [Google Scholar] [CrossRef]
- Liu, C.; Hao, G.; Su, M.; Chen, Y.; Zheng, L. Potential of Multispectral Imaging Combined with Chemometric Methods for Rapid Detection of Sucrose Adulteration in Tomato Paste. J. Food Eng. 2017, 215, 78–83. [Google Scholar] [CrossRef]
- Pathmanaban, P.; Gnanavel, B.; Anandan, S.S. Recent application of imaging techniques for fruit quality assessment. Trends Food Sci. Technol. 2019, 94, 32–42. [Google Scholar] [CrossRef]
- Gupta, A.K.; Pathak, U.; Tongbram, T.; Medhi, M.; Terdwongworakul, A.; Magwaza, L.S.; Mditshwa, A.; Chen, T.; Mishra, P. Emerging approaches to determine maturity of citrus fruit. Crit. Rev. Food Sci. Nutr. 2022, 62, 5245–5266. [Google Scholar] [CrossRef]
- Ruiz-Altisent, M.; Ruiz-Garcia, L.; Moreda, G.; Lu, R.; Hernandez-Sanchez, N.; Correa, E.; Diezma, B.; Nicolaï, B.; García-Ramos, J. Sensors for product characterization and quality of specialty crops—A review. Comput. Electron. Agric. 2010, 74, 176–194. [Google Scholar] [CrossRef]
- Olaniran, A.F.; Adeyanju, A.A.; Olaniran, O.D.; Erinle, C.O.; Okonkwo, C.E.; Taiwo, A.E. Improvement of food aroma and sensory attributes of processed food products using essential oils/boosting up the organoleptic properties and nutritive of different food products. In Applications of Essential Oils in the Food Industry; Elsevier: Amsterdam, The Netherlands, 2024; pp. 119–128. [Google Scholar]
- Ali, M.M.; Anwar, R.; Yousef, A.F.; Li, B.; Luvisi, A.; De Bellis, L.; Aprile, A.; Chen, F. Influence of Bagging on the Development and Quality of Fruits. Plants 2021, 10, 358. [Google Scholar] [CrossRef] [PubMed]
- Valero, D.; Serrano, M. Postharvest Biology and Technology for Preserving Fruit Quality; CRC Press: Boca Raton, FL, USA, 2010. [Google Scholar]
- Pereira, C.; Martín, A.; López-Corrales, M.; Córdoba, M.d.G.; Galván, A.I.; Serradilla, M.J. Evaluation of the physicochemical and sensory characteristics of different fig cultivars for the fresh fruit market. Foods 2020, 9, 619. [Google Scholar] [CrossRef] [PubMed]
- Prasanna, V.; Prabha, T.N.; Tharanathan, R.N. Fruit ripening phenomena—An overview. Crit. Rev. Food Sci. Nutr. 2007, 47, 1–19. [Google Scholar] [CrossRef]
- Olagunju, A.I.; Sandewa, O.E. Comparative physicochemical properties and antioxidant activity of dietary soursop milkshake. Beverages 2018, 4, 38. [Google Scholar] [CrossRef]
- Ruby-Figueroa, R.; Nardi, M.; Sindona, G.; Conidi, C.; Cassano, A. A multivariate statistical analyses of membrane performance in the clarification of citrus press liquor. ChemEngineering 2019, 3, 10. [Google Scholar] [CrossRef]
- Donno, D.; Mellano, M.G.; Hassani, S.; De Biaggi, M.; Riondato, I.; Gamba, G.; Giacoma, C.; Beccaro, G.L. Assessing nutritional traits and phytochemical composition of artisan jams produced in comoros islands: Using indigenous fruits with high health-impact as an example of biodiversity integration and food security in rural development. Molecules 2018, 23, 2707. [Google Scholar] [CrossRef]
- Fathy, H.M.; Abd El-Maksoud, A.A.; Cheng, W.; Elshaghabee, F.M. Value-added utilization of citrus peels in improving functional properties and probiotic viability of Acidophilus-bifidus-thermophilus (ABT)-type synbiotic yoghurt during cold storage. Foods 2022, 11, 2677. [Google Scholar] [CrossRef]
- García-Martínez, E.; Camacho, M.d.M.; Martínez-Navarrete, N. In vitro bioaccessibility of bioactive compounds of freeze-dried orange juice co-product formulated with gum Arabic and modified starch. Molecules 2023, 28, 810. [Google Scholar] [CrossRef]
- Food and Agriculture Organization of the United Nations. FAOSTAT. 2024. Available online: https://www.fao.org/faostat/en/#home (accessed on 6 September 2024).
- Padda, M.S.; do Amarante, C.V.; Garcia, R.M.; Slaughter, D.C.; Mitcham, E.J. Methods to analyze physico-chemical changes during mango ripening: A multivariate approach. Postharvest Biol. Technol. 2011, 62, 267–274. [Google Scholar] [CrossRef]
- Omoba, O.S.; Obafaye, R.O.; Salawu, S.O.; Boligon, A.A.; Athayde, M.L. HPLC-DAD phenolic characterization and antioxidant activities of ripe and unripe sweet orange peels. Antioxidants 2015, 4, 498–512. [Google Scholar] [CrossRef]
- Sabzi, S.; Javadikia, H.; Arribas, J.I. A three-variety automatic and non-intrusive computer vision system for the estimation of orange fruit pH value. Measurement 2020, 152, 107298. [Google Scholar] [CrossRef]
- Meléndez-Martínez, A.J.; Benítez, A.; Corell, M.; Hernanz, D.; Mapelli-Brahm, P.; Stinco, C.; Coyago-Cruz, E. Screening for innovative sources of carotenoids and phenolic antioxidants among flowers. Foods 2021, 10, 2625. [Google Scholar] [CrossRef]
- Wagare, D.S.; Shirsath, S.E.; Shaikh, M.; Netankar, P. Sustainable solvents in chemical synthesis: A review. Environ. Chem. Lett. 2021, 19, 3263–3282. [Google Scholar] [CrossRef]
- Jaywant, S.A.; Singh, H.; Arif, K.M. Sensors and instruments for brix measurement: A review. Sensors 2022, 22, 2290. [Google Scholar] [CrossRef] [PubMed]
- Li, Y.; Jin, G.; Jiang, X.; Yi, S.; Tian, X. Non-destructive determination of soluble solids content using a multi-region combination model in hybrid citrus. Infrared Phys. Technol. 2020, 104, 103138. [Google Scholar] [CrossRef]
- Akbar, J.U.M.; Kamarulzaman, S.F.; Muzahid, A.J.M.; Rahman, M.A.; Uddin, M. A comprehensive review on deep learning assisted computer vision techniques for smart greenhouse agriculture. IEEE Access 2024, 12, 4485–4522. [Google Scholar] [CrossRef]
- López-García, F.; Andreu-García, G.; Blasco, J.; Aleixos, N.; Valiente, J.M. Automatic detection of skin defects in citrus fruits using a multivariate image analysis approach. Comput. Electron. Agric. 2010, 71, 189–197. [Google Scholar] [CrossRef]
- Wu, D.; Sun, D.W. Colour measurements by computer vision for food quality control—A review. Trends Food Sci. Technol. 2013, 29, 5–20. [Google Scholar] [CrossRef]
- Li, P.; Li, S.; Du, G.; Jiang, L.; Liu, X.; Ding, S.; Shan, Y. A simple and nondestructive approach for the analysis of soluble solid content in citrus by using portable visible to near-infrared spectroscopy. Food Sci. Nutr. 2020, 8, 2543–2552. [Google Scholar] [CrossRef] [PubMed]
- Cavallo, D.P.; Cefola, M.; Pace, B.; Logrieco, A.F.; Attolico, G. Non-destructive and contactless quality evaluation of table grapes by a computer vision system. Comput. Electron. Agric. 2019, 156, 558–564. [Google Scholar] [CrossRef]
- Cubero, S.; Lee, W.S.; Aleixos, N.; Albert, F.; Blasco, J. Automated systems based on machine vision for inspecting citrus fruits from the field to postharvest—A review. Food Bioprocess Technol. 2016, 9, 1623–1639. [Google Scholar] [CrossRef]
- Nandi, C.S.; Tudu, B.; Koley, C. A machine vision-based maturity prediction system for sorting of harvested mangoes. IEEE Trans. Instrum. Meas. 2014, 63, 1722–1730. [Google Scholar] [CrossRef]
- Alfatni, M.S.M.; Khairunniza-Bejo, S.; Marhaban, M.H.B.; Saaed, O.M.B.; Mustapha, A.; Shariff, A.R.M. Towards a real-time oil palm fruit maturity system using supervised classifiers based on feature analysis. Agriculture 2022, 12, 1461. [Google Scholar] [CrossRef]
- Saragih, R.E.; Emanuel, A.W. Banana ripeness classification based on deep learning using convolutional neural network. In Proceedings of the 2021 3rd East Indonesia Conference on Computer and Information Technology (EIConCIT), Surabaya, Indonesia, 9–11 April 2021; pp. 85–89. [Google Scholar]
- Sajjan, M.; Kulkarni, L.; Anami, B.; Gaddagimath, N. A comparative analysis of color features for classification of bulk chilli. In Proceedings of the 2016 2nd International conference on contemporary computing and informatics (IC3I), Greater Noida, India, 14–17 December 2016; pp. 427–432. [Google Scholar]
- Villaseñor-Aguilar, M.J.; Bravo-Sánchez, M.G.; Padilla-Medina, J.A.; Vázquez-Vera, J.L.; Guevara-González, R.G.; García-Rodríguez, F.J.; Barranco-Gutiérrez, A.I. A maturity estimation of bell pepper (Capsicum annuum L.) by artificial vision system for quality control. Appl. Sci. 2020, 10, 5097. [Google Scholar] [CrossRef]
- Pardede, J.; Husada, M.G.; Hermana, A.N.; Rumapea, S.A. Fruit ripeness based on RGB, HSV, HSL, L* a* b* color feature using SVM. In Proceedings of the 2019 International Conference of Computer Science and Information Technology (ICoSNIKOM), Medan, Indonesia, 28–29 November 2019; pp. 1–5. [Google Scholar]
- De-la Torre, M.; Zatarain, O.; Avila-George, H.; Muñoz, M.; Oblitas, J.; Lozada, R.; Mejía, J.; Castro, W. Multivariate analysis and machine learning for ripeness classification of cape gooseberry fruits. Processes 2019, 7, 928. [Google Scholar] [CrossRef]
- Little, A.C. A research note off on a tangent. J. Food Sci. 1975, 40, 410–411. [Google Scholar] [CrossRef]
- Jiménez-Cuesta, M.; Cuquerella, J.; Martínez-Jávega, J. Determination of a color index for citrus fruit degreening. In Proceedings of the International Society of Citriculture, Tokyo, Japan, 9–12 November 1983; Volume 2, pp. 750–753. [Google Scholar]
- Carreño, J.; Martínez, A.; Almela, L.; Fernández-López, J. Proposal of an index for the objective evaluation of the colour of red table grapes. Food Res. Int. 1995, 28, 373–377. [Google Scholar] [CrossRef]
- Olmo, M.; Nadas, A.; García, J. Nondestructive methods to evaluate maturity level of oranges. J. Food Sci. 2000, 65, 365–369. [Google Scholar] [CrossRef]
- Lado, J.; Gambetta, G.; Zacarias, L. Key determinants of citrus fruit quality: Metabolites and main changes during maturation. Sci. Hortic. 2018, 233, 238–248. [Google Scholar] [CrossRef]
- Gao, Y.; Liu, Y.; Kan, C.; Chen, M.; Chen, J. Changes of peel color and fruit quality in navel orange fruits under different storage methods. Sci. Hortic. 2019, 256, 108522. [Google Scholar] [CrossRef]
- Ghanghas, S.; Kumar, N.; Kumar, S.; Singh, V.K. Advancement in Measurement and AI-Driven Predictions of Maturity Indices in Kinnow (Citrus nobilis x Citrus deliciosa): A Comprehensive Review. Food Phys. 2024, 2, 100026. [Google Scholar] [CrossRef]
- He, K.; Sun, J.; Tang, X. Single image haze removal using dark channel prior. IEEE Trans. Pattern Anal. Mach. Intell. 2010, 33, 2341–2353. [Google Scholar] [CrossRef] [PubMed]
- Park, D.; Park, H.; Han, D.K.; Ko, H. Single image dehazing with image entropy and information fidelity. In Proceedings of the 2014 IEEE International Conference on Image Processing (ICIP), Paris, France, 27–30 October 2014; pp. 4037–4041. [Google Scholar]
- Zhang, S.; Zhang, X.; Wan, S.; Ren, W.; Zhao, L.; Shen, L. Generative adversarial and self-supervised dehazing network. IEEE Trans. Ind. Inform. 2023, 20, 4187–4197. [Google Scholar] [CrossRef]
- Liu, Y.; Wang, X.; Hu, E.; Wang, A.; Shiri, B.; Lin, W. VNDHR: Variational single nighttime image Dehazing for enhancing visibility in intelligent transportation systems via hybrid regularization. IEEE Trans. Intell. Transp. Syst. 2025, 26, 10189–10203. [Google Scholar] [CrossRef]
- Petrou, Z.I.; Manakos, I.; Stathaki, T.; Mücher, C.A.; Adamo, M. Discrimination of vegetation height categories with passive satellite sensor imagery using texture analysis. IEEE J. Sel. Top. Appl. Earth Obs. Remote Sens. 2015, 8, 1442–1455. [Google Scholar] [CrossRef]
- Humeau-Heurtier, A. Texture feature extraction methods: A survey. IEEE Access 2019, 7, 8975–9000. [Google Scholar] [CrossRef]
- Bakar, M.A.A.; Zulkifli, Z.; Mohamad, M.; Ahmad, S. GLCM-Based Feature Extraction and CNN Approach for Fruit Freshness Detection. In Proceedings of the 2024 5th International Conference on Artificial Intelligence and Data Sciences (AiDAS), Bangkok, Thailand, 3–4 September 2024; pp. 1–6. [Google Scholar]
- Al Riza, D.F.; Ikrom, A.M.; Tulsi, A.A.; Darmanto; Hendrawan, Y. Mandarin orange (Citrus reticulata Blanco cv. Batu 55) ripeness parameters prediction using combined reflectance-fluorescence images and deep convolutional neural network (DCNN) regression model. Sci. Hortic. 2024, 331, 113089. [Google Scholar] [CrossRef]
- Patel, H.; Prajapati, R.; Patel, M. Detection of quality in orange fruit image using SVM classifier. In Proceedings of the 2019 3rd International Conference on Trends in Electronics and Informatics (ICOEI), Tirunelveli, India, 23–25 April 2019; pp. 74–78. [Google Scholar]
- Carolina, C.P.D.; David, N.T.D. Classification of oranges by maturity, using image processing techniques. In Proceedings of the 2014 III International Congress of Engineering Mechatronics and Automation (CIIMA), Cartagena, Colombia, 22–24 October 2014; pp. 1–5. [Google Scholar]
- Buragohain, M.; Mahanta, C. A novel approach for ANFIS modelling based on full factorial design. Appl. Soft Comput. 2008, 8, 609–625. [Google Scholar] [CrossRef]
- Arkhipov, M.; Krueger, E.; Kurtener, D. Evaluation of ecological conditions using bioindicators: Application of fuzzy modeling. In Proceedings of the International Conference on Computational Science and Its Applications, Perugia, Italy, 30 June–3 July 2008; Springer: Berlin/Heidelberg, Germany, 2008; pp. 491–500. [Google Scholar]
- Cheng, C.B.; Cheng, C.J.; Lee, E. Neuro-fuzzy and genetic algorithm in multiple response optimization. Comput. Math. Appl. 2002, 44, 1503–1514. [Google Scholar] [CrossRef]
- Kaur, S.; Randhawa, S.; Malhi, A. An efficient ANFIS based pre-harvest ripeness estimation technique for fruits. Multimed. Tools Appl. 2021, 80, 19459–19489. [Google Scholar] [CrossRef]
- Villaseñor-Aguilar, M.J.; Cano-Lara, M.; Lopez, A.R.; Rostro-Gonzalez, H.; Padilla-Medina, J.A.; Barranco-Gutiérrez, A.I. Fuzzy Classification of the Maturity of the Orange (Citrus× sinensis) Using the Citrus Color Index (CCI). Appl. Sci. 2024, 14, 5953. [Google Scholar] [CrossRef]
- Castro, W.; Oblitas, J.; De-La-Torre, M.; Cotrina, C.; Bazán, K.; Avila-George, H. Classification of cape gooseberry fruit according to its level of ripeness using machine learning techniques and different color spaces. IEEE Access 2019, 7, 27389–27400. [Google Scholar] [CrossRef]
- Chen, T.; Ma, K.K.; Chen, L.H. Tri-state median filter for image denoising. IEEE Trans. Image Process. 1999, 8, 1834–1838. [Google Scholar] [CrossRef]
- Shi, Z.; Li, Y.; Zhang, C.; Zhao, M.; Feng, Y.; Jiang, B. Weighted median guided filtering method for single image rain removal. EURASIP J. Image Video Process. 2018, 2018, 1–8. [Google Scholar] [CrossRef]
- Ding, X.; Zhang, X.; Han, J.; Ding, G. Scaling up your kernels to 31 × 31: Revisiting large kernel design in cnns. In Proceedings of the IEEE/CVF Conference on Computer Vision and Pattern Recognition, New Orleans, LA, USA, 18–24 June 2022; pp. 11963–11975. [Google Scholar]
- Chansong, D.; Supratid, S. Impacts of kernel size on different resized images in object recognition based on convolutional neural network. In Proceedings of the 2021 9th International Electrical Engineering Congress (iEECON), Pattaya, Thailand, 10–12 March 2021; pp. 448–451. [Google Scholar]
- Tho, T.P.; Thinh, N.T. Using ANFIS to predict picking position of the fruits sorting system. In Proceedings of the 2017 International Conference on System Science and Engineering (ICSSE), Ho Chi Minh City, Vietnam, 21–23 July 2017; pp. 297–304. [Google Scholar]
- Zheng, H.; Jiang, B.; Lu, H. An adaptive neural-fuzzy inference system (ANFIS) for detection of bruises on Chinese bayberry (Myrica rubra) based on fractal dimension and RGB intensity color. J. Food Eng. 2011, 104, 663–667. [Google Scholar] [CrossRef]


Disclaimer/Publisher’s Note: The statements, opinions and data contained in all publications are solely those of the individual author(s) and contributor(s) and not of MDPI and/or the editor(s). MDPI and/or the editor(s) disclaim responsibility for any injury to people or property resulting from any ideas, methods, instructions or products referred to in the content. |
© 2025 by the authors. Licensee MDPI, Basel, Switzerland. This article is an open access article distributed under the terms and conditions of the Creative Commons Attribution (CC BY) license (https://creativecommons.org/licenses/by/4.0/).