Abstract
Several studies have proven the impact of the quality of indoor environmental conditions on human professional and cognitive performances. Additionally, building energy efficiency and indoor comfort have attracted increasing interest, encouraging the implementation of advanced digital technologies and platforms for a more efficient management of buildings. In this context, this study proposes a new framework for an effective BIM-IoT integration leading to a nearly Digital Twin (DT) relying on a BIM model equipped with regularly-generated IEQ reports summarizing statistics from real-time collected data to support facility managers’ decision-making. Despite the relevant literature on the subject, the proposed methodology introduces some novelties, as monthly results of Indoor Air Quality (IAQ) and thermal comfort evaluation are provided by open HTML reports automatically generated through a Python 3.10 code from sensor data. These reports are easily readable without needing any external platform to be visualized and are directly accessible through BIM models. The proposed methodology has been validated on a pilot case study, thus proving its efficiency, effectiveness, and robustness in terms of automation level, interoperability, adaptability, reliability, accuracy in data visualization, and management. The study shows promising results but also some issues that could be addressed through further development of the research.
1. Introduction
A large body of literature reports that ours has become an ‘indoor species’ [1] as we tend to spend more than 85% of our time inside buildings [2]. This makes the indoor environment an element of great influence on people’s physical and mental well-being and health. Air pollution is increasingly becoming a threat to health. Moreover, the main characteristic of the various pollutants in the atmosphere is that they are colorless and odorless, which makes it difficult for the human body to perceive them [3]. Human professional and cognitive performances are closely linked to the internal built environment. The quality of the indoor environment plays a key role in the productivity of the occupants. Many studies have attempted to assess the effect of indoor environmental conditions on user performance in terms of productivity, focusing mainly on the thermal aspect and indoor air quality [4,5]. In [6], the link between the impact of five aspects of Indoor Environmental Quality-IEQ-(temperature, air quality, natural and electrical lighting, acoustics) and productivity was studied. On these premises, the need to develop methods and tools for measuring and monitoring various indicators of indoor environmental quality is quite evident. In the current building context, the increasing interest in energy efficiency and building indoor comfort has pushed towards the integration of advanced technologies and building management platforms. One of the main challenges is the harmonization between BIM (Building Information Modeling) models, which are the geometric and informative representation of buildings, and dynamic data from IoT (Internet of Things) systems. This integration allows the creation of Digital Twins (DT) that can monitor and manage buildings more efficiently. BIM-IoT integration exploits the geometric and parametric properties of BIM models and real-time streaming of environmental data collected by IoT sensors to create a DT for real-time building monitoring [7]. This document introduces a workflow that can support the facility manager’s decision-making in this field. Starting from the selected measurement system, the developed BIM-centered workflow allows effective data analysis and the following association of comfort levels to each monitored space.
As shown in the fourth section of this document, the proposed system is tested in a pilot case study hosting the offices of the Sotacarbo S.p.A research center, located in the historic mining site of Serbariu in Carbonia (Italy). As presented in Section 4 and Section 5 of this paper, the proposed system shows promising results but also some issues that could be addressed with further development of the research activities.
1.1. Literature Review
It is already clear that Building Information Modelling (BIM) may bring great advantages to the management and maintenance of an asset [8]. It is a revolutionary methodology that is deeply transforming the Architecture, Engineering, and Construction (AEC) industry. In the last decade, BIM methodology has been widely used to make the management of existing buildings more efficient, providing great support in overcoming critical issues related to Facility Management. These critical issues are related to the low accessibility and high fragmentation of the information in the traditional building management processes [9,10]. Tsay et al. [11] analyze why the quality and type of information developed through current BIM-enabled design practices are largely inadequate for FM purposes. Moreover, 10 key information quality criteria have been identified in order to enable design models to reliably support FM. Matarneh et al. [12] present an overview of the current developments related to BIM and FM interaction, highlighting gaps to be filled. Also, Peng et al. [13] performed a bibliometric analysis on current developments in the field of interaction between BIM and FM systems and presented future opportunities. The BIM model is capable of structuring data and information referring to the complete lifecycle of a building, from its preliminary conception to its eventual decommissioning. This represents a great support to the facility manager that has in charge of many operational and maintenance activities. In fact, it could be a reliable information and knowledge base, and it provides important contributions to the decision-making processes during the overall building life cycle [14,15]. Wanigarathna et al. [16] propose a BIM framework to facilitate gathering, modelling, and analyzing a range of data of healthcare-built assets. Muta et al. [17] present a literature review on how Building Information Modeling can contribute to improving building energy performance assessment and how it can support Building Energy Modeling tools for more consistent energy simulations. Matos et al. [18] explore BIM and FM integration to improve effectiveness in building renovation and retrofitting interventions. Information and data obtained from the BIM model could be used to assess the current state of a building and to simulate different retrofitting or renovation scenarios.
However, data and information capitalized and structured in the BIM model show the building configuration at certain times of its lifetime. They have a static nature and do not dynamically evolve as a result of changes in the environmental conditions. This characteristic of the BIM model limits its ability to support an optimized operational and maintenance management of the building. All the objects in the BIM model are rich in details such as geometric and material specifications, but they do not interact in real time with the closer environment and with the users who usually use the spaces inside a building.
To overcome these limitations, it is necessary to take a further step represented by the development of a Digital Twin (DT). BIM-IoT integration leverages the parametric and geometric properties of BIM models and the real-time streaming of environmental data (es, temperature, humidity, CO2, etc.) gathered by IoT sensors, to develop a DT for real-time monitoring of the building.
The DT adoption involves the integration of data from the BIM model with data obtained from sensors. The objective is to create a dynamic database to improve building performances and simultaneously to achieve reductions in operational time and costs.
The DT could be described as a real-time data flow between the physical and digital worlds.
The literature review highlights how the integration of BIM with real-time data from the Internet of Things (IoT) devices has become a key element in improving construction and operational efficiencies. This integration can deal with numerous areas of study related to AECO (Architecture, Engineering, Construction, and Operation) sectors [19]. Also, in the operational and maintenance phase of the existing buildings, the use of BIM to store and manage data coming from sensors has been proven to be really useful for the complex activity of the facility manager. However, the studies differ in their objectives, technologies used, and application context, showing different approaches in the development of the Digital Twin. Liu et al. [20] propose a Digital Twin for near-zero energy buildings (NZEB), integrating BIM and IoT technologies to optimize building management. The objective is to reduce building energy consumption with an automated monitoring system.
The method involves the use of IoT sensors to detect environmental parameters such as temperature, humidity, and CO2. Data are gathered in an InfluxDB database for a real-time analysis. Grasshopper was used to simulate and optimize consumption, while the Unity platform enabled automatic adjustment of lighting, air conditioning, and ventilation. The method was tested on an experimental building, the Zero-Carbon Hut, demonstrating a significant improvement in energy efficiency. Hosamo et al. [21] focus on predictive maintenance of HVAC systems through the use of a Digital Twin. The aim is to overcome the limitations of maintenance management systems by adopting a predictive approach based on real-time data. The method consists of three steps: automatic fault detection through the AFDD system, prediction of the state of air handling units (AHUs) through machine learning algorithms (ANN, SVM, and decision trees), and preventive maintenance planning. Data are acquired through IoT sensors that monitor temperature, pressure, and airflow and integrated into a BIM model (Autodesk Revit) through API RESTful. The system was tested on an academic building in Norway, showing 99% predictive accuracy and a valuable reduction in energy consumption. In [22], Hu and Assaad present an environmental monitoring system based on autonomous robots and Digital Twin. The model involves the use of mobile robots equipped with IoT sensors to collect data on air quality, temperature, and humidity. This data is then used to update in real time a BIM model. The 3D mapping of the building is carried out using LiDAR and SLAM algorithms, while the Ultra-Wideband (UWB) positioning system allows environmental variations to be located with centimeter accuracy. Data is sent to a BIM server, providing an advanced visualization of the indoor conditions of the buildings. Moretti et al. [23] propose an open BIM to Discrete Event Simulation (DES) data integration framework that is intended as the first step towards the development of a Digital Twin able to fully and dynamically quantify the impact of spatial layout and built assets state and performance on core process efficiency in healthcare facilities. Small changes in the equipment or spaces organization, malfunctions of building components (i.e., a lift), or a re-organization of room function assignment can have a significant impact on core process performance in a specialized building as a healthcare facility. The proposed DT could improve the facility manager’s decision-making process when faced with such criticalities.
Considering the compelling necessity of making the building stock management more efficient and sustainable by taking advantage of dynamically monitored data from IoT sensors emerged from the literature analysis just reported above, the present work introduces interesting innovative aspects into the research field of BIM-IoT integration by proposing a BIM-centered framework conceived to provide a valid decision support system based on a static integration of regularly generated reports on IEQ into BIM models. In particular, the proposed methodology, defined in Section 2 of this document, represents an important contribution to the research as it may be applied with every kind of sensor, provided that monitoring data can be extracted in .CSV (Comma-Separated Values) format. Furthermore, the results of Indoor Environmental Quality evaluation do not need any external platform to be visualized, but are provided by open reports easily readable, thus presenting an innovative static approach, avoiding an unnecessary integration of dynamic monitored data into BIM models. Additionally, the proposed methodology mainly relies on open and interoperable formats (such as .CSV and .HTML) and the proposed IAQ and thermal comfort reports contain intuitive summary graphs also including very helpful comparisons of monitored data with the related reference thresholds from international standards to more effectively support facility managers’ and designers’ decision-making by easing data interpretation and enabling a prompt detection of potential critical issues.
1.2. Research Objectives
From the literature analysis clear emerged the widening adoption of digital technologies integrating BIM models and IoT data to enhance asset management. In this context, the present study proposes a new BIM-centered framework integrating IoT data but preferring a static approach where real-time acquired data are automatically analyzed and summarized in handier monthly reports integrated into BIM models. The present research is therefore aimed at describing and demonstrating the effectiveness and robustness of the proposed methodology in terms of interoperability, reliability, and scalability, by also providing a practical application to a real case study as a validation. The herein presented methodological approach is intended to provide an effective decision support tool specifically addressed to facility managers and designers.
2. Methodology
The article shows a cutting-edge workflow aimed at implementing a BIM model able to provide updated information on IEQ (Indoor Environmental Quality) by effectively systematizing dynamic data acquired from a monitoring system, such as the indoor air temperature, the relative humidity, the air quality, the natural and artificial lighting, and the acoustics. In addition, the proposed workflow was also conceived to provide valid support to both clients and professionals in prompt advances of intervention hypotheses to improve indoor conditions and performance of existing buildings.
This methodology is structured into five main phases (as shown in Figure 1), which will be described in detail in the following sub-sections.
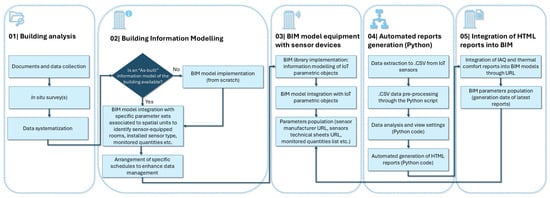
Figure 1.
Methodology flowchart.
2.1. Phase 1: Building Analysis
A preliminary fact-finding study is fundamental to analyzing the considered building thoroughly. These preparatory activities not only include in-situ inspections, but also the mapping of all building-related documents, as well as the study of the “As-built” BIM model if made available by the client. Additionally, other relevant information, fundamental to complete the body of knowledge about the building, may be acquired by directly interviewing the facility manager.
The assessment of the actual uses of the building, as well as of its occupancy level, also provides crucial information to collect. During this first phase, the building spaces to monitor, the characteristics of the sensors to use, and the precise position where the sensors should be placed inside the building also need to be analyzed.
2.2. Phase 2: BIM Implementation or Update of the As-Built Building Information Model
The starting point of this methodological step depends on the potential availability of an existing “As-built” information model of the considered building.
On condition that the client provided a proper “As-Built” BIM model, the first action needed concerns updating and integrating all information collected in the previous fact-finding survey.
Conversely, if any information model representative of the building status at the time of completion of construction works (i.e., the so-called “As Built” model) is not available, the work needs to start implementing a new building information model from the beginning, which ought to virtually simulate the current configuration of the building (considering geometries, materials, technical components, spaces, end uses, etc.). In this last case, the implementation of the building information model may be based on the outcomes of the preliminary building analysis, provided that the collected documents and information are accurate and exhaustive enough, or, more likely, on two-dimensional technical drawings supplied by the client. Unfortunately, in most cases, the existing technical drawings, as they are commonly provided in paper format, also need to be accurately digitalized before starting the implementation of a faithful three-dimensional model of the real building.
Additionally, close attention should be paid to room modelling, which allows for a proper definition and categorization of the building’s inner spaces inside the BIM model. In this regard, each room must be modelled as a unique item, distinctively codified and equipped with crucial information such as the related intended use, surface area, net height, etc. Moreover, additional information set concerning the monitoring system must be associated with the rooms, including the following:
- A Boolean parameter allowing for an easy detection of sensor-equipped rooms in the BIM model
- The sensor model
- A set of Boolean parameters allowing for an easy detection in the model of the most relevant quantities, objects of real-time monitoring in each room (e.g., temperature, relative humidity, CO2 concentration, Volatile Organic Compounds, PM2.5 and PM10 particulates, Indoor Air Quality, consumptions from HVAC systems, etc.).
2.3. Phase 3: Integration of the BIM Model with Sensor Devices
Once an accurate “As-Built” information model of the building is implemented, the model must also be equipped with the virtual prototypes of the chosen sensor devices, which must be placed properly inside the model in the selected rooms for monitoring. The sensor devices must therefore be modelled as three-dimensional parametric objects and then inserted into the BIM model as components hosted by the model spatial units (i.e., the rooms). It is worth noting that, if on the one hand, for the purpose of the study, it was not necessary to accurately model the sensor geometry, on the other hand, closer attention needed to be paid to the related information sets.
In this regard, as far as the main information requirements regarding sensor types are concerned, the following attributes must be integrated in the related BIM object as “type parameters”:
- Sensor manufacturer
- Sensor model
- Shape and dimensional parameters
- Type of monitored quantities (e.g., temperature, relative humidity, CO2, VOC, PM10, PM2.5, electro smog quantities, etc.)
- URL link to the sensor technical sheet.
Additionally, a specific information set concerning the single device must also be considered and integrated in the sensor BIM object through the following “instance parameters”:
- Unique ID
- Sensor position (name and end use of the room where the sensor was placed)
- Date of the sensor placement
- URL link to the latest monitoring HTML reports
- Date of generation of the latest HTML reports
- Regularity of report generation.
2.4. Phase 4: Automated Generation of HTML Reports from Sensor Data Through a Tailored Python Algorithm
Once the BIM model is integrated with virtual prototypes of sensor devices, a direct link between the physical sensors and the information model needs to be properly established in order to provide a clear representation of the real indoor conditions of the building.
However, the implemented methodology does not allow for real-time data visualization through the BIM model, as the sensor manufacturer makes available its proprietary IoT platform for this purpose. As in common cases, depending on the sensor type, the real-time values dynamically measured by sensors may be exported to CSV (Comma-Separated Values), a standard and interoperable format for data management and analysis. The proposed algorithm was specifically developed to easily process data series made available in .CSV format.
Additionally, in this work, the Python programming language was chosen to specifically develop an algorithm to automatically read and analyze real-time data from IoT (Internet of Things) sensors and also generate final reports in HTML (Hypertext Markup Language) format (Figure 2), which can be viewed within the building model.
The choice of the Python language was certainly based on its versatility, its ability to interface with various platforms, as well as the wide availability of specific libraries for data processing and visualization (as shown in Document S3).
The implemented Python script is structured according to the following parts:
- Data acquisition and pre-processing: real-time data generated by the IoT sensor platform, periodically exported to a .CSV file, are automatically read and preliminarily pre-processed through the customized Python code (Figure 3), also integrated with additional libraries such as Pandas and Datetime. Data pre-processing operations are fundamental to increase both data accuracy and consistency (e.g., by removing blanks, by properly formatting floating numbers and date-times, etc.).
- Data analysis and view settings: This second portion of the Python algorithm is devoted to more advanced processing operations on the collected data in order to extract meaningful information. More specifically, the average values of the assessed environmental parameters are calculated, potential anomalous peaks in the related trends are identified, and descriptive statistics are then generated for each parameter. Moreover, the data analysis herein considered also includes a comparison of the analyzed indicators with corresponding regulatory thresholds defined by recognized international standards [24,25,26]. The Python code then allows for a graphical representation of results (see Figure 4 and Figure 5) that emerged from the data analysis, to facilitate their understanding and interpretation. For that purpose, different types of graphs are used. In addition, the algorithm performs various kinds of controls to ensure that data visualizations are clear and accessible, by also taking advantage of labels and legends to better explain the meaning of each parameter and visually represent the critical thresholds. The main goal of the considered view settings is to allow both specialized and common users to easily understand the final results to make informed and aware decisions.
- Generation of HTML reports: The final stage of the Python-based algorithm involves the automatic generation of HTML reports. The HTML format was first chosen for its ease of integration with BIM models. Additionally, HTML reports can be easily opened in any browser, and they are compatible with several plugins of the most accredited BIM Authoring software, such as Autodesk Revit 2025. The generated reports include an introductory section, providing an overview of the monitored environmental conditions, followed by graphical representations of the most meaningful data, as well as a summary of the main performance indicators. These comprehensive final reports not only provide data summaries concerning both thermal comfort indicators and IAQ, but may also be assumed as valid educational tools to instruct facility managers in the main factors affecting comfort and air quality. The HTML reports can be configured to automatically keep up-to-date at regular time intervals, while ensuring the preservation and availability of the whole time series, which may be extremely useful to facility managers.
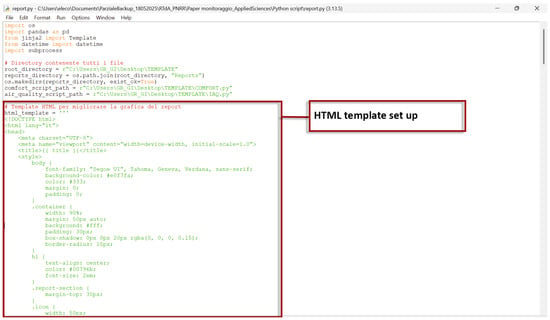
Figure 2.
Python algorithm: HTML set up.

Figure 3.
Python algorithm: data pre-processing.
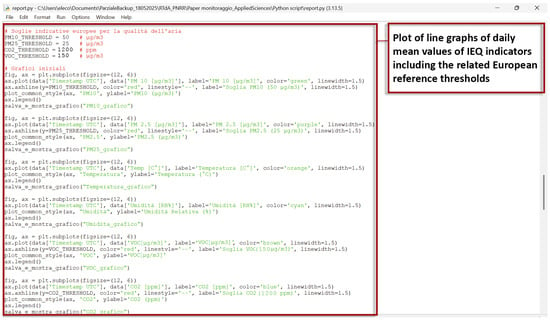
Figure 4.
Python algorithm: Plot of line graphs of daily mean values of main IEQ indicators (temperature, relative humidity, CO2, VOC, PM2.5, PM10), including the related reference thresholds.
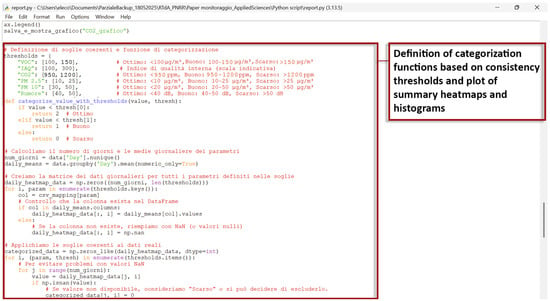
Figure 5.
Python algorithm: definition of categorization functions based on consistency thresholds of IAQ monitored quantities and plot of summary heatmaps and histograms.
2.5. Phase 5: Reports Integration into BIM
The semi-automatic generation of HTML reports is one of the key points of the proposed methodology. The reports have been designed to provide handy consultation tools, addressing stakeholders and facility managers, with the aim of clearly summarizing information and results from the real-time collected data analyses and presenting them in a usable way.
The HTML reports effectively integrate tabular and graphical representations of data in order to provide a comprehensive overview of the monitored environmental conditions. Moreover, the reports are characterized by a coherent and standardized structure to ease data understanding and interpretation.
More specifically, each report section is structured according to the following sections:
- Report header: Each report provides a clear header that includes the title, source file name, and a short description of the contents.
- Time diagrams and graphical indicators: Time diagrams show the trend of each parameter during a given monitoring period. Graphical indicators, such as color-based formatting rules or warning tags, are instead used to provide graphical alerts for parameters exceeding admissible thresholds, in order to allow users to promptly and easily identify any potential critical issues and patterns indicative of unsuitable environmental conditions.
- Daily heatmaps: Daily heatmaps are used to clearly show parameter variations over each day. This kind of data visualization allows for a prompt detection of potential critical hours throughout each parameter trend, thus enabling, for instance, an accurate assessment of the effectiveness of ventilation strategies, as well as of HVAC systems control strategies.
- Comfort summary histograms: Histograms are included in the report to schematically represent the overall percentages of time in which the monitored environmental conditions were classified as “optimal”, “good”, or “poor”, respectively. This summary allows for a prompt assessment of the overall effectiveness of the adopted environmental management strategies.
- Descriptive and analytical section: Each report includes at its end a specific expository section explaining the adopted analysis methods and providing a final interpretation of results. This final section is therefore crucial to help managers and stakeholders to better understand the acquired technical information and make informed decisions in order to significantly improve the IAQ of the building.
The HTML reports, one regarding comfort assessment and the other concerning IAQ, have been designed to be easily integrated into BIM models by taking advantage of specific URL parameters associated with each sensor component. Additionally, they also make all relevant information accessible to users lacking any specific technical skills.
3. Methodology Validation and Results
3.1. The Case Study: The Sotacarbo Headquarters
Sotacarbo S.p.A. is a company owned by the Sardinia Region (96%) and ENEA-National Agency for New Technologies, Energy and Sustainable Economic Development (4%), with headquarters located in the historic mining site of Serbariu in Carbonia. Founded to promote research activities in the energy sector, the Sotacarbo mainly focuses on the development of innovative technologies for the production of clean energy, with particular attention to green hydrogen.
The Sotacarbo Research Center, inaugurated on 17 May 2008, extends over a covered area of approximately 2500 square meters, including laboratories, offices, archives, and spaces for the assembly of experimental plants. Outside, an equipped area of approximately 10,000 square meters hosts experimental plants, green areas, and parking lots.
The Sotacarbo headquarters, located in the historic mining area of Serbariu, represents an example of recovery and enhancement of industrial heritage, integrating advanced research activities with the preservation of the historical memory of the territory.
Currently, the building occupies a rectangular footprint area 54 m long and 50 m wide. All the building structures are arranged around an internal courtyard that measures approximately 29 × 30 m, whose two longest sides are connected by a recent structure (Figure 6). The two shortest parallel wings of the building are characterized by sloping roofs, with double-pitched skylights protruding on the rooftop. The six skylights originally ensured optimal lighting and a natural ventilation system, whereas they have currently lost their natural function and are now completely closed with a corrugated sheet.
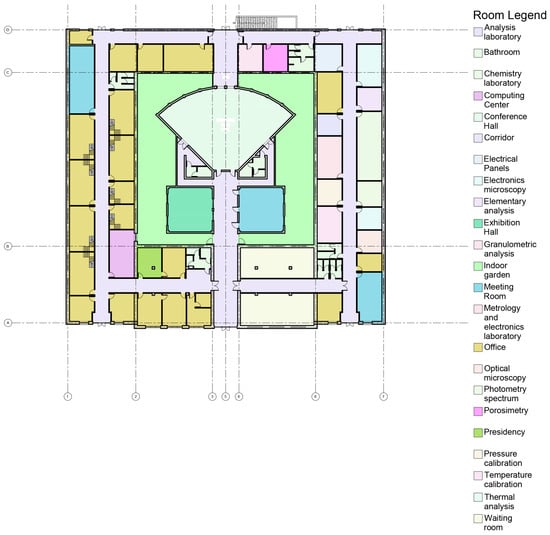
Figure 6.
Sotacarbo headquarters: ground floor plan with room end-uses.
The building structures of the Sotacarbo headquarters can be divided into three main functional blocks based on their use. The first main building block hosts offices, laboratories, as well as an archive, meeting, and conference rooms (as shown in Figure 6).
The offices are double-height rooms, with partially transparent mezzanines. A second block consists of a new building, made of precast reinforced concrete components, designated as a mechanical workshop.
The third and last functional block includes open areas, such as the pilot platform area, which hosts experimental systems and services connected to it, the car parks, as well as access and green areas. The internal courtyard hosts an auditorium with a capacity for about 100 people and related services, an exhibition hall, and a meeting room, all surrounded by a small green area. The auditorium, the exhibition hall, and the meeting room are characterized by more recent construction systems as they date back to the aforementioned relevant renovations that occurred in the early 2000s. In particular, the auditorium structure is made of exposed reinforced concrete columns, infilled with exposed brick rubble-filled masonry, with a ventilated roof supported by glulam beams and a corrugated sheet. The exhibition hall and the meeting room are characterized by the same construction systems as the auditorium structure.
As far as the building envelope is concerned, the perimeter north-east and south-west walls, which are sixty centimeters thick, were built with a double layer of irregular trachyte ashlars with mixed earth and lime grout, according to the building tradition dated back to the Carbonia’s establishment (1939), and plastered both inside and outside. The north-west trachyte wall is fifty centimeters thick and plastered only on the inside. The south-east external wall, dating back to the renovation, is, instead, made of porous bricks and is only thirty centimeters thick. The walls facing the courtyard, again in trachyte, have a thickness of between fifty and fifty-five centimeters. The wall structure characterizing the most recent buildings is, instead, composed of an outer layer, which is twenty centimeters thick with exposed brick masonry and an approximately four centimeters interlaid layer of air, a four-centimeters layer of extruded expanded polystyrene, a further brick masonry stratum which is eight centimeters, and an inner layer of premixed gypsum plaster which is one and a half centimeters.
3.2. Sotacarbo BIM Model Update
In this specific case, since an “As-Built” information model was not available, the experimental work required the implementation of a BIM model of the Sotacarbo headquarters from scratch (shown in Figure 7). Not only was the objective of the information modeling to provide a valid support to the management of real-time collected data, but also to develop a reliable BIM database to assist future energy efficiency interventions. In this perspective, a specific BIM model was implemented and structured to provide a methodologically reliable basis ensuring consistency and completeness of data necessary for performance analyses. The model was designed to meet the needs of a project aimed at improving the building energy efficiency and sustainability. Its systematic arrangement considered both the information requirements related to the definition of the current performance of the building and the representation of data and analyses from monitoring systems. Specifically, the presented information model includes:
- Tailored parameters to collect relevant information concerning installed sensors and related quantities to monitor, according to the proposed methodology (see Section 2.2 and Section 2.3), mainly associated with BIM spatial units (i.e., rooms) but also directly integrated in the parametric virtual prototypes of sensor devices;
- Detailed information modelling of technical components (e.g., detailed layer structure of walls and floors, detailed material properties, etc.) to support performance analysis, such as building energy performance, by also considering alternative retrofitting scenarios. By way of example, type properties concerning the layers’ structure of a perimetral wall are shown in Figure 8;
- Accurate temporal management of the information model through a detailed arrangement of various time phases, enabling an easy comparison between different statuses of the building;
- Specific schedules summarizing well-structured data concerning sensor-equipped rooms, sensor devices, and related assessed quantities (by way of example, room parameters and the related schedule filtered by Boolean parameters that identify sensor-equipped rooms are shown in Figure 9);
- A well-organized Project Browser effectively sorts, groups, and filters views and schedules based on the project phases first, and on view types (structural, false ceiling, and floor plants, elevations, sections, 3D views, and schedules), then, to enable easy analysis and comparisons of different conditions of the building at different stages of its lifecycle.
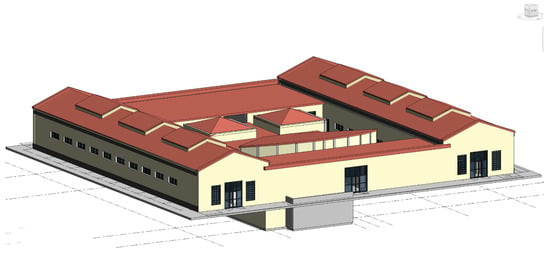
Figure 7.
Sotacarbo BIM model: 3D view.
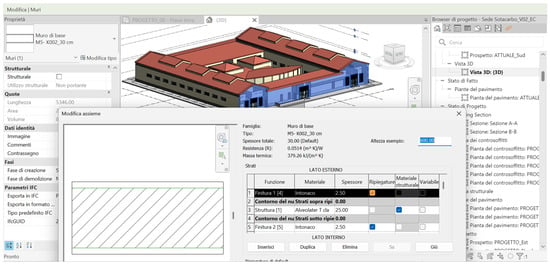
Figure 8.
Sotacarbo BIM model: Wall type properties (detail of the layers structure).
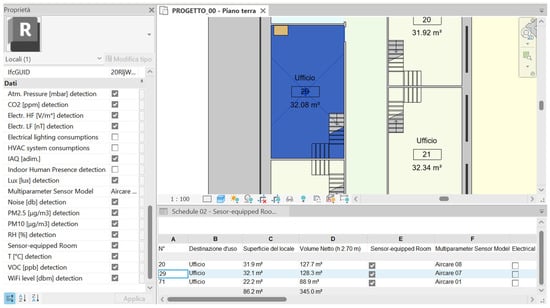
Figure 9.
Sotacarbo BIM model: Rooms parameters and related schedule.
3.3. Integration of the Sotacarbo BIM Model with Sensor Devices
According to the proposed methodology, the BIM model of the case study was equipped with specific parametric objects modelled as virtual prototypes of the IoT sensor devices installed in the physical asset (see Figure 10). At this stage of the presented experimentation, three rooms of the Sotacarbo building were equipped with Aircare multi-parameter sensors, enabling simultaneous real-time monitoring of both comfort and IAQ.
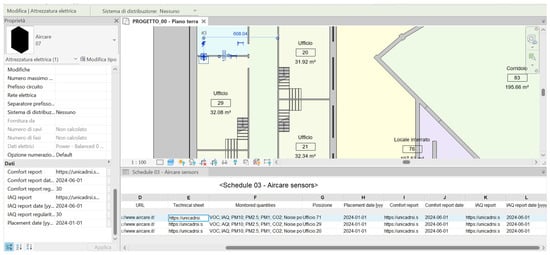
Figure 10.
Sotacarbo BIM model: Aircare sensors instance parameters and schedule.
Consistent with the methodology, IoT sensors have been modelled as simple parametric 3D objects, with non-accurate geometry with respect to the real installed sensors, but closer attention was put on the information set to associate with, in order to allow an effective collection and management of monitoring data.
However, an important clarification needs to be made: even though the monitoring system provides dynamic data on the monitored quantities constantly, a static approach to collect and arrange data in the BIM model was adopted. Therefore, BIM sensor objects (Figure 10) simply collect:
- Both the latest Comfort and IAQ reports made directly accessible through URL links to the related shared HTML documents
- The specific date [yyyy-mm-dd] of the latest report generation
- The regularity [days] of report generation to promptly and easily detect potential delays on data updates.
Additionally, a list of monitored quantities and a URL link to the sensor technical sheet are included in the object type information set (as shown in Figure 11).
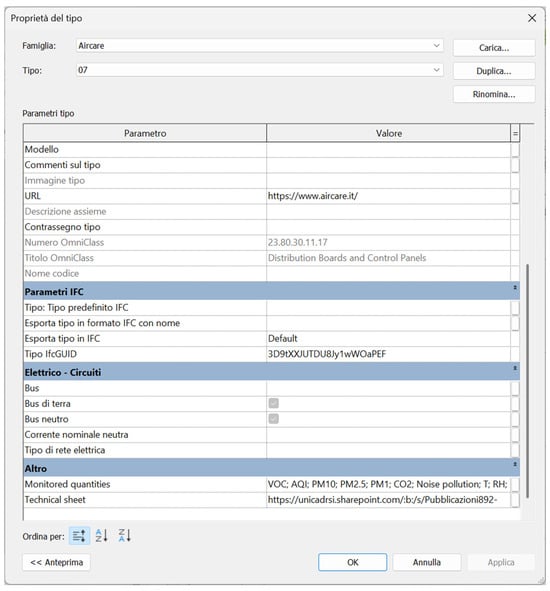
Figure 11.
Sotacarbo BIM model: Aircare sensors type parameters.
It is also worth noting that a well-structured schedule of sensor devices has been integrated in the BIM model (as shown in Figure 10) to systematize and summarize the latest information on real time monitoring more efficiently.
Figure 12 shows an example of direct access from the case study BIM model to one of the two HTML reports integrated through the aforementioned specific URL parameters.
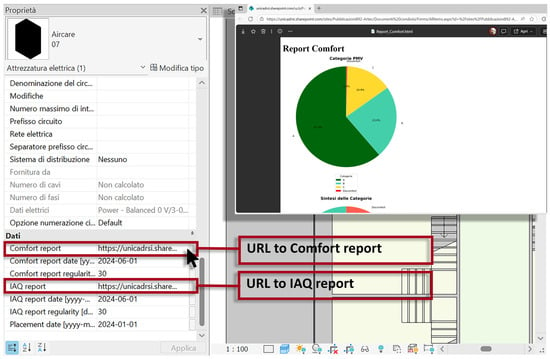
Figure 12.
Sotacarbo BIM model: URL parameters enabling direct access to Comfort and IAQ reports.
3.4. Comfort and IAQ Reports Integrated in the BIM Model
As clearly described in Section 2.4 of the Methodology paragraph, by executing a Python script, specifically implemented for this purpose, two distinct reports resuming comfort and IAQ assessment results are automatically generated in about 33 s, based on collected data regularly extracted in .CSV format from the IoT sensors platform.
As far as the comfort assessment is concerned, the most used indicators for the thermal comfort, which are the so-called PMV (Predicted Mean Vote) index and the PPD (Predicted Percentage Dissatisfied) index, are analytically estimated in accordance with the technical standard ISO 7730:2005 [26] based on monitored values of the air temperature and relative humidity, and on further psychrometric parameters. The PMV index predicts the mean thermal sensation perceived by a group of people in a given space, ranging from −3 to +3, where the value −3 corresponds to a discomfort sensation generated by too cold spaces, whereas +3 refers to too hot perceptions. Based on PMV values, in accordance with the international standard ISO 7730:2005 [26], building spaces can be categorized as follows:
- Class A spaces: −0.2 < PMV < +0.2 (optimal comfort thresholds)
- Class B spaces: −0.5 < PMV < −0.2 or +0.2 < PMV < +0.5 (comfort thresholds)
- Class C spaces: −0.7 < PMV < −0.5 or +0.5 < PMV < +0.7 (moderate discomfort thresholds)
- Spaces with high discomfort: −3.0 < PMV < −0.7 or +0.7 < PMV < +3.0.
Note that PMV values ranging from −0.5 to +0.5 provide the thermal comfort threshold according to the standard. The PPD index non linearly depends on values of the PMV index, as it simply estimates the potential percentage of people who would be dissatisfied with specific thermal conditions. In this regard, according to the standard, even when PMV = 0, at least 5% of dissatisfaction (PPD) must be considered.
It is relevant to note that a full assessment of thermal comfort conditions requires the acquisition of four environmental parameters: air temperature, air humidity, air velocity, and mean radiant temperature. A simplified sensor as the one used in the present research, is able to acquire only the first two quantities. However, as other authors discussed [27], a sufficient approximation of PMV index can be obtained by imposing a mean radiant temperature equal to air temperature and an air velocity equal to 0.1 m/s during winter season and 0.12 m/s during summer season.
The comfort HTML report, automatically generated through the herein proposed Python code, definitely provides resulting charts concerning monthly (see an example in Figure 13) and daily percentages (see an example in Figure 14) of PMV classes representative of the monitored room comfort conditions over the considered time span. Both charts in Figure 13 and Figure 14 may provide useful alerts to allow a facility manager to more in-depth investigate the reasons behind thermal discomfort and promptly carry out effective corrective measures (as shown in Document S1).
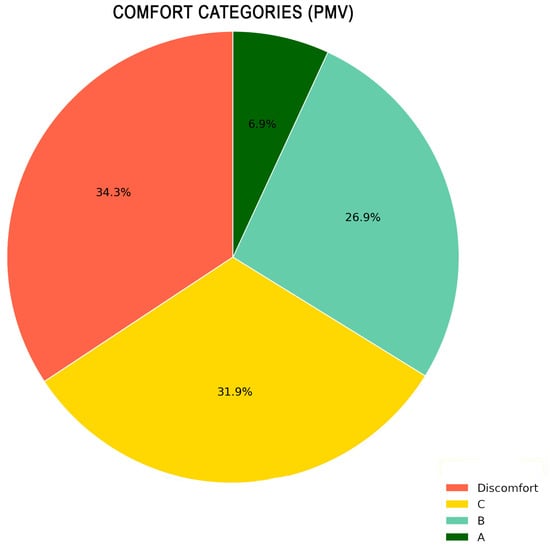
Figure 13.
Example of a pie chart reporting the overall percentages of comfort classes for a monitored space of the case study, referring to a one-month time span.
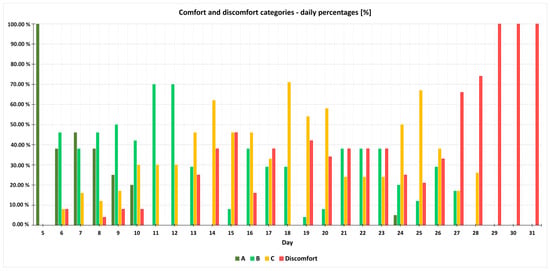
Figure 14.
Daily percentages of comfort classes assessed for a monitored space of the case study.
As far as the IAQ report is concerned, the following thresholds of consistency have been considered in assessing potential critical values of monitored quantities:
- VOC < 100 [μg/m3] excellent, 100 [μg/m3] ≤ VOC ≤ 150 [μg/m3] good, VOC > 150 [μg/m3] inadequate [24]
- IAQ < 100 excellent, 100 ≤ IAQ ≤ 300 good, IAQ > 300 inadequate [24]
- CO2 < 950 [ppm] excellent, 950 [ppm] ≤ CO2 ≤ 1200 [ppm] good, CO2 > 1200 [ppm] inadequate [24]
- PM2.5 < 10 [μg/m3] excellent, 10 [μg/m3] ≤ PM2.5 ≤ 25 [μg/m3] good, PM2.5 > 25 [μg/m3] inadequate [25]
- PM10 < 30 [μg/m3] excellent, 30 [μg/m3] ≤ PM10 ≤ 50 [μg/m3] good, PM10 > 50 [μg/m3] inadequate [25]
- Noise < 40 [dB] excellent, 40 [dB] ≤ Noise ≤ 50 [dB] good, Noise > 50 [dB] inadequate [24].
As far as the CO2 limits are concerned, an important clarification needs to be made: the European standard EN 16798-1:2019 [24], through the second method recommended for the IAQ evaluation, establishes limits for CO2 concentration above outdoor concentration, defining a ΔCO2 upper limit of 800 ppm for the intermediate (II) category. Therefore, the herein considered indoor CO2 upper limit of 1200 ppm was defined assuming an outdoor CO2 concentration of 400 ppm [28]. Additionally, it is worth noting that, even though the adopted IoT multiparameter sensors also enable real-time data acquisition related to the Electrosmog and Wi-Fi levels, such quantities have been excluded from the summary results reported in periodic IAQ reports for a lack of official reference thresholds in European standards.
The generated IAQ report provides hourly values of temperature, relative humidity, PM2.5, PM10, CO2, and VOC reported in line graphs, including the related reference thresholds from international standards. By way of example, the daily mean values of CO2 concentrations referred to approximately a month are reported in Figure 15, also making clear the passing of the related reference threshold.
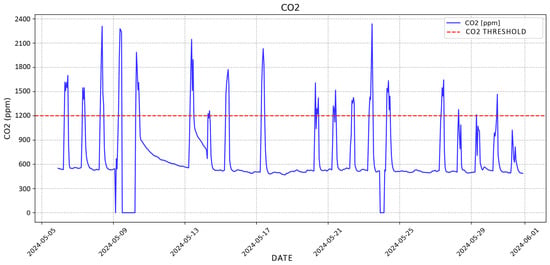
Figure 15.
Hourly values of CO2 concentrations for a monitored space of the case study.
The heatmap in Figure 16 refers to daily mean values of the considered IAQ indicators, based on their adherence to the reference thresholds described above. Note that critical concentrations of VOC for the monitored space emerged from the report (Figure 16), which suggests that ventilation in the monitored space should be improved in order to reduce the risk of health effects due to long-term exposure to VOCs. The heatmap in Figure 16 provides a very intuitive representation of tough times characterized by critical values of any monitored quantity, which may negatively impact IAQ.
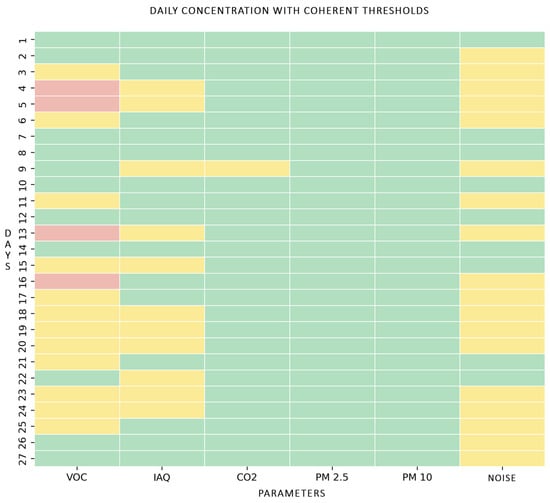
Figure 16.
Heatmap of IAQ indicators’ daily values categorized based on the related adherence level to consistency thresholds (green = excellent, yellow = good, red = low).
Moreover, the final summary chart in Figure 17 reports, for each IAQ indicator, the overall percentages of adherence to the considered reference ranges, thus enabling an easy detection of critical parameters that may compromise IAQ in a specific space.
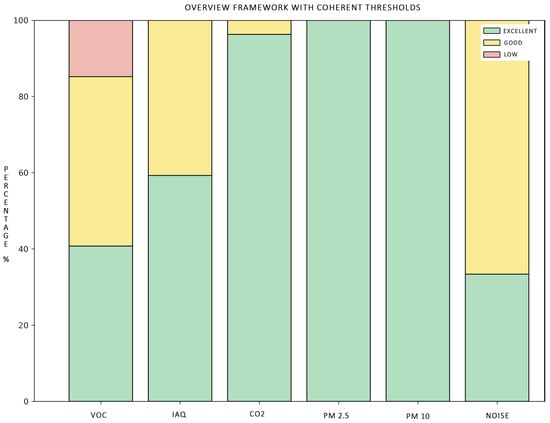
Figure 17.
Final summary chart reporting, for each monitored parameter, the overall percentages of adherence to consistency thresholds.
The monthly reports on thermal comfort and IAQ described herein are very easy to read and understand, as well as easy to manage, as directly accessible through the BIM model, provided that the information model is constantly kept up-to-date. Additionally, the proposed summary reports may provide a valid support to allow facility managers and also unqualified people like building owners to easily interpret monitoring data and promptly undertake corrective actions to improve the indoor air quality of workspaces in the building.
It is worth specifying that graphs and histograms in Figure 13, Figure 14, Figure 15, Figure 16 and Figure 17 are extracted from comfort and IAQ reports referred to May 2024 monitoring data collected for office 71. To be thorough, in Table 1 are reported the percentages of PMV from comfort reports referred to the three offices (20, 29, and 71), which have been monitored from May to September 2024. Additionally, in Table 2 are summarized the overall percentages of adherence of the considered IAQ indicators to the related consistency thresholds (as shown in Document S2).

Table 1.
Summary results on thermal comfort.

Table 2.
Summary results on IAQ: percentage of adherence to consistency thresholds.
As far as thermal comfort monitored conditions in Table 1 are concerned, it is worth noting that only for the office, 71 PMV Discomfort values exceeded 30%. From the data summarized in Table 2 emerged that the monitored values of all IAQ indicators are never inadequate except for VOC, which, in several cases, for all three offices, overcame the critical threshold. Such data thus provide a relevant alert which should suggest the facility manager to carry out proper corrective and preventive actions to avoid VOC values reaching critical values.
4. Discussion
As is common knowledge, the EU climate and energy strategy leverages a paradigm shift in the management of building stock to reduce its environmental impact. However, the improvement of the energy performance of the building stock cannot be considered independently from the improvement of the users’ well-being and health in the indoor spaces. The quality of the indoor environment has a relevant influence on people’s physical and mental well-being and health. Moreover, human professional and cognitive performances are closely linked to the built indoor environment.
From these premises, this study presented a new framework for an effective BIM-IoT integration, not only aimed at supporting an efficient management of dynamic real-time data from IoT-based monitoring, but also at providing a valid decision support tool to enable facility managers to more easily make informed decisions on potential future intervention scenarios.
The state-of-the-art of the matter confirmed a widening adoption of advanced digital technologies such as BIM, IoT, and DTs, often integrated with each other, to optimize building performance not only to pursue sustainability goals but also to enhance indoor air quality and comfort, which have proven to highly affect both human well-being, health, and productivity. More specifically, in support of the operational and maintenance phase of the building life cycle, several studies proposed the use of BIM to store and manage data coming from sensors to assist the complex job of facility managers. However, the studies present very different methodological approaches and applications of the Digital Twin. As an example, Liu et al. [20] presented a Digital Twin for near-zero energy buildings (NZEB), integrating BIM and IoT technologies to optimize building management by reducing building energy consumption through an automated monitoring system. Hosamo et al. [21] proposed the use of Digital Twins for predictive maintenance of HVAC systems in order to overcome the limitations of maintenance management systems by adopting a predictive approach based on real-time data. Hu and Assaad in [22] presented an environmental monitoring system based on autonomous robots and Digital Twin involving the use of mobile robots equipped with IoT sensors to collect data on air quality, temperature, and humidity, and built assets state and performance on core process efficiency in healthcare facilities. Therefore, even though taking advantage of BIM-IoT integrated systems to optimize building operation and maintenance through Digital Twins is a widely investigated matter, this study presents a novel approach considering the use of BIM models as the main sources of knowledge, provided that they are constantly kept up-to-date through regularly generated comfort and IAQ reports based on real-time collected data through IoT multiparameter sensors. Compared to all other studies in the literature, the proposed methodology thus takes advantage of IoT data without integrating them dynamically in the BIM model, firmly believing that integrating instead regular reports in BIM may better support facility managers’ decision-making. The aforementioned summary reports are semi-automatically generated through a specific Python script, which accurately systematizes real-time data series exported to .CSV directly from the IoT sensors, without needing a specific proprietary platform. It is worth noting that the proposed Python code ensures methodology scalability and adaptability, regardless of the adopted IoT sensor type, provided that sensor devices allow for an easy data extraction to .CSV format. The implemented code generates two distinct summary reports, respectively on IAQ and indoor thermal comfort for each sensor-equipped room of the physical asset, provided in an open format (HTML), reporting easy-to-read and analyze summary charts, and made available directly through the specific BIM model URL parameters. The HTML format of reports enhances methodology interoperability as they can be openly visualized from any web browser. The choice of using open and interoperable standards guarantees the scalability of the solution, allowing it to evolve towards continuous and automated monitoring of environmental conditions.
The proposed methodology has been validated through a real case study, a building hosting the Sotacarbo Research Center located in the historic mining site of Serbariu in Carbonia (Sardinia, Italy), whose three pilot offices were equipped with multiparameter sensor devices, to constantly assess several significant parameters affecting the indoor environmental quality such as the indoor temperature, relative humidity, CO2, VOC, PM2.5 and PM10 concentrations, noise, Electrosmog and Wi-Fi pollution level. As described in Section 3 of this paper, the effectiveness of the presented framework turned out to be strongly enhanced by an accurate and rational arrangement of information sets in the BIM model of the case study, especially concerning spatial units and sensor devices. More specifically, the BIM model was equipped with specific, tailored parameters and related well-structured tabular schedules to easily detect sensor-equipped rooms, to provide easily accessible information on sensors installed in the physical asset, as well as to store updated information on indoor conditions of monitored spaces through an integration of the semi-automatically generated IEQ reports.
Notwithstanding that all parameters mentioned above are constantly acquired over time, a static approach for data management was preferred and adopted by integrating recurring summary reports in the BIM model of the case study in order to ease data understanding through such snapshots of the IEQ conditions of the monitored spaces and more effectively support facility managers’ decision-making.
The proposed workflow, although adopting a static approach in data management, was designed to be easily extendable to a dynamic system in the future by fully automating report generation and updates based on dynamic real-time data. This static approach may be considered, in fact, the main novelty introduced by the proposed methodology, as even though real-time data are not definitely stored in the BIM model, the latter provides a reliable decision support basis anyhow, thanks to the integrated and constantly updated reports on IEQ conditions of the monitored rooms. It is also worth specifying that the proposed final reports not only summarize collected data from IoT devices referred to a specific time span but also include intuitive comparisons among the acquired values and related reference thresholds from international standards to ease data interpretation and enable a prompt detection of potential critical issues to face, thus lending additional novelty to the presented approach.
For the purpose of illustrating the efficacy of the proposed framework as a valid decision support system, as real-time collected data from IoT sensors resulted to have achieving critical PMV values related to thermal discomfort conditions in several cases, the facility manager should investigate the nature and the reasons of such discomfort conditions. As PMV values by themselves do not provide any information on the nature of thermal discomfort, the facility manager should first analyze temperature and relative humidity values from .CSV data series extracted from IoT sensors in order to trace back to the origin of thermal discomfort and then carry out corrective and preventive measures, assessing HVAC systems’ efficiency and regulation.
As far as the IAQ assessment is concerned, data in Table 2 showed that VOC concentration may very easily reach critical values that should be kept under strict control. Therefore, to take full advantage of IAQ reports integrated into BIM models, the facility manager should carefully analyze VOC hourly values to identify critical hours and days in which VOC concentrations tend to overcome the alert threshold and then carry out preventive and corrective measures to counteract such trends, optimizing ventilation strategies. By way of example, as a preventive measure, the facility manager may also consider increasing the frequency of report generation to more effectively monitor indoor environmental quality and enhance workers’ well-being. Furthermore, in case any IEQ indicator turned out to reach critical values emerged from reported, the facility manager should also investigate whether office workers’ behavior is adequate in order to promptly intervene through proper educational programs.
5. Conclusions
The present study introduces a new methodological framework integrating BIM and IoT data related to IEQ indicators assessed in real-time to provide an effective decision support tool for facility managers and designers. The proposed method relies on a static approach centered on the integration of monthly generated reports on thermal comfort and IAQ into BIM models in order to ease data understanding through such snapshots of the IEQ conditions of the monitored spaces and more effectively support facility managers’ decision-making. The validation of the proposed framework on a real case study proved its effectiveness, robustness, and adaptability, mainly ensured by the appeal to a highly flexible Python script (specifically implemented for the research objective), as well as to standard and interoperable open formats.
To sum up, the HTML periodic reports on thermal comfort and IAQ indicators integrated in the BIM model are indeed the core of the proposed workflow, as they are fully accessible and they may effectively support facility managers’ decision making thanks to the intuitive representation of tabular and graphical data providing a comprehensive overview of the monitored environmental conditions. The choice of HTML format guarantees smooth navigation and optimal viewing from any device (multi-platform compatibility), allowing all stakeholders to have immediate access to the most up-to-date information and support data-driven decisions. Additionally, the integration of the reports generated by the algorithm within BIM models facilitates the work of designers, facility managers, and engineers who try to monitor and optimize the building performance. The availability of up-to-date data and detailed reports enables informed decisions to improve occupants’ comfort and health.
Although such integration of BIM and IoT toward a Digital Twin application may enable more efficient and sustainable management of assets, some limitations still affect this research. First of all, the main limitation concerns the reports generation, which is not fully automated yet, as the implemented process requires an expert to regularly extract monitoring data from IoT sensors and use them as input data to generate the HTML reports through the presented Python algorithm. Future research developments may therefore be focused on making the methodology more efficient, reducing human dependency. Additionally, openness and interoperability in the proposed framework may be highly enhanced by considering a future integration of IEQ reports directly on property sets of open BIM models, such as IFC or BCF, instead of resorting to shared URL parameters. Another relevant limitation is related to the lack of energy consumption data from the IoT sensor system put in place in the first step of this ongoing research. Moreover, no indicator of HVAC systems’ performance is automatically assessed. The future developments of the research should therefore extend real-time data acquisition to also energy consumption data and indicators of HVAC systems efficiency through dedicated sensors in order to allow facility managers to balance different aspects such as human well-being and health with the energy behavior and consumption of the buildings. Another significant limitation affecting this study lies in the missing occupancy tracking system, which would provide relevant information on the real state of use of monitored workspaces, affecting thermal comfort and IAQ indicators. Future developments of the present research will therefore also consider associating IEQ indicator values with real-time occupancy data to enhance data interpretation in reports. To conclude, only three offices over the whole building chosen as a case study were equipped with IoT sensors and underwent the methodology validation.
Although the huge amount of real-time data handled through Digital Twin systems commonly entails high risks related to data security and privacy, the proposed static approach reduces such risks as real-time data are properly and anonymously aggregated into summary graphs inserted in HTML reports integrated in BIM models whereas raw data series from sensors are not directly accessible through the BIM model but only manageable through a specific platform with authorized access.
Notwithstanding the underlined benefits derived from such a static approach integrating BIM with IoT data through open reports, to take full advantage of collecting such valuable data in real-time, the proposed framework should be further developed by also considering using the huge amount of data coming from sensors to progressively train predictive models. This potential advancement in the methodology would enable the generation of IEQ reports not only based on real data but also on predicted realistic scenarios to allow facility managers and building owners to promptly adopt preventive measures to more efficiently manage the existing building stock.
Supplementary Materials
The following supporting information can be downloaded at: https://www.mdpi.com/article/10.3390/app151910444/s1, Document S1: Sample of a comfort report; Document S2: Sample of an IAQ report; Document S3: Python script for report generation.
Author Contributions
Conceptualization, G.D. and E.Q.; methodology, E.C., G.D., E.Q. and G.R.; software, G.R.; validation, E.C., G.D., E.Q. and G.R.; investigation, F.P.; formal analysis, G.R.; writing—original draft preparation, E.C., G.D. and E.Q.; writing—review and editing, E.C., G.D. and E.Q.; visualization, E.C., E.Q. and G.R.; supervision, G.D. and E.Q.; project administration, G.D. and E.Q.; funding acquisition, G.D. and E.Q. All authors have read and agreed to the published version of the manuscript.
Funding
This research was funded by the Italian Ministry of Environment and Energy Security in the frame of “Piano Triennale della ricerca di sistema del settore elettrico nazionale per il triennio 2022–2024”, Progetto 1.5 “Edifici ad alta efficienza per la transizione energetica”.
Institutional Review Board Statement
Not applicable.
Informed Consent Statement
Not applicable.
Data Availability Statement
The original contributions presented in this study are included in the article/Supplementary Materials. Further inquiries can be directed to the corresponding author.
Conflicts of Interest
Author Francesca Poggi were employed by the company Sotacarbo S.p.A., 09013 Carbonia, Italy. The remaining authors declare that the research was conducted in the absence of any commercial or financial relationships that could be construed as a potential conflict of interest.
Abbreviations
The following abbreviations are used in this manuscript:
| AEC | Architecture, Engineering and Construction |
| AECO | Architecture, Engineering, Construction and Operation |
| AFDD | Automated Fault Detection and Diagnostics |
| AHUs | Air Handling Units |
| ANN | Artificial Neural Networks |
| BCF | BIM Collaboration Format |
| BIM | Building Information Modelling |
| DES | Discrete Event Simulation |
| DT | Digital Twin |
| FM | Facility Management |
| HF | High Frequency |
| HTML | Hypertext Markup Language |
| HVAC | Heating, Ventilation and Air Conditioning |
| IAQ | Indoor Air Quality |
| IEQ | Indoor Environmental Quality |
| IFC | Industry Foundation Classes |
| IoT | Internet of Things |
| LF | Low Frequency |
| NZEB | Near-Zero Energy Buildings |
| PM2.5 | Particulate Matter (2.5 μm) |
| PM10 | Particulate Matter (10 μm) |
| PMV | Predicted Mean Vote |
| PPD | Predicted Percentage Dissatisfied |
| SLAM | Simultaneous Localization and Mapping |
| SVM | Support-Vector Machines |
| UWB | Ultra-Wideband |
| VOC | Volatile Organic Compounds |
References
- Persiani, S.G.L.; Kobas, B.; Koth, S.C.; Auer, T. Biometric Data as Real-Time Measure of Physiological Reactions to Environmental Stimuli in the Built Environment. Energies 2021, 14, 232. [Google Scholar] [CrossRef]
- Klepeis, N.E.; Ott, W.; Klepeis, N.E.; Nelson, W.C.; Ott, W.R.; Robinson, J.P.; Tsang, A.M.; Switzer, P.; Behar, J.V.; Hern, S.C.; et al. The National Human Activity Pattern Survey (NHAPS): A Resource for Assessing Exposure to Environmental Pollutants. J. Expo. Sci. Environ. Epidemiol. 2001, 11, 231–252. [Google Scholar] [CrossRef]
- Qian, Y.; Leng, J.; Zhou, K.; Liu, Y. How to Measure and Control Indoor Air Quality Based on Intelligent Digital Twin Platforms: A Case Study in China. Build. Environ. 2024, 253, 111349. [Google Scholar] [CrossRef]
- Wang, X.; Li, D.; Menassa, C.C.; Kamat, V.R. Investigating the Effect of Indoor Thermal Environment on Occupants’ Mental Workload and Task Performance Using Electroencephalogram. Build. Environ. 2019, 158, 120–132. [Google Scholar] [CrossRef]
- Zhang, X.; Wargocki, P.; Lian, Z.; Thyregod, C. Effects of Exposure to Carbon Dioxide and Bioeffluents on Perceived Air Quality, Self-Assessed Acute Health Symptoms, and Cognitive Performance. Indoor Air 2017, 27, 47–64. [Google Scholar] [CrossRef]
- Chen, C.F.; Yilmaz, S.; Pisello, A.L.; De Simone, M.; Kim, A.; Hong, T.; Bandurski, K.; Bavaresco, M.V.; Liu, P.L.; Zhu, Y. The Impacts of Building Characteristics, Social Psychological and Cultural Factors on Indoor Environment Quality Productivity Belief. Build. Environ. 2020, 185, 107189. [Google Scholar] [CrossRef]
- Schweigkofler, A.; Braholli, O.; Akro, S.; Siegele, D.; Penna, P.; Marcher, C.; Tagliabue, L. Digital Twin as Energy Management Tool through IoT and BIM Data Integration. In Proceedings of the 14th REHVA HVAC World Congress, Rotterdam, The Netherlands, 22–25 May 2022. [Google Scholar] [CrossRef]
- Volk, R.; Stengel, J.; Schultmann, F. Building Information Modeling (BIM) for Existing Buildings—Literature Review and Future Needs. Autom. Constr. 2014, 38, 109–127. [Google Scholar] [CrossRef]
- Tsay, G.S.; Staub-French, S.; Poirier, É. BIM for Facilities Management: An Investigation into the Asset Information Delivery Process and the Associated Challenges. Appl. Sci. 2022, 12, 9542. [Google Scholar] [CrossRef]
- Kassem, M.; Kelly, G.; Dawood, N.; Serginson, M.; Lockley, S. BIM in Facilities Management Applications: A Case Study of a Large University Complex. Built Environ. Proj. Asset Manag. 2015, 5, 261–277. [Google Scholar] [CrossRef]
- Tsay, G.S.; Staub-French, S.; Poirier, E.; Zadeh, P.; Pottinger, R. BIM for FM: Understanding Information Quality Issues in Terms of Compliance with Owner’s Building Information Modeling Requirements. Front. Built Environ. 2023, 9, 1117066. [Google Scholar] [CrossRef]
- Matarneh, S.T.; Danso-Amoako, M.; Al-Bizri, S.; Gaterell, M.; Matarneh, R.T. BIM for FM: Developing Information Requirements to Support Facilities Management Systems. Facilities 2019, 38, 378–394. [Google Scholar] [CrossRef]
- Peng, Y.; Au-Yong, C.P.; Myeda, N.E. Knowledge Graph of Building Information Modelling (BIM) for Facilities Management (FM). Autom. Constr. 2024, 165, 105492. [Google Scholar] [CrossRef]
- National Institute of Building Sciences. National BIM Guide for Owners; National Institute of Building Sciences: Washington, DC, USA, 2017. [Google Scholar]
- Kaashi, S.; Vilventhan, A. Development of a Building Information Modelling Based Decision-Making Framework for Green Retrofitting of Existing Buildings. J. Build. Eng. 2023, 80, 108128. [Google Scholar] [CrossRef]
- Wanigarathna, N.; Jones, K.; Bell, A.; Kapogiannis, G. Building Information Modelling to Support Maintenance Management of Healthcare Built Assets. Facilities 2019, 37, 415–434. [Google Scholar] [CrossRef]
- Muta, L.F.; Melo, A.P.; Lamberts, R. Enhancing Energy Performance Assessment and Labeling in Buildings: A Review of BIM-Based Approaches. J. Build. Eng. 2025, 103, 112089. [Google Scholar] [CrossRef]
- Matos, R.; Rodrigues, H.; Costa, A.; Rodrigues, F. Building Condition Indicators Analysis for BIM-FM Integration. Arch. Comput. Methods Eng. 2022, 29, 3919–3942. [Google Scholar] [CrossRef]
- Tang, S.; Shelden, D.R.; Eastman, C.M.; Pishdad-Bozorgi, P.; Gao, X. A Review of Building Information Modeling (BIM) and the Internet of Things (IoT) Devices Integration: Present Status and Future Trends. Autom. Constr. 2019, 101, 127–139. [Google Scholar] [CrossRef]
- Liu, Z.; Li, M.; Ji, W. Development and Application of a Digital Twin Model for Net Zero Energy Building Operation and Maintenance Utilizing BIM-IoT Integration. Energy Build. 2025, 328, 115170. [Google Scholar] [CrossRef]
- Hosamo, H.H.; Svennevig, P.R.; Svidt, K.; Han, D.; Nielsen, H.K. A Digital Twin Predictive Maintenance Framework of Air Handling Units Based on Automatic Fault Detection and Diagnostics. Energy Build. 2022, 261, 111988. [Google Scholar] [CrossRef]
- Hu, X.; Assaad, R.H. A BIM-Enabled Digital Twin Framework for Real-Time Indoor Environment Monitoring and Visualization by Integrating Autonomous Robotics, LiDAR-Based 3D Mobile Mapping, IoT Sensing, and Indoor Positioning Technologies. J. Build. Eng. 2024, 86, 108901. [Google Scholar] [CrossRef]
- Moretti, N.; Chan, Y.C.; Nakaoka, M.; Mukherjee, A.; Merino, J.; Parlikad, A.K. Data Integration for Space-Aware Digital Twins of Hospital Operations. Autom. Constr. 2025, 176, 106276. [Google Scholar] [CrossRef]
- EN 16798-1:2019; Energy Performance of Buildings—Ventilation for Buildings—Part 1: Indoor Environmental Input Parameters for Design and Assessment of Energy Performance of Buildings Addressing Indoor Air Quality, Thermal Environment, Lighting and Acoustics—Module M1-6. European Committee for Standardization (CEN): Brussels, Belgium, 2019.
- WHO (World Health Organization). Particulate Matter (PM2.5 and PM10), Ozone, Nitrogen Dioxide, Sulfur Dioxide and Carbon Monoxide. In WHO Global Air Quality Guidelines; WHO: Geneva, Switzerland, 2021. [Google Scholar]
- ISO 7730:2005(E); Ergonomics of the Thermal Environment—Analytical Determination and Interpretation of Thermal Comfort Using Calculation of the PMV and PPD Indices and Local Thermal Comfort. International Organization for Standardization (ISO): Geneva, Switzerland, 2005.
- d’Ambrosio Alfano, F.R.; Palella, B.I.; Riccio, G. The Role of Measurement Accuracy on the Thermal Environment Assessment by Means of PMV Index. Build. Environ. 2011, 46, 1361–1369. [Google Scholar] [CrossRef]
- Babich, F.; Torriani, G.; Corona, J.; Lara-Ibeas, I. Comparison of Indoor Air Quality and Thermal Comfort Standards and Variations in Exceedance for School Buildings. J. Build. Eng. 2023, 71, 106405. [Google Scholar] [CrossRef]
Disclaimer/Publisher’s Note: The statements, opinions and data contained in all publications are solely those of the individual author(s) and contributor(s) and not of MDPI and/or the editor(s). MDPI and/or the editor(s) disclaim responsibility for any injury to people or property resulting from any ideas, methods, instructions or products referred to in the content. |
© 2025 by the authors. Licensee MDPI, Basel, Switzerland. This article is an open access article distributed under the terms and conditions of the Creative Commons Attribution (CC BY) license (https://creativecommons.org/licenses/by/4.0/).