Author Contributions
Conceptualization, T.M., J.M. and F.S.; methodology, T.M., J.M. and F.S.; software, T.M., J.M. and F.S.; validation, T.M., J.M. and F.S.; formal analysis, T.M., investigation, T.M.; resources, T.M., J.M. and F.S.; data curation, T.M., J.M. and F.S.; writing—original draft preparation, T.M.; writing—review and editing, T.M., J.M. and F.S.; visualization, T.M., J.M. and F.S.; supervision, J.M. and F.S.; project administration, J.M. and F.S.; funding acquisition, T.M., J.M. and F.S. All authors have read and agreed to the published version of the manuscript.
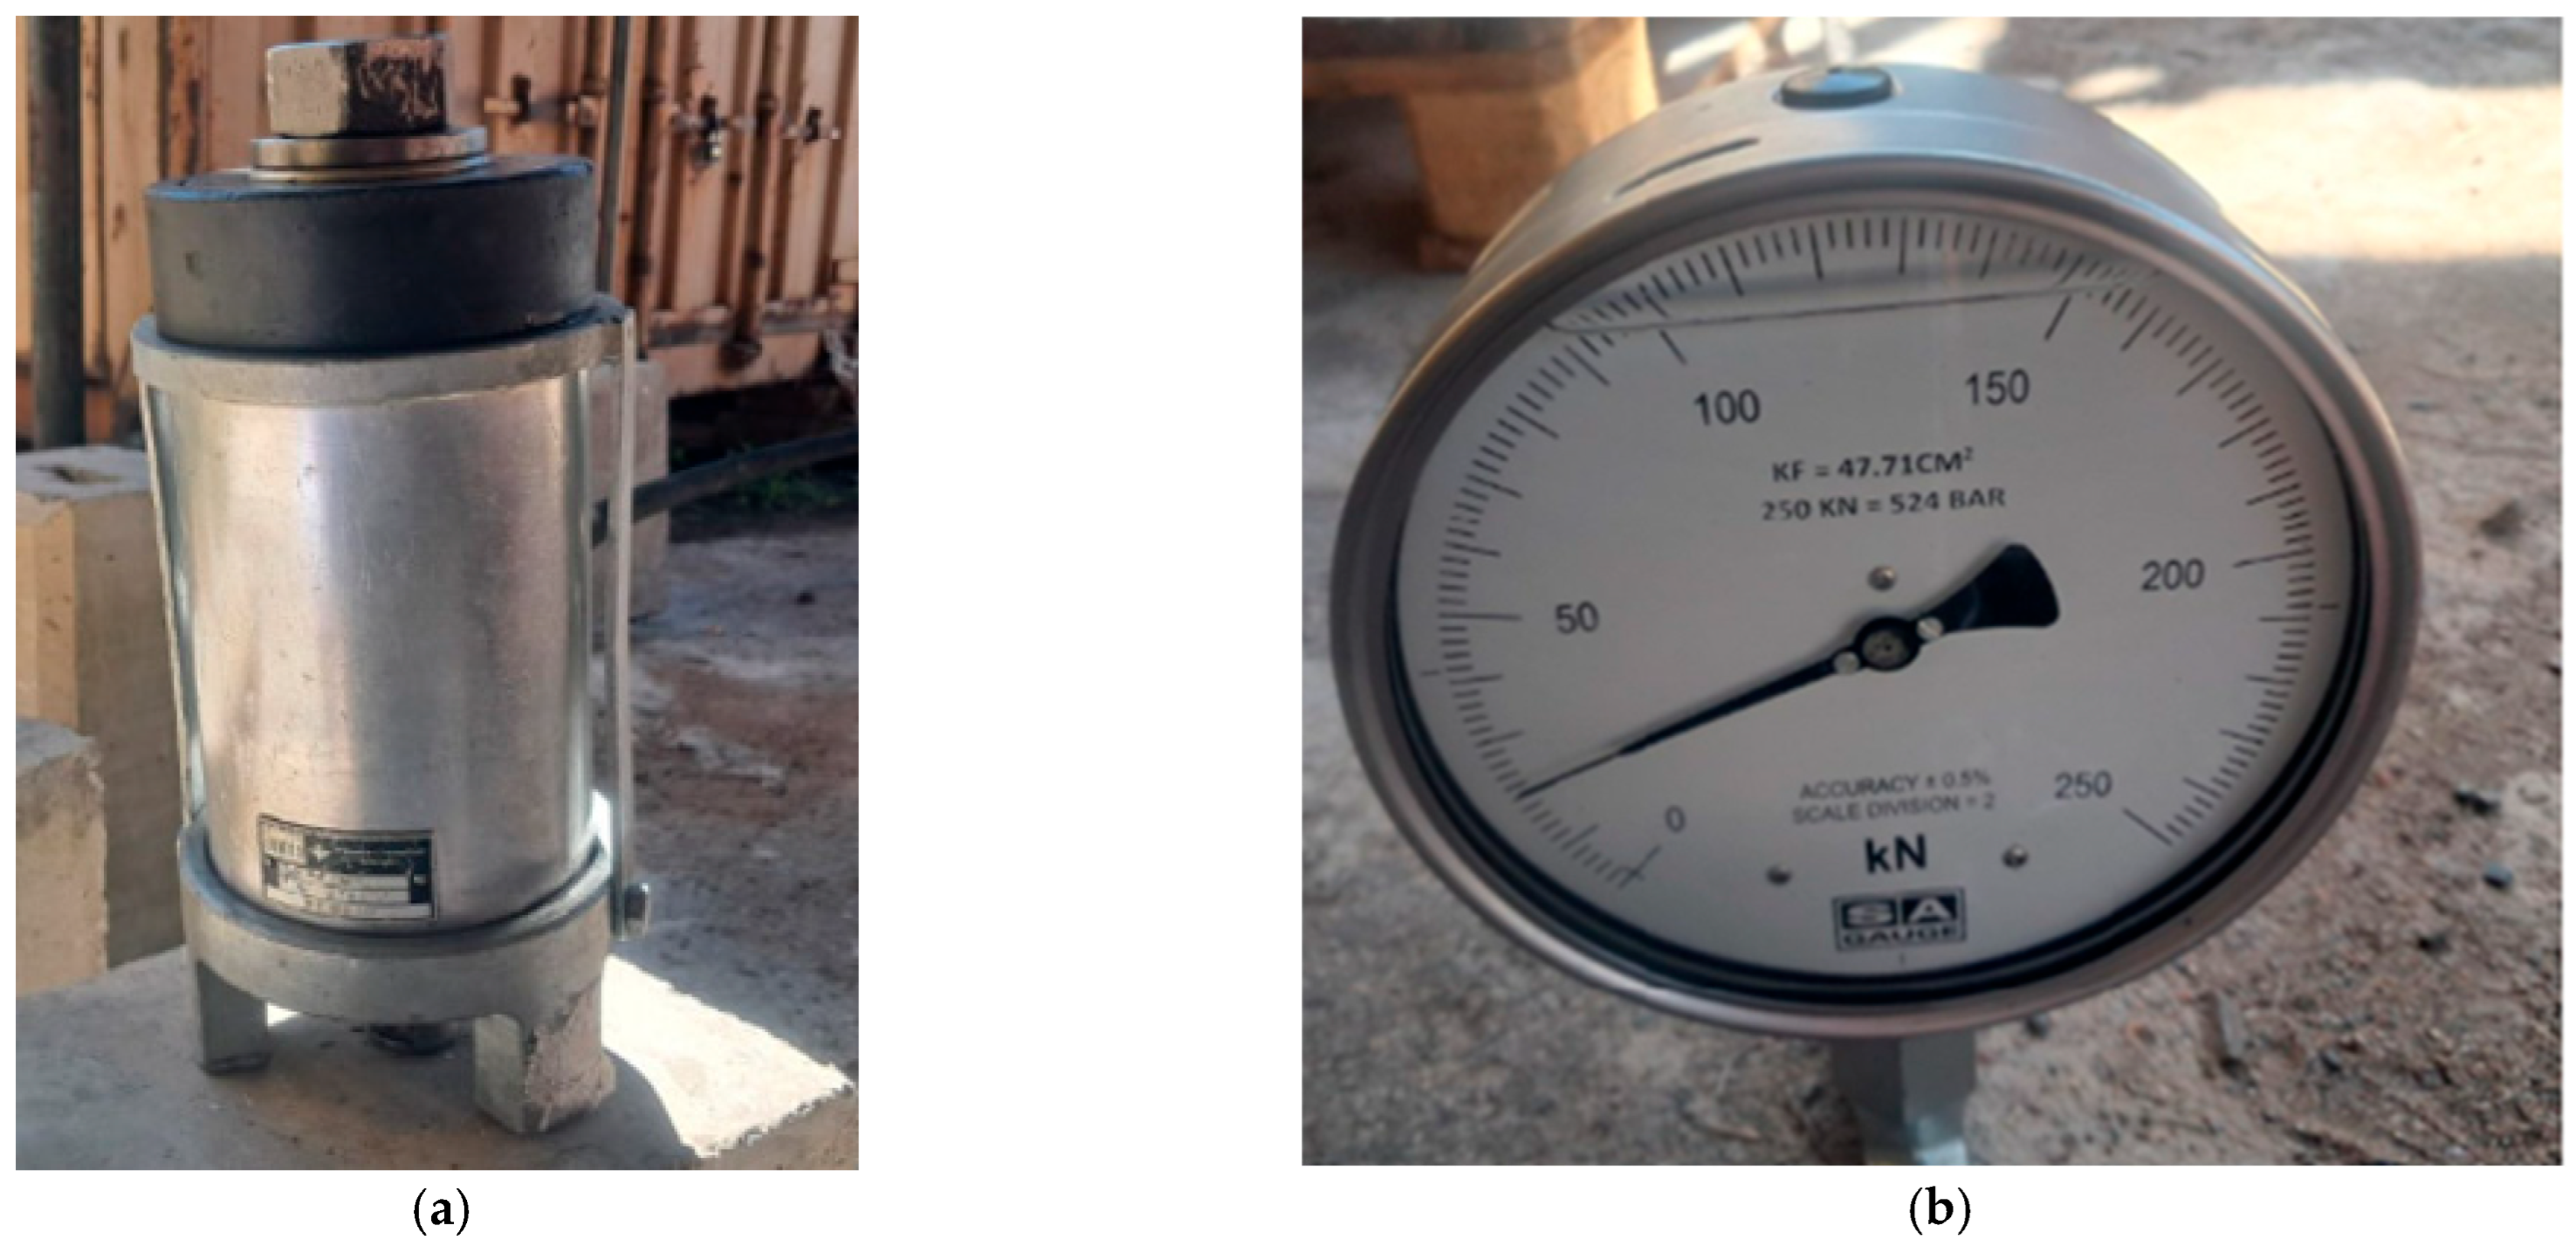
Figure 1.
Pull-out test apparatus. (a) Tripod pull-out rig, and (b) calibrated 250 kN pressure gauge.
Figure 1.
Pull-out test apparatus. (a) Tripod pull-out rig, and (b) calibrated 250 kN pressure gauge.
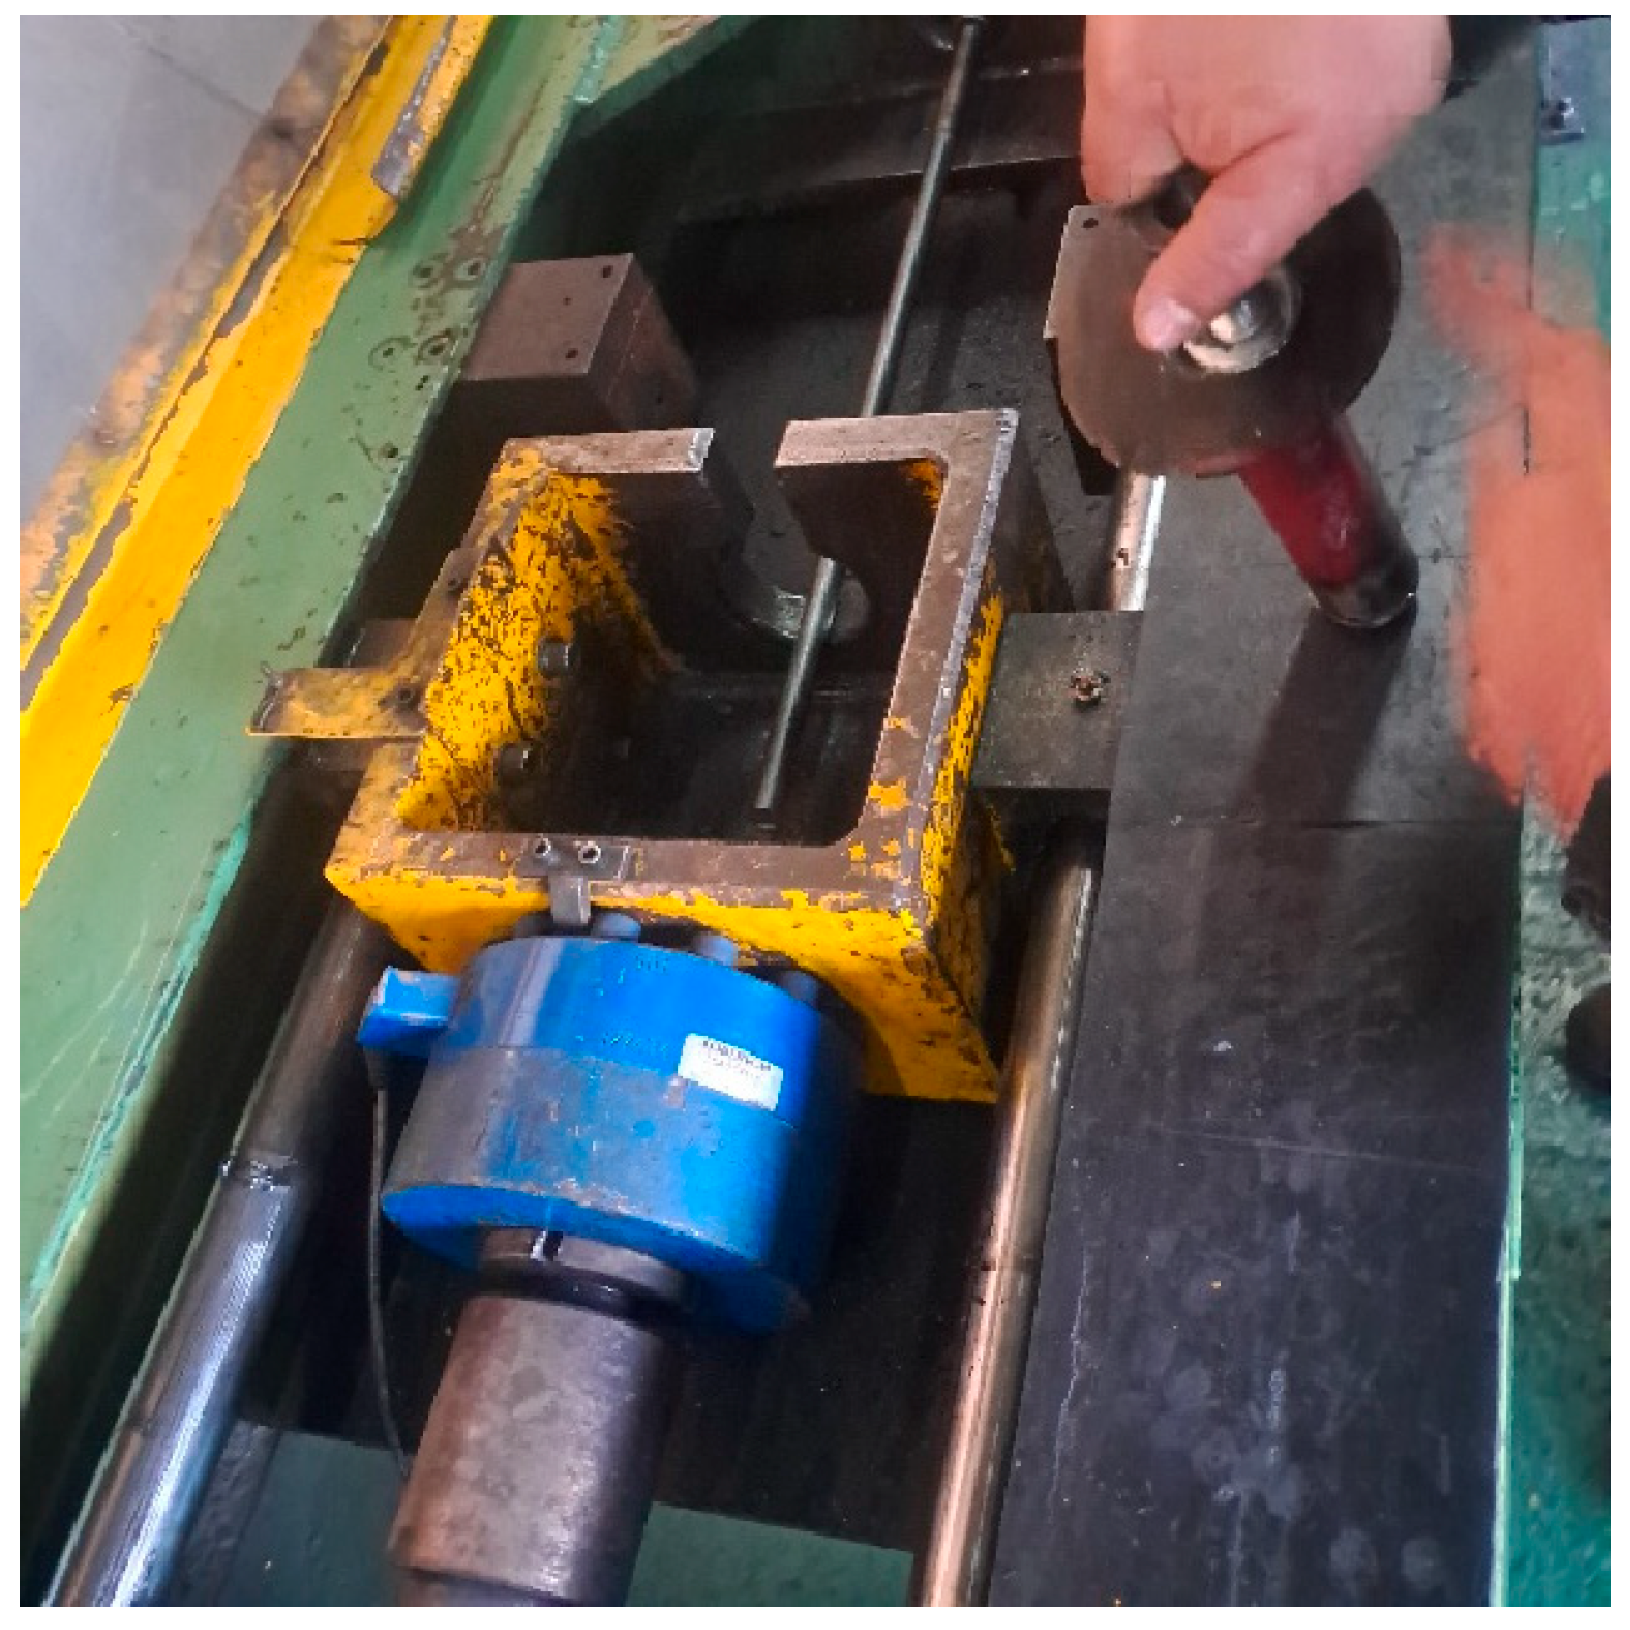
Figure 2.
Field static pull-out test setup at Videx Mining Facility.
Figure 2.
Field static pull-out test setup at Videx Mining Facility.
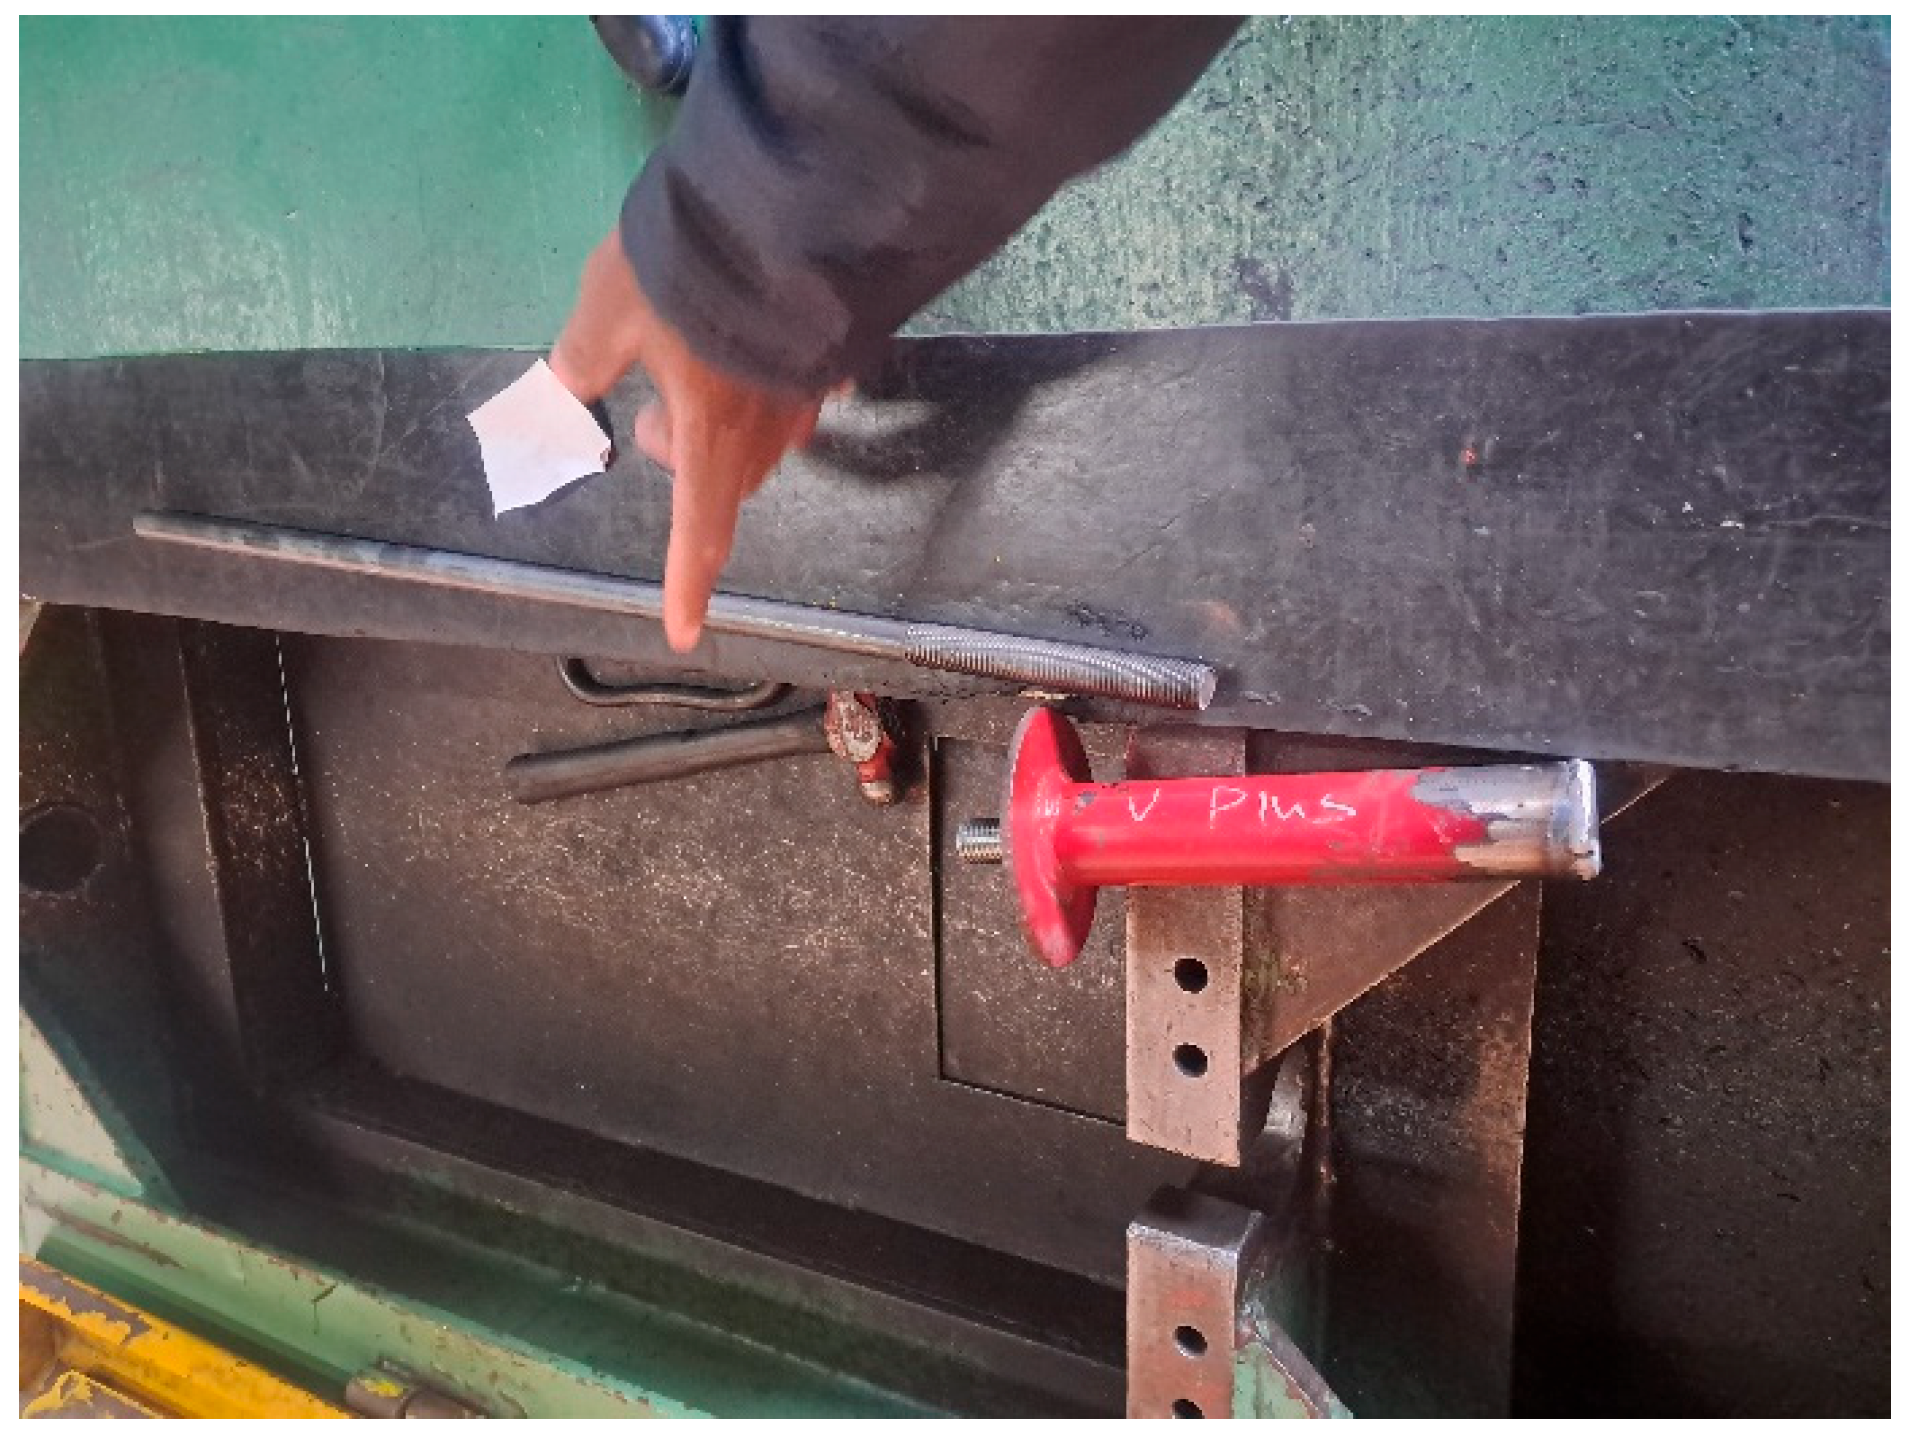
Figure 3.
Installed bolt prior to testing.
Figure 3.
Installed bolt prior to testing.
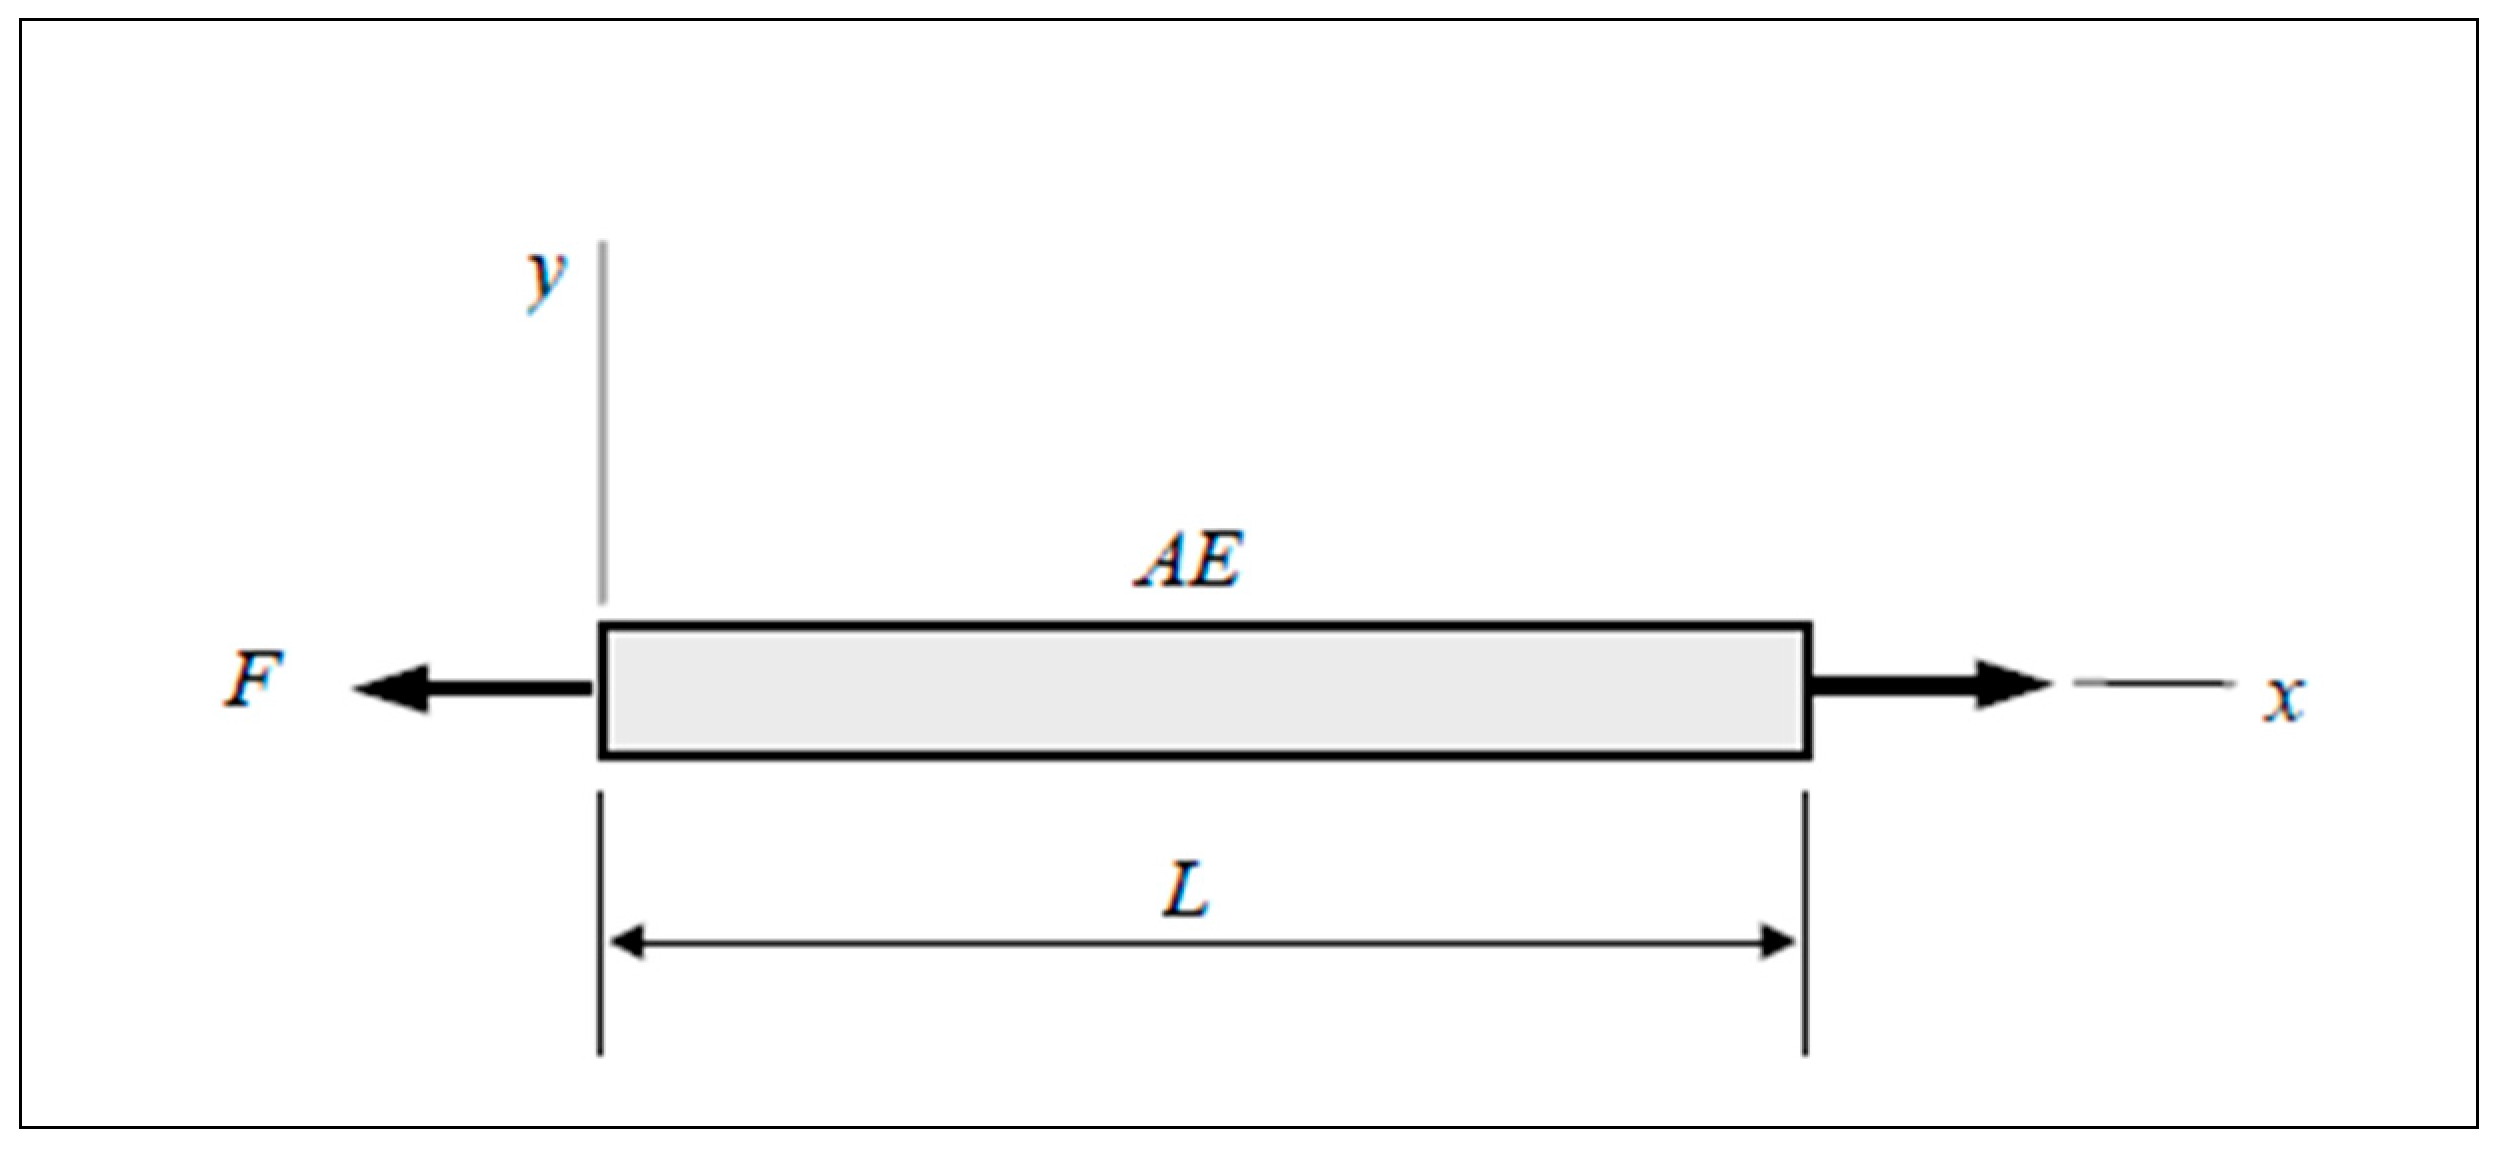
Figure 4.
Pull-out test setup (schematic prepared by Hoek and Brown [
45]).
Figure 4.
Pull-out test setup (schematic prepared by Hoek and Brown [
45]).
Figure 5.
Anchor installation procedure (schematic prepared by Hoek and Brown [
45]).
Figure 5.
Anchor installation procedure (schematic prepared by Hoek and Brown [
45]).
Figure 6.
Rock mass simulation model (schematic prepared by Hoek and Brown [
45]).
Figure 6.
Rock mass simulation model (schematic prepared by Hoek and Brown [
45]).
Figure 7.
Stress distribution around bonded anchor (adapted from Farmer [
50]).
Figure 7.
Stress distribution around bonded anchor (adapted from Farmer [
50]).
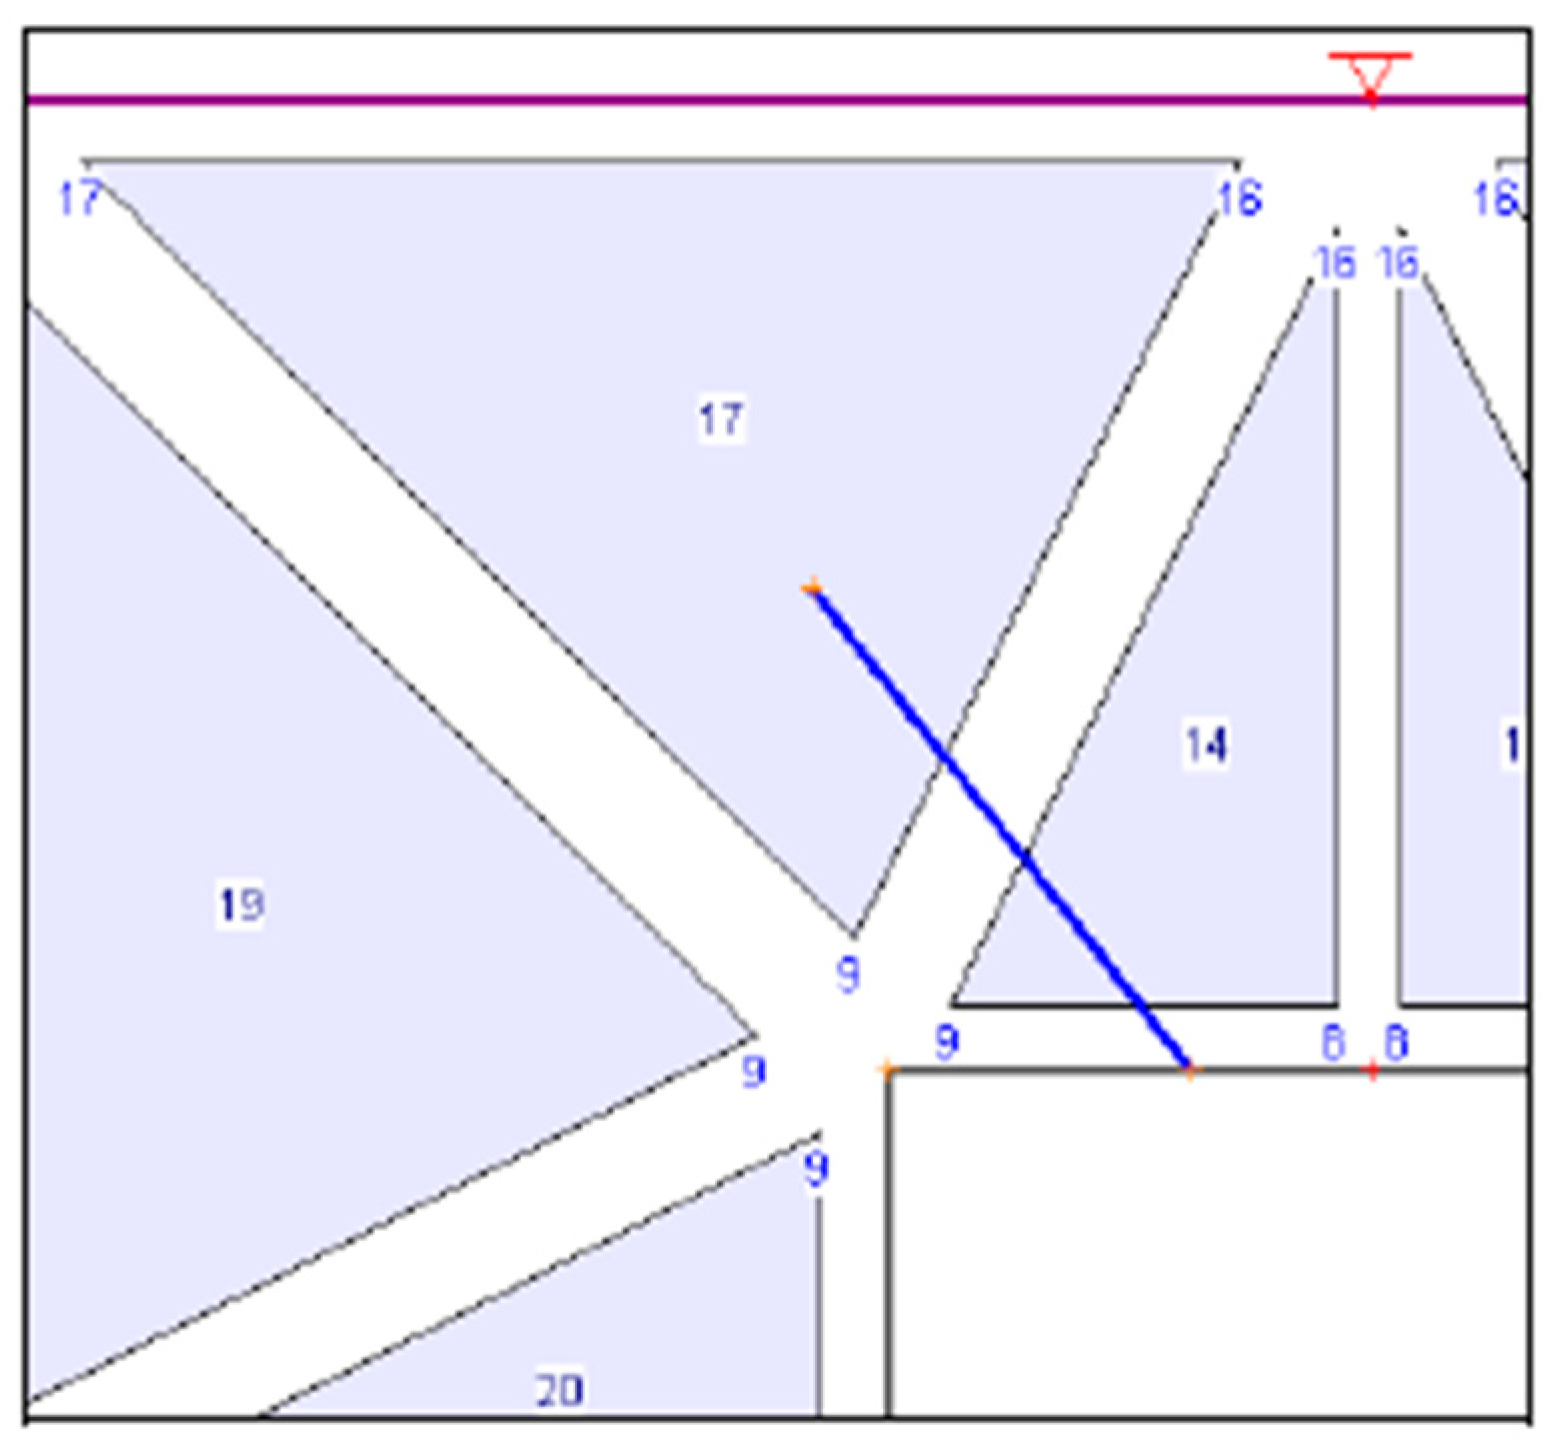
Figure 8.
Example of mesh and bolt configuration for Phase 2 simulation.
Figure 8.
Example of mesh and bolt configuration for Phase 2 simulation.
Figure 9.
Simulated force distribution and displacement field in the Phase 2 model.
Figure 9.
Simulated force distribution and displacement field in the Phase 2 model.
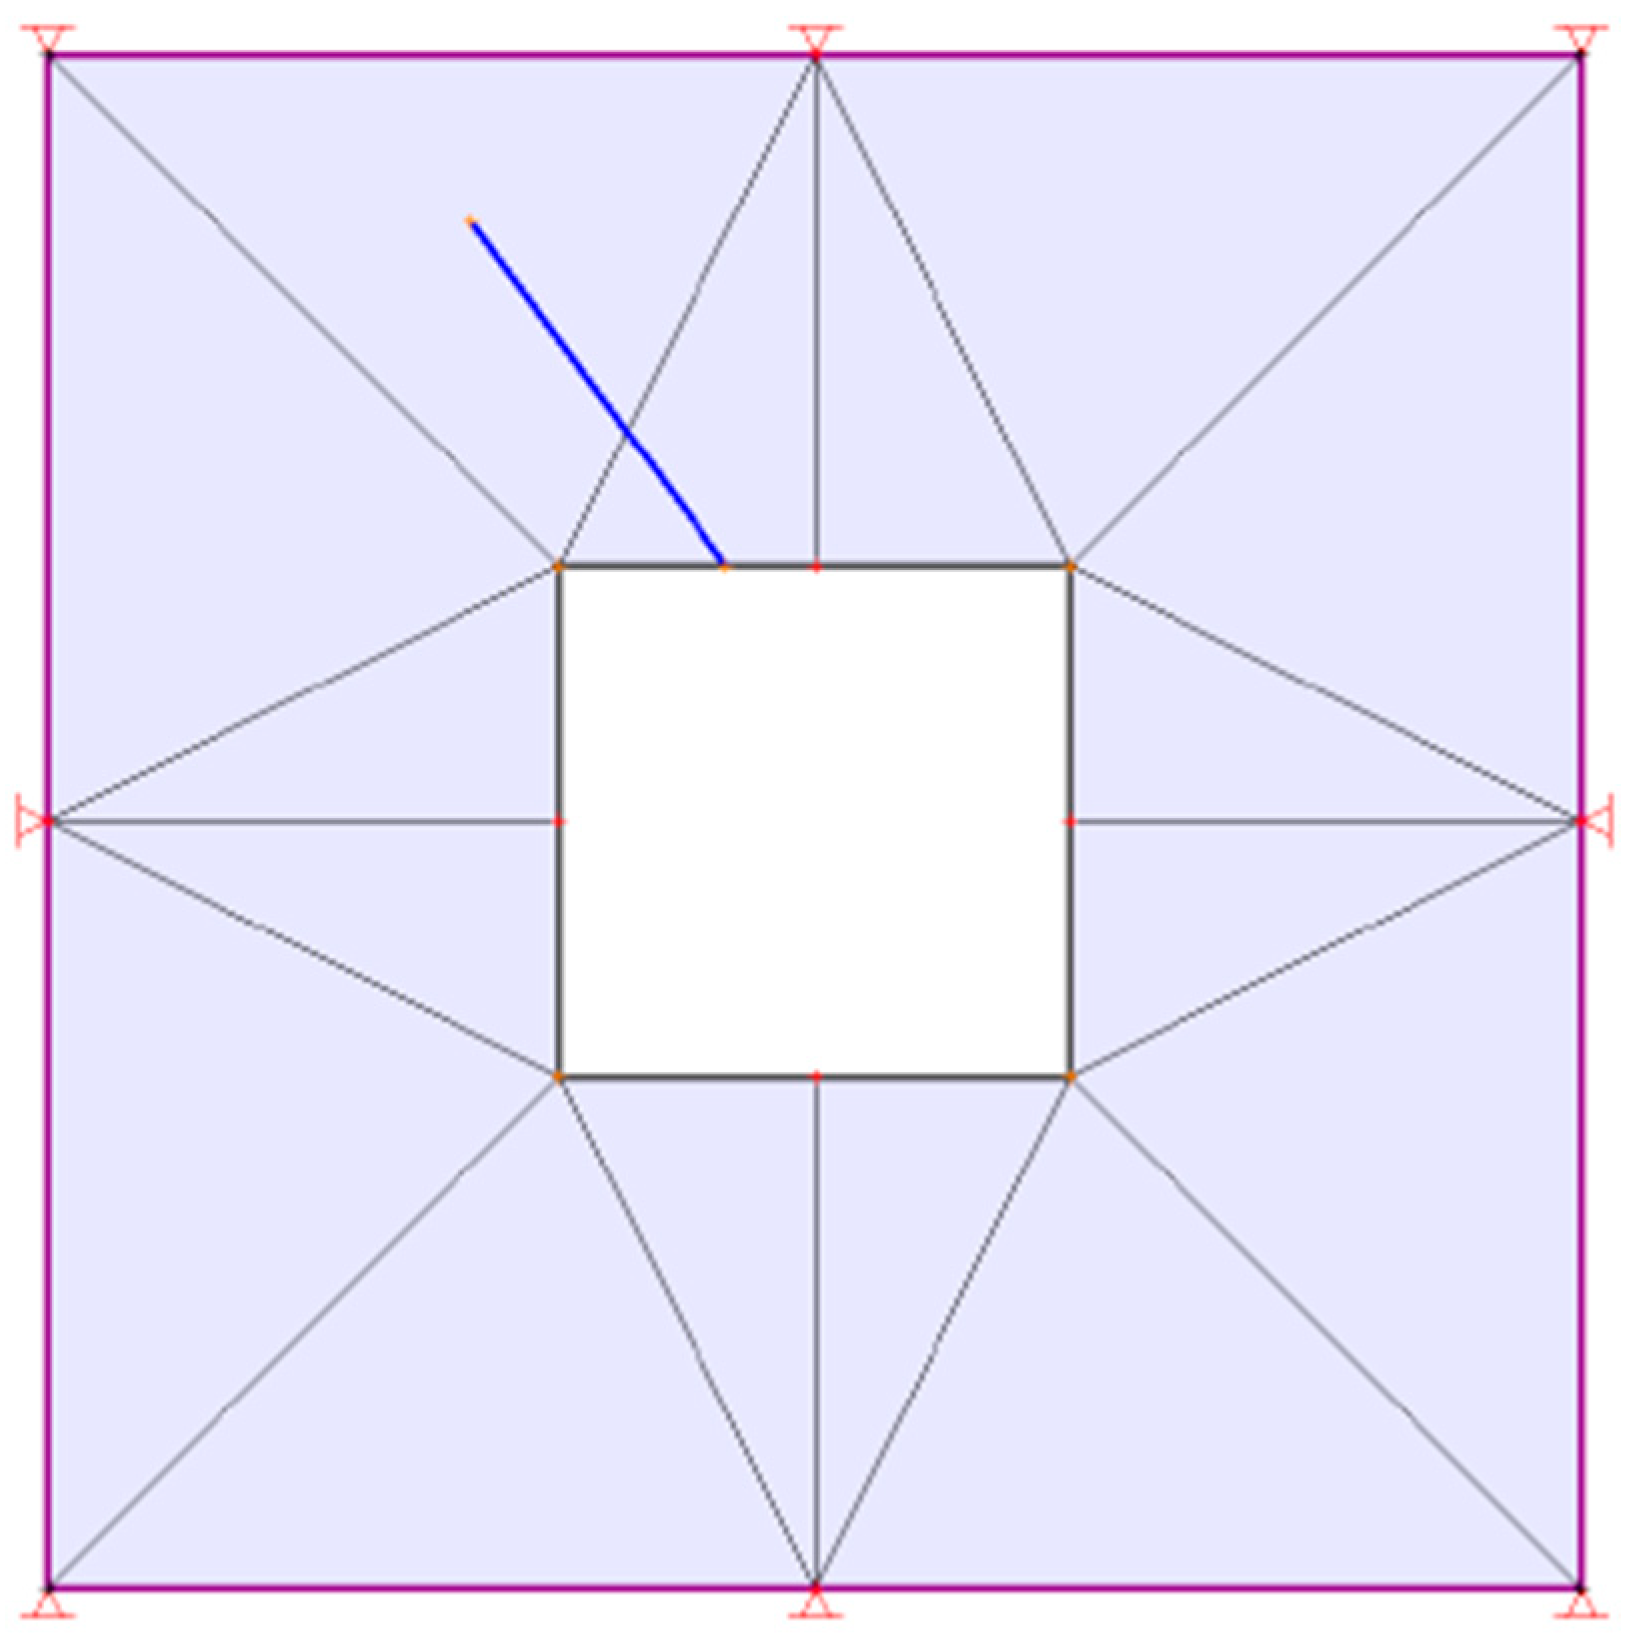
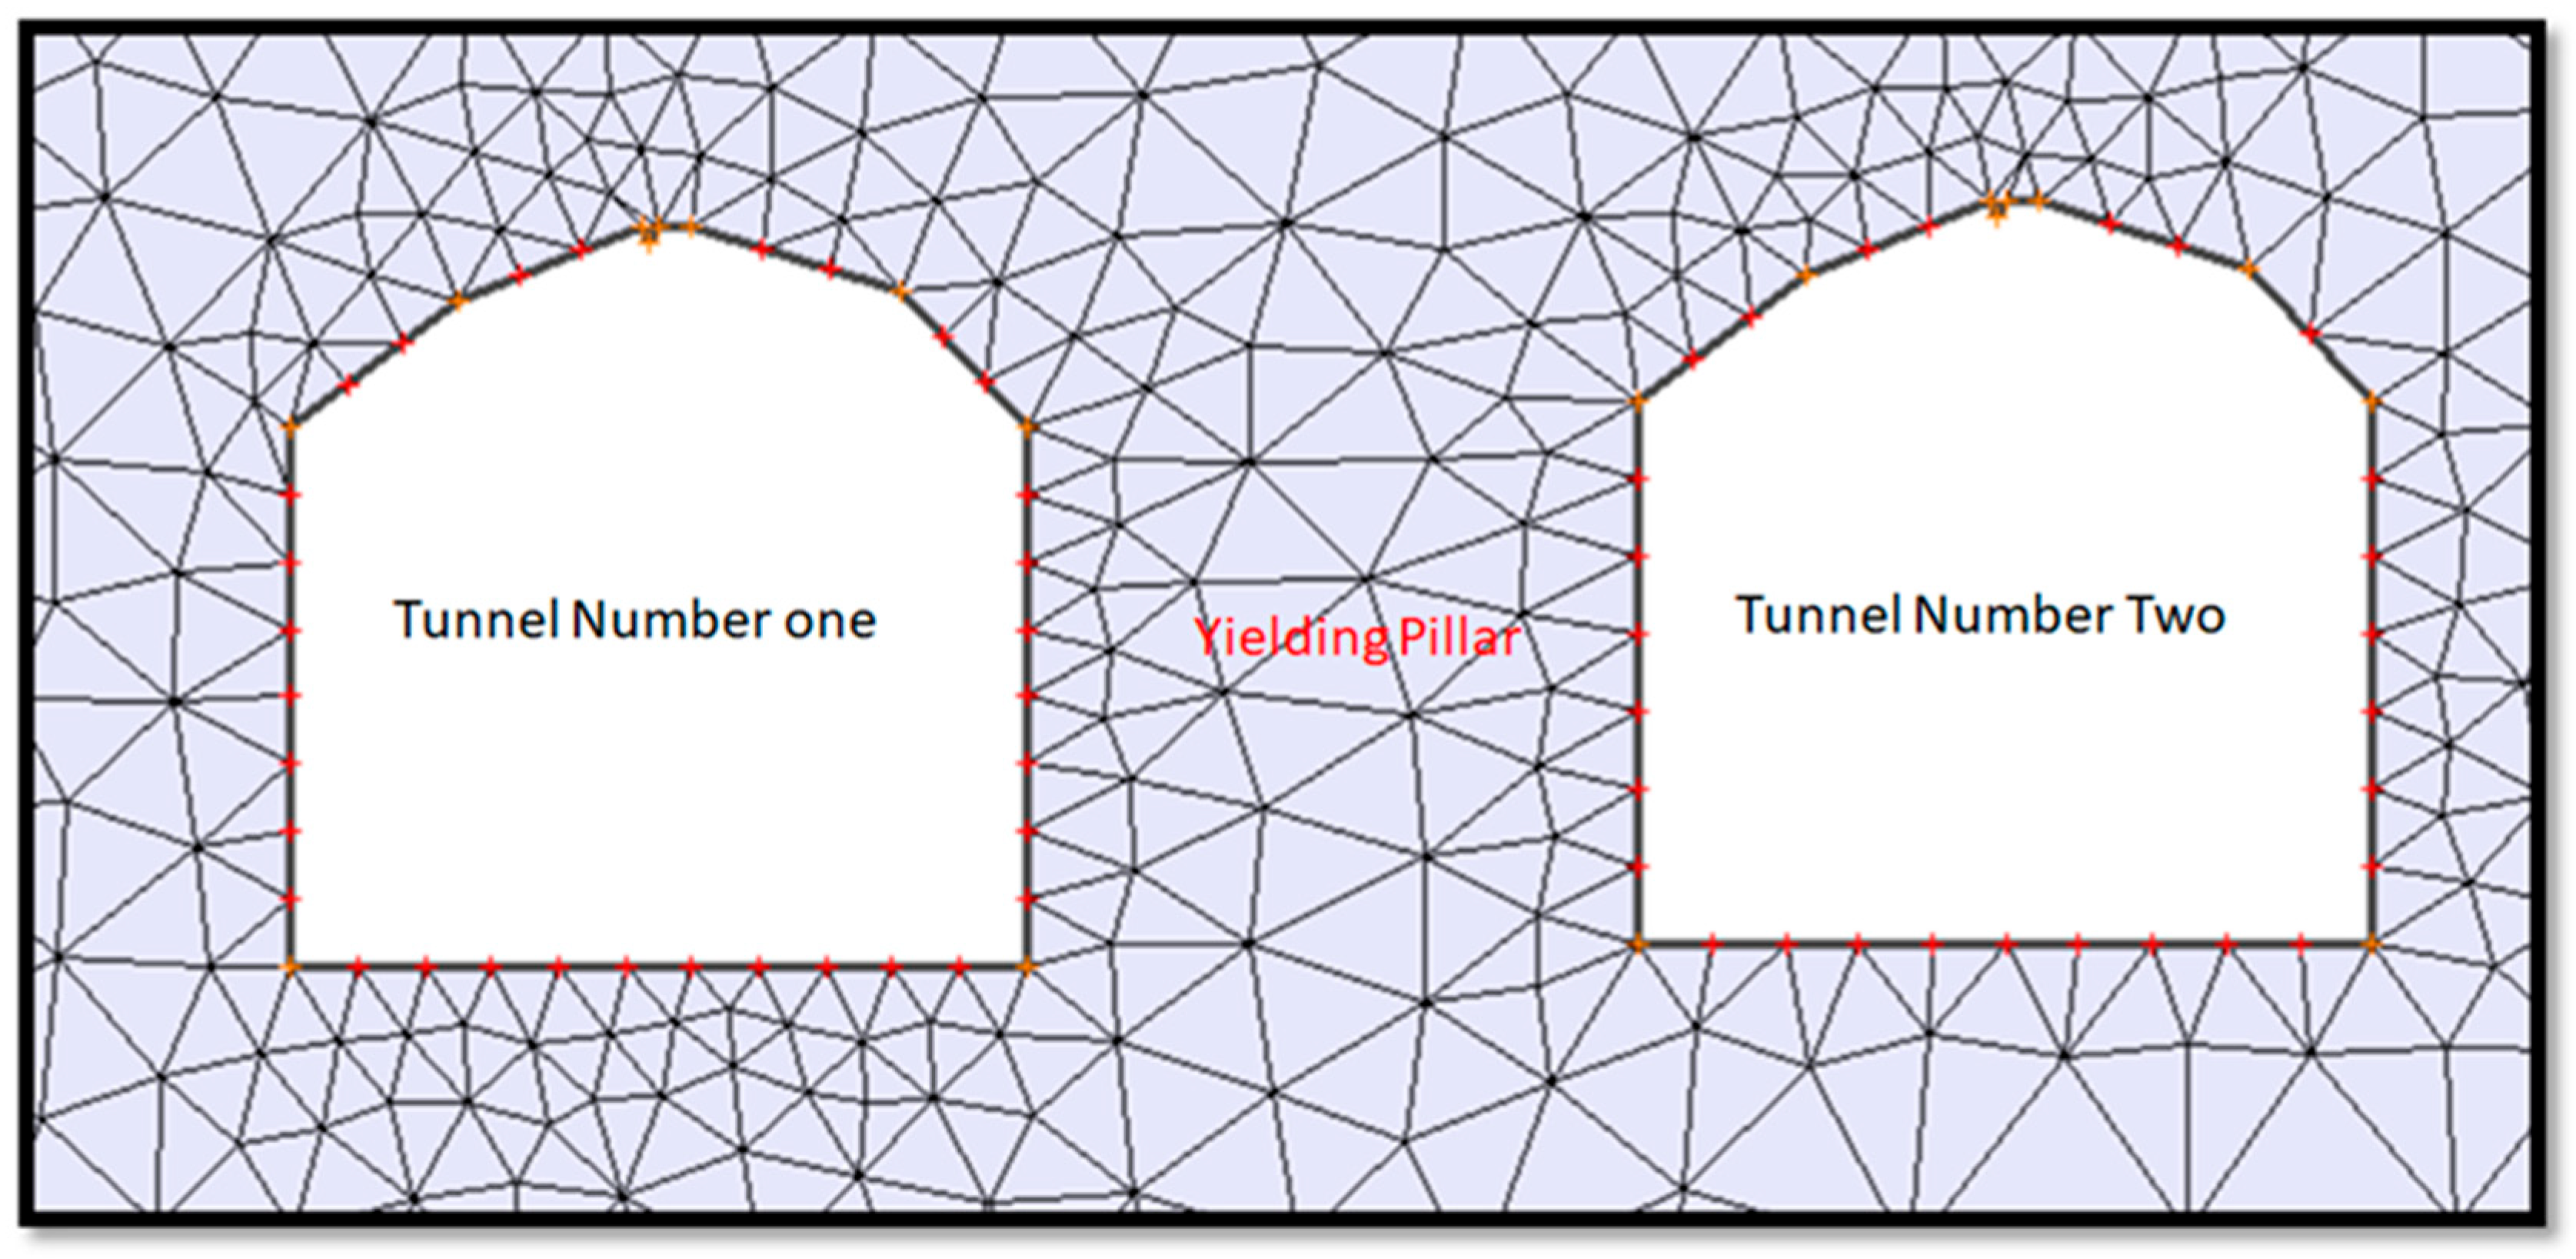
Figure 10.
Tunnel and pillar geometry with applied 3-noded mesh in Phase 2.
Figure 10.
Tunnel and pillar geometry with applied 3-noded mesh in Phase 2.
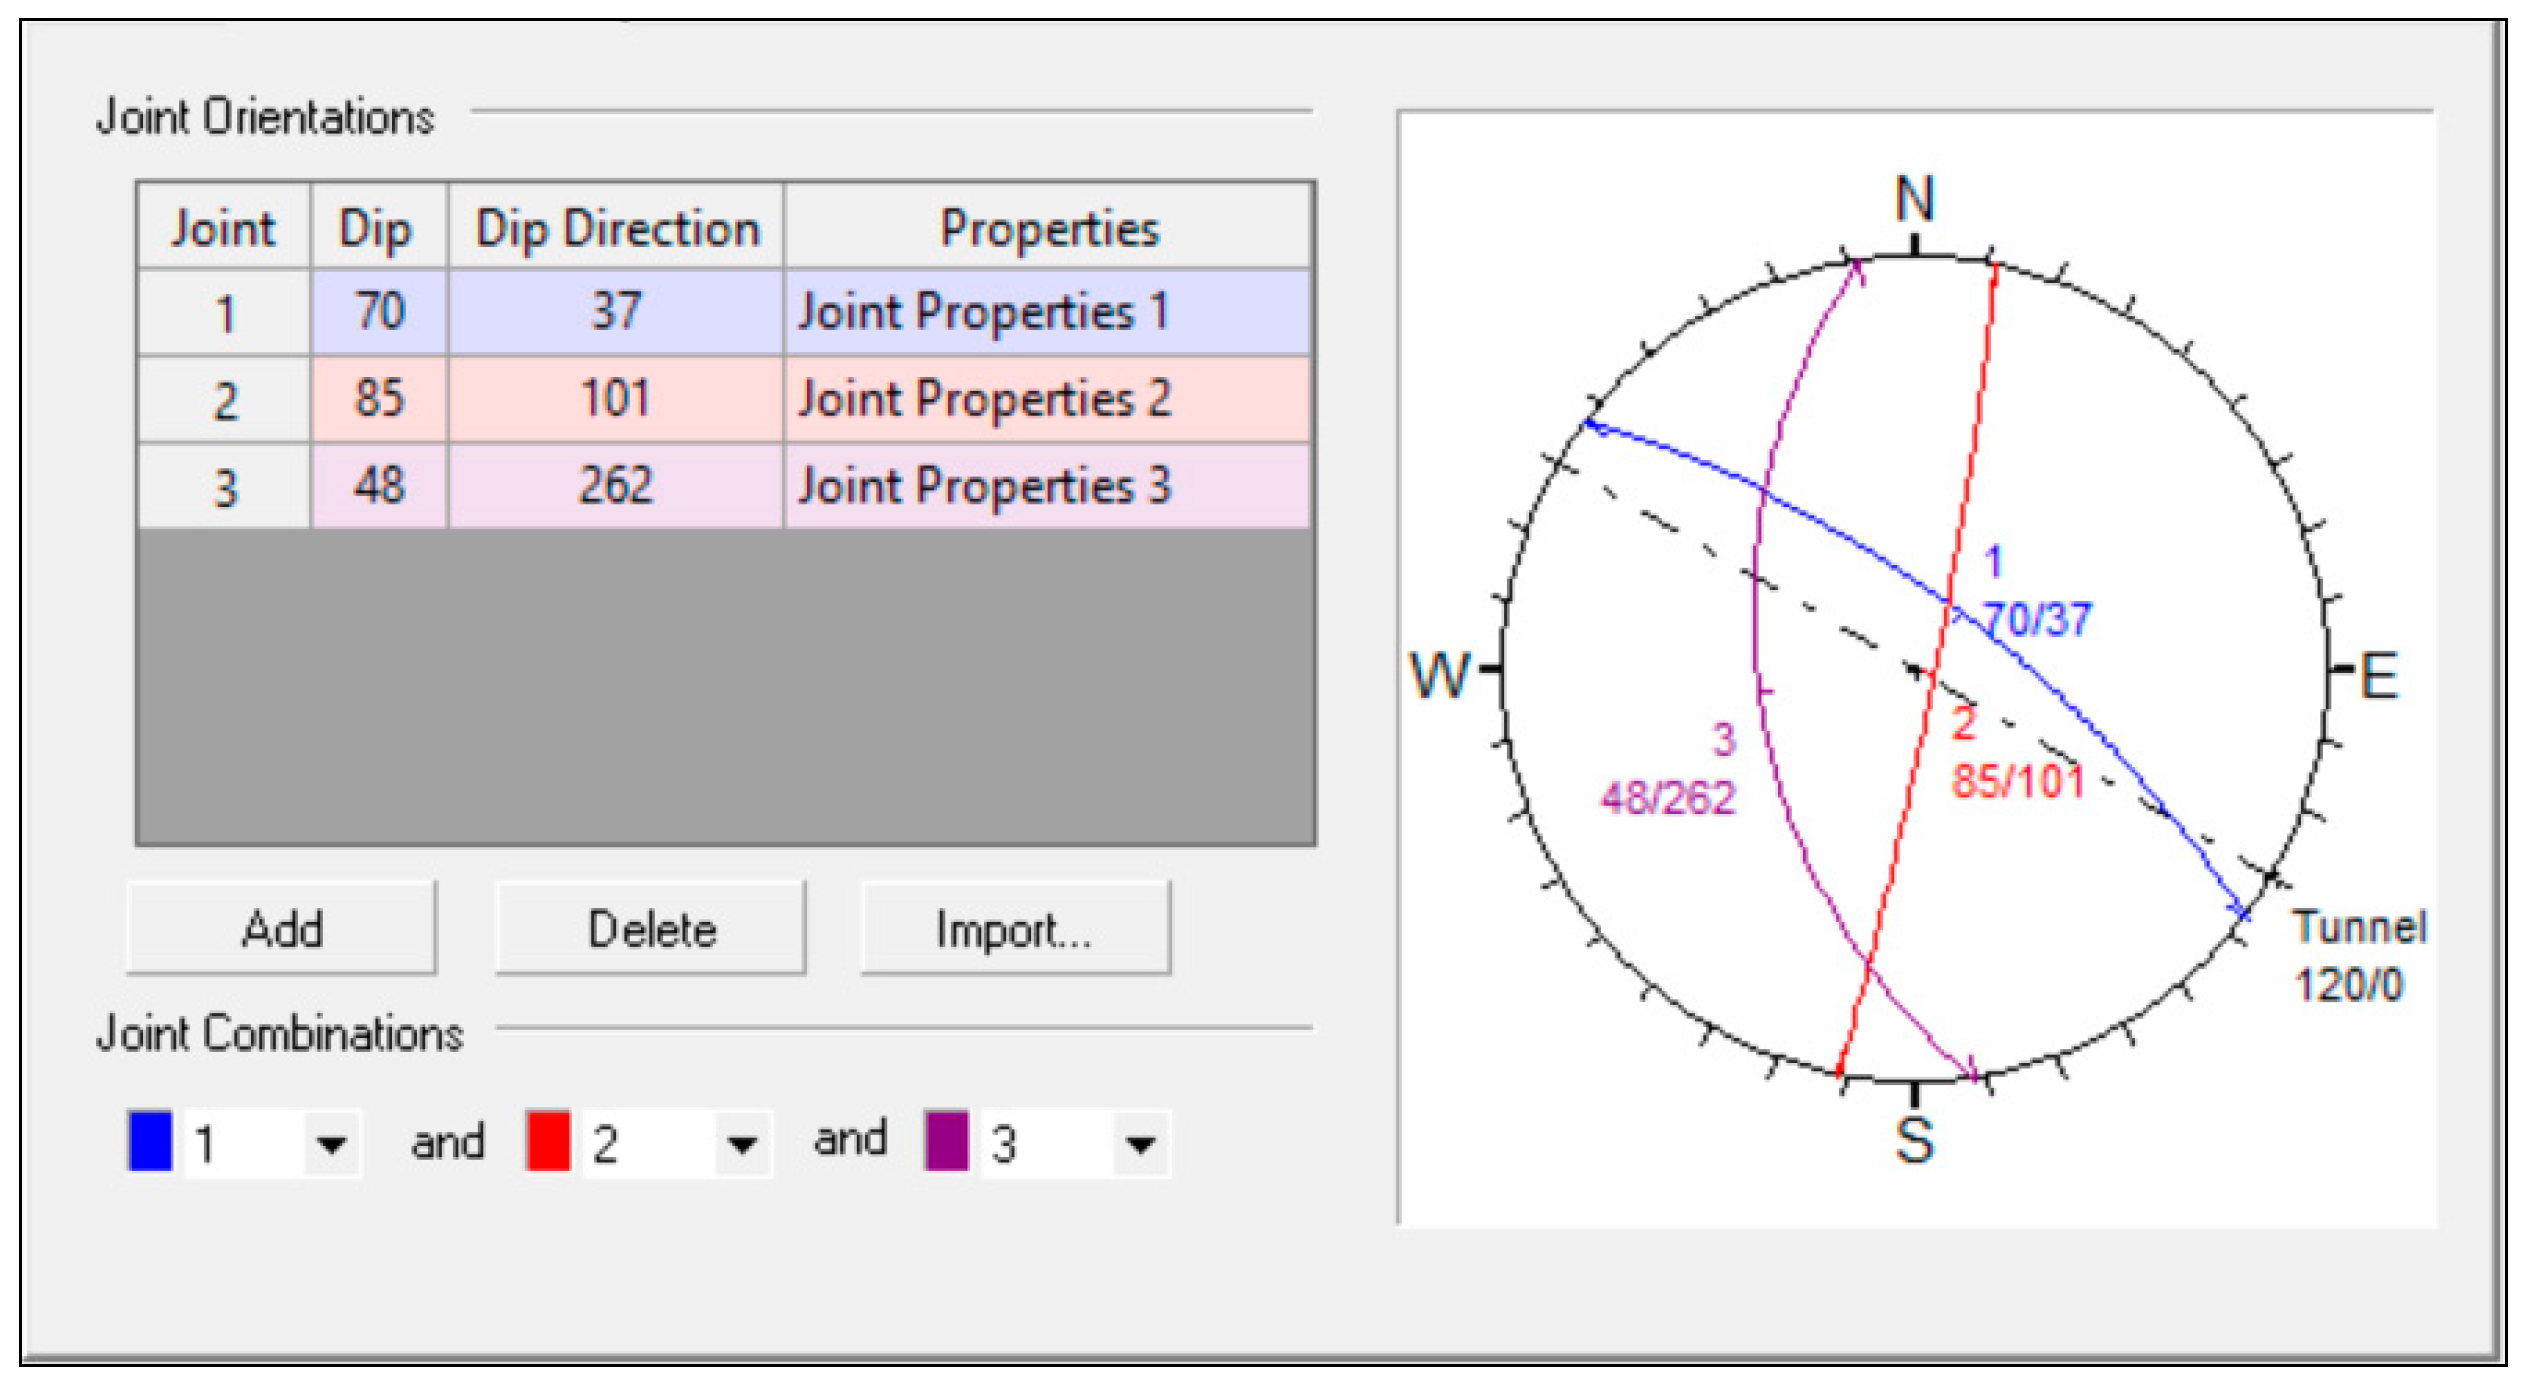
Figure 11.
Stereonet of simulated joint sets for surface excavation model.
Figure 11.
Stereonet of simulated joint sets for surface excavation model.
Figure 12.
Summary of load-displacement curves for all vinyl ester and epoxy bolts in the lab and in situ tests, (a) Summary of load-displacement curves for vinyl ester and epoxy bolts (in situ results) and (b) Summary of load-displacement curves for vinyl ester and epoxy bolts (lab results).
Figure 12.
Summary of load-displacement curves for all vinyl ester and epoxy bolts in the lab and in situ tests, (a) Summary of load-displacement curves for vinyl ester and epoxy bolts (in situ results) and (b) Summary of load-displacement curves for vinyl ester and epoxy bolts (lab results).
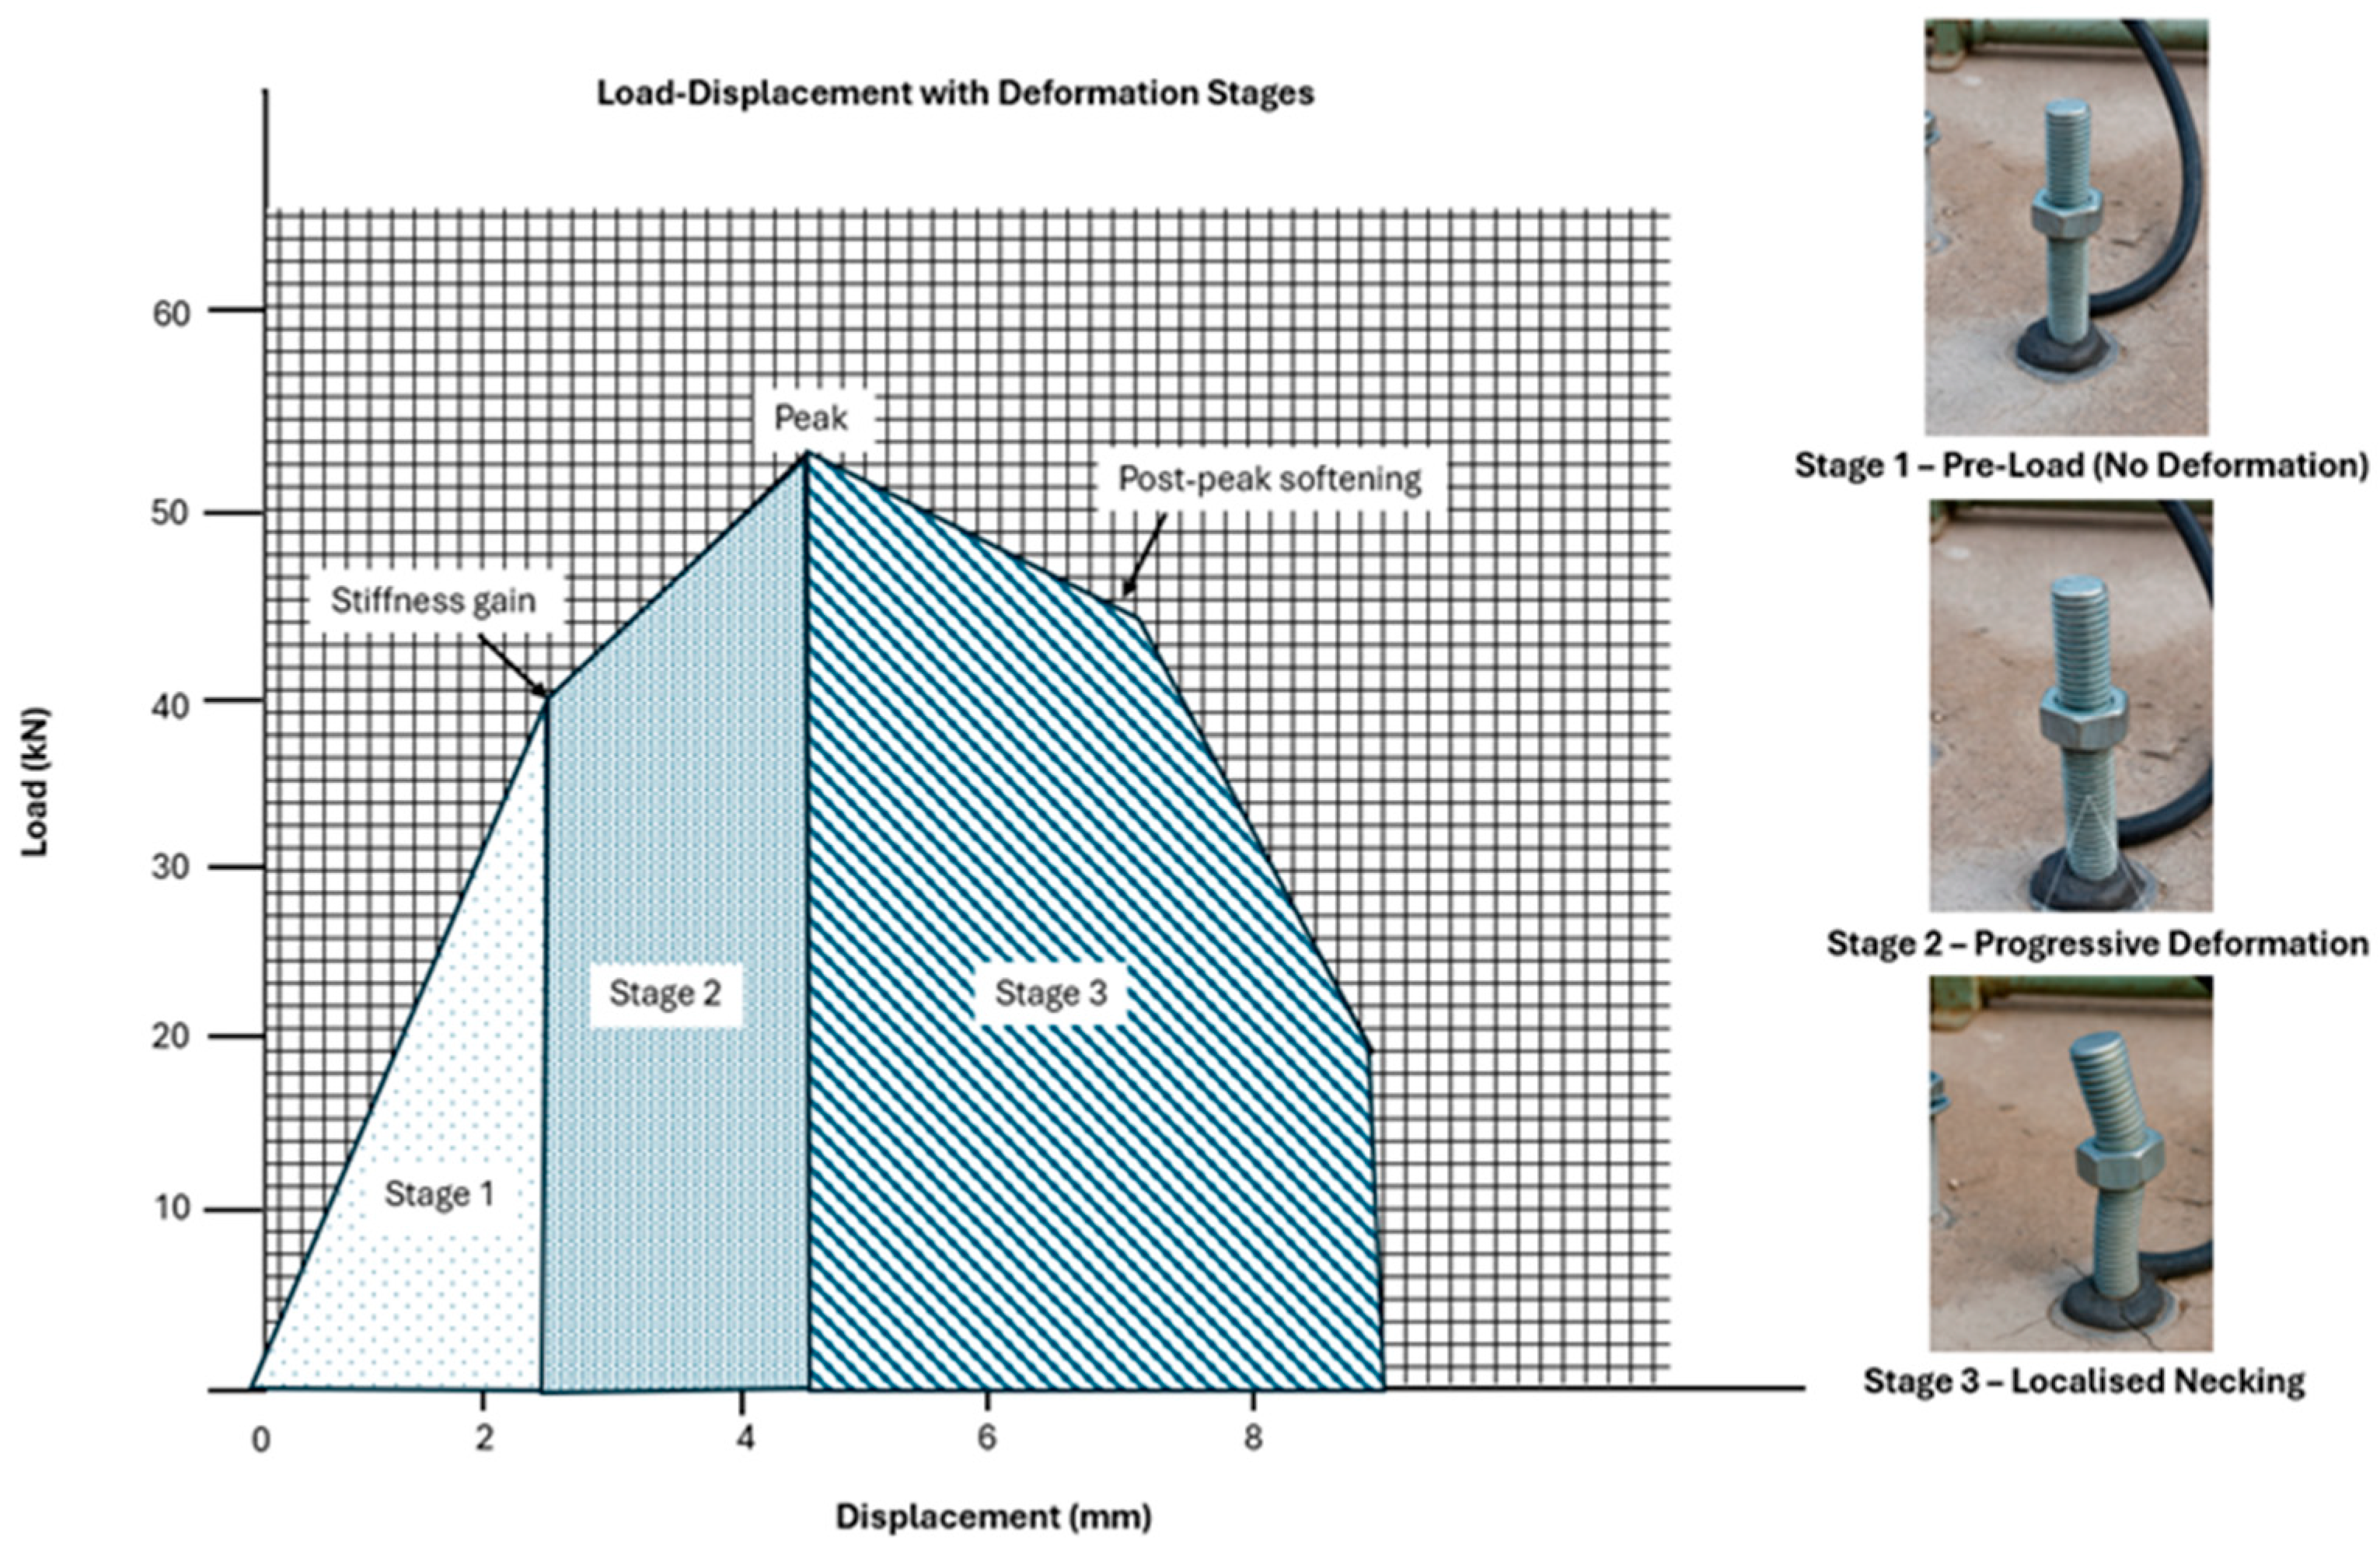
Figure 13.
Load–displacement response of an M16 vinyl ester bolt in intact rock, showing stiffness gain, peak capacity, and post-peak softening.
Figure 13.
Load–displacement response of an M16 vinyl ester bolt in intact rock, showing stiffness gain, peak capacity, and post-peak softening.
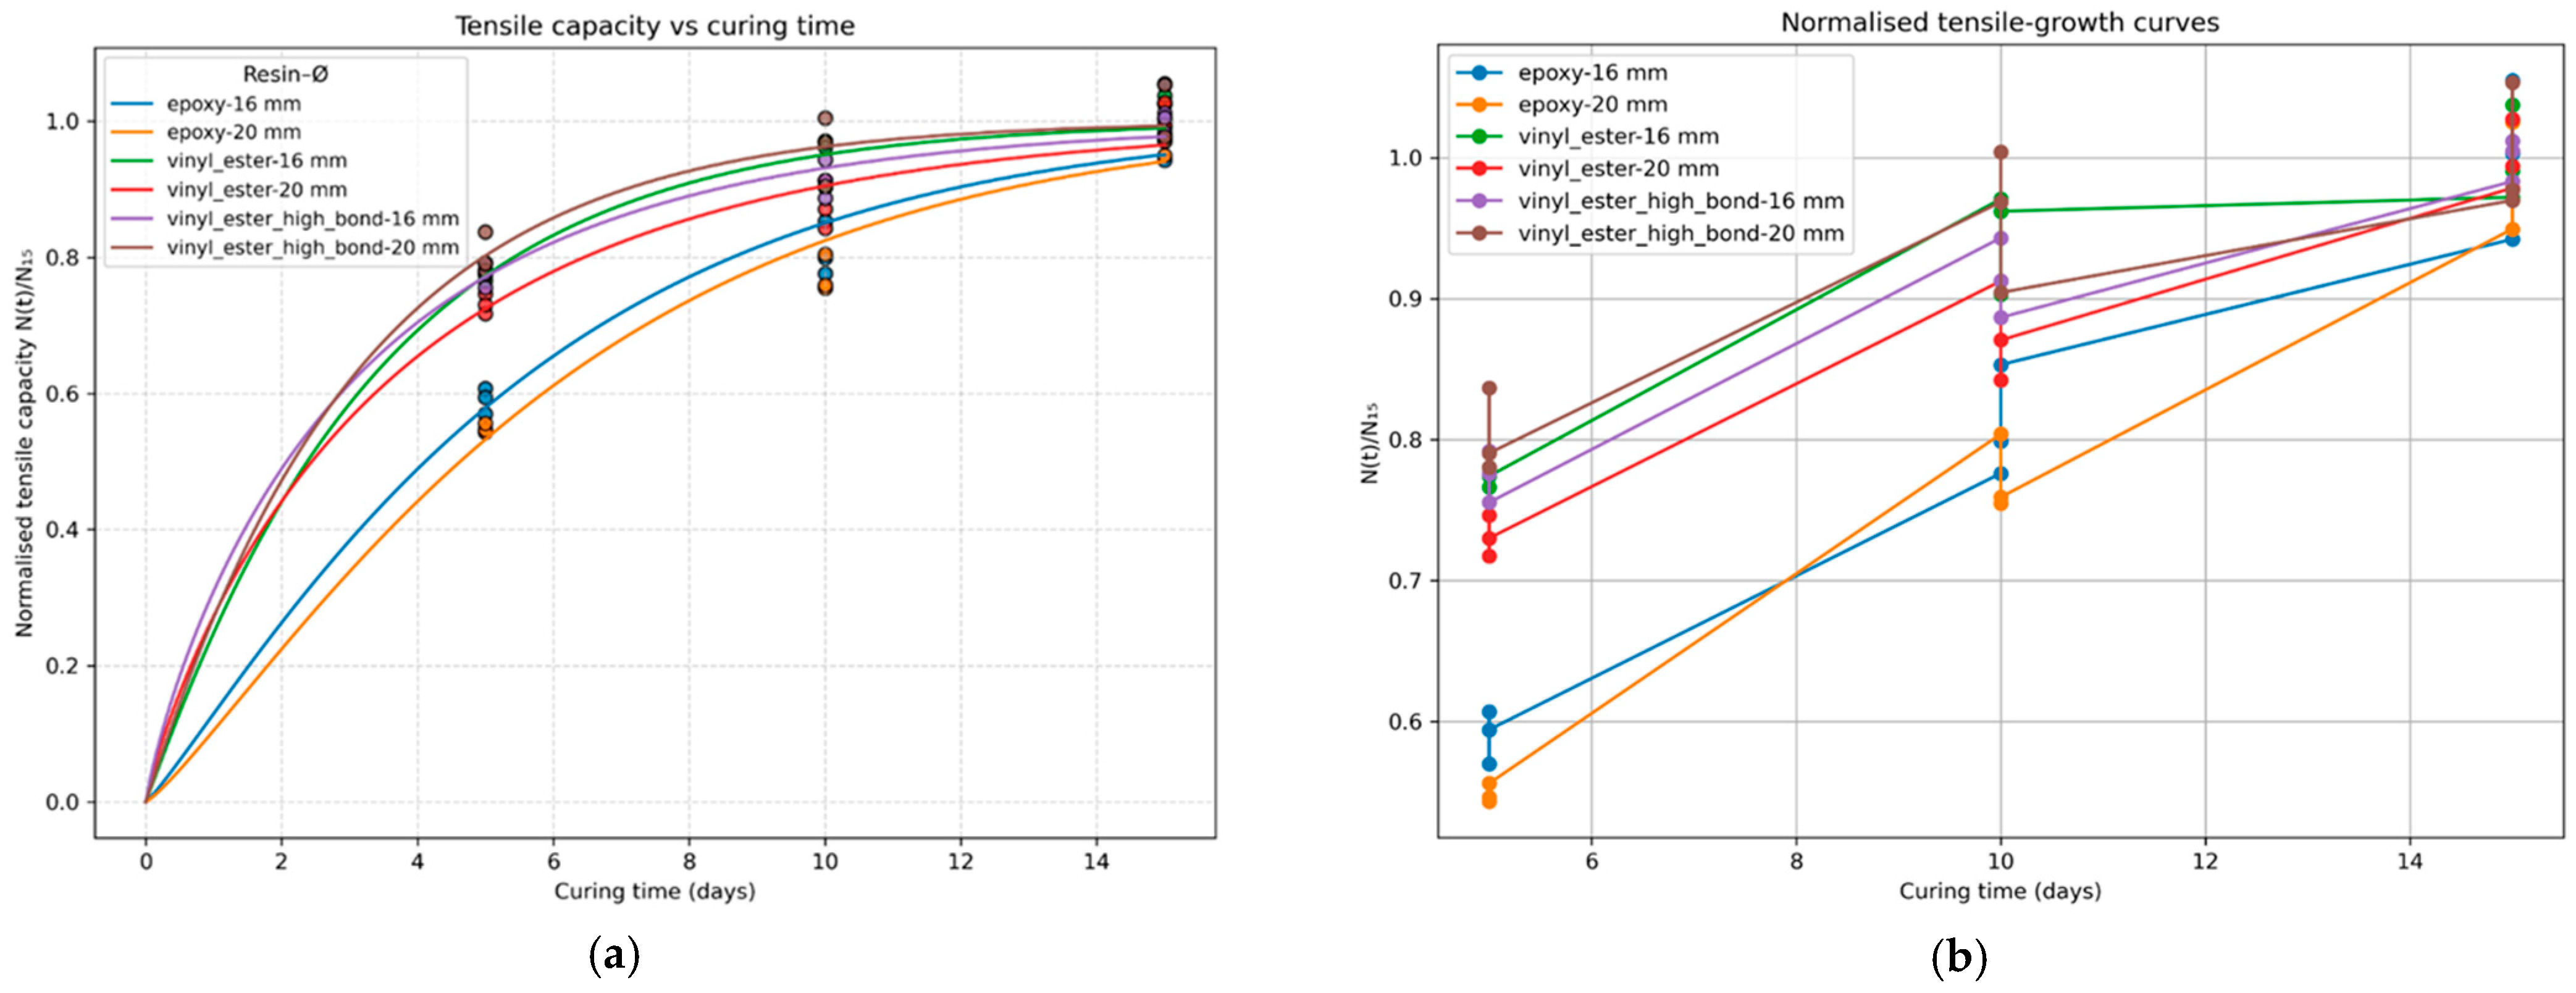
Figure 14.
(a) Mean tensile capacity (kN) versus curing time (days) with error bars (±1 SD, n = 3). (b) Shear capacity development versus curing time (days) for six anchor configurations.
Figure 14.
(a) Mean tensile capacity (kN) versus curing time (days) with error bars (±1 SD, n = 3). (b) Shear capacity development versus curing time (days) for six anchor configurations.
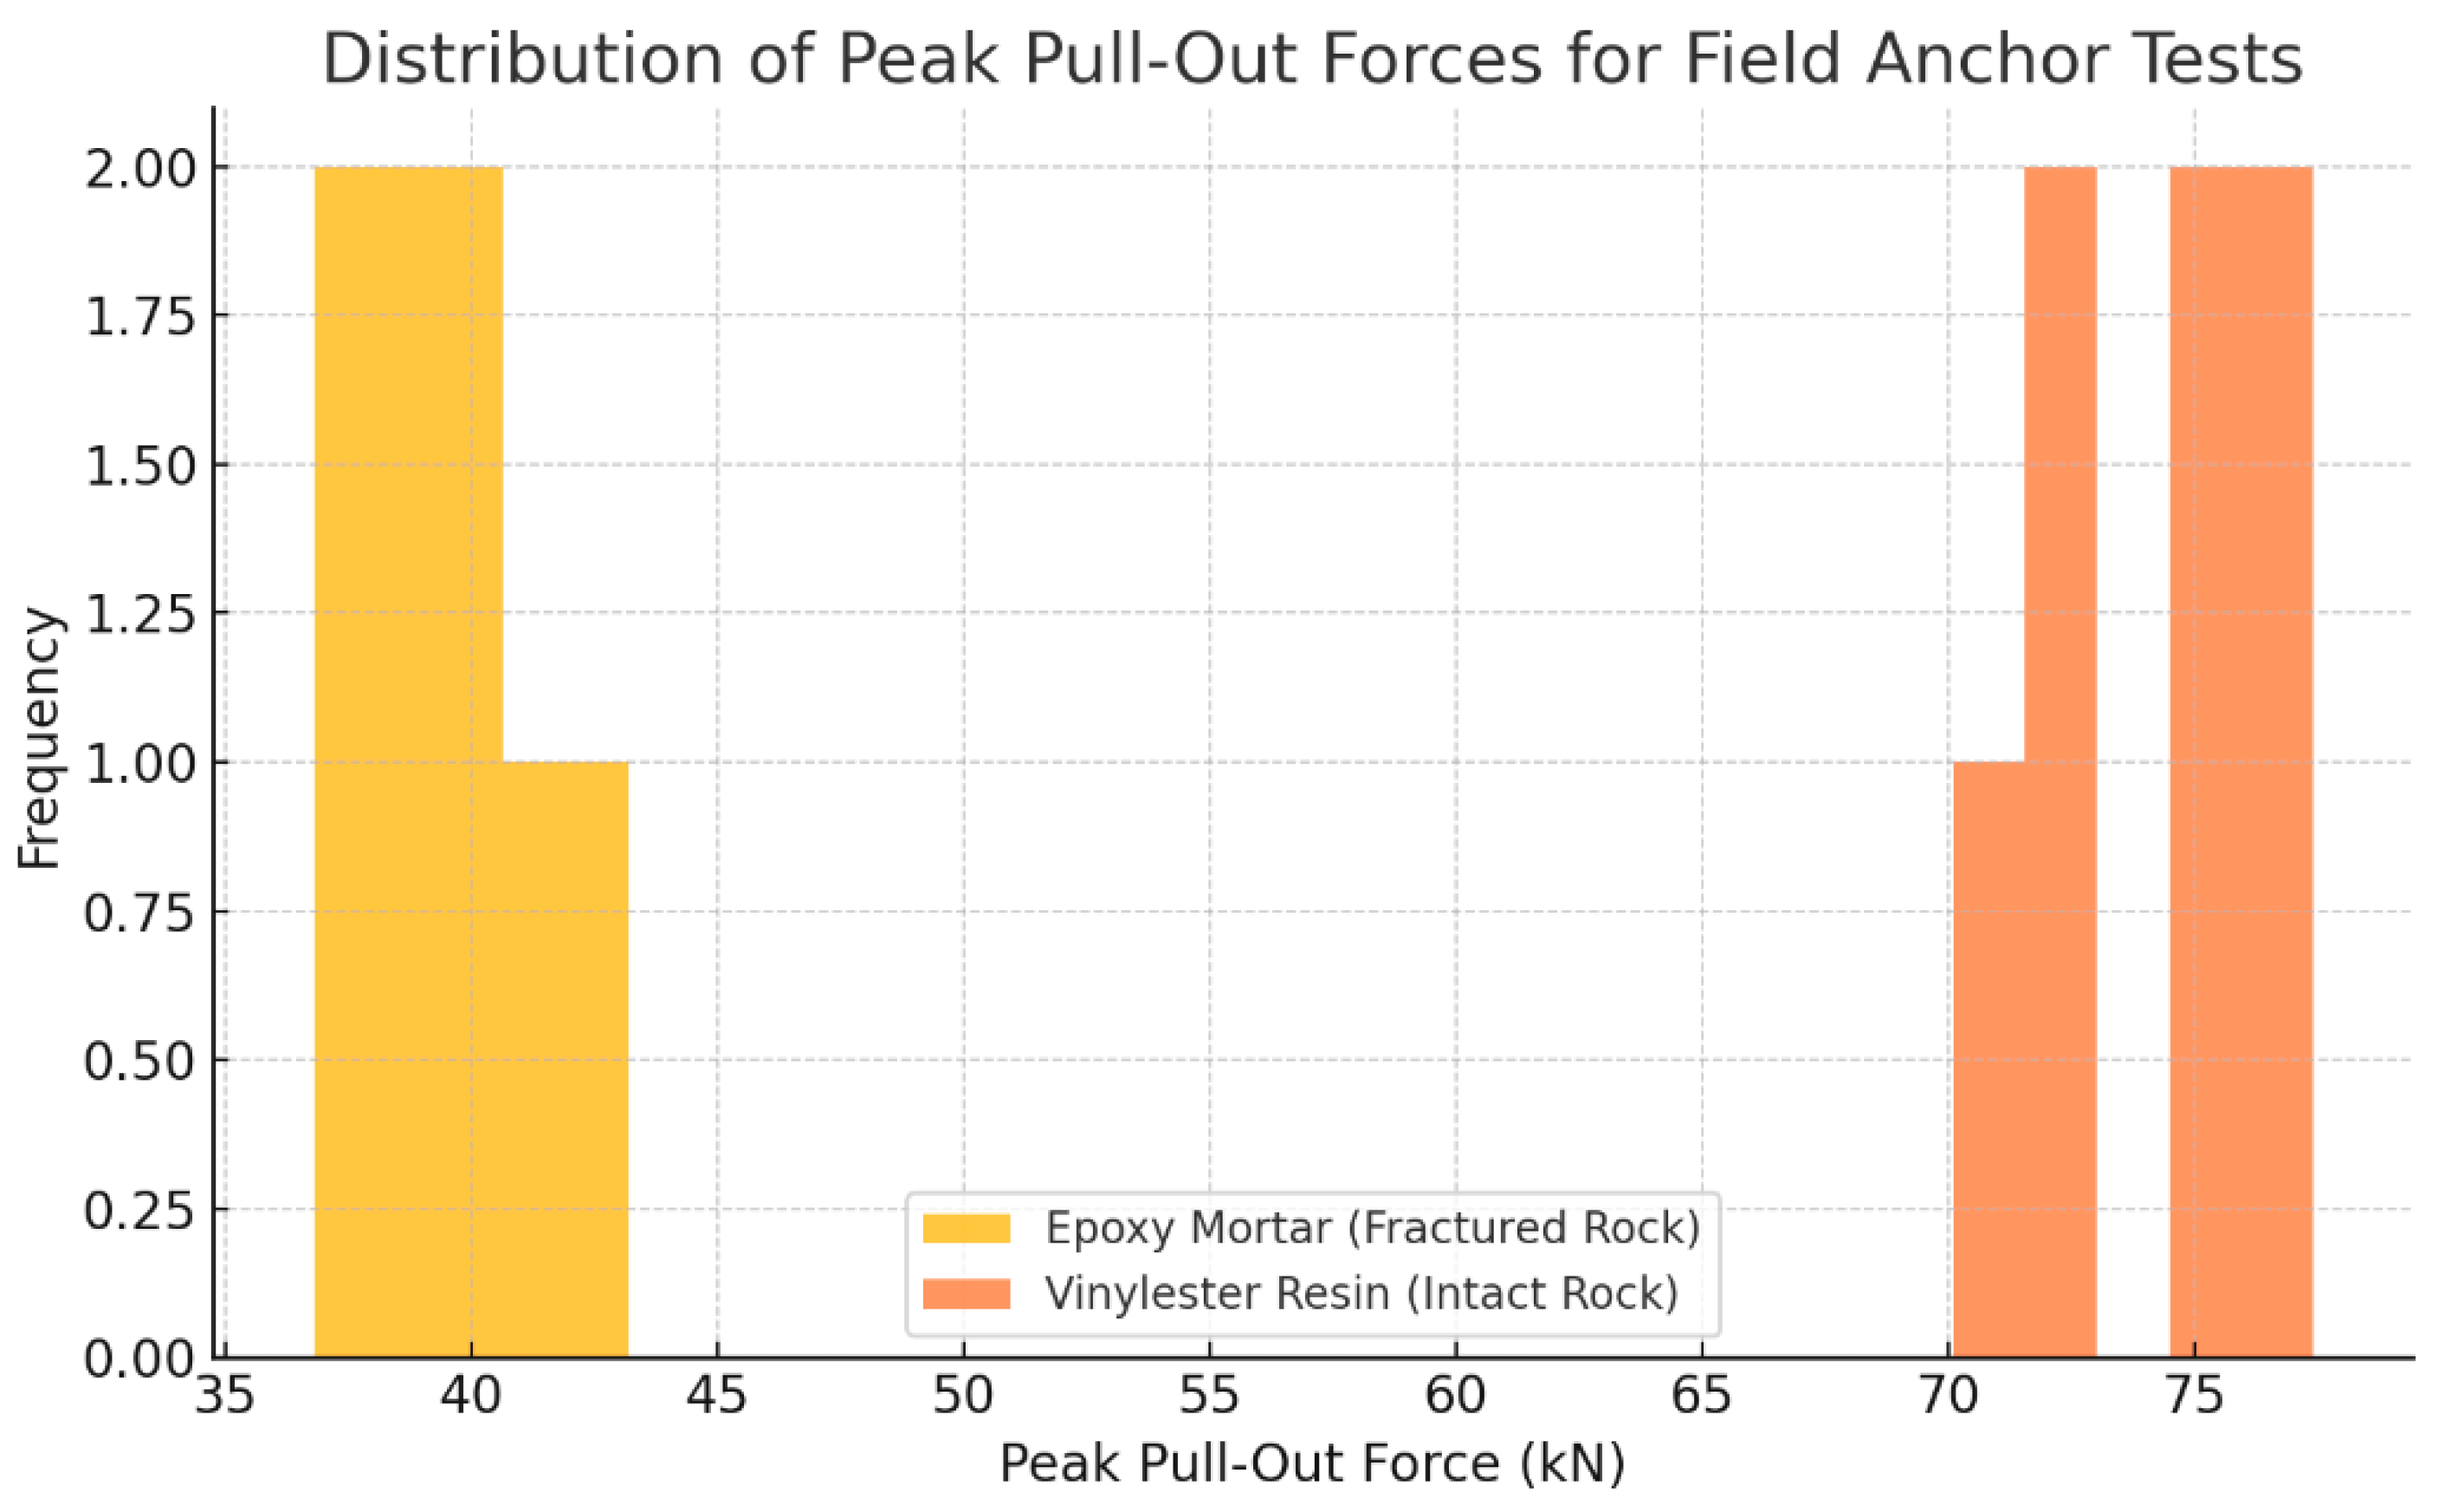
Figure 15.
Distribution of peak pull-out forces for adhesive-bonded bolts in the field, comparing epoxy mortar (fractured rock) and vinyl ester resin (intact rock) systems.
Figure 15.
Distribution of peak pull-out forces for adhesive-bonded bolts in the field, comparing epoxy mortar (fractured rock) and vinyl ester resin (intact rock) systems.
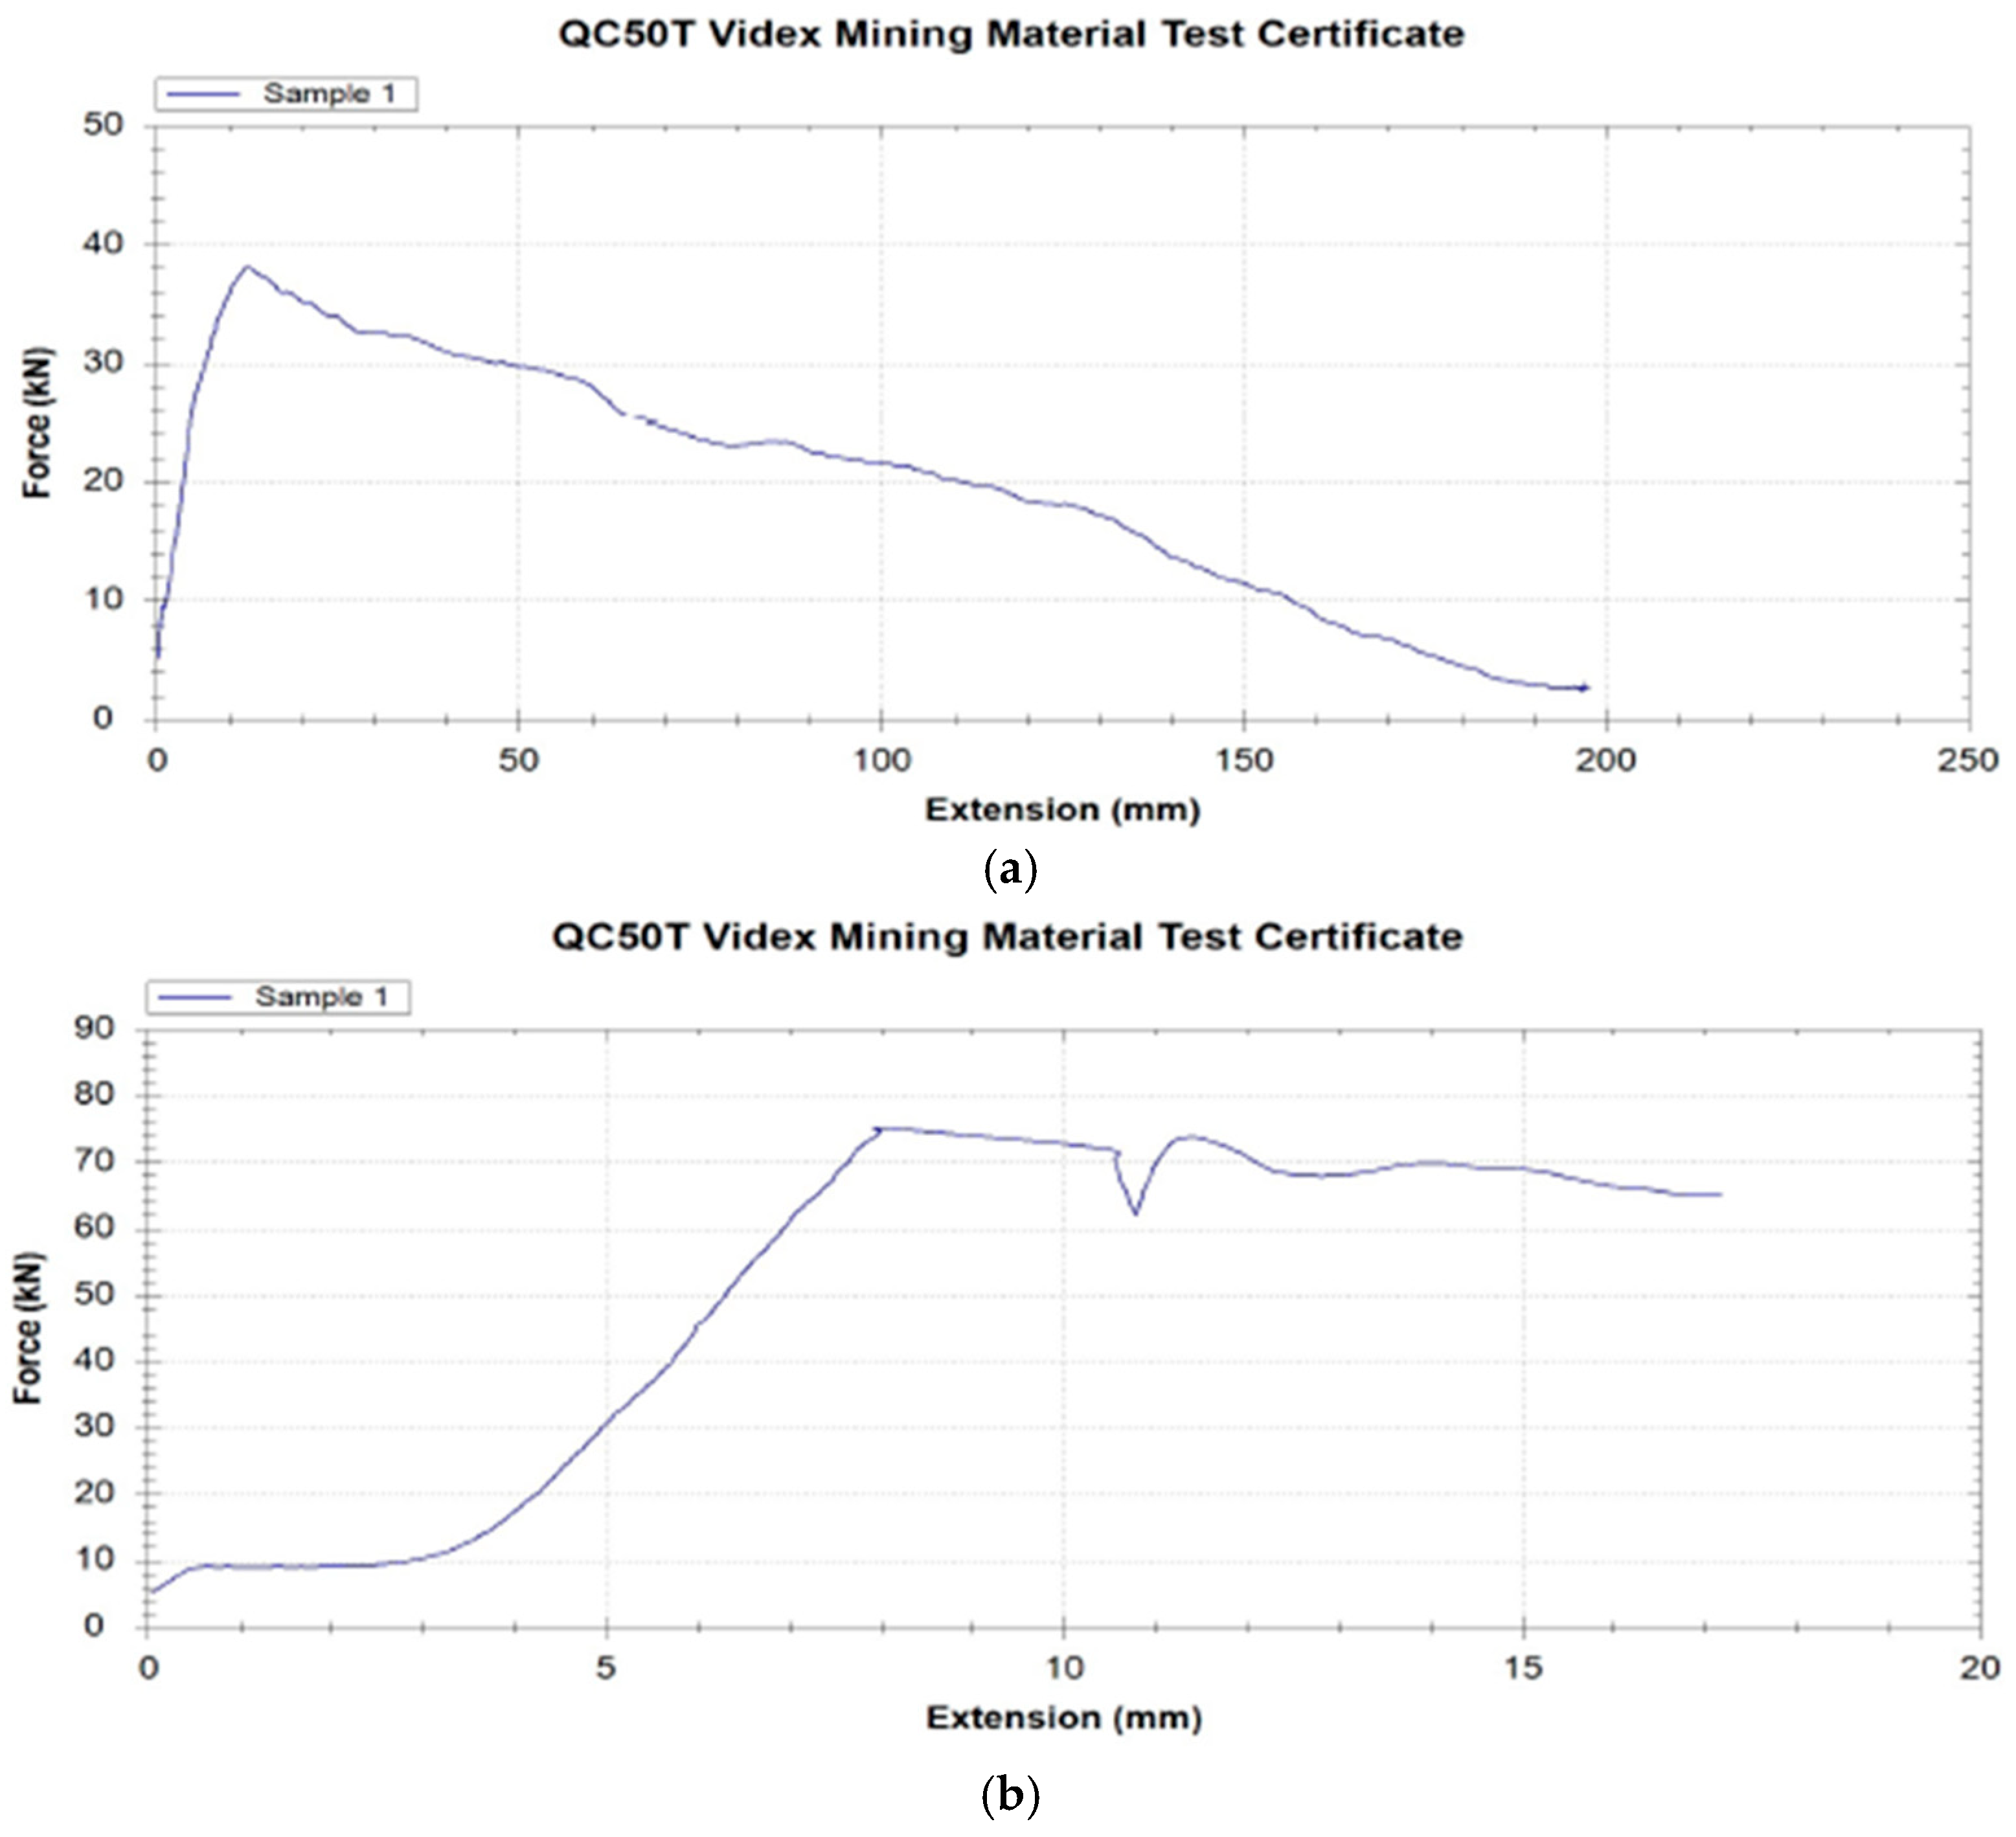
Figure 16.
Representative load–extension curves for bolts in fractured rock (a) and intact rock (b). Sample 1 refers to an epoxy-bonded anchor tested in weathered rock. High-resolution image supplied.
Figure 16.
Representative load–extension curves for bolts in fractured rock (a) and intact rock (b). Sample 1 refers to an epoxy-bonded anchor tested in weathered rock. High-resolution image supplied.
Figure 17.
Strength Factor vs. Depth for Stage 3 (Unsupported Excavation).
Figure 17.
Strength Factor vs. Depth for Stage 3 (Unsupported Excavation).
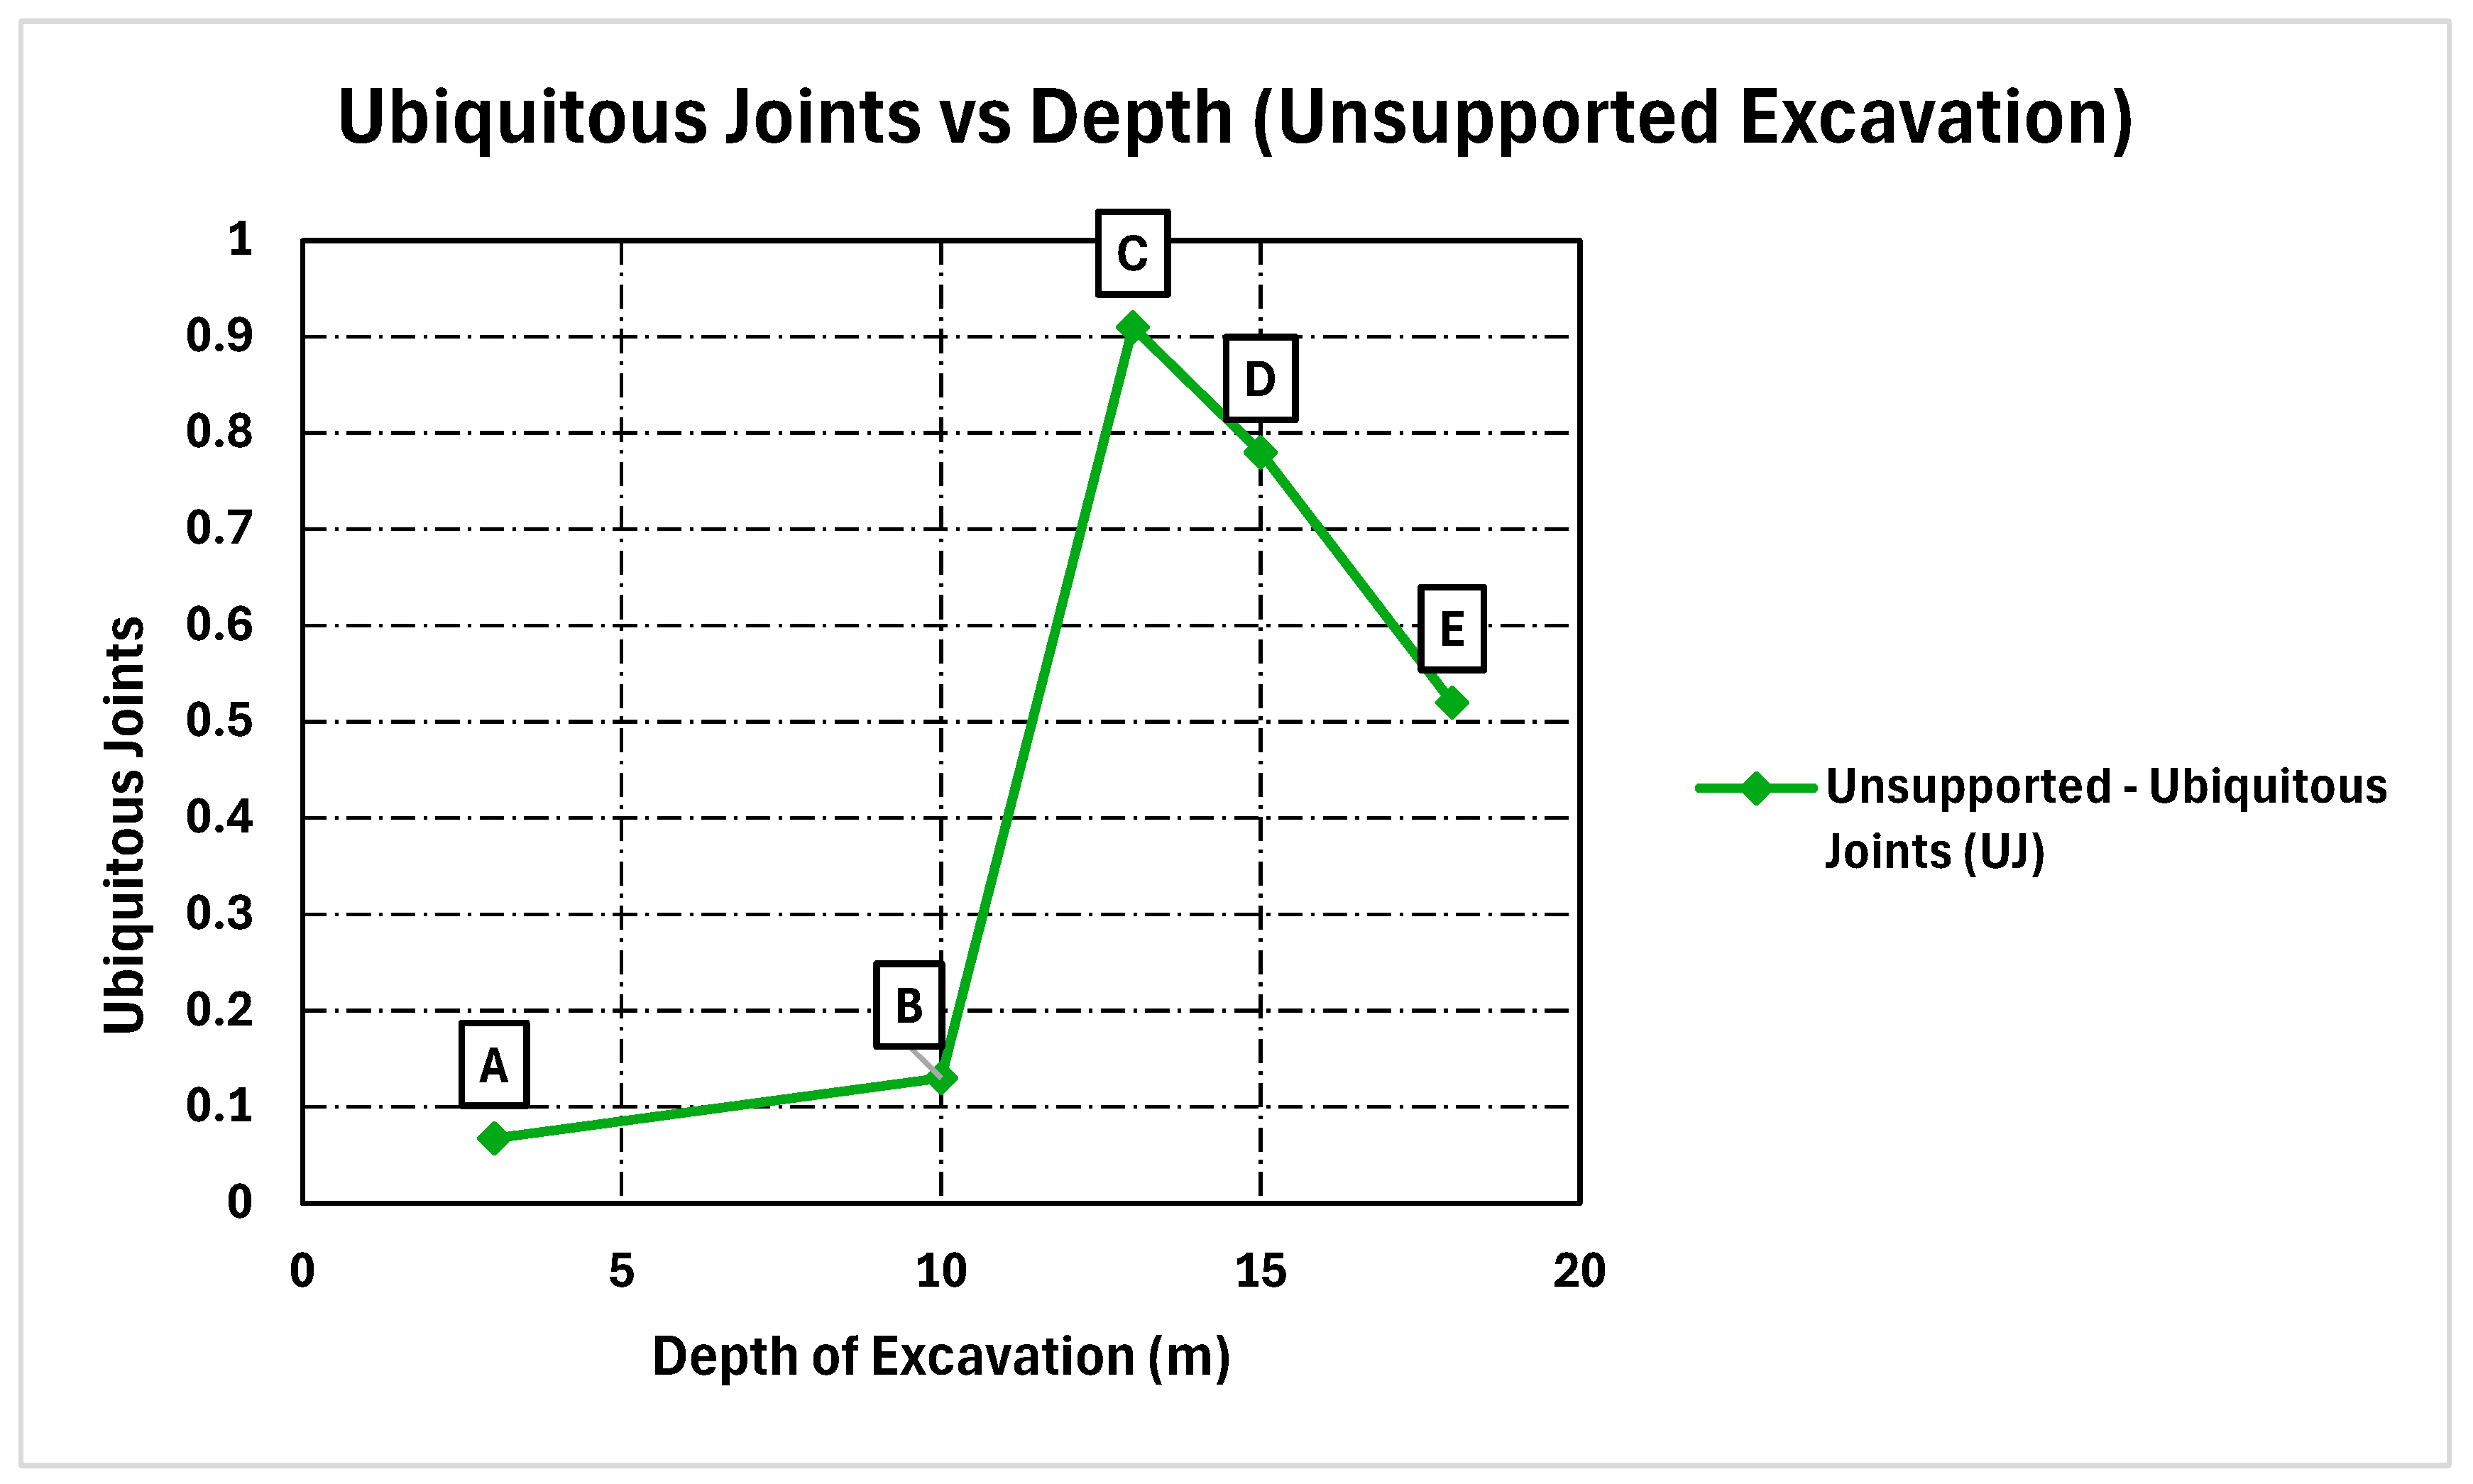
Figure 18.
Ubiquitous Joints vs. Depth for Stage 3 (Unsupported Excavation).
Figure 18.
Ubiquitous Joints vs. Depth for Stage 3 (Unsupported Excavation).
Figure 19.
Volumetric Strain vs. Depth for Stage 3 (Unsupported Excavation).
Figure 19.
Volumetric Strain vs. Depth for Stage 3 (Unsupported Excavation).
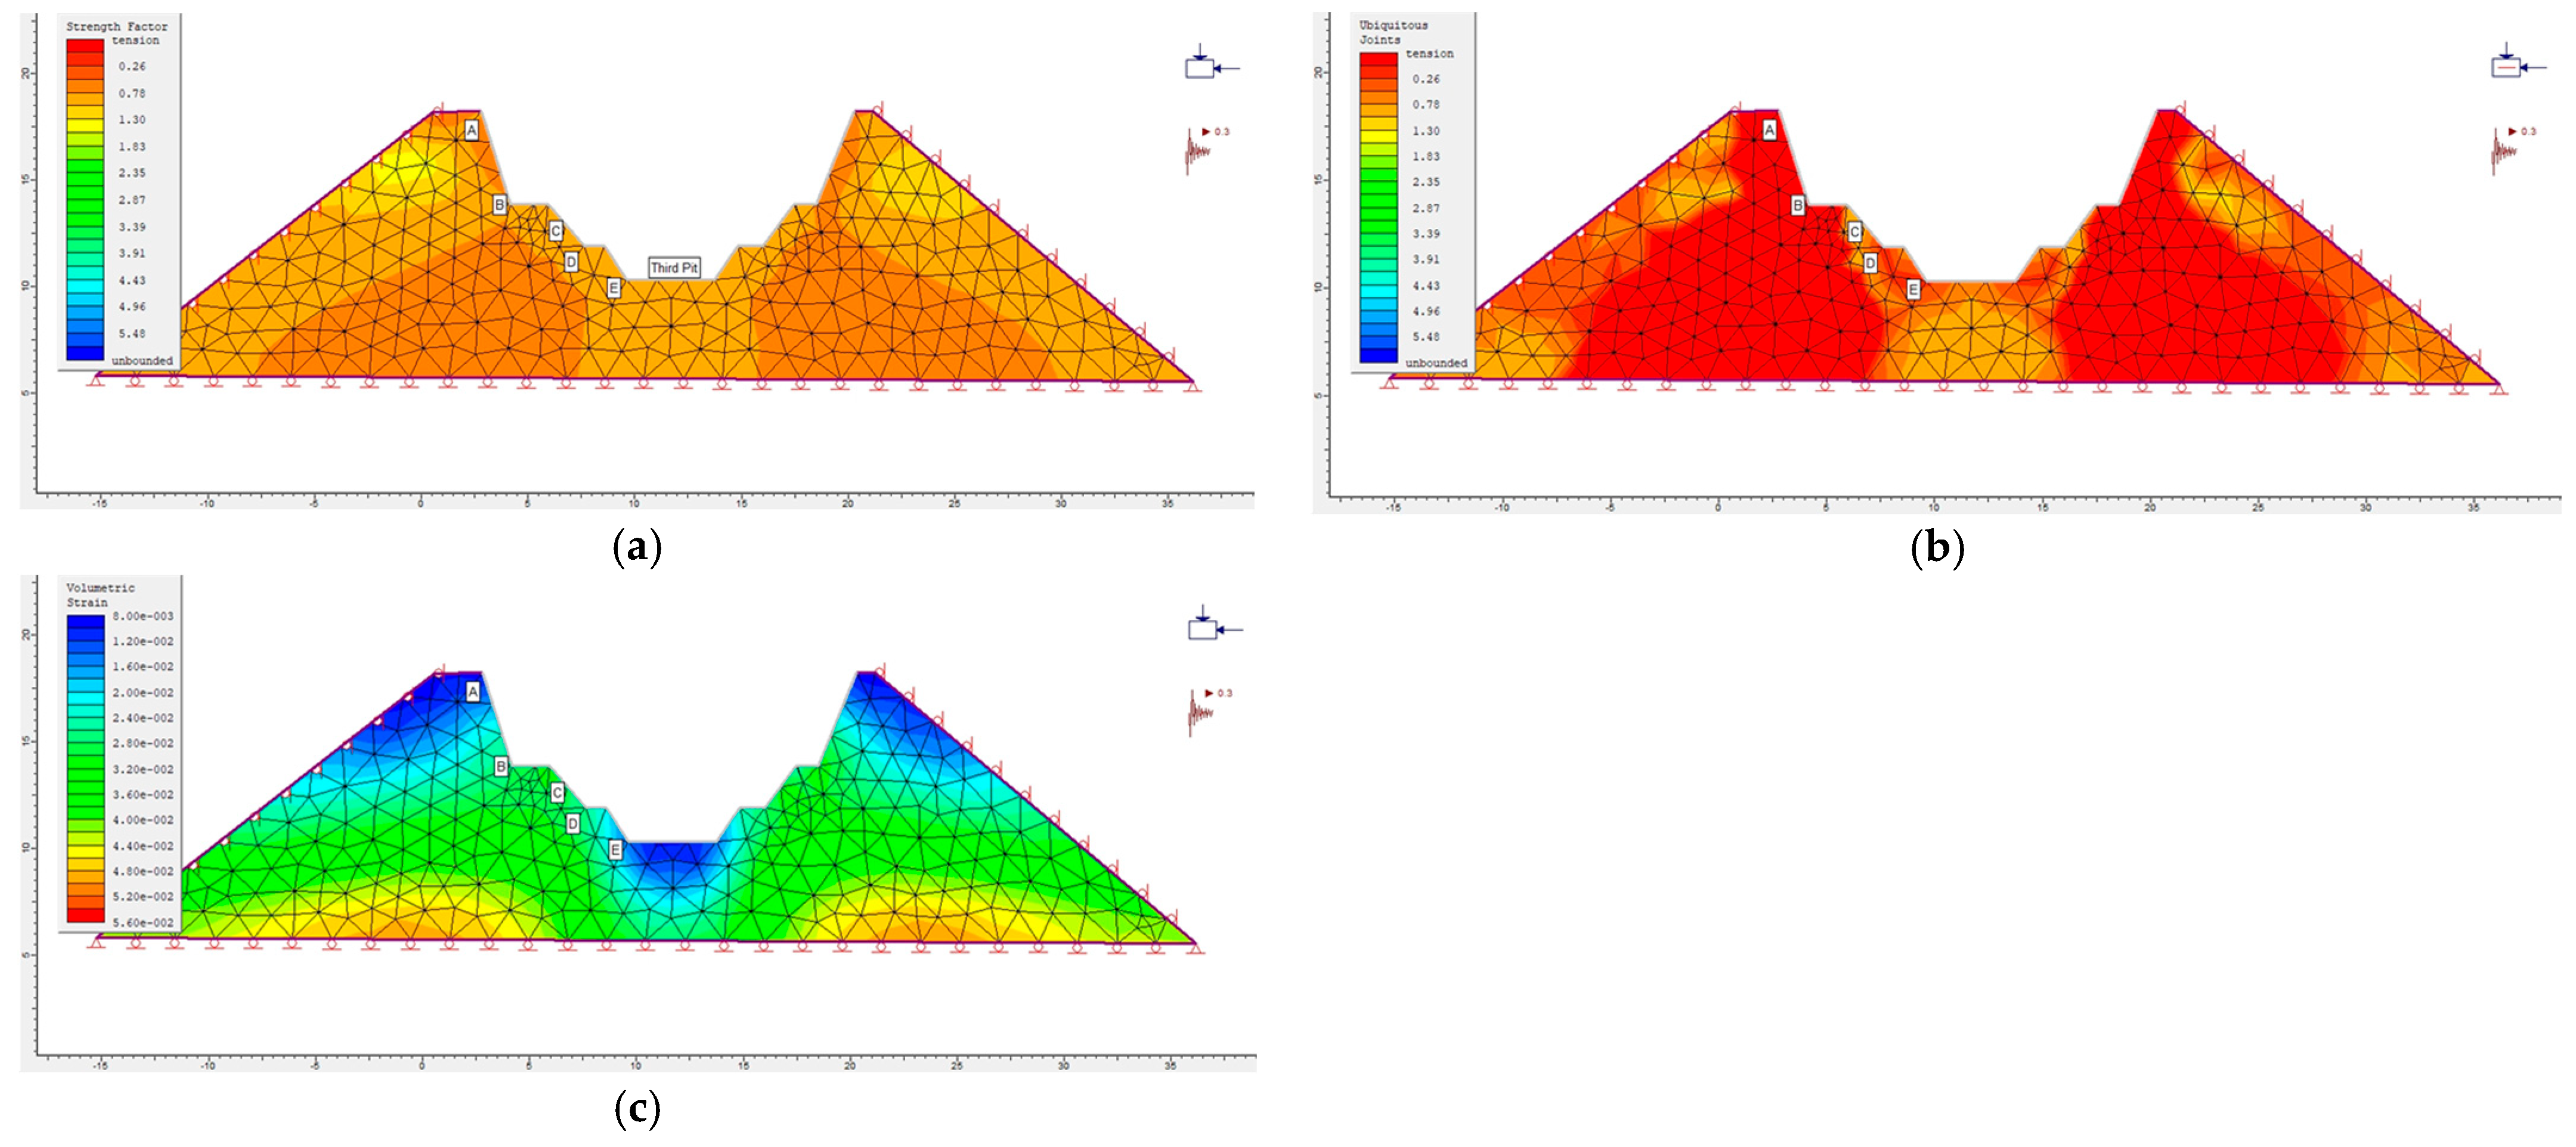
Figure 20.
(a) Modelled distribution of strength factor across the excavation (Stage 3). (b) Modelled distribution of ubiquitous joint factor (Stage 3). (c) Modelled distribution of volumetric strain (Stage 3).
Figure 20.
(a) Modelled distribution of strength factor across the excavation (Stage 3). (b) Modelled distribution of ubiquitous joint factor (Stage 3). (c) Modelled distribution of volumetric strain (Stage 3).
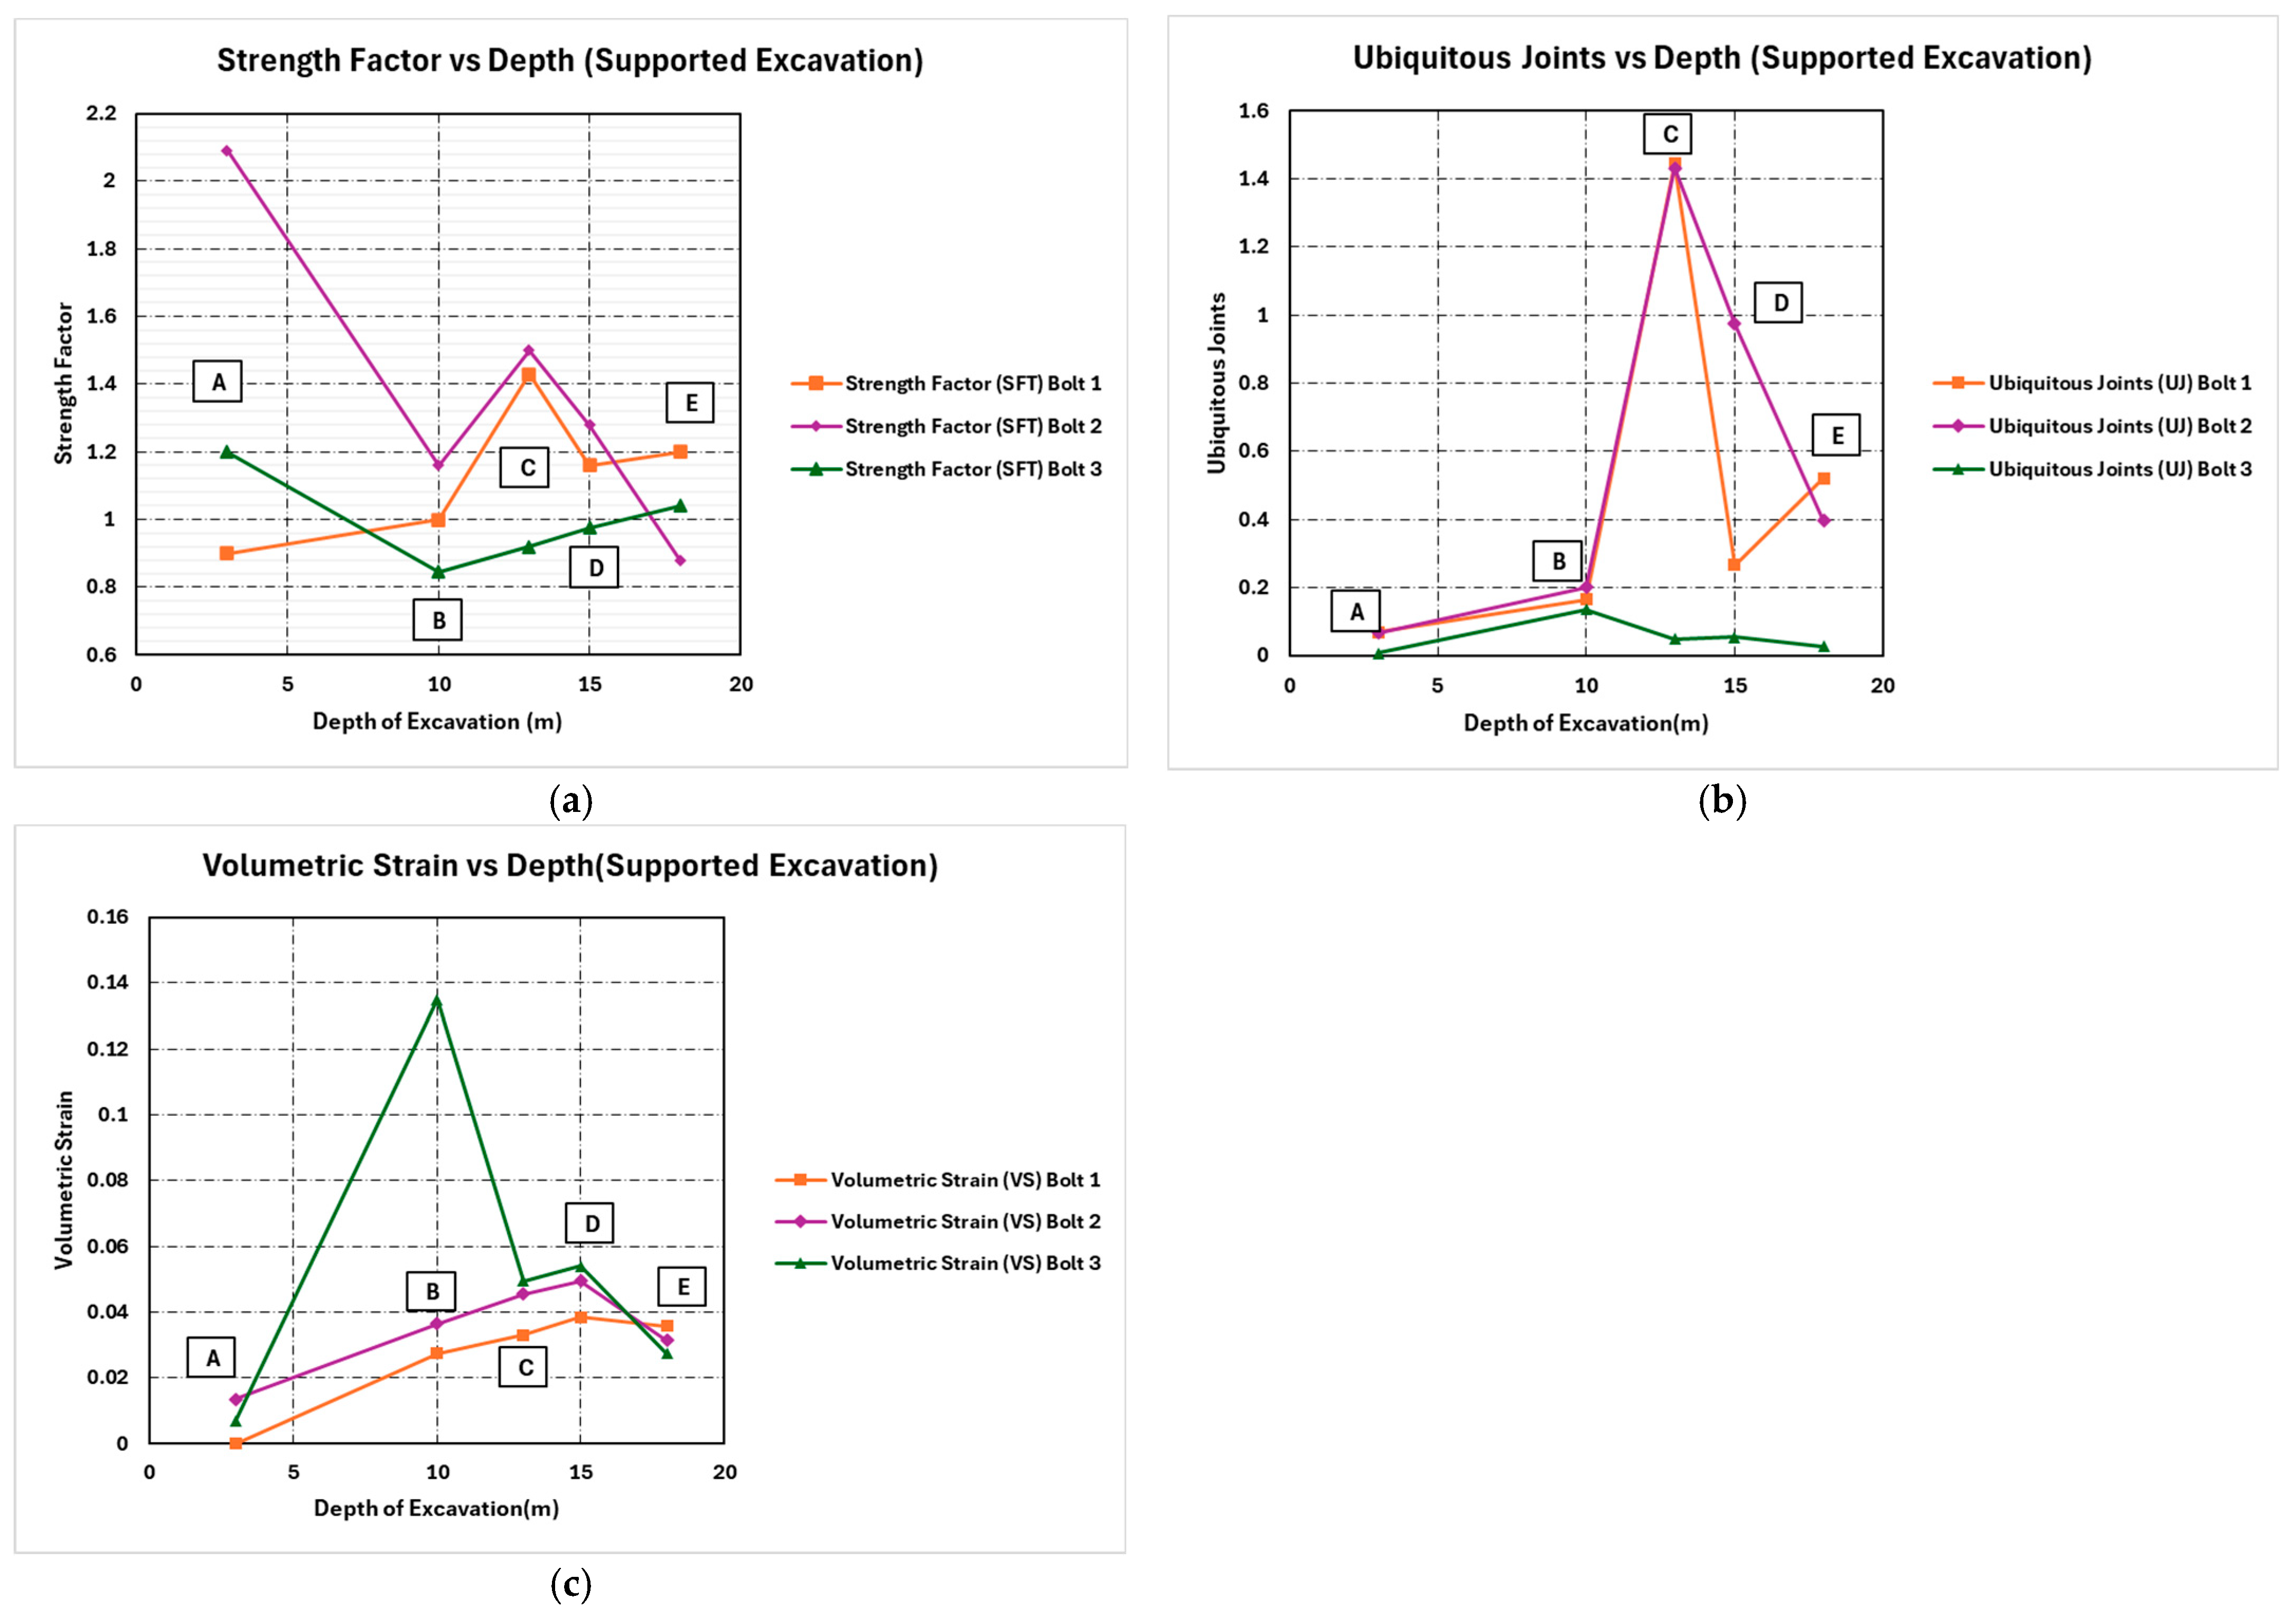
Figure 21.
Plots for surface excavations that are supported (Bolt 1)—(a) Strength Factor vs. Depth for supported excavation (Bolts 1–3). (b) Ubiquitous Joints vs. Depth for supported excavation (Bolts 1–3). (c) Volumetric Strain vs. Depth for supported excavation (Bolts 1–3).
Figure 21.
Plots for surface excavations that are supported (Bolt 1)—(a) Strength Factor vs. Depth for supported excavation (Bolts 1–3). (b) Ubiquitous Joints vs. Depth for supported excavation (Bolts 1–3). (c) Volumetric Strain vs. Depth for supported excavation (Bolts 1–3).
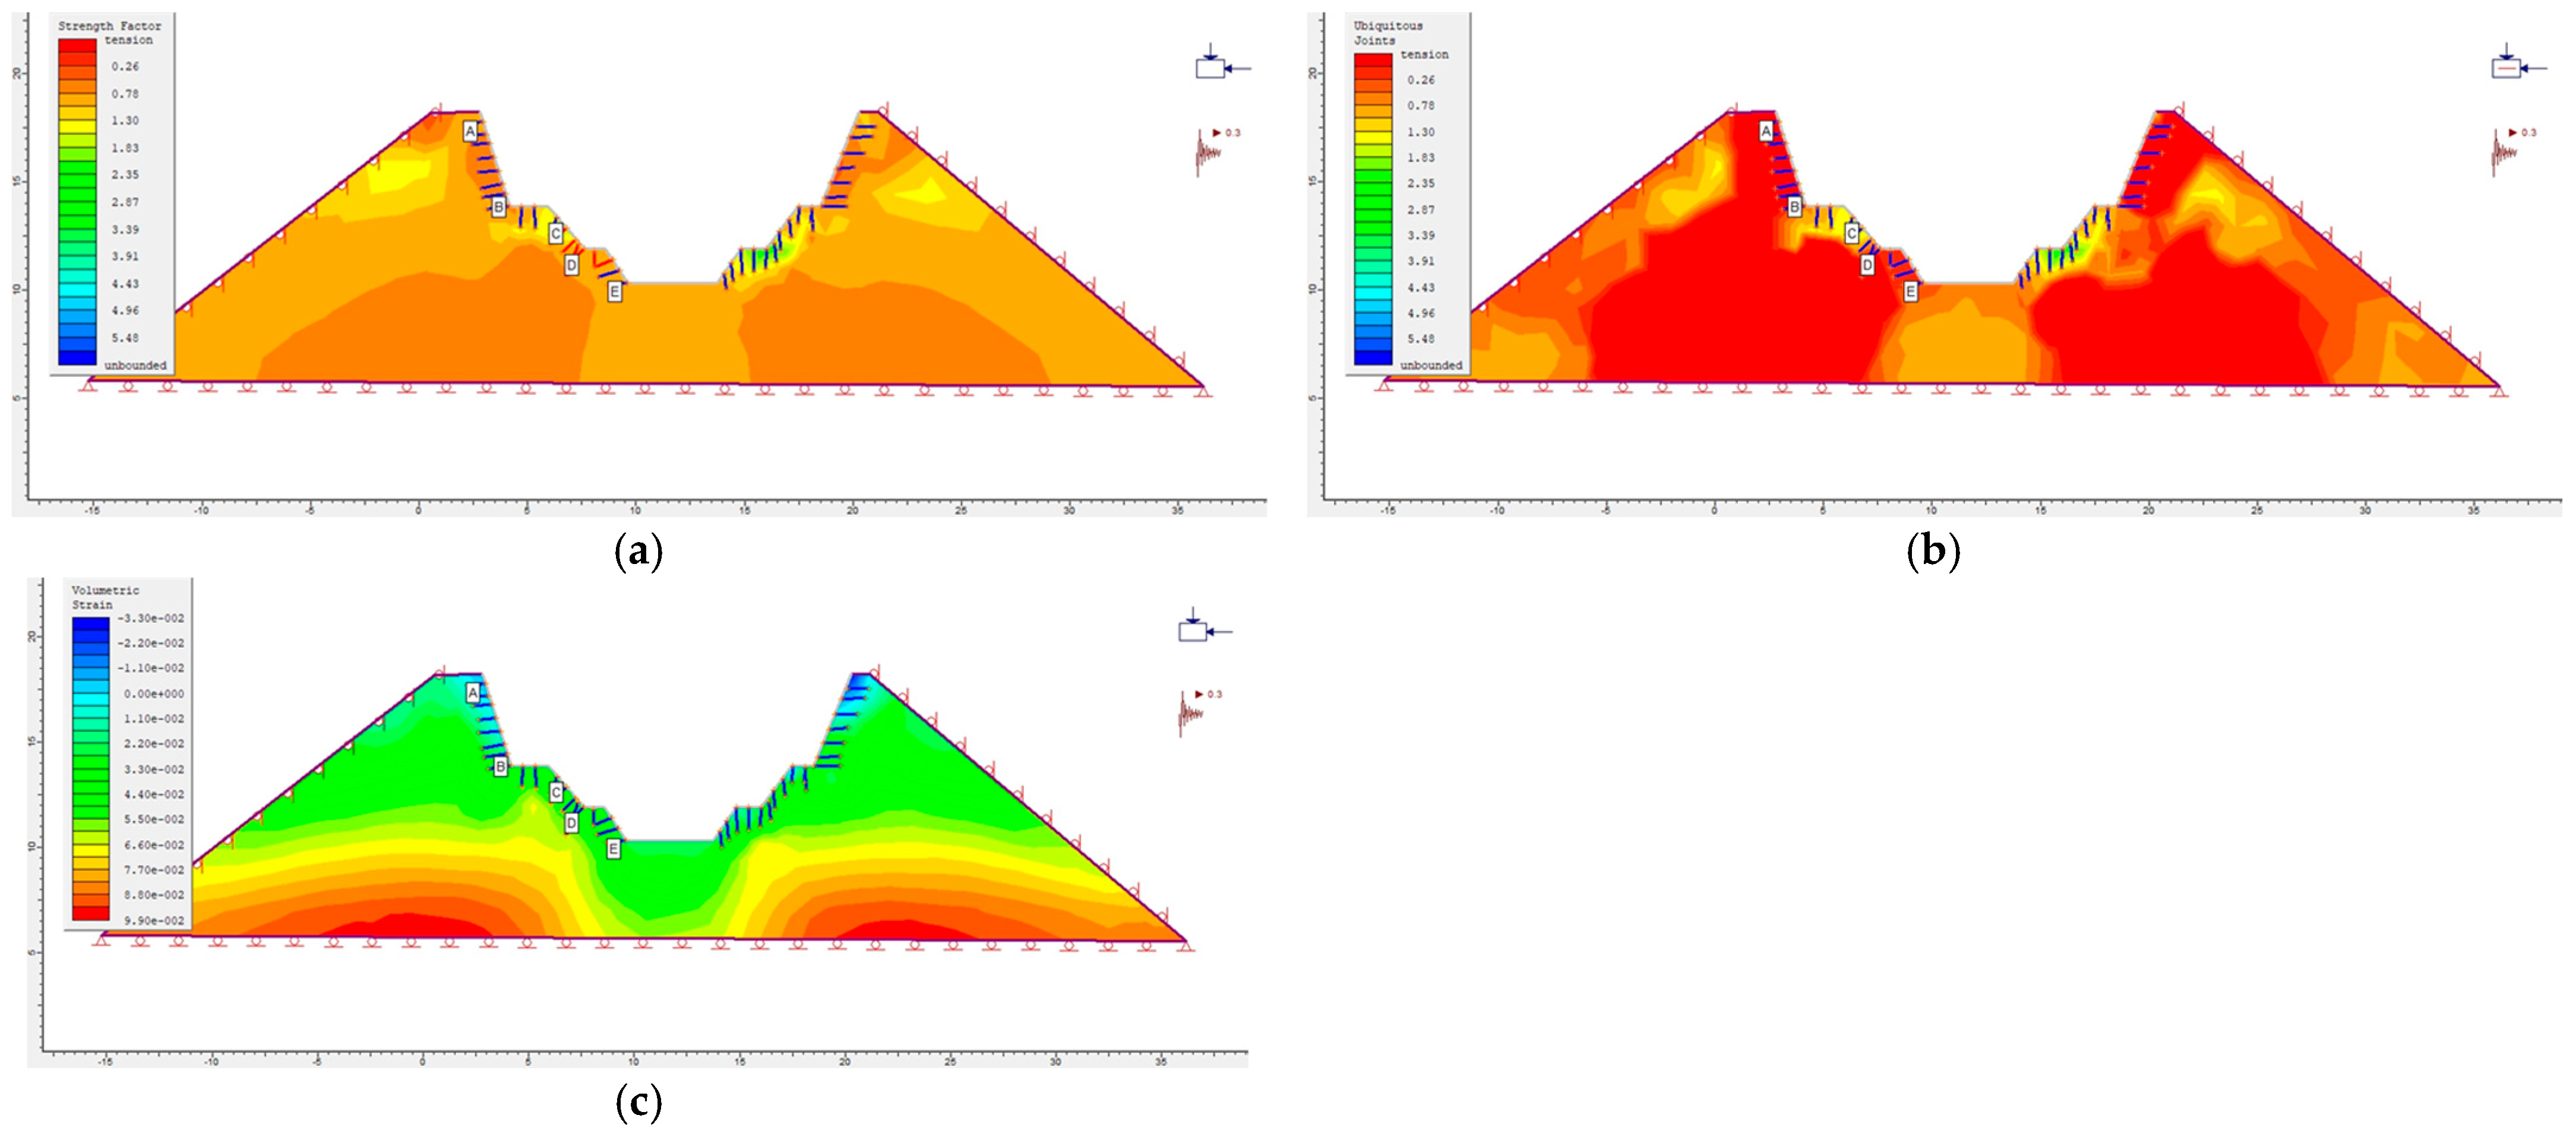
Figure 22.
Bolt 1: (a) Modelled strength factor distribution (supported excavation). (b) Modelled ubiquitous joint distribution (supported excavation). (c) Modelled volumetric strain distribution (supported excavation).
Figure 22.
Bolt 1: (a) Modelled strength factor distribution (supported excavation). (b) Modelled ubiquitous joint distribution (supported excavation). (c) Modelled volumetric strain distribution (supported excavation).
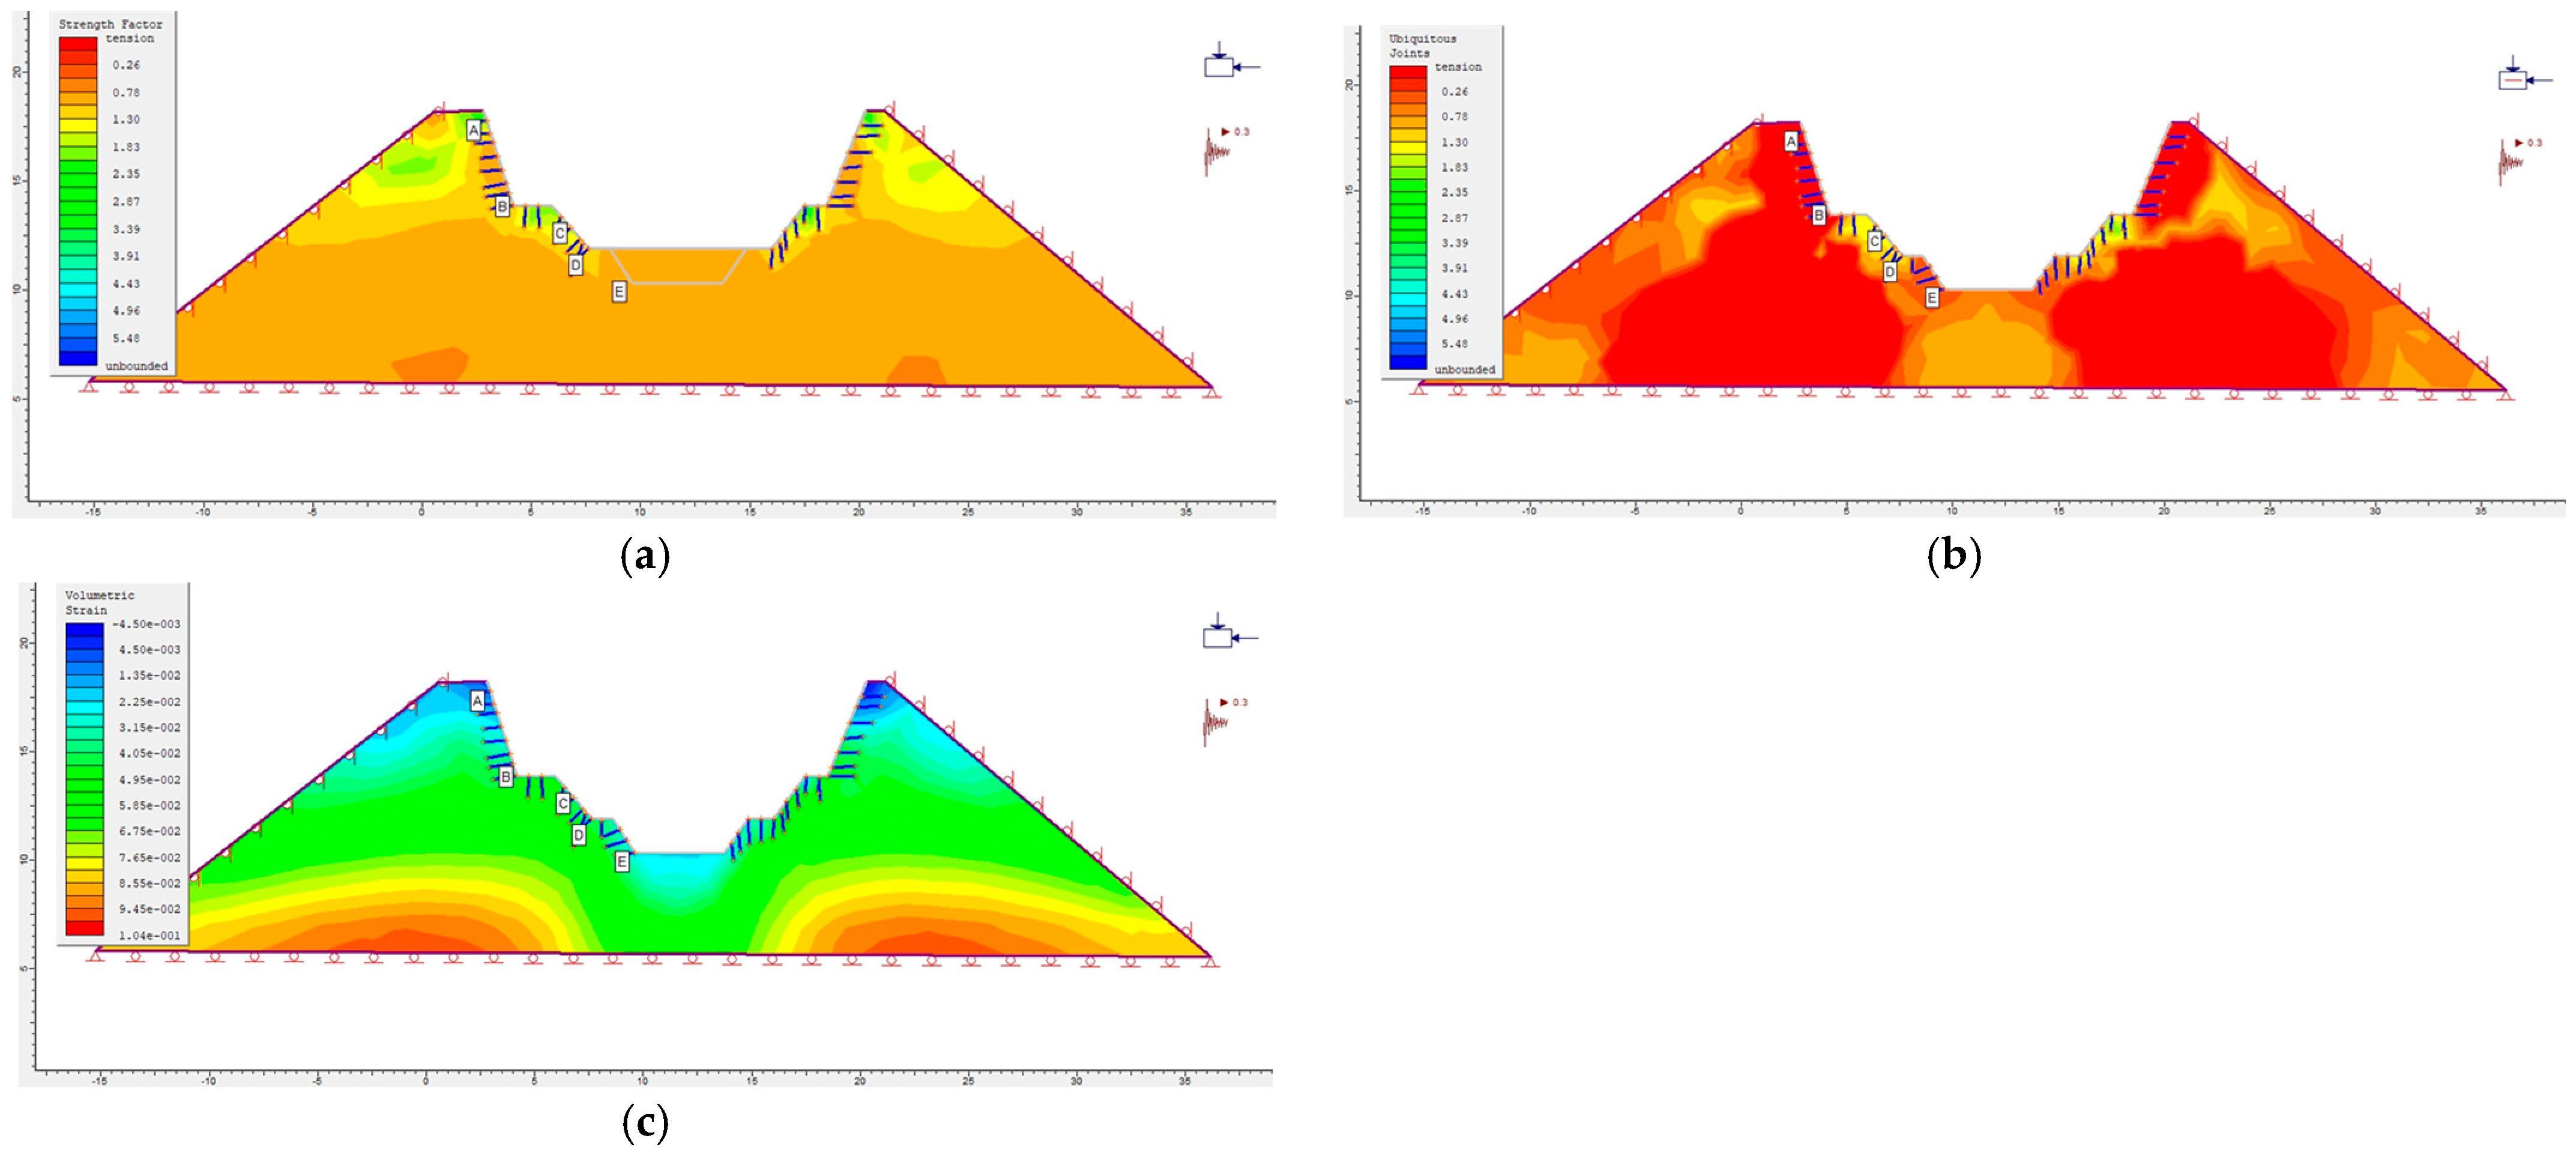
Figure 23.
Bolt 2: (a) Modelled strength factor distribution (supported excavation). (b) Modelled ubiquitous joint distribution (supported excavation). (c) Modelled volumetric strain distribution (supported excavation).
Figure 23.
Bolt 2: (a) Modelled strength factor distribution (supported excavation). (b) Modelled ubiquitous joint distribution (supported excavation). (c) Modelled volumetric strain distribution (supported excavation).
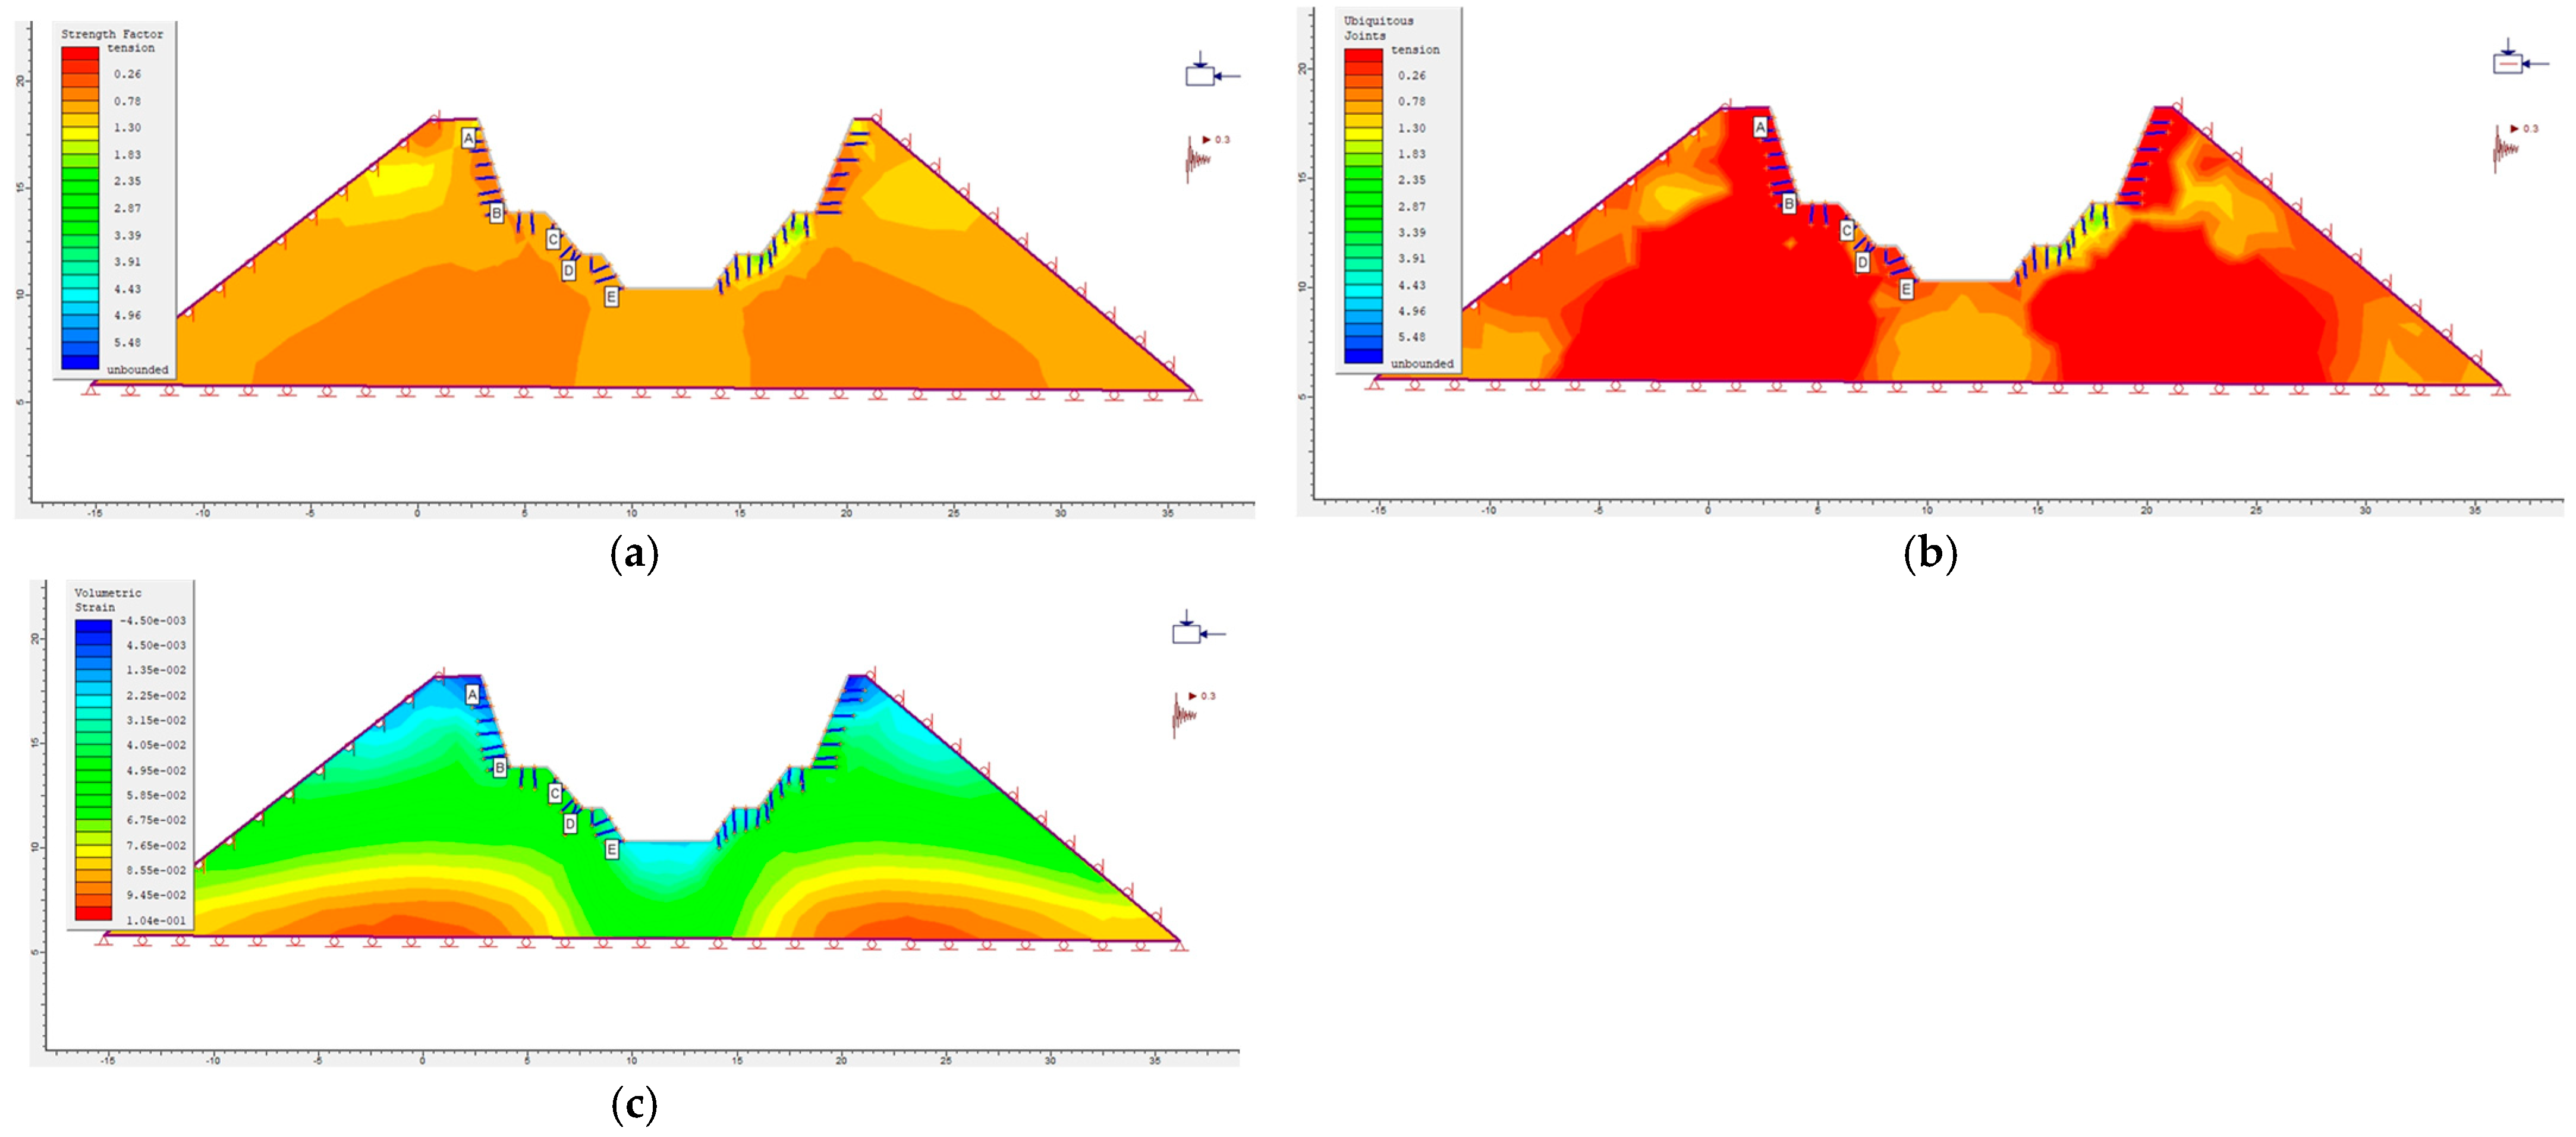
Figure 24.
Bolt 3: (a) Modelled strength factor distribution (supported excavation). (b) Modelled ubiquitous joint distribution (supported excavation). (c) Modelled volumetric strain distribution (supported excavation).
Figure 24.
Bolt 3: (a) Modelled strength factor distribution (supported excavation). (b) Modelled ubiquitous joint distribution (supported excavation). (c) Modelled volumetric strain distribution (supported excavation).
Figure 25.
Plots for surface excavations that are supported and unsupported. (a) Strength Factor vs. Depth. (b) Ubiquitous Joints vs. Depth. (c) Volumetric Strain vs. Depth.
Figure 25.
Plots for surface excavations that are supported and unsupported. (a) Strength Factor vs. Depth. (b) Ubiquitous Joints vs. Depth. (c) Volumetric Strain vs. Depth.
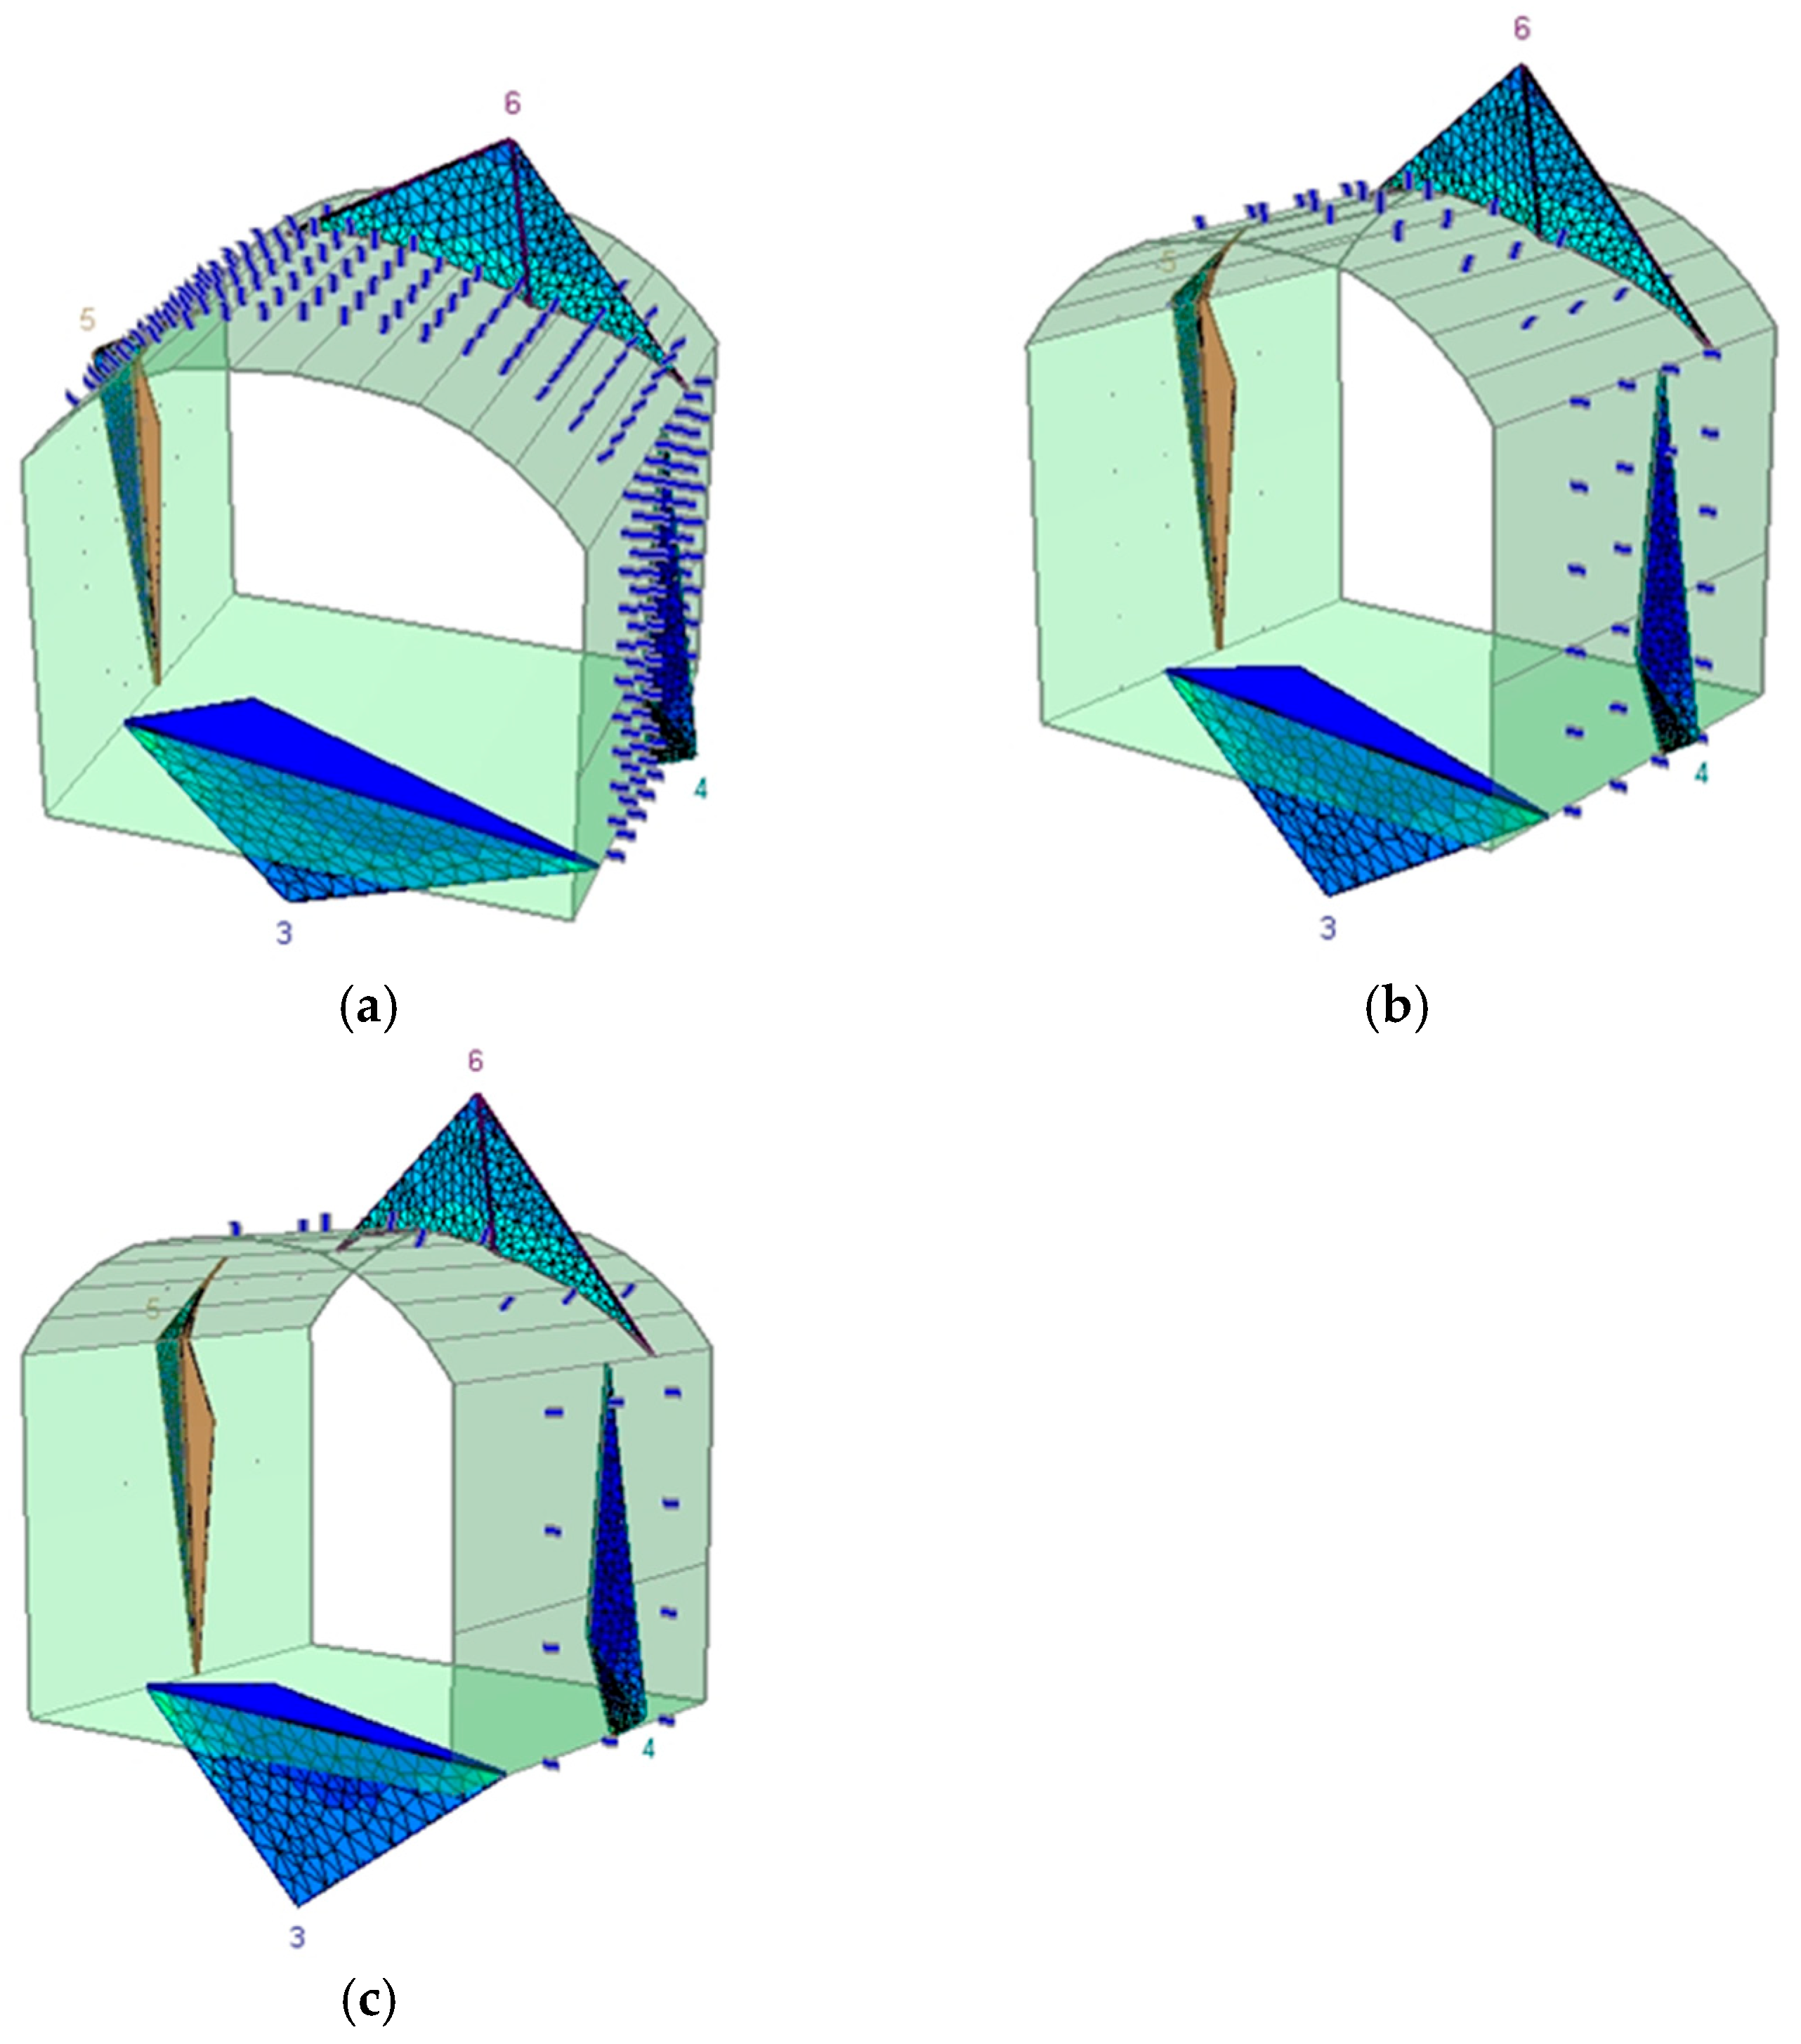
Figure 26.
Three-dimensional visualisation of wedge geometry in the unsupported tunnel scenario.
Figure 26.
Three-dimensional visualisation of wedge geometry in the unsupported tunnel scenario.
Figure 27.
Simulated tunnel response using 190 mm resin bolts at spacings of (a) 0.5 m, (b) 1.0 m, (c) 1.5 m, and (d) 2.0 m. Plots show major principal stress contours highlighting the evolution of support effectiveness and failure localisation under dynamic loading.
Figure 27.
Simulated tunnel response using 190 mm resin bolts at spacings of (a) 0.5 m, (b) 1.0 m, (c) 1.5 m, and (d) 2.0 m. Plots show major principal stress contours highlighting the evolution of support effectiveness and failure localisation under dynamic loading.
Figure 28.
Stress distribution and bolt interaction patterns for 200 mm bolts at varying spacings: (a) 0.5 m, (b) 1.0 m, (c) 1.5 m, and (d) 2.0 m. The figures illustrate progressive loss of confinement and increased stress localisation as spacing increases, particularly near the roof and wall wedges. Optimal load transfer and bolt engagement are observed at or below 1.0 m spacing.
Figure 29.
Stress distribution and bolt engagement under dynamic loads for 250 mm bolts at varying spacing: (a) 0.5 m spacing, (b) 1.0 m spacing, (c) 1.5 m spacing. Increased spacing correlates with heightened stress localisation and reduced bolt efficacy, particularly near the roof and shoulder wedges.
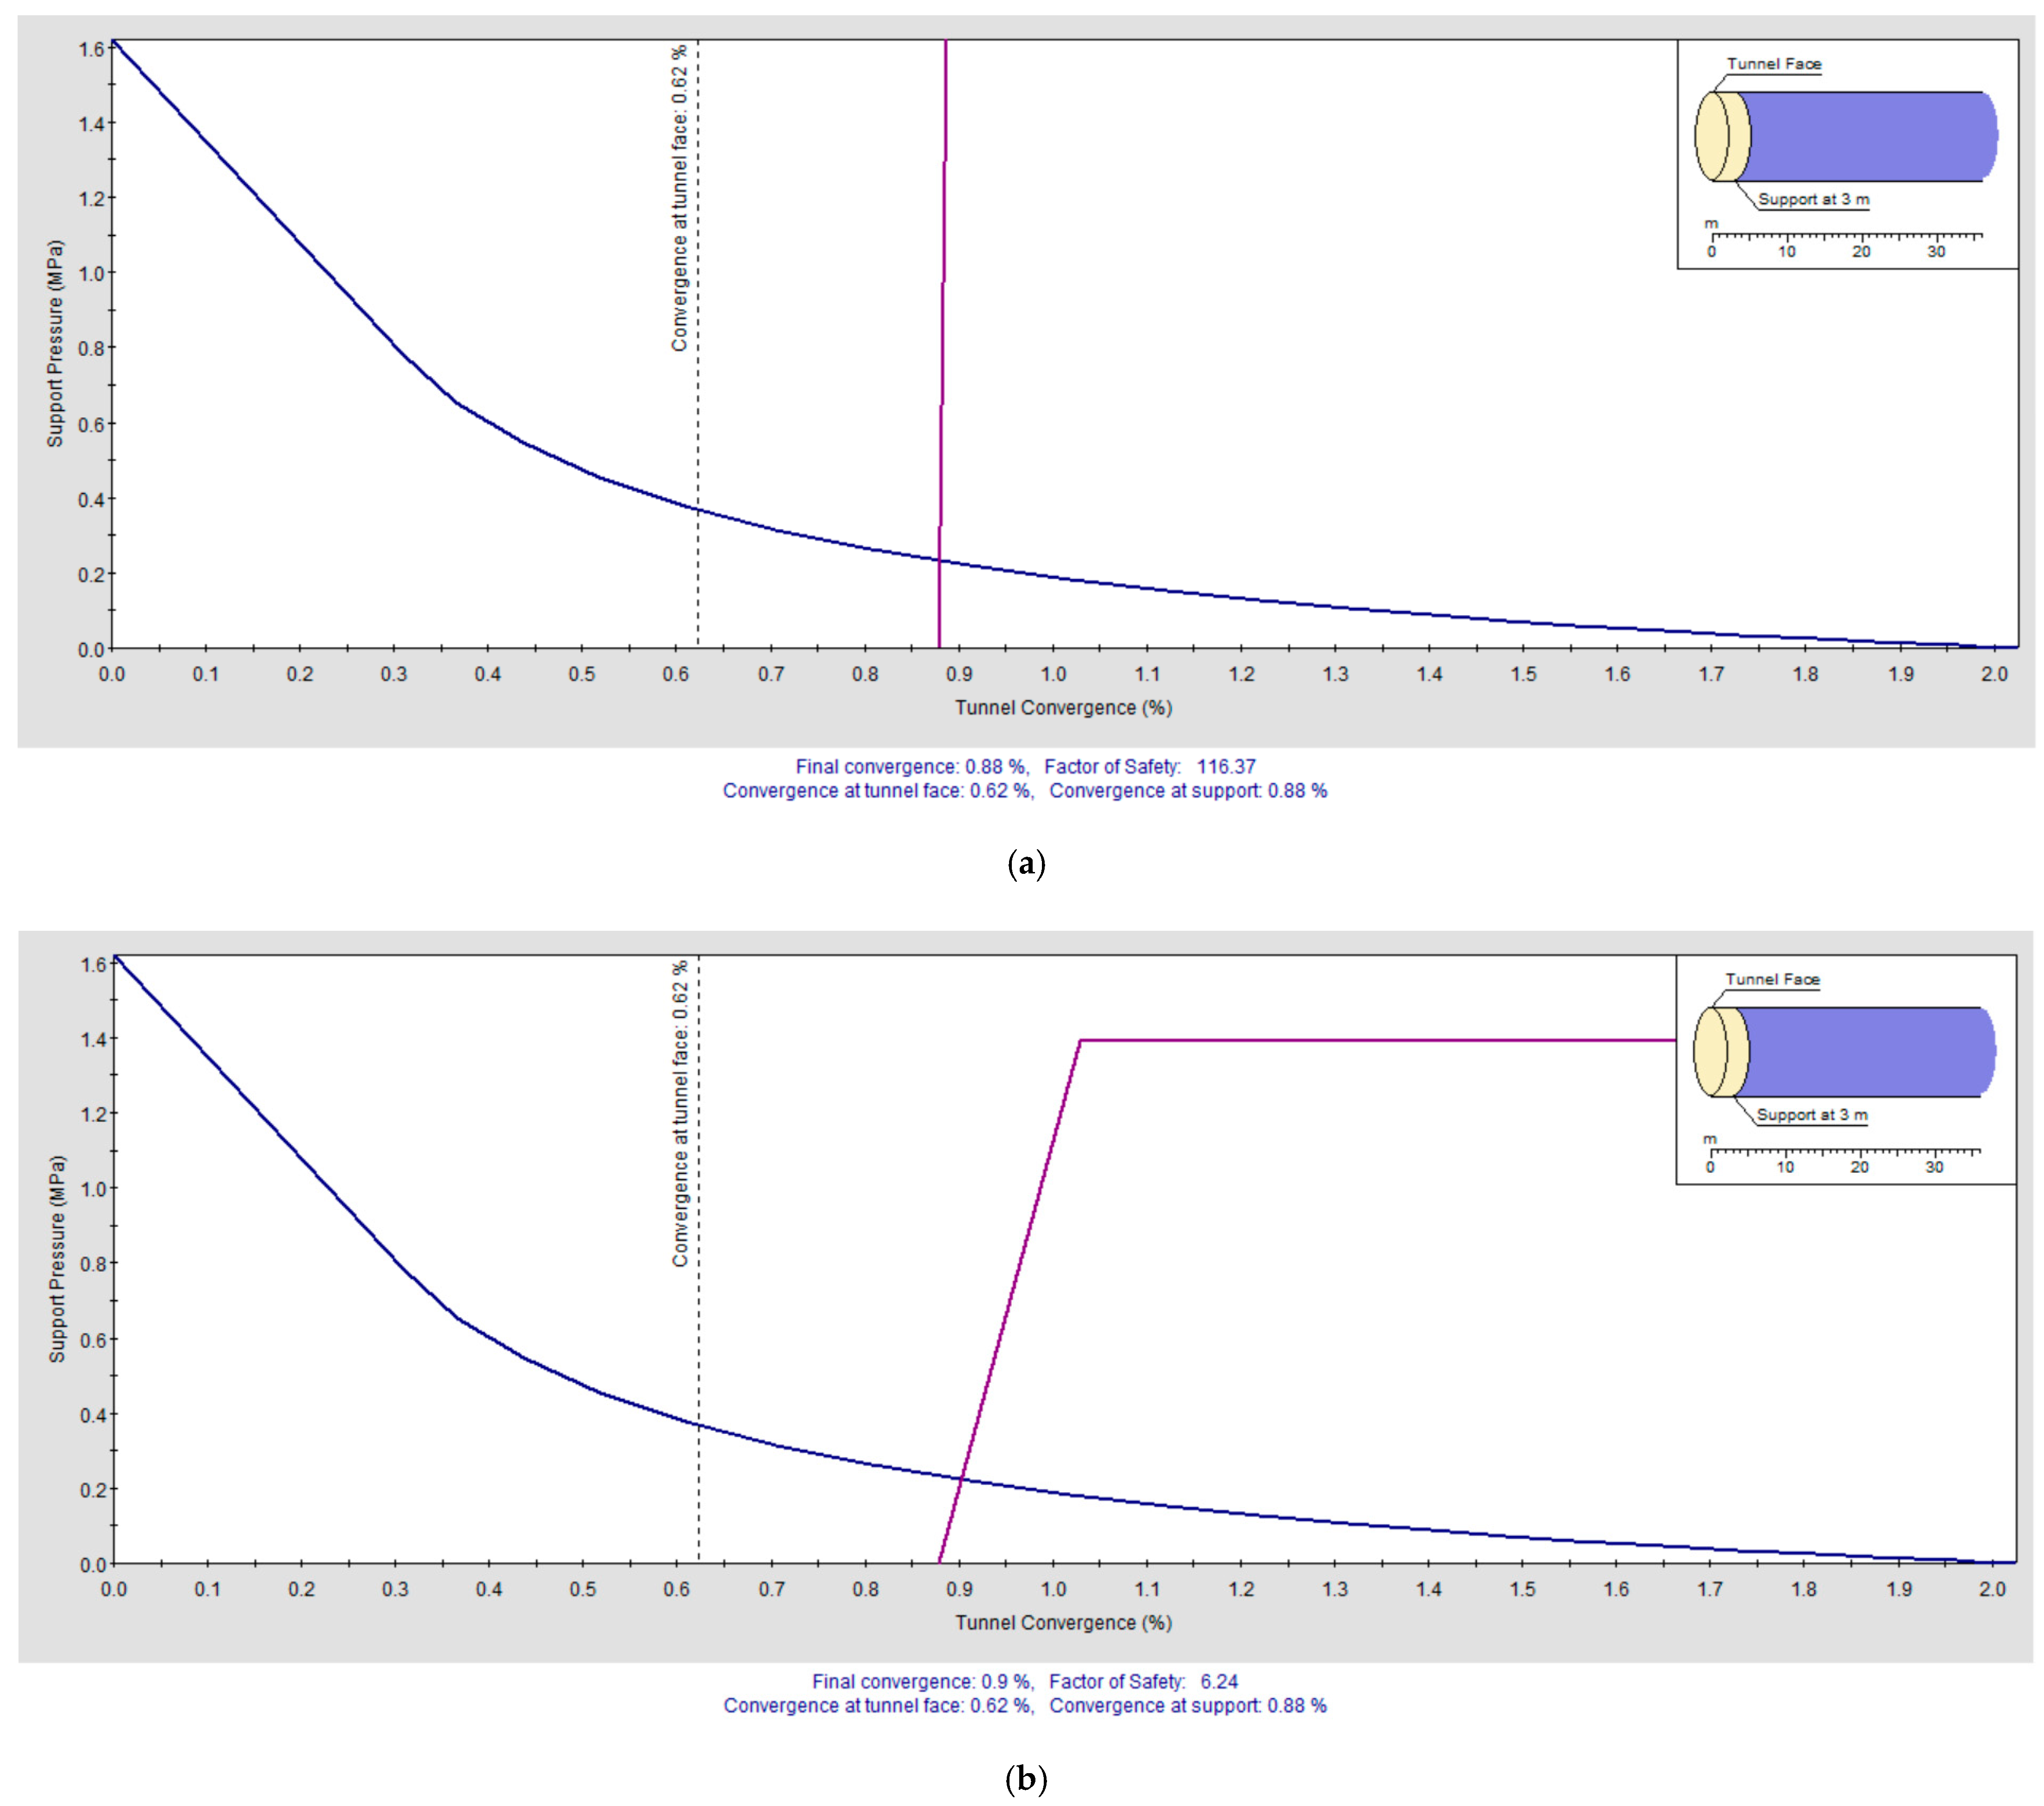
Figure 30.
Ground Reaction and Support Reaction Curves for Varying Bolt Spacings: (a) 0.1 m and (b) 0.5 m.
Figure 30.
Ground Reaction and Support Reaction Curves for Varying Bolt Spacings: (a) 0.1 m and (b) 0.5 m.
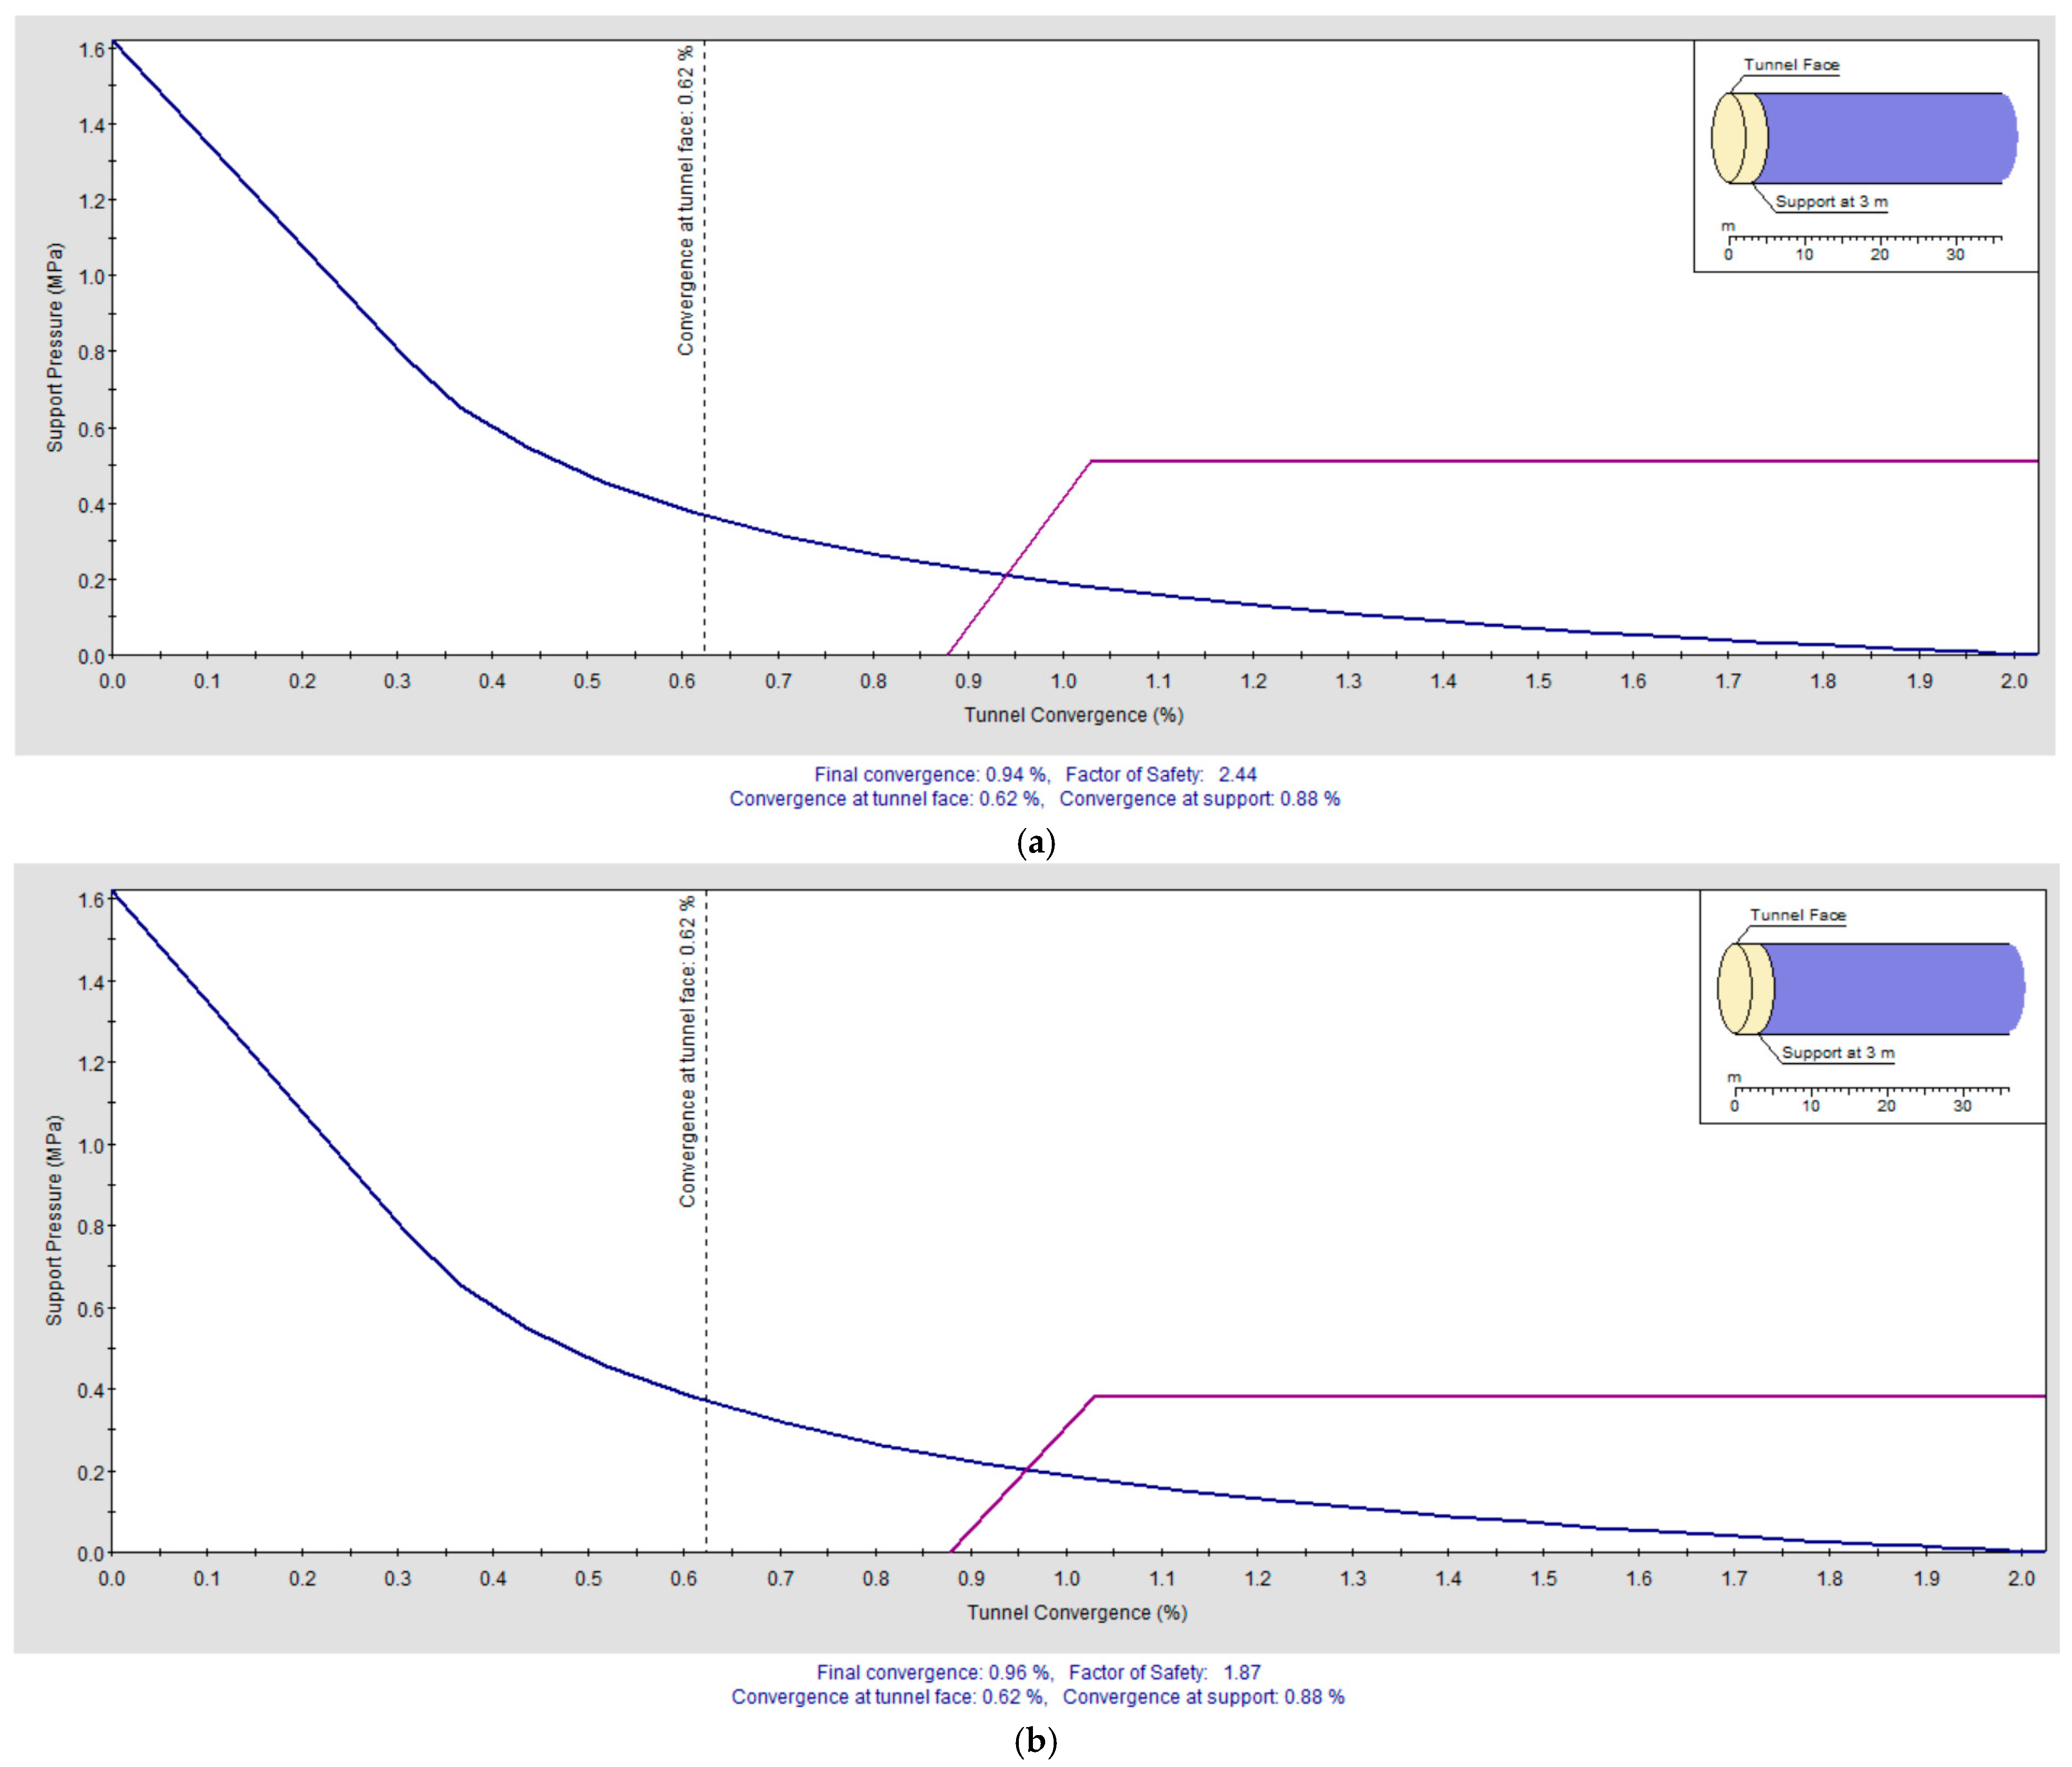
Figure 31.
Ground Reaction and Support Reaction Curves for Varying Bolt Spacings: (a) 1.0 m and (b) 1.5 m.
Figure 31.
Ground Reaction and Support Reaction Curves for Varying Bolt Spacings: (a) 1.0 m and (b) 1.5 m.
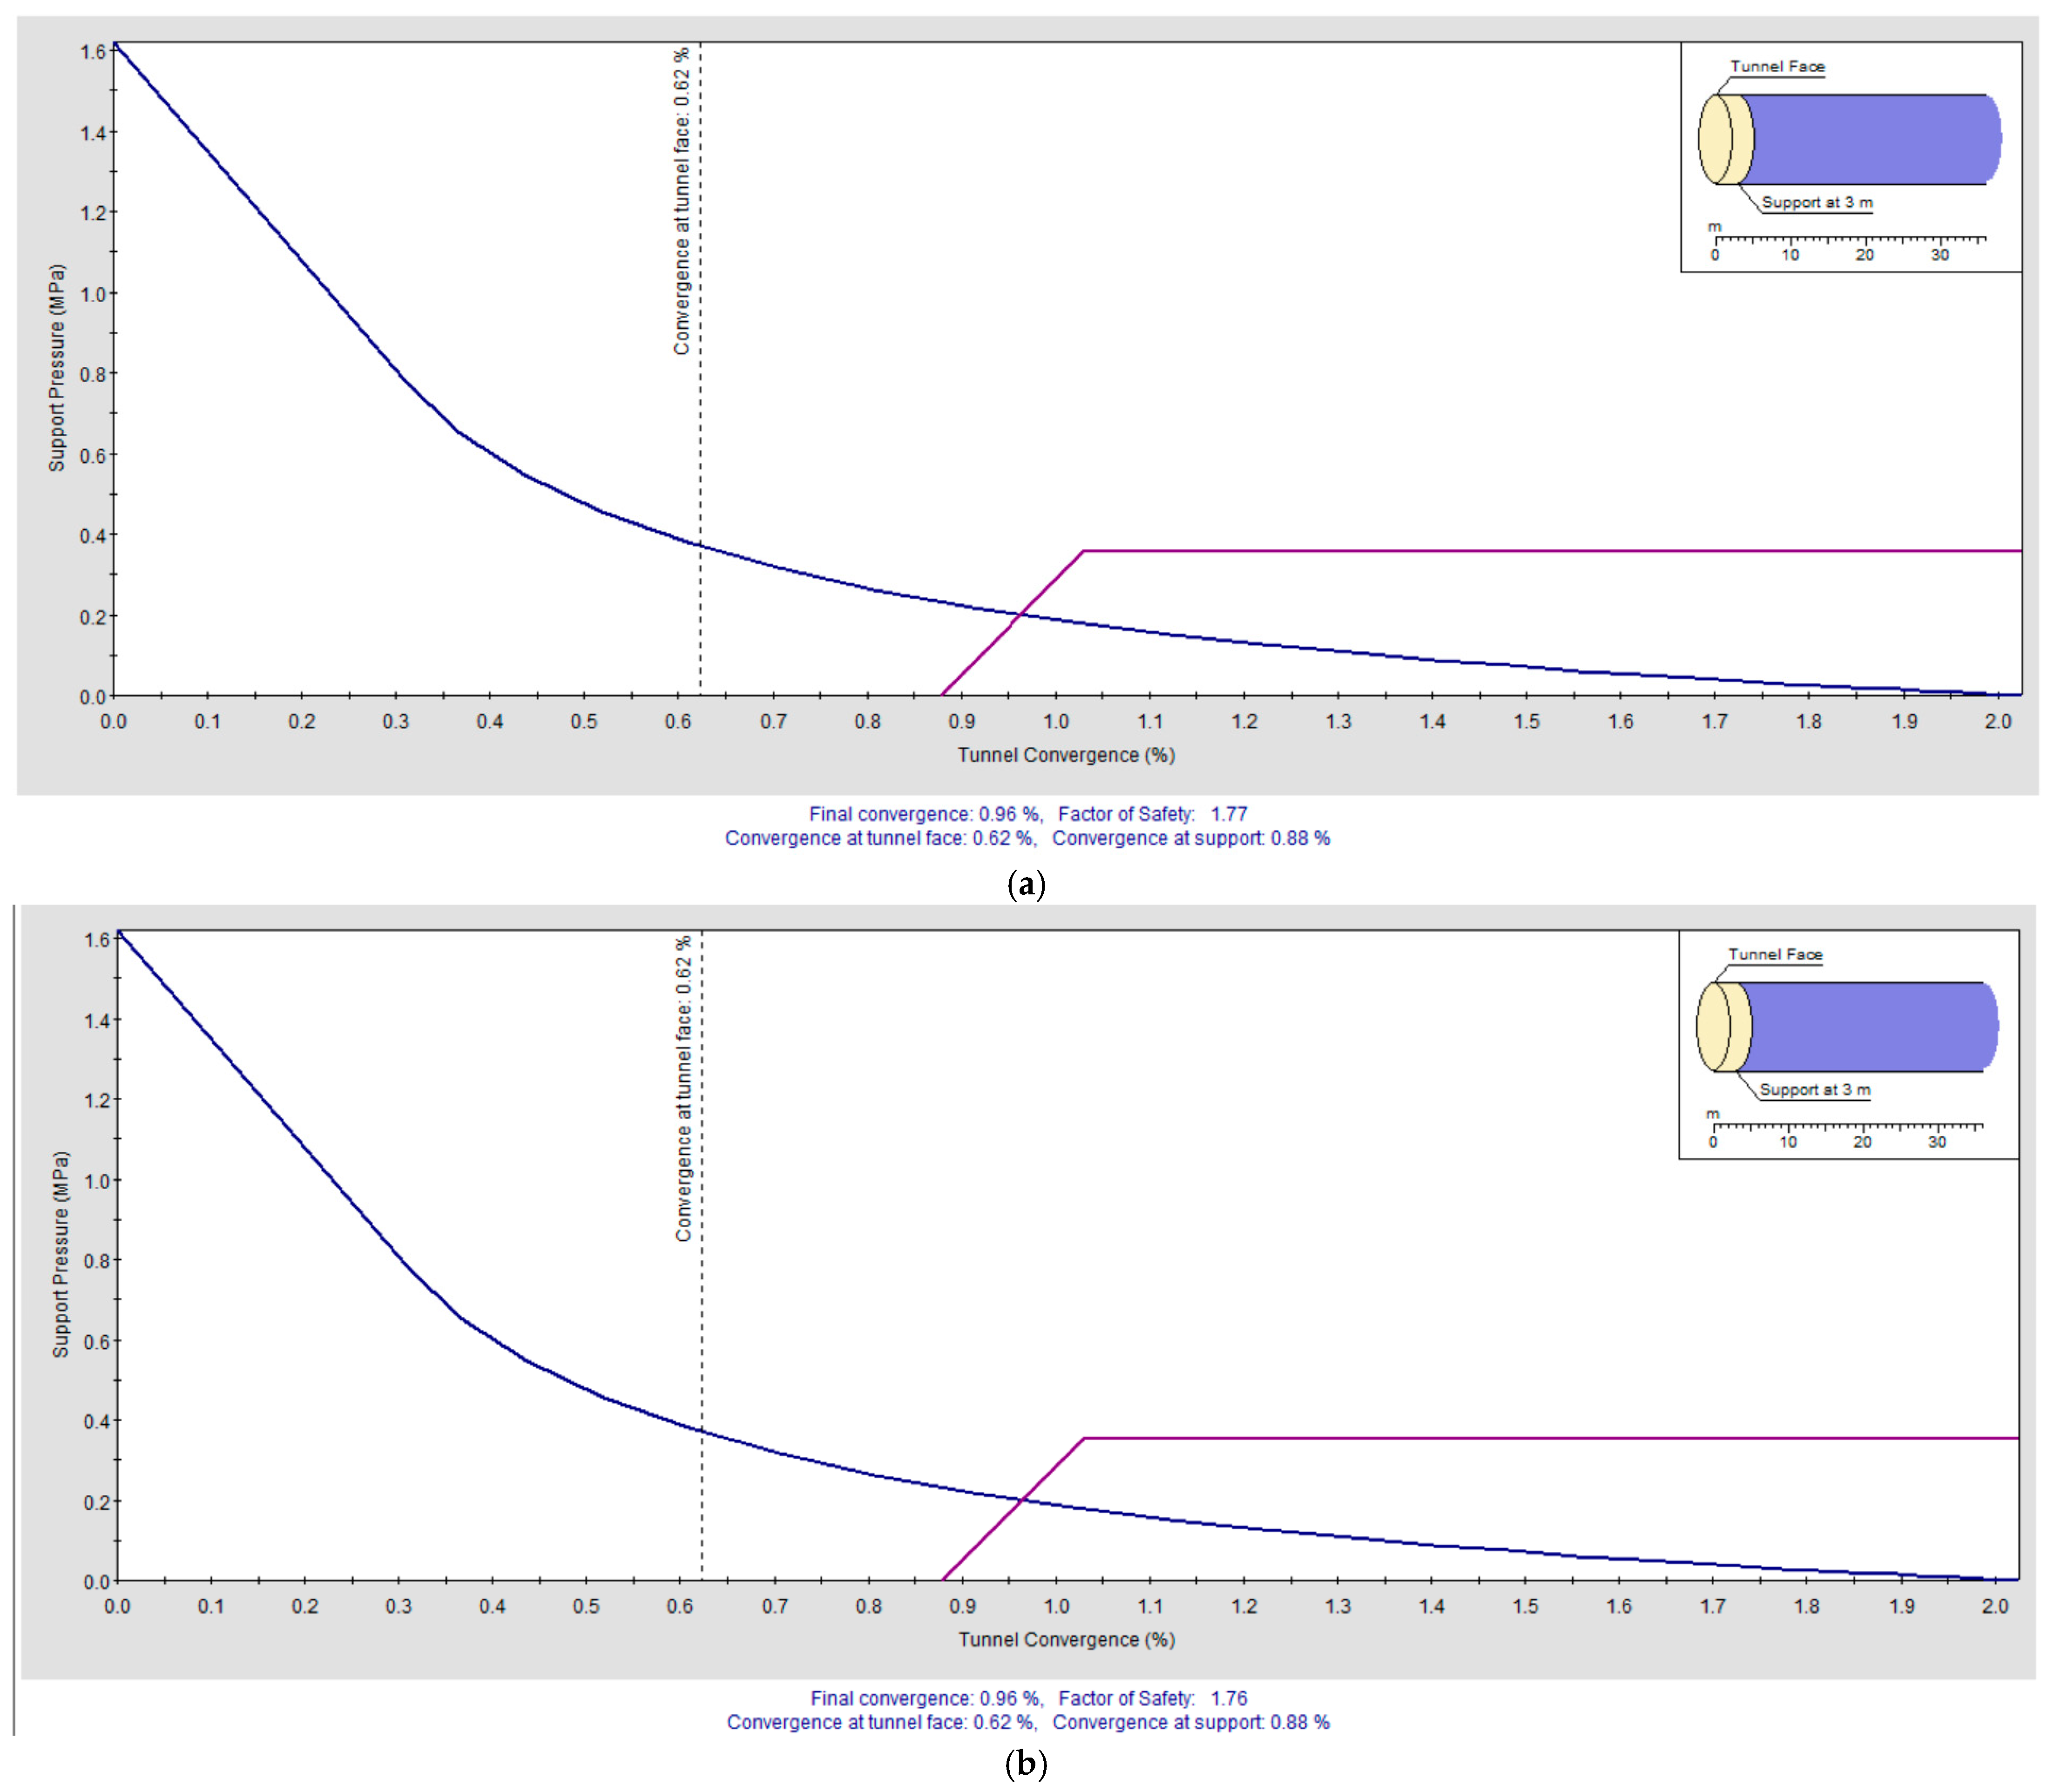
Figure 32.
Ground Reaction and Support Reaction Curves for Varying Bolt Spacings: (a) 2.0 m and (b) 2.5 m.
Figure 32.
Ground Reaction and Support Reaction Curves for Varying Bolt Spacings: (a) 2.0 m and (b) 2.5 m.
Table 1.
Summary of the test parameters for laboratory pull-out tests.
Table 1.
Summary of the test parameters for laboratory pull-out tests.
| Parameter | Value/Range |
|---|
| Concrete strength | 30–35 MPa |
| Hole diameter | 18–22 mm |
| Bolt sizes | M16, M20 |
| Curing time | 12–24 h |
| Adhesive types | FIS V Plus, EM Plus |
| Loading rate | 2 mm/min |
Table 2.
Key parameters for static field testing at Videx Mining Facility.
Table 2.
Key parameters for static field testing at Videx Mining Facility.
| Parameter | Value/Range |
|---|
| Rock condition | Fractured/Intact |
| Hole diameter | 18 mm, 24 mm |
| Bolt Diameters | 16 mm, 20 mm |
| Bolt Lengths | 160 mm, 245 mm |
| Number of bolts | 15 |
| Curing time | 12–24 h |
| Loading rate | 2 mm/min |
| Resin type | Two-part (standard vinyl ester and epoxy) |
Table 3.
Input parameters for fully bonded adhesive bolts in Phase 2 modelling.
Table 3.
Input parameters for fully bonded adhesive bolts in Phase 2 modelling.
| Parameter | Value |
|---|
| Bolt Type | Fully bonded |
| Bolt Length (m) | 2.4 |
| Bolt Diameter (mm) | 20 |
| Young’s Modulus (GPa) | 210 |
| Bond Strength (MPa) | 1.3 |
| Bolt Spacing (m) | 2.0 |
Table 4.
Material properties used in the Phase 2 simulation.
Table 4.
Material properties used in the Phase 2 simulation.
| Material | Young’s Modulus (GPa) | Poisson’s Ratio | UCS (MPa) | Bond Strength (MPa) | Density (kg/m3) |
|---|
| Intact Rock | 35 | 0.25 | 80 | — | 2700 |
| Fractured Rock | 18 | 0.28 | 20 | — | 2650 |
| Grout/Adhesive | 14 | 0.22 | 12 | 1.3 | 2000 |
| Steel (bolt) | 210 | 0.30 | — | — | 7850 |
Table 5.
Input parameters used for Unwedge simulation.
Table 5.
Input parameters used for Unwedge simulation.
| Parameter | Value |
|---|
| Bench/Slope Height (m) | [10.0] |
| Bench Width (m) | [8.0] |
| Slope Angle (°) | [60–70] |
| Joint 1 Dip/Direction | 70°/37° |
| Joint 2 Dip/Direction | 85°/101° |
| Joint 3 Dip/Direction | 48°/262° |
| Bolt Spacing (in/out plane) | 2.0 m × 2.0 m |
| Principal Stress σ1 (MPa) | 89 |
| σ2/σ3 (MPa) | 47/27 |
Table 6.
Summary of peak load results by configuration. Each row lists a unique resin–bolt–test combination. Laboratory entries summarise tests at 3, 7, 15 days of curing; field entries are in situ pull-out tests at the Videx Mining testing centre.
Table 6.
Summary of peak load results by configuration. Each row lists a unique resin–bolt–test combination. Laboratory entries summarise tests at 3, 7, 15 days of curing; field entries are in situ pull-out tests at the Videx Mining testing centre.
| Resin System | Bolt Diameter (mm) | Bolt Length (mm) | Test Type | Curing Time (days) | Mean Peak Load (kN) | Std. Dev. (kN) | COV (%) | Notes |
|---|
| Vinyl ester resin | 16 | 160 | Lab | 3, 7, 15 | 26.39 | 12.69 | 48.08 | Laboratory pull-out |
| Vinyl ester resin | 20 | 245 | Lab | 3, 7, 15 | 65.00 | 19.86 | 30.55 | Laboratory pull-out |
| Epoxy resin | 16 | 160 | Lab | 3, 7, 15 | 56.43 | 19.18 | 33.99 | Laboratory pull-out |
| Epoxy resin | 20 | 245 | Lab | 3, 7, 15 | 6.97 | 3.55 | 50.94 | Laboratory pull-out |
| Vinyl ester resin | 20 | 160 | In situ | — | 103.67 | 43.67 | 42.12 | Field pull-out; Videx Mining testing centre |
| Vinyl ester resin | 24 | 210 | In situ | — | 98.90 | 35.02 | 35.41 | Field pull-out; Videx Mining testing centre |
| Epoxy resin | 20 | 350 | In situ | — | 118.17 | 37.63 | 31.84 | Field pull-out; Videx Mining testing centre |
| Vinyl ester resin | 10 | 90 | In situ | — | 8.12 | 5.40 | 66.51 | Field pull-out; Videx Mining testing centre |
Table 7.
Tensile and Shear Capacities for each anchor configuration.
Table 7.
Tensile and Shear Capacities for each anchor configuration.
| Anchor System | Diameter × Embedment (mm) | Day 5 Tensile (kN) | Day 10 Tensile (kN) | Day 15 Tensile (kN) | Day 5 Shear (kN) | Day 10 Shear (kN) | Day 15 Shear (kN) |
|---|
| Epoxy | 16 × 160 | 43 | 61 | 72 | 36 | 51 | 60 |
| | 20 × 245 | 65 | 92 | 108 | 54 | 77 | 90 |
| Standard Vinyl ester | 16 × 160 | 51 | 63 | 68 | 43 | 52 | 57 |
| | 20 × 245 | 77 | 94 | 102 | 64 | 78 | 85 |
| High-bond Vinyl ester | 16 × 125 | 44 | 57 | 62 | 36 | 47 | 52 |
| | 20 × 210 | 69 | 88 | 97 | 57 | 73 | 81 |
Table 8.
Summary of field pull-out test results (20 mm diameter, 250 mm length bolts; n reported per grouping; values are means with ±1 SD where applicable).
Table 8.
Summary of field pull-out test results (20 mm diameter, 250 mm length bolts; n reported per grouping; values are means with ±1 SD where applicable).
| Test No. | Rock Condition | Resin System | Peak Force (kN) | Max Stress (MPa) | Extension at Peak (mm) | Failure Mode |
|---|
| 1 | Fractured | Epoxy Mortar | 38.1 | 149.8 | 0.2 | Adhesive pull-out |
| 2 | Fractured | Epoxy Mortar | 40.5 | 157.0 | 1 | Adhesive pull-out |
| 3 | Fractured | Epoxy Mortar | 43.2 | 165.5 | 1 | Adhesive pull-out |
| 4 | Fractured | Epoxy Mortar | 39.7 | 152.8 | 1 | Adhesive pull-out |
| 5 | Fractured | Epoxy Mortar | 36.8 | 145.1 | 0.3 | Adhesive pull-out |
| 6 | Fractured | Epoxy Mortar | 41.0 | 160.0 | 2 | Adhesive pull-out |
| 7 | Fractured | Epoxy Mortar | 37.5 | 147.8 | 1 | Adhesive pull-out |
| 8 | Fractured | Epoxy Mortar | 38.9 | 151.2 | 0.35 | Adhesive pull-out |
| 9 | Intact | Vinyl ester Resin | 70.1 | 275.4 | 7 | Adhesive/ductile |
| 10 | Intact | Vinyl ester Resin | 74.5 | 292.5 | 8 | Adhesive/ductile |
| 11 | Intact | Vinyl ester Resin | 75.2 | 295.4 | 8 | Adhesive/ductile |
| 12 | Intact | Vinyl ester Resin | 72.3 | 283.5 | 7 | Adhesive/ductile |
| 13 | Intact | Vinyl ester Resin | 77.4 | 303.7 | 8 | Adhesive/ductile |
| 14 | Intact | Vinyl ester Resin | 76.0 | 298.2 | 9 | Adhesive/ductile |
| 15 | Intact | Vinyl ester Resin | 71.8 | 281.6 | 7 | Adhesive/ductile |
| | | | | | | |
| Resin System | Rock Condition | n | Peak Force (kN)—Mean ± SD | Max Stress (MPa)—Mean ± SD | Extension at Peak (mm)—Mean ± SD |
| Epoxy Mortar | Fractured | 8 | 39.5 ± 2.1 | 153.7 ± 6.8 | 0.86 ± 0.58 |
| Vinyl ester Resin | Intact | 7 | 73.9 ± 2.6 | 290.0 ± 10.1 | 7.71 ± 0.76 |
Table 9.
Work-of-fracture (WOF) to peak (kN·mm) computed as . Values are mean ± 1 SD; n is the number of tests.
Table 9.
Work-of-fracture (WOF) to peak (kN·mm) computed as . Values are mean ± 1 SD; n is the number of tests.
| Resin System | Rock Condition | WOF (kN·mm)—Mean ± SD | n |
|---|
| Epoxy Mortar | Fractured | 17.2 ± 12.1 | 8 |
| Vinyl ester Resin | Intact | 285.7 ± 36.5 | 7 |
Table 10.
Numerical outputs at selected points during Stage 3 (Unsupported Surface Excavation).
Table 10.
Numerical outputs at selected points during Stage 3 (Unsupported Surface Excavation).
| Point | Strength Factor | Ubiquitous Joints | Volumetric Strain | Depth (m) |
|---|
| A | 0.78 | 0.068 | 0.012 | 3 |
| B | 0.82 | 0.13 | 0.024 | 10 |
| C | 0.85 | 0.91 | 0.028 | 13 |
| D | 0.91 | 0.78 | 0.027 | 15 |
| E | 1.04 | 0.52 | 0.018 | 18 |
Table 11.
Summary of numerical outputs for supported excavation at key control points.
Table 11.
Summary of numerical outputs for supported excavation at key control points.
| STAGE 3 |
|---|
| Bolt No. | Bolt Type & Size | Load Capacity | Point | Strength Factor | Ubiquitous Joints | Volumetric Strain | Depth (m) |
|---|
| BOLT 1 | Epoxy Resin, Length 245 mm, Diameter 20 mm | 55,000 kN | A | 0.9 | 0.0685 | 0 | 3 |
| B | 1 | 0.1637 | 0.0275 | 10 |
| C | 1.43 | 1.4436 | 0.033 | 13 |
| D | 1.16 | 0.265 | 0.0385 | 15 |
| E | 1.2 | 0.52 | 0.03575 | 18 |
| BOLT 2 | Epoxy Resin, Length 200 mm, Diameter 20 mm | 35,000 kN | Point | Strength Factor | Ubiquitous Joints | Volumetric Strain | Depth (m) |
| A | 2.09 | 0.0675 | 0.0135 | 3 |
| B | 1.16 | 0.2 | 0.0365 | 10 |
| C | 1.5 | 1.4325 | 0.0455 | 13 |
| D | 1.28 | 0.975 | 0.0495 | 15 |
| E | 0.88 | 0.395 | 0.0315 | 18 |
| BOLT 3 | Epoxy Resin, Length 190 mm, Diameter 20 mm | 25,000 kN | Point | Strength Factor | Ubiquitous Joints | Volumetric Strain | Depth (m) |
| A | 1.2 | 0.065 | 0.00675 | 3 |
| B | 0.845 | 0.0975 | 0.135 | 10 |
| C | 0.92 | 0.52 | 0.0495 | 13 |
| D | 0.975 | 1.04 | 0.054 | 15 |
| E | 1.04 | 0.78 | 0.0275 | 18 |
Table 12.
Calculated Factor of Safety and Weights for Identified Wedges (Unsupported Tunnel Case).
Table 12.
Calculated Factor of Safety and Weights for Identified Wedges (Unsupported Tunnel Case).
| Wedge ID | Location | Factor of Safety (FS) | Weight (Tonnes) |
|---|
| 4 | Lower-Right wedge | 4.60 | 0.79 |
| 5 | Upper-Left wedge | 1.69 | 0.99 |
| 6 | Roof wedge | 2.64 | 3.10 |
Table 13.
Variation in Factor of Safety (FoS) and Wedge Weight for 190 mm Resin-Grouted Bolts at Different Spacings under Tunnel Support Conditions.
Table 13.
Variation in Factor of Safety (FoS) and Wedge Weight for 190 mm Resin-Grouted Bolts at Different Spacings under Tunnel Support Conditions.
| Bolt Length | Bolt Spacing | Wedge ID | Location | Factor-of-Safety (FS) | Weight (t) |
|---|
| 190 mm | 0.10 m | 4 | Lower-Right wedge | 1258.48 | 0.787 |
| | | 5 | Upper-Left wedge | 74.787 | 0.985 |
| | | 6 | Roof wedge | 50.019 | 3.104 |
| 190 mm | 0.50 m | 4 | Lower-Right wedge | 35.783 | 0.787 |
| | | 5 | Upper-Left wedge | 1.741 | 0.985 |
| | | 6 | Roof wedge | 2.676 | 3.104 |
| 190 mm | 1.00 m | 4 | Lower-Right wedge | 14.446 | 0.787 |
| | | 5 | Upper-Left wedge | 1.705 | 0.985 |
| | | 6 | Roof wedge | 2.65 | 3.104 |
| 190 mm | 1.50 m | 4 | Lower-Right wedge | 25.936 | 0.787 |
| | | 5 | Upper-Left wedge | 1.691 | 0.985 |
| | | 6 | Roof wedge | 2.643 | 3.104 |
| 190 mm | 2.00 m | 4 | Lower-Right wedge | 14.446 | 0.787 |
| | | 5 | Upper-Left wedge | 1.691 | 0.985 |
| | | 6 | Roof wedge | 2.643 | 3.104 |
Table 14.
Variation in Factor of Safety (FoS) and Wedge Weight for 200 mm Resin-Grouted Bolts at Different Spacings under Tunnel Support Conditions.
Table 14.
Variation in Factor of Safety (FoS) and Wedge Weight for 200 mm Resin-Grouted Bolts at Different Spacings under Tunnel Support Conditions.
| Bolt Length | Bolt Spacing | Wedge ID | Location | Factor-of-Safety (FS) | Weight (t) |
|---|
| 200 mm | 0.10 m | 4 | Lower-Right wedge | 1385.78 | 0.787 |
| | | 5 | Upper-Left wedge | 82.088 | 0.985 |
| | | 6 | Roof wedge | 55.613 | 3.104 |
| 200 mm | 0.50 m | 4 | Lower-Right wedge | 39.01 | 0.787 |
| | | 5 | Upper-Left wedge | 1.747 | 0.985 |
| | | 6 | Roof wedge | 2.679 | 3.104 |
| 200 mm | 1.00 m | 4 | Lower-Right wedge | 16.059 | 0.787 |
| | | 5 | Upper-Left wedge | 1.708 | 0.985 |
| | | 6 | Roof wedge | 2.652 | 3.104 |
| 200 mm | 1.50 m | 4 | Lower-Right wedge | 27.549 | 0.787 |
| | | 5 | Upper-Left wedge | 1.691 | 0.985 |
| | | 6 | Roof wedge | 2.643 | 3.104 |
| 200 mm | 2.00 m | 4 | Lower-Right wedge | 16.059 | 0.787 |
| | | 5 | Upper-Left wedge | 1.691 | 0.985 |
| | | 6 | Roof wedge | 2.643 | 3.104 |
Table 15.
Variation in Factor of Safety (FoS) and Wedge Weight for 250 mm Resin-Grouted Bolts at Different Spacings under Tunnel Support Conditions.
Table 15.
Variation in Factor of Safety (FoS) and Wedge Weight for 250 mm Resin-Grouted Bolts at Different Spacings under Tunnel Support Conditions.
| Bolt Length | Bolt Spacing | Wedge ID | Location | Factor-of-Safety (FS) | Weight (t) |
|---|
| 250 mm | 0.10 m | 4 | Lower-Right wedge | 2095.00 | 0.787 |
| | | 5 | Upper-Left wedge | 124.336 | 0.985 |
| | | 6 | Roof wedge | 87.37 | 3.104 |
| 250 mm | 0.50 m | 4 | Lower-Right wedge | 39.01 | 0.787 |
| | | 5 | Upper-Left wedge | 1.747 | 0.985 |
| | | 6 | Roof wedge | 2.679 | 3.104 |
| 250 mm | 1.00 m | 4 | Lower-Right wedge | 24.13 | 0.787 |
| | | 5 | Upper-Left wedge | 1.723 | 0.985 |
| | | 6 | Roof wedge | 2.66 | 3.104 |
| 250 mm | 1.50 m | 4 | Lower-Right wedge | 27.549 | 0.787 |
| | | 5 | Upper-Left wedge | 1.691 | 0.985 |
| | | 6 | Roof wedge | 2.643 | 3.104 |
| 250 mm | 2.00 m | 4 | Lower-Right wedge | 17.059 | 0.787 |
| | | 5 | Upper-Left wedge | 2.691 | 0.985 |
| | | 6 | Roof wedge | 3.643 | 3.104 |
