Abstract
This study evaluates ground mandarin peel (MP) as a low-cost modifier for sodium-bentonite water-based drilling fluids. Formulations with 2% (w/w) MP and 1–4% bentonite were prepared to locate the composition break point using segmented regression with the Davies test; the threshold was 2.5% bentonite (B/MP ≈ 1.25). Below this level, yield stress drops sharply, and American Petroleum Institute (API) fluid loss increases nonlinearly. Two 3% bentonite muds were then compared: a polymer-stabilized reference (0.3% xanthan gum (XCD), 1% low-viscosity carboxymethyl cellulose (CMC LV), 1% modified starch) and the same package plus 2% MP. Twelve-speed rheometry and API tests showed that adding MP left plastic viscosity essentially unchanged, increased yield stress to ~3.4 Pa, reduced API fluid loss from 9 to 5.5 mL per 30 min, and thinned the filter cake from 0.30 to 0.10 mm. Because MP is a zero-price waste stream, material cost remained essentially unchanged while performance improved. These results support a practical dosing window for MP and a polymer adjustment pathway; high temperature and high-salinity stability require further verification.
1. Introduction
Bentonite-based drilling fluids constitute the foundation of contemporary oil, gas, and geoengineering drilling operations. Owing to its swelling capacity, bentonite forms a stable gel that transports cuttings, seals the formation, and maintains pressure control during circulation [1,2]. The mineral itself is qualitatively heterogeneous: swelling behavior and surface charge depend on the montmorillonite content and the spectrum of exchangeable cations (Na+, Ca2+, K+) [3]. As a result, operators may increase bentonite dosage to compensate for variable rheology. Global bentonite demand is rising by roughly 4% per year, driven by investments in directional drilling and the broader offshore drilling segment [4]. At the same time, markets for critical raw materials are highly sensitive to logistical disruptions. In Europe, bentonite prices increased by 9–20% in the first quarter of 2025, and the RMIS (2025) outlook indicates a continued upward trend due to export restrictions in Turkey and the United States [5]. For deep directional wells, drilling fluid costs can be a substantial fraction of the overall well construction budget [6,7], which intensifies the search for “green” or locally sourced substitutes. Prior work has explored biomass-based modifiers and locally sourced clays as partial substitutes in water-based drilling fluids [8,9,10,11].
In parallel, environmental constraints are gaining importance: bentonite pumped into the well must later be treated or disposed of, and EU Directive 2018/851 imposes increasingly strict limits on mineral waste landfilling [12]. The literature indicates that agricultural residues rich in polysaccharides (rice husks, banana fibers, citrus peels) can partially replace bentonite while improving filtration properties through a fiber/pectin matrix [3,4,9,11,13]. There are also reports on the use of locally sourced bentonites and other clay minerals in drilling fluids [14,15,16,17].
About 10 million tonnes of citrus peel waste are generated worldwide each year, and peels account for 50 to 70% of that stream [18]. Processors face a double challenge. First, disposal is becoming costlier: according to the European Environment Agency, the average landfill fee for organic waste in the EU rose from € 42 per tonne in 2015 to more than € 70 per tonne in 2024 [19]. Second, peels ferment quickly, releasing CO2 and methane, whose 100-year global warming potential is 28 times higher than that of CO2 [20]. Traditional options such as composting or animal feed often handle only a fraction of the peel stream and do not necessarily guarantee a net-negative emission balance [3,18].
Using citrus waste in engineering processes, including drilling fluids, is therefore an upcycling strategy. Mandarin peel is rich in pectins (20 to 30% by mass), cellulose (about 15%) and flavonoids, forming a hydrophilic network that can increase viscosity at low shear rates, build a fine porous filter cake that limits fluid loss [13], and may complex Ca2+ ions, which can help mitigate water hardness under the tested conditions [4]. Each tonne of peel added to a mud can replace a significant share of bentonite or polymers (up to about 0.7 tonne of bentonite or 0.4 tonne of polymers under the tested conditions), with an estimated carbon-footprint reduction of about 0.5 to 0.8 t CO2-eq per tonne of peel, subject to the life-cycle assumptions described in this study [21]. Landfill and biodegradation fees are also avoided, turning a disposal cost into added value in the oil-sector supply chain. The EU Circular Economy Package 2020–2030 supports this direction [12]. Thus, the price advantage of using less bentonite is only part of the story. Converting agricultural waste into drilling-fluid additives turns a disposal problem into a process asset and strengthens the environmental case in a well’s life-cycle assessment (LCA).
Beyond citrus peel, several waste-derived lignocellulosic fillers have been used in water-based drilling fluids [22,23,24]. Materials such as rice husk and banana fibers, as well as cellulose-based nano and microfibrils, typically reduce API fluid loss by densifying and reinforcing the filter cake, while their impact on plastic viscosity and high-shear behavior remains moderate at practical dosages [22,24,25,26]. In contrast, soluble biopolymers such as xanthan and carboxymethyl cellulose primarily tune the low-shear structure and the yield stress, and they often act synergistically with lignocellulosic fillers [23]. These consistent patterns across recent studies and reviews help to frame the focus in this paper on mandarin and other citrus peels within the broader family of biomass-derived modifiers.
Work on lignocellulosic agricultural residues, from rice husks to bacterial cellulose, shows that fluid loss can be reduced without harming rheology. Boruah and Chowdhury (2023) [24] reported that 4 to 8% ground mandarin peel lowered API fluid loss by 15 to 20% with only a slight drop in plastic viscosity. Assi (2024) [10] noted similar gains in gel strength and a decrease in mud density when part of the bentonite was replaced with peel powder. In contrast, Al-Hameedi et al. (2020) [1] found that concentrations above 2% sharply increased the yield point (YP) and plastic viscosity (PV), causing excessive pressure losses. Medved et al. (2022) [9] showed that once the mandarin-peel content exceeds about 2% by mass, the mud shifts from pseudoplastic behavior to rapid coagulation; the yield stress rises stepwise to more than 2 Pa, and the rheological curve flattens at low shear. They link this to two overlapping mechanisms: pectin cross-linking by Ca2+ bridges and adsorption of anionic polysaccharides on bentonite edges, which strengthens edge-to-face attraction. Al-Hameedi et al. (2020) [1] confirmed a similar threshold (1.9 to 2.2%) for citrus wastes in general. Above that level, laboratory mixers have been reported to struggle to maintain the set rpm as coagulation initiates, and fluid loss can increase by tens of percent because aggregated flocs form a porous cake that fibers alone cannot seal [26]. Literature therefore places 2% as a practical upper limit for citrus peel additives; higher dosages demand so much corrective polymer that both economic and environmental benefits vanish. Despite growing interest, there is still no clear definition of the economic break point at which savings on bentonite no longer offset the loss of performance.
There are three gaps that the present study addresses. First, there is no predictive criterion for the composition break point that links simultaneous changes in yield stress and API fluid loss to the bentonite to mandarin peel ratio. As a result, the minimum bentonite dose is still set by trial and error, even though several reports indicate a sharp deterioration of rheology beyond about 2% peel, for example, Medved et al. (2022) [9].
Second, the economics of biomass substitution are rarely quantified. Most studies stop at rheological tables and do not ask how many euros are required to reduce API fluid loss by one milliliter for a given polymer dose, so the cost-to-performance trade-off remains unclear.
Third, full twelve-speed rheograms and Herschel-Bulkley fits are underused. This hides low shear behavior where the filter cake forms and can lead to different conclusions than the API two-point proxy. This study is designed to close these gaps.
The primary objective is to identify the break point in rheological and filtration parameters as a function of the bentonite-to-mandarin-peel ratio at a fixed MP concentration of 2% (w/w). In practical terms, the aim was to find the minimum bentonite share below which yield stress drops sharply and fluid loss surges, making further reduction unjustified. To achieve this, formulations containing 1 to 4% bentonite were analyzed using segmented regression with the Davies test, and the break point was located with an estimated precision of about 0.05 percentage points of bentonite (Davies’ test, details in Section 2.3 and Section 2.4 (statistical procedures)) [27,28]. The result is a chart that correlates the B/MP ratio with yield stress and fluid loss, allowing laboratory staff to assess quickly whether a recipe falls within a safe operating window.
A stepwise modification protocol was then developed for the base mud (3% B and 2% MP). First, 0.3% xanthan (XCD) was added to raise τ0 to a level sufficient for cuttings transport. Next, 1% low viscosity CMC (KMC LV) was used to build an elastic, swelling matrix that reduces fluid loss [29]. Finally, 1% modified starch (Rotomag) acted as a micro filler, sealing fine pores in the cake. Each stage was monitored with a twelve-point rheogram and the API fluid-loss test. This allowed precise polymer dosing and brought fluid loss below 10 mL per 30 min while keeping the yield stress τ0 in the range of 3 to 4 Pa, values that match or exceed those of a mud containing 4% bentonite.
An economic balance was then performed by combining unit prices of bentonite and the three polymers (CIF, July 2025) and calculating the cost per cubic meter of each formulation with and without 2% MP, both at a constant 3% bentonite. The comparison confirmed that mandarin-peel addition leaves the material cost virtually unchanged, while delivering a substantial reduction in fluid loss. Taken together, these elements address the gaps outlined above. API parameters (plastic viscosity and yield point) and Herschel-Bulkley parameters (yield stress, consistency, flow index) are placed side by side on the same twelve-speed datasets. A statistically supported break point is located in the bentonite to peel ratio and turns it into a practical dosing window. A practical pathway is proposed for adjusting xanthan, CMC LV, and starch, and a simple cost balance per cubic meter.
This study contributes in three ways. First, it places API parameters (plastic viscosity and yield point) and Herschel-Bulkley parameters (yield stress, consistency, flow index) side by side for the same twelve-speed datasets, which makes the limits of the two-point proxy explicit. Second, it identifies a statistically supported break point in the bentonite to peel ratio using segmented regression with the Davies test and translates it into practical dosing guidance. Third, it develops a simple polymer-adjustment pathway and a cost balance per cubic meter that indicates when mandarin-peel substitution remains both operationally and economically sound.
To conclude the Introduction, high and volatile bentonite prices, the need to lower the carbon footprint, and the availability of agricultural residues motivate the present study of mandarin-peel-based substitution in water-based drilling fluids.
2. Materials and Methods
First, three main classes of raw materials are characterized: sodium bentonite “Zębiec”, ground mandarin peel (MP), and the regulating polymer package (XCD, KMC LV, Rotomag). Next, a standardized slurry preparation procedure presents temperature control, dosing sequence, and aging conditions, so that the base and chemically modified samples are fully comparable. The subsections then explain how rheology was measured (12-point FANN profile), how API filtration was determined, and how the in-house Rheosolution methodology was applied for multi-model fitting of shear stress versus shear rate [30]. The chapter ends with a description of the statistical procedures used to locate the break point and test the significance of differences between series.
2.1. Components of the Tested Muds
Sodium bentonite “Zębiec”. This Polish bentonite (at least 70% montmorillonite, bulk density 0.9 g/cm3) provides the mineral skeleton of the mud. Its swelling ability and strong surface charge form the gel needed to lift cuttings. The base clay was a sodium-activated bentonite supplied as a fine powder. According to the supplier’s product data for the relevant grades (e.g., Bentonit Specjal/construction grades), the material consists predominantly of smectite with a montmorillonite content ≥75 wt% and an apparent (bulk) density below 1.10 g cm−3, which is in accordance with bentonite used in this study (bulk density ≈ 0.9 g cm−3). The manufacturer produces both sodium-activated and non-activated bentonites; the grade used here is sodium-activated. These characteristics are consistent with the role of montmorillonite as the active swelling phase in drilling muds. Accessory minerals (e.g., quartz, calcite) and the Na/Ca balance are known to affect gel strength, filtration, and interactions with anionic polysaccharides present in mandarin-peel biomass; calcium-bearing impurities, in particular, can promote bridging and coagulation. In this study, the Zębiec bentonite served as the mineral skeleton and the primary cost driver to be minimized, subject to meeting API rheology and fluid-loss targets. Bentonite is treated as a cost driver in this study; the less that is used while keeping the required parameters, the greater the savings.
Mandarin peel (MP). Waste from a citrus-processing plant in Dalmatia was dried for 24 h at 60 °C, and milled to a d50 of about 110 µm (Figure 1).
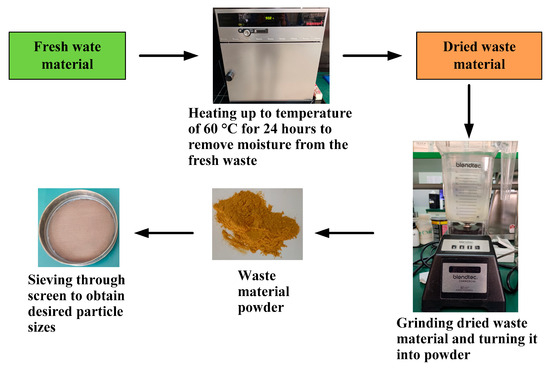
Figure 1.
Preparation of mandarin peel powder.
Pectins create a viscous matrix, and cellulose (about 15%) forms a fibrous framework; together they act as a natural fluid-loss reducer. The exact concentration of pectin in the mandarin peel powder used in this paper was measured on a VWR UV-1600 PC spectrophotometer (VWR, Radnor, PA, USA). After the samples were prepared and filtered through Whatman No.40 filter paper, colorimetric determination was carried out on a spectrophotometer. Pectin content for mandarin peel powder used in this paper is 81.43 mg per g of mandarin peel powder. A fixed 2% (w/w) MP was adopted as a compromise: below that level, the cost reduction is too small, above 2% the risk of coagulation increases [9,31].
XCD (Baroid). Cross-linked xanthan gum. Its addition raises the yield stress, restoring transport capability after bentonite reduction.
KMC LV (Ashland). Low-viscosity sodium carboxymethylcellulose. Because of its short chain, it swells quickly in filter-cake pores, seals them, and lowers fluid loss by about 40% at 1% dosage.
Rotomag (modified starch). Fine starch (10 to 50 µm) with acetyl groups. It works as a microfiller: 1% closes micro-pores in the cake, pushing fluid loss down to about 5 mL and helping to form a tight barrier.
The intended synergy is that bentonite builds the gel, MP replaces part of the bentonite, XCD lifts the yield stress, KMC LV densifies the cake, and Rotomag closes the pores. This system allows the bentonite content to drop from 4% to 3% while maintaining or improving key parameters.
Unless stated otherwise, all concentrations in this section are expressed as mass fraction (% w/w).
2.2. Sample Preparation
The preparation procedure was identical for all eight formulations and followed API RP 13B-1 [32] and ISO 10414-1 [33], with an added hydration phase to let mandarin peel pectins swell.
- Water: 350 mL of deionized water at 25 °C.
- Powder addition: at 11,000 rpm (Hamilton Beach HMD200 mixer (Hamilton Beach Commercial, Glen Allen, VA, USA)), weighed portions of bentonite and MP were added within 30 s (mixing continued for 10 min).
- Static hydration: the slurry was left to stand for 20 min so montmorillonite and pectins could swell.
- Polymers (for modified samples): polymers were dissolved in 50 mL water and added in three portions (every 2 min) at 8000 rpm: first 0.3% XCD (w/w), after 5 min 1.0% KMC LV, then after another 5 min 1.0% Rotomag.
- Final mixing: 5 min at 11,000 rpm to homogenize the structure.
- Conditioning: samples were transferred to sealed containers and kept at 25 ± 1 °C.
- Pretest homogenization: each mud was remixed for 5 min at 6000 rpm, then density (mud balance, ρ = 1030 to 1250 kg/m3) and pH (8.8 to 9.0) were checked.
This three-stage sequence (mixing, hydration, polymers) ensured full swelling of montmorillonite and pectins before adding rheology modifiers, which limits the risk of excessive coagulation reported at MP contents above 2%. Total preparation time per sample was about 1 h. The formulations are listed in Table 1.

Table 1.
Composition of the formulations (weight percent).
2.3. Rheological Measurements
Steady-shear flow curves τ(γ) were measured with an OFITE Model 900 rotational viscometer (Ofite, Houston, TX, USA) (FANN geometry R1-B1, spring F1) according to API RP 13B-1 [32]. Dial readings were taken at 12 rotor speeds: 600, 300, 200, 100, 60, 30, 20, 10, 6, 3, 2, and 1 rpm. Preliminary plastic viscosity (PV) and yield point (YP) were calculated from the standard two-point API equations. For full flow characterization, all twelve points were processed with the Rheosolution method [30]. Dial readings were converted to shear stress τ (Pa) using the factor 0.511 and to shear rate γ (s−1) using γ = 1.703 × rpm. Linear least squares fit of the Bingham model supplied initial estimates of τ0 and PV. Next, non-linear models were fitted iteratively with the Levenberg–Marquardt algorithm: Herschel–Bulkley. Model quality was assessed with the Pearson correlation coefficient r, the Fisher-Snedecor statistic at α = 0.05, and the root mean square error (RMSE). A model was accepted only if it met all three criteria simultaneously: r ≥ 0.97, F_observed > F_critical, and the lowest RMSE among the candidates. The resulting τ0 (HB yield stress), K (consistency index), and n (flow index) were used in subsequent analysis.
Conversions:
τ (Pa) = 0.478 × θ (θ in lbf/100 ft2; OFITE/FANN R1-B1, spring F1)
γ (s−1) = 1.703 × rpm
τ_Bingham(γ) = τ0 + μγ
τ_HB(γ) = τ0 + K γn
Initial Bingham parameters (τ0, μ) were obtained by linear least squares, non-linear Herschel–Bulkley parameters (τ0, K, n) were estimated by Levenberg–Marquardt on all twelve points.
Here, θ denotes the viscometer dial reading reported in lbf/100 ft2. Equation (1) converts it to Pascals.
2.4. Fluid Loss and Filter-Cake Thickness
Fluid loss (FL) and cake thickness were determined with an API filter press (ΔP = 100 psi, filtration area 45.6 cm2) for 30 min, following API procedures. Cake thickness was measured to 0.1 mm with a digital caliper.
All statistical calculations were performed in Python 3.11 using NumPy 1.26, SciPy 1.12, and pwlf 2.2; additional graphs were generated in Rheosolution 5.0 (Wiśniowski et al., 2020 and 2022) [30,34]. Relationships between τ0, FL, and the B/MP ratio were analyzed with segmented (piece-wise) regression featuring a single breakpoint, fitted by ordinary least squares (pwlf) and validated with the Davies test (α = 0.05). Break-point position is reported with a 95% confidence interval [27,28].
Differences between mean values of τ0, PV, YP, and FL were evaluated using the Student t-test for independent samples (α = 0.05). Normality was assessed with the Shapiro–Wilk test and equality of variances with Levene’s test; where these assumptions were violated, Welch’s t-test was applied.
For each rheological model (Bingham, Herschel–Bulkley), the Pearson correlation coefficient r, the Fisher-Snedecor statistic, and the RMSE were calculated, acceptance required simultaneously r ≥ 0.97, observed F > critical F, and the lowest RMSE among compared models. Correlations between rheological parameters (τ0, PV, YP) and FL were interpreted as strong for |r| ≥ 0.7, moderate for 0.5 ≤ |r| < 0.7, and weak for |r| < 0.5.
The economic inputs were benchmarked against CIF prices current in July 2025 (bentonite ≈ €400/t, XCD ≈ €7/kg, CMC LV ≈ €4/kg, Rotomag ≈ €8/kg). These prices were used only to confirm that adding 2% MP does not increase the material cost when the polymer package is held constant; no separate sensitivity analysis is reported.
3. Results and Discussion
To carry out the rheological analysis of the tested samples, measurements were taken with an API-recommended viscometer, the OFITE Model 900 (FANN geometry R1-B1, spring F1), equipped for twelve shear rates (γ = 1.7, 3.4, 5.1, 10.2, 17.0, 34.1, 51.1, 102.2, 170.3, 340.6, 510.9, 1021.8 s−1; conversion γ = 1.703 × rpm). The results are compiled in Table 2 and Table 3.
Table 2.
OFITE viscometer shear stress at twelve shear rates. Values are τ (Pa), converted from dial readings θ (lbf/100 ft2) via τ = 0.4788·θ (R1-B1, F1). Shear rate γ computed as 1.703 × rpm. Base samples: 2% MP with varying bentonite content.
Table 3.
OFITE viscometer shear stress at twelve shear rates. Values are τ (Pa), converted from dial readings θ (lbf/100 ft2) via τ = 0.4788·θ (R1-B1, F1). Shear rate γ computed as 1.703 × rpm. 3% B + 2% MP samples after successive stages of polymer adjustment (XCD, KMC LV, Rotomag).
3.1. Rheological Parameters of the Base Samples
To show the difference between the quick two-point API assessment (linear Bingham model) and the full description with the Herschel-Bulkley (HB) model, a two-step procedure was applied.
3.1.1. Preliminary Step, API Formulas
According to API RP 13B-1, the yield point (YP) and plastic viscosity (PV) are calculated from two FANN viscometer readings at 600 rpm and 300 rpm:
where θ600 and θ300 denote dial readings (lbf/100 ft2) at shear rates 1021.8 and 510.9 s−1, respectively. API PV and YP follow Equations (1) and (2).
PV = θ600 − θ300
YP = θ300 − PV
Table 4.
Plastic viscosity (PV) and yield point (YP) determined by the API method.
A clear increase in PV and YP is seen as the bentonite content rises; however, the API method relies on only two measurement points (600 and 300 rpm), forces a linear approximation of the entire shear-stress shear-rate curve and ignores the low-shear region, and can either under or overestimate the true yield stress in non-linear systems, as illustrated by the comparison with Herschel-Bulkley fits on the Bingham vs. HB plots shown below (Figure 2, Figure 3, Figure 4 and Figure 5).
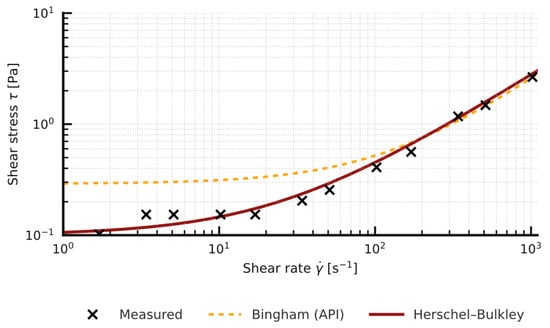
Figure 2.
Effect of bentonite/Mandarin-peel ratio on yield stress (Herschel-Bulkley model) and API fluid loss-sample 1%B + 2%MP.
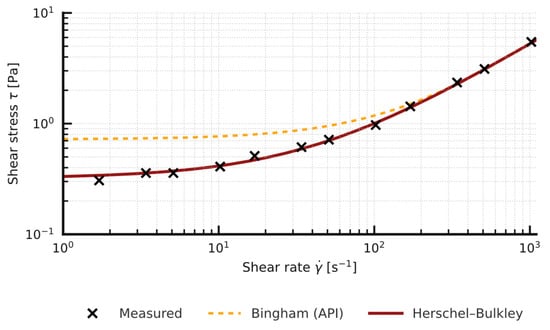
Figure 3.
Effect of bentonite/Mandarin-peel ratio on yield stress (Herschel-Bulkley model) and API fluid loss-sample 2%B + 2%MP.
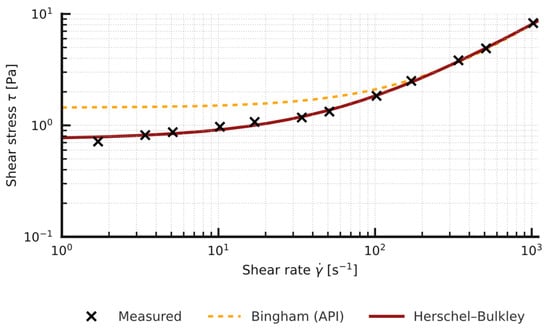
Figure 4.
Effect of bentonite/Mandarin-peel ratio on yield stress (Herschel-Bulkley model) and API fluid loss-sample 3%B + 2%MP.
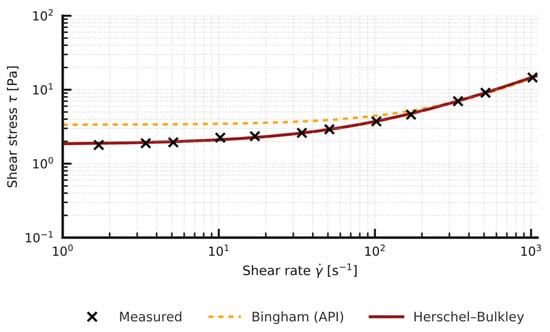
Figure 5.
Effect of bentonite/Mandarin-peel ratio on yield stress (Herschel-Bulkley model) and API fluid loss-sample 4%B + 2%MP.
3.1.2. Detailed Analysis: Herschel–Bulkley Model (12 Measurement Points)
In the second step, the full measurement range (12 rotor speeds) was used, and the HB model was fitted. Table 5 summarizes the parameters obtained.
Table 5.
Herschel–Bulkley parameters for the base muds.
Comparison of the yield stress obtained with the simplified API method (two-point Bingham, YP) and the value τ0 from the non-linear Herschel-Bulkley model shows a systematic overestimation by the two-point approach: in the tested samples (n in the range 0.83 to 0.88) YP (API) is about 2 to 3 times higher than the corresponding τ0 (HB) (Figure 2, Figure 3, Figure 4 and Figure 5). Full rheograms generated in Rheosolution (Figure 6, Figure 7, Figure 8, Figure 9, Figure 10, Figure 11, Figure 12 and Figure 13) reveal that the Bingham line cuts the τ axis well above the HB curve, which confirms that the linear model artificially stiffens the response. Relying only on this two-point approximation can therefore lead to overestimating pressure losses in the circulation system, adopting pump rates that are too high, and targeting an unnecessarily high mud viscosity, all of which inflate circulation costs. Additional rheological plots for the polymer-modified samples (Figure 10, Figure 11, Figure 12 and Figure 13) show a strong match with the Herschel-Bulkley model and a clear mismatch with the linear Bingham fit.
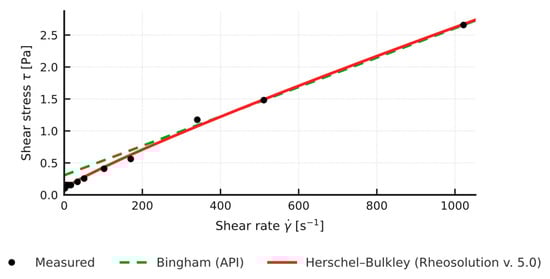
Figure 6.
Rheosolution rheological models (Bingham API, Herschel-Bulkley): 1% Bentonite + 2% Mandarin Peel.
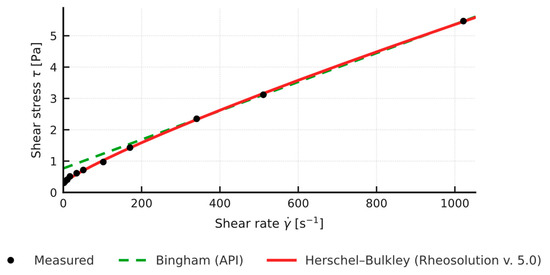
Figure 7.
Rheosolution rheological models (Bingham API, Herschel-Bulkley): left-2% Bentonite + 2% Mandarin Peel.
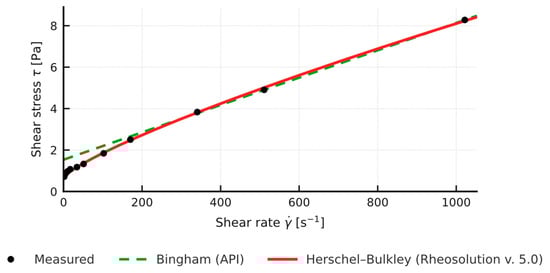
Figure 8.
Rheosolution rheological models (Bingham API, Herschel-Bulkley): 3% Bentonite + 2% Mandarin Peel.
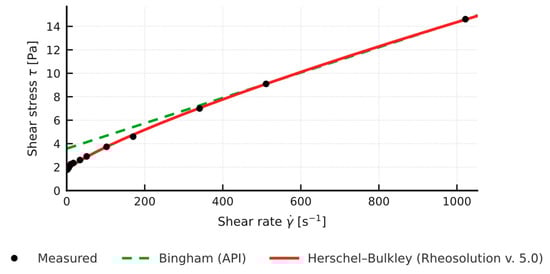
Figure 9.
Rheosolution rheological models (Bingham API, Herschel-Bulkley): 4% Bentonite + 2% Mandarin Peel.
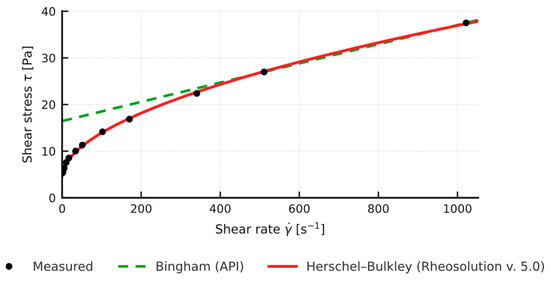
Figure 10.
Rheosolution rheological models (Bingham API, Herschel-Bulkley): 3% Bentonite + 2% Mandarin Peel + 0.3% XCD.
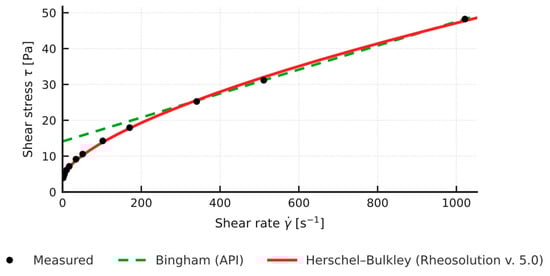
Figure 11.
Rheosolution rheological models (Bingham API, Herschel-Bulkley): 3% Bentonite + 2% Mandarin Peel + 0.3% XCD + 1% KMC.
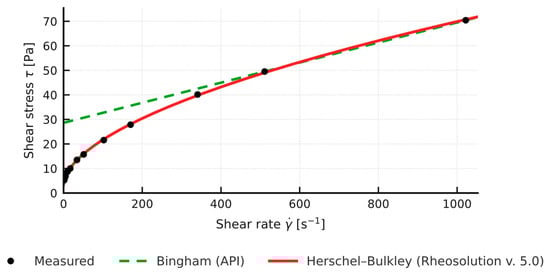
Figure 12.
Rheosolution rheological models (Bingham API, Herschel-Bulkley): 3% Bentonite + 2% Mandarin Peel + 0.3% XCD + 1% KMC + 1% Rotomag.
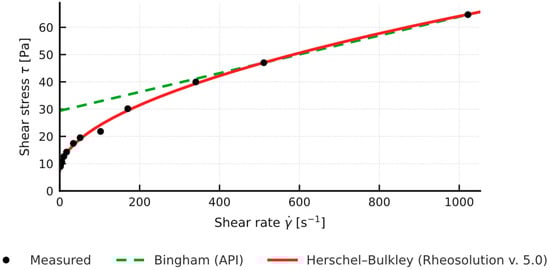
Figure 13.
Rheosolution rheological models (Bingham API, Herschel-Bulkley): 3% Bentonite + 0.3% XCD + 1% KMC + 1% Rotomag.
In the remainder of the paper, all conclusions are based on Herschel-Bulkley (HB) parameters, because they better reflect the non-linear nature of mixtures of bentonite and biomass.
3.2. Break Point
To visualize the break phenomenon, segmented (piecewise linear) regression was applied to the curve of HB yield stress τ0 versus bentonite concentration at a fixed MP content of 2% (Figure 14 and Figure 15).
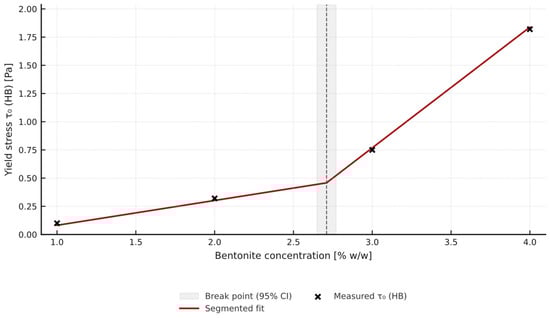
Figure 14.
Yield Stress vs. Bentonite content (2% mandarin peel).
Figure 15.
Break point in τ0 (HB) versus bentonite content: calculated vs. conservative threshold.
Segmented analysis of the τ0 = f(B) curve revealed two clearly different regions. Below 2.7% B, the slope is only 0.22 Pa per percent, whereas above that level it rises sharply to 1.07 Pa per percent. The intersection point calculated with the Davies test (p < 0.05) is 2.71 ± 0.06% B, which mathematically marks the boundary between a “gentle” zone and a zone of rapid stress growth. In laboratory and field practice, it is hard to dose bentonite to hundredths of a percent, so 2.5% B, just below the statistical point, was taken as the operational value. This conservative margin limits the risk that normal dosing fluctuations or measurement errors will push the system into the unfavorable steep segment. Reducing bentonite below 2.5% at 2% MP causes a non-linear drop in yield stress and a simultaneous step increase in fluid loss. Keeping at least 2.5% B therefore maintains fluid loss below 35 mL per 30 min and τ0 above 0.3 Pa without costly polymer packages. This limit agrees with the observations of Medved et al. (2022) [9,26], who reported 2.3 to 2.8% B as the lower boundary for stable rheology in citrus-biomass systems, and it serves as a practical go/no-go criterion for field laboratories.
Mandarin peel brings two families of structures to the mud: an anionic pectin network and short cellulosic fibers. Hydrated pectins increase viscosity at low shear and contribute to a finite yield stress, while fibers build a physical scaffold that reinforces the filter cake and lowers its permeability. When the peel dose is high and bentonite is low, cation bridging and adsorption on platelet edges favor edge-to-face contacts and clustering. The system crosses a percolation-like threshold. Yield stress rises abruptly, yet the aggregates form a coarse, porous cake that passes more filtrate and can cause loss of pumpability. This microstructural picture explains the composition break point identified by segmented regression and the Davies test (see Figure 14 and Figure 15) and is consistent with the joint trend of rising yield stress and falling API fluid loss with increasing B/MP ratio. The polymer pathway follows the same logic: xanthan strengthens the low-shear network, CMC LV seals pore throats and reduces fluid loss, and starch provides micro-scale filling that closes residual pores. In combination with peel, these additives densify the cake and stabilize the Herschel–Bulkley parameters, which matches the observed drop in API fluid loss at acceptable pumpability.
3.3. Role and Effectiveness of XCD, KMC LV, and Rotomag
The polymer package was selected so that each component would close the gap left by the previous one: first, the yield stress was raised to secure cuttings transport, then the system was densified to thicken the filter cake and cut fluid loss. XCD is a modified xanthan gum. Even at 0.3% (w/w), it forms a water-dispersible three-dimensional network of anionic polysaccharide chains. After adding it to the base mud (3% B + 2% MP), the yield stress rose from 0.75 Pa to 4.7 Pa, and the plastic viscosity roughly tripled. Fluid loss dropped by only about 50% (from 29 to 14 mL), because XCD alone does not yet close the pores of the filter cake.
KMC LV (low viscosity carboxymethylcellulose) works differently: its short, slightly anionic chains swell quickly in the pores and form an elastic gel. At 1.0% CMC, the fluid loss fell to 8 mL and the cake layer became denser, although the overall mud viscosity increased only moderately (PV by about 33 mPa·s). Interestingly, τ0 decreased slightly (to about 3.7 Pa), because CMC “loosened” part of the xanthan-bentonite interactions.
Rotomag is a finely ground, partially acetylated starch. Its 10–50 µm particles act as a microfiller, slipping between CMC fibers and bentonite platelets and blocking the micro pores of the cake. Just 1% was enough to push fluid loss down to 5.5 mL and reduce cake thickness to 0.1 mm. At the same time, τ0 stabilized at 3.4 Pa, a range comfortable for pumps and for cuttings transport.
This cascade effect agrees well with the literature: Medved et al. (2022) [9] reported a 70% reduction in FL with a CMC + starch package, but only after increasing bentonite to 4%. In this study, a similar level of 3% B was achieved because xanthan first provided a solid rheological skeleton. By contrast, Assi (2024) [10], who relied on xanthan alone, was stuck at about 12 mL of filtrate because the “sealing” component was missing.
In summary, XCD stabilizes the mud rheology, KMC LV thickens and seals the filter cake, and Rotomag plugs the micro pores. Used sequentially, they keep a balance between a high enough τ0 (for transport) and minimal fluid loss (for borehole wall stability) at a reduced bentonite dosage.
3.4. Correlation Between Rheology and Filtration
For the base samples, the Pearson correlation between τ0 (HB) and fluid-loss volume was R = −0.96 (p = 0.03), which confirms that a higher yield stress helps to limit fluid loss (Figure 16).
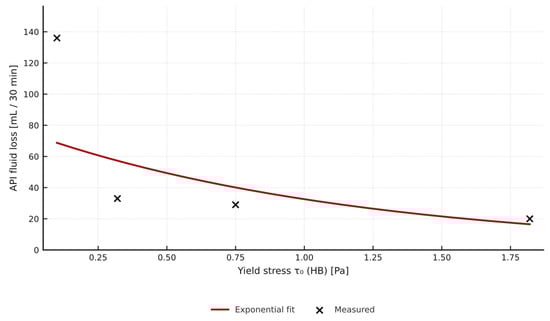
Figure 16.
Correlation between yield stress τ0 (HB) and API fluid loss for the 2% MP series; dashed line links successive bentonite concentrations (1–4%).
To better capture the simultaneous influence of composition on both parameters, Figure 17 plots τ0 and FL against the B/MP ratio, which helps identify the safe operating zone (B/MP ≥ 1.25).
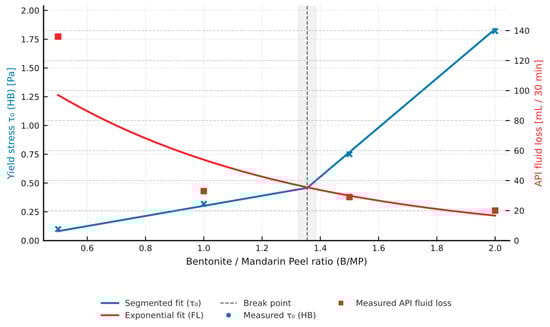
Figure 17.
Joint relationship between yield stress τ0 (HB) and API fluid loss as a function of the bentonite/mandarin peel ratio; dashed lines show practical break point at B/MP ≈ 1.25 (2.5% B).
The observed trend confirms the filter-cake formation mechanism as τ0 increases, the cake becomes denser and more compact, which lowers its permeability and reduces the fluid-loss volume [1,18].
3.5. Economic Aspect
At current market prices, the stabilizing polymer package (0.3% XCD, 1% CMC LV, 1% Rotomag) is the main driver of material cost for both reference muds. Because the mandarin peel is sourced from a zero-price waste stream and is dosed at only 2% by mass, adding MP leaves the euro cost per cubic meter essentially unchanged when comparing two like-for-like formulations at the same bentonite level: 3% B + package without MP versus 3% B + 2% MP + the same package. For transparency, all cost statements in this section use June–July 2025 CIF prices (bentonite approximately €400 per tonne, XCD approximately €7 per kilogram, CMC LV approximately €4 per kilogram, Rotomag approximately €8 per kilogram), and this cost parity was verified against those prices. A one-factor sensitivity of plus or minus 20 percent on polymer prices does not change the qualitative conclusion that MP improves performance at comparable cost. The relevant question is therefore not how much cheaper it is, but whether the same spending delivers better performance.
Laboratory results confirm that improved performance is achieved at comparable cost. Introducing 2% MP into the 3% bentonite system reduced API fluid loss from 9 mL to 5.5 mL and thinned the filter cake from 0.30 mm to 0.10 mm, while the yield stress remained at about 3.4 Pa, which is compatible with efficient hole cleaning and pump operation. In field terms, lower fluid loss translates into less routine mud make-up and slower dilution of rheological properties over time. A thinner, denser, and smoother cake also shortens clean-out cycles and lowers the probability of differential sticking. Those effects are typically monetized not as euros per liter but as avoided non-productive time and more stable hydraulics.
From a sustainability perspective, the comparison at equal bentonite content highlights a different advantage. The peel is diverted from the waste stream and valorized in a high-value industrial service without increasing material cost. In projects where MP is later used to partially replace bentonite (for example, moving from 4% B toward 3% B with MP and polymers), additional benefits would accrue through lower mineral procurement and smaller volumes of mineral solids in the waste stream. Those substitution scenarios fall outside the strict head-to-head comparison presented here, but they are consistent with breakpoint analysis and with the observed improvement in filtration performance at constant 3% B.
In short, under today’s reagent prices, the polymer package sets a common cost floor for both muds. Adding 2% MP keeps cash cost essentially flat yet delivers a measurable reduction in fluid loss and cake thickness at a yield stress suitable for transport. Where operational reliability and environmental performance carry more weight than small variations in unit prices, the 3% B + 2% MP formulation offers a stronger overall proposition than the MP-free counterpart using the same polymer package.
4. Conclusions
Mandarin peel waste can partially substitute bentonite in water-based drilling fluids without a cost penalty. Using twelve-speed rheometry and API tests, we identified a composition break point at B/MP ≈ 1.35 (≈2.7% B at 2% MP). Below this level, the yield stress collapses and API fluid loss rises; above it, the system is stable and forms a denser filter cake. At 3% B + 2% MP, a stepwise polymer pathway (0.3% xanthan, 1% CMC LV, 1% modified starch) delivered field-relevant rheology and low fluid loss, while material cost remained essentially unchanged. These results provide a practical dosing window and a simple adjustment sequence for laboratory and field mud programs. The approach is transferable to other citrus residues with similar pectin-fiber chemistry, though the exact threshold should be rechecked for local clays and water chemistry. Future work should verify thermal and saline stability, contamination by drill solids, and compatibility with loss circulation materials, followed by pilot field trials.
Author Contributions
Conceptualization, K.S., P.T., T.K., P.M., I.M. and B.P.; methodology, K.S., P.T., T.K., P.M., I.M. and B.P.; software, K.S.; validation, P.T., I.M. and P.M.; formal analysis, K.S., P.T. and P.M.; investigation, P.M. and I.M.; resources, P.M., I.M. and B.P.; data curation, P.M. and I.M.; writing—original draft preparation, K.S., P.T. and T.K.; writing—review and editing, K.S., P.M. and I.M.; visualization, K.S.; supervision, B.P.; project administration, P.M., I.M. and B.P.; funding acquisition, P.T. and T.K. All authors have read and agreed to the published version of the manuscript.
Funding
This research was funded by the Excellence Initiative–Research University (Inicjatywa Doskonałości—Uczelnia Badawcza, IDUB), AGH University of Krakow, under Operation D1.
Data Availability Statement
The original contributions presented in this study are included in the article. Further inquiries can be directed to the corresponding author.
Conflicts of Interest
The authors declare no conflicts of interest.
Nomenclature
| τ | shear stress | Pa |
| τ0 | yield stress (HB) | Pa |
| γ | shear rate | s−1 |
| PV | plastic viscosity (API) | mPa·s (cP) |
| YP | yield point (API two-point Bingham) | Pa |
| K | consistency index (HB) | Pa·sn |
| n | flow index (HB) | - |
| FL | fluid loss | mL per 30 min (API) |
| B | bentonite content | wt.% (w/w) |
| MP | mandarin peel content | wt.% (w/w) |
| B/MP | mass ratio bentonite to mandarin peel | - |
| θ600, θ300 | dial readings at 600 rpm and 300 rpm | viscometer scale units |
| d50 | median particle size | µm |
| ρ | density | kg/m3 |
| ΔP | differential pressure in filter press | psi |
| r (R) | Pearson correlation coefficient | - |
| p | p-value (significance level result) | - |
| F | Fisher-Snedecor statistic | - |
| RMSE | root mean square error | same as fitted variable (usually Pa) |
| HB | Herschel–Bulkley model | - |
| Bingham | linear Bingham plastic model | - |
| Vom Berg | logarithmic rheological model (Vom Berg) | - |
| Eyring | extended Eyring rheological model | - |
| XCD | cross-linked xanthan gum (Baroid) | polymer additive |
| KMC LV | low-viscosity sodium carboxymethylcellulose (Ashland) | polymer additive |
| Rotomag | modified starch (microfiller) | polymer additive |
| API | American Petroleum Institute | - |
| API RP 13B-1 | Recommended Practice for testing water-based muds | - |
| Rheosolution | in-house rheology fitting procedure/software | - |
| OFITE Model 900 | rotational viscometer (FANN geometry R1-B1, spring F1) | - |
| pwlf | Python package “piecewise linear fit” | segmented regression |
| DTRI | drilling hydraulics simulator (used for clean-out simulation) | - |
| CIF | Cost, Insurance and Freight | price term |
| LCA | Life-Cycle Assessment | - |
| CO2-eq | carbon dioxide equivalent | t CO2-eq |
| RMIS | Raw Materials Information System (EU) | - |
| EEA | European Environment Agency | - |
| rpm | revolutions per minute | - |
| mL/30 min | API fluid-loss reporting unit | - |
| wt.% (w/w%) | weight percent (mass fraction × 100%) | - |
| v/v% | volume percent | - |
| °C | degrees Celsius | - |
| psi | pounds per square inch | - |
| Pa·sn | unit of K in HB model | - |
References
- Al-Hameedi, A.T.T.; Alkinani, H.H.; Dunn-Norman, S.; Al-Alwani, M.A.; Alshammari, A.F.; Alkhamis, M.M.; Mutar, R.A.; Al-Bazzaz, W.H. Experimental investigation of environmentally friendly drilling fluid additives (mandarin peels powder) to substitute the conventional chemicals used in water-based drilling fluid. J. Pet. Explor. Prod. Tech. 2020, 10, 407–417. [Google Scholar] [CrossRef]
- Abdulkareem, M.A.; Al-Kaabi, F.S.; Muhsin, N.A.; Badr, N.D.; Radhi, D.J. Activation of calcium bentonite for use as a drilling fluid: Physical and chemical methods evaluation. Case Stud. Chem. Environ. Eng. 2024, 9, 100587. [Google Scholar] [CrossRef]
- Nzarem, P.; Jakada, K.; Lawal, S.; Salihu, A. Influence of Local Additives on Water Based Drilling Mud: A Review. Nile J. Eng. Appl. Sci. 2023, 1, 1–14. [Google Scholar] [CrossRef]
- Fato, A.; Rahmani, O.M. Enhancing drilling fluid properties using biodegradable waste additives: A comprehensive study on water- and oil-based systems. J. Environ. Manag. 2024, 370, 123007. [Google Scholar] [CrossRef] [PubMed]
- European Commission; Joint Research Centre. Raw Materials Information System (RMIS): Bentonite-Market, Trade and Price Developments 2024–2025; European Commission: Brussels, Belgium, 2025. [Google Scholar]
- Wessendorff, G. Achieving Operational Efficiency Gains Using a Total Fluids Management Service. World Oil 2020, September (Feature). Available online: https://worldoil.com/magazine/2020/september-2020/features/achieving-operational-efficiency-gains-using-a-total-fluids-management-service/ (accessed on 11 September 2025).
- New Producers Group. Exploration Cost Benchmark: Reference Manual. 2019 (Update 2020). Available online: https://www.newproducersgroup.online/wp-content/uploads/2020/11/Reference_manual-update_11012019_formatted.pdf (accessed on 11 September 2025).
- Alofabi, R.O.; Orodu, O.D.; Efeovbokhan, V.E. Properties and application of Nigerian bentonite clay deposits for drilling mud formulation: Recent advances and future prospects. Appl. Clay Sci. 2017, 143, 39–49. [Google Scholar] [CrossRef]
- Medved, I.; Gaurina-Međimurec, N.; Novak Mavar, K.; Mijić, P. Waste Mandarin Peel as an Eco Friendly Water Based Drilling Fluid Additive. Energies 2022, 15, 2591. [Google Scholar] [CrossRef]
- Assi, A.H.; Haiwi, A.A. Utilizing Environmentally and Recycled Materials to Formulate Drilling Mud. J. Pet. Res. Stud. 2024, 14, 37–51. [Google Scholar] [CrossRef]
- Okon, A.N.; Akpabio, J.U.; Tugwell, K.W. Evaluating the Locally Sourced Materials as Fluid Loss Control Additives in Water-Based Drilling Fluid. Heliyon 2020, 6, e04091. [Google Scholar] [CrossRef]
- European Union. Directive (EU) 2018/851 of the European Parliament and of the Council of 30 May 2018 Amending Directive 2008/98/EC on Waste; Official Journal of the European Union: Brussels, Belgium, 14 June 2018; L 150; pp. 109–140. Available online: https://eur-lex.europa.eu/legal-content/EN/TXT/PDF/?uri=CELEX%3A32018L0851 (accessed on 1 September 2025).
- Le, N.N.H.; Hau, D.P.; Hieu, L.T.; Quang, H.T.; Tam, T.N.T.; Dung, T.T.; Khanh, D.Q. An Eco Friendly Fluid Loss Control Additive for Water Based Bentonite Drilling Fluid: Orange Peel Waste. Chem. Eng. Trans. 2023, 106, 931–936. [Google Scholar] [CrossRef]
- Eze, S.O.; Chukwu, C.J. Formulation of drilling fluids using local materials. Eur. J. Sustain. Dev. Res. 2025, 9, em0308. [Google Scholar] [CrossRef]
- Al-Homadhi, E.S. Improving Local Bentonite Performance for Drilling Fluids Applications; SPE Saudi Arabia Section Technical Symposium: Dhahran, Saudi Arabia, 2007. [Google Scholar] [CrossRef]
- Nlemedin, P.U.; Chime, T.C.; Omotioma, M.; Archibong, F.N.; Ajah, S.A. Comparative study of bentonite and Ikwo clay for oil-based drilling mud formulation. Geoenergy Sci. Eng. 2023, 229, 212089. [Google Scholar] [CrossRef]
- Guo, D.; Yuan, T.; Li, R.; Song, Y.; Liu, J.; Zhang, X. Cellulose Nanofibrils as Rheology Modifier and Fluid Loss Additive in Water-Based Drilling Fluids: Rheological Properties, Rheological Modeling, and Filtration Mechanisms. Ind. Crops Prod. 2023, 193, 116253. [Google Scholar] [CrossRef]
- Medina Herrera, N.; Pérez Mora, L.; Sánchez Guerrero, G. From Citrus Waste to Valuable Resources: A Biorefinery Approach. Biomass 2024, 4, 784–808. [Google Scholar] [CrossRef]
- European Environment Agency (EEA). Typical Charge (Gate Fee and Landfill Tax) for Legal Landfilling of Non-Hazardous Municipal Waste in EU Member States and Regions. Published: 19 March 2013; Modified: 11 September 2024. Available online: https://www.eea.europa.eu/en/analysis/maps-and-charts/typical-charge-gate-fee-and (accessed on 1 September 2025).
- IPCC. Climate Change 2013: The Physical Science Basis. Contribution of Working Group I to the Fifth Assessment Report (AR5); Cambridge University Press: Cambridge, UK, 2013. [Google Scholar]
- Abdel Aziz, H.; Desouky, S.; Taha, S. Cross Linked Xanthan Gum for High Performance Water Based Drilling Fluids. Polymers 2023, 15, 1152. [Google Scholar] [CrossRef]
- Khan, M.A.; Li, M.-C.; Lv, K.; Sun, J.; Liu, C.; Liu, X.; Shen, H.; Dai, L.; Lalji, S.M. Cellulose Derivatives as Environmentally-Friendly Additives in Water-Based Drilling Fluids: A Review. Carbohydr. Polym. 2024, 342, 122355. [Google Scholar] [CrossRef] [PubMed]
- Li, M.-C.; Tang, Z.; Liu, C.; Huang, R.; Koo, M.S.; Zhou, G.; Wu, Q. Water-Redispersible Cellulose Nanofiber and Polyanionic Cellulose Hybrids for High-Performance Water-Based Drilling Fluids. Ind. Eng. Chem. Res. 2020, 59, 14352–14363. [Google Scholar] [CrossRef]
- Boruah, A.; Chowdhury, M.A. Application of Orange Peel Powder as an Environment Friendly Additive for Water Based Drilling Fluids. Int. J. Eng. Res. Technol. 2023, 12, 1–8. Available online: https://www.ijert.org/application-of-orange-peel-powder-as-an-environment-friendly-additive-for-water-based-drilling-fluids-for-horizontal-wells-in-parts-of-upper-assam-oilfields (accessed on 11 September 2025).
- Li, M.-C.; Wu, Q.; Song, K.; Qing, Y.; Wu, Y. Cellulose Nanoparticles as Modifiers for Rheology and Fluid Loss in Bentonite Water-Based Fluids. ACS Appl. Mater. Interfaces 2015, 7, 5006–5016. [Google Scholar] [CrossRef]
- Medved, I.; Pašić, B.; Mijić, P. The influence of mandarin peel powder on filtration properties and temperature stability of water-based drilling mud. Rud.-Geološko-Naft. Zb. 2023, 38, 53–64. [Google Scholar] [CrossRef]
- Davies, R.B. Hypothesis Testing When a Nuisance Parameter Is Present Only under the Alternative. Biometrika 1987, 74, 33–43. [Google Scholar] [CrossRef]
- Muggeo, V.M.R. Estimating Regression Models with Unknown Break-Points. Stat. Med. 2003, 22, 3055–3071. [Google Scholar] [CrossRef] [PubMed]
- Zhu, W.; Zheng, X. Effective Modified Xanthan Gum Fluid Loss Agent for High-Temperature Water-Based Drilling Fluid and the Filtration Control Mechanism. ACS Omega 2021, 6, 23788–23801. [Google Scholar] [CrossRef] [PubMed]
- Wiśniowski, R.; Skrzypaszek, K.; Toczek, P. Vom Berg and Hahn-Eyring Drilling Fluid Rheological Models. Energies 2022, 15, 5583. [Google Scholar] [CrossRef]
- Al-saba, M.T.; Amadi, K.W.; Dushaishi, M.F.; Al-Hameedi, A.; Alkinani, H. Experimental Investigation of Bio-Degradable Environmental Friendly Drilling Fluid Additives Generated from Waste. In SPE International Conference and Exhibition on Health, Safety, Security, Environment, and Social Responsibility; SPE: Abu Dhabi, United Arab Emirates, 2018. [Google Scholar] [CrossRef]
- American Petroleum Institute. RP 13B-1. Recommended Practice for Field Testing Water-Based Drilling Fluids, American Petroleum Institute: Washington, DC, USA.
- ISO 10414-1 2003; Petroleum and Natural Gas Industries—Field Testing of Drilling Fluids—Part 1: Water-Based Fluids. International Organization for Standardization: Geneva, Switzerland, 2023.
- Wiśniowski, R.; Skrzypaszek, K.; Małachowski, T. Selection of a Suitable Rheological Model for Drilling Fluid Using Applied Numerical Methods. Energies 2020, 13, 3192. [Google Scholar] [CrossRef]
Disclaimer/Publisher’s Note: The statements, opinions and data contained in all publications are solely those of the individual author(s) and contributor(s) and not of MDPI and/or the editor(s). MDPI and/or the editor(s) disclaim responsibility for any injury to people or property resulting from any ideas, methods, instructions or products referred to in the content. |
© 2025 by the authors. Licensee MDPI, Basel, Switzerland. This article is an open access article distributed under the terms and conditions of the Creative Commons Attribution (CC BY) license (https://creativecommons.org/licenses/by/4.0/).