1. Introduction
Finite element analysis (FEA) is a powerful tool for evaluating the mechanical performance of endodontic files, particularly those made from nickel–titanium (NiTi) alloys. These instruments experience complex stresses during clinical use, which can lead to unexpected failures. FEA allows for the detailed simulation of stress and strain distributions under controlled conditions, supporting the prediction of failure points and the optimization of design parameters. The quality of the finite element model is critical to achieving accurate results and depends heavily on the fidelity of the underlying geometry, material properties, and boundary conditions used in the simulation process.
The literature can be categorized into three groups based on how the researchers obtained the geometry of endodontic files for analysis: studies employing CAD-generated geometries, which represent the theoretical design; those using scan-derived geometries obtained through techniques such as micro-CT or white light scanning; and those that employ hybrid approaches that integrate both methods to capitalize on the strengths of each.
CAD-generated geometries are digital models created using computer-aided design software, representing the idealized theoretical shape of the endodontic file as defined by its design parameters. Researchers who employed this approach in their investigations include Di Russo [
1], who conducted a design optimization of the torsional stress behavior of endodontic files based on the results of finite element analyses. The geometries of the files under optimization were created using SolidWorks (
Dassault Systèmes, Vélizy-Villacoublay, France), and were then analyzed using Ansys (
Ansys Inc., Canonsburg, PA, USA). The authors explain that it is necessary to use a manual approach to repeat this process for each iteration of the optimization process, which is time-consuming. Furthermore, the computational geometry of the files under study do not match their actual geometry, as the smooth transition area between the active part and the shaft is not considered.
Additionally, Montalvão [
2] used Catia (
Dassault Systèmes, Vélizy-Villacoublay, France) to generate the computational geometries of two commercial endodontic instruments. A profile projector and a geometric microscope were used to assist in characterizing both files, ensuring they resembled the real files as closely as possible. Then, the finite element mesh generation and structural analyses were conducted using Ansys. While this process allows for the production of accurate representations of the files, it is far from ideal from an efficiency perspective.
Roda-Casanova [
3] developed algorithms to generate a computational representation of the endodontic files from their design parameters. By doing this, they enabled the automated finite element mesh generation of the file, thereby speeding up the design process and increasing its geometrical accuracy. This procedure also enables consideration of the geometry of the transition area between the active part and the shaft of the files, which other studies usually disregard due to their complex shape. Recently, Roda-Casanova [
4] improved the accuracy of the computational representation of the files by considering the characteristics of their manufacturing process. The methods they describe were used to investigate the effect of the cross-section and pitch on the mechanical response of the files [
5].
Scan-derived geometries are 3D models reconstructed from physical endodontic files using optical inspection techniques such as micro-CT or white light scanning, capturing the actual shape of the instrument, including manufacturing deviations and surface details.
Along these lines, De Arruda Santos [
6] used finite element analyses to compare the mechanical behavior of three nickel–titanium rotary files. For this purpose, the instruments were scanned using micro-CT, and the resultant images were further segmented to form three-dimensional geometric models. Then, the shafts of the endodontic files were included in the geometry using SolidWorks. Finally, the models were meshed and analyzed using Abaqus (
Simulia, Dassault Systèmes, Providence, RI, USA).
In addition, Makade [
7] employed white light scanning techniques to reconstruct the three-dimensional geometry of an endodontic file, which was then imported into Ansys for finite element analysis and comparison of the results for three different ProTaper geometries.
As stated by De Arruda Santos [
6], the use of micro-CT scanning helps obtain an accurate model, including any geometric characteristics of the actual instruments, thus eliminating the need for approximations in the building of the models. Furthermore, the geometry of instruments is very complex and challenging to reproduce in computer-aided design software. Thus, the primary advantage of micro-CT scanning is its ability to obtain a complex geometry and detailed features.
However, this approach has some significant drawbacks compared with those based on CAD technologies: First, the scanned geometry may deviate from the original design due to potential deformations introduced during the manipulation or positioning of the physical file. Second, the accuracy of the resulting model is limited by the resolution and tolerances of the scanning system, which may introduce noise or minor artifacts. Third, the geometry obtained from scanning is typically non-parametric and mesh-based, making it difficult or impossible to extract design parameters or perform direct modifications. These limitations reduce the suitability of scan-derived geometries for design optimization or advanced simulation tasks, although they remain valuable for capturing the actual manufactured shape of the instrument.
To mitigate these drawbacks, there are hybrid approaches that combine the realism of scan-derived models with the flexibility of CAD-based representations. These methods typically start from an STL mesh obtained using micro-CT or white light scanning and then reconstruct an equivalent CAD model by approximating analytical surfaces for the scanned geometry. This process enables the recovery of parametric features from a physical object, facilitating design modifications, geometric analysis, and advanced simulations such as finite element analysis. Hybrid approaches therefore preserve the geometric fidelity of the manufactured instrument while restoring the design control and adaptability inherent to CAD technologies.
Several studies have employed such approaches. For example, Monika [
8] and Manivanan [
9] used micro-CT to scan the geometry of the Kedo SG Blue-D1, Neoendo Pedo Flex, and Pro AF Baby B2 endodontic files. Then, they used SolidWorks to construct CAD models that approximated the actual scanned files. Finally, finite element models were created using Hypermesh (
Altair Engineering Inc., Troy, MI, USA) to perform mechanical analyses on the reconstructed geometries. In general, works that are based on this approach require a great deal of manual work to match the CAD geometries to the scanned ones.
Similarly, Kim [
10,
11] used a micro-CT scanner to obtain a computational representation of the geometry of four endodontic instruments. Then, the surfaces acquired by the CT scan were further processed using Ideas NX
(Siemens PLM Software, Plano, TX, USA) to suppress noise and refine the definition of the file tips and sharp edges. The reconstructed geometries were meshed in Ideas using linear eight-noded hexahedral elements, and then analyzed using Abaqus. Bonessio [
12] followed a similar approach, but used VGStudio (
Volume Graphics GmbH, Heidelberg, Germany) instead of Ideas NX.
Obtaining an accurate computational geometry of the files is important not only for conducting finite element analyses but also for conducting morphological analyses or reverse engineering procedures. In this vein, Faus-Matoses [
13] used micro-CT scans and morphometric analyses to evaluate the pitch and helix angle of NiTi alloy endodontic files with high precision. Using Fiji/ImageJ, the DICOM files were segmented to define the longitudinal axis and measure variations in edge geometry along the file length. The pitch was determined by identifying peak-to-valley distances, while the helix angle was calculated from the cutting edge orientation. The analysis enabled detailed geometric comparisons across Endogal, PathMax, and SmartTrack file systems.
This work presents a set of methodologies designed to bridge the gap between the highly accurate, realistic models derived from CT scans and those based on computational parametric representations of endodontic files. These methodologies operate under the assumption that the geometry of the endodontic file, as obtained from a CT scan, is provided by a third party. Based on this premise, the first methodology aims to reconstruct the original undeformed geometry of the endodontic file from its CT-scanned form. The second methodology focuses on generating a parametric surface representation of the CT-scanned geometry. Finally, instructions are provided for developing finite element models of endodontic files using the constructed parametric surfaces. The proposed methodologies are illustrated using numerical examples, and guidance is provided on how to extract characteristic parameters directly from the computational models. This approach enhances the accuracy of the resulting measurements and contributes to improved model fidelity.
2. Materials and Methods
This section describes a set of methodologies aimed at providing an improved computational representation and a finite element model of an existing endodontic file that has been subjected to a micro-CT scan to obtain an STL file. This file contains the coordinates of a set of points and a set of triangular faces that connect such points, which define the external surface of the endodontic file.
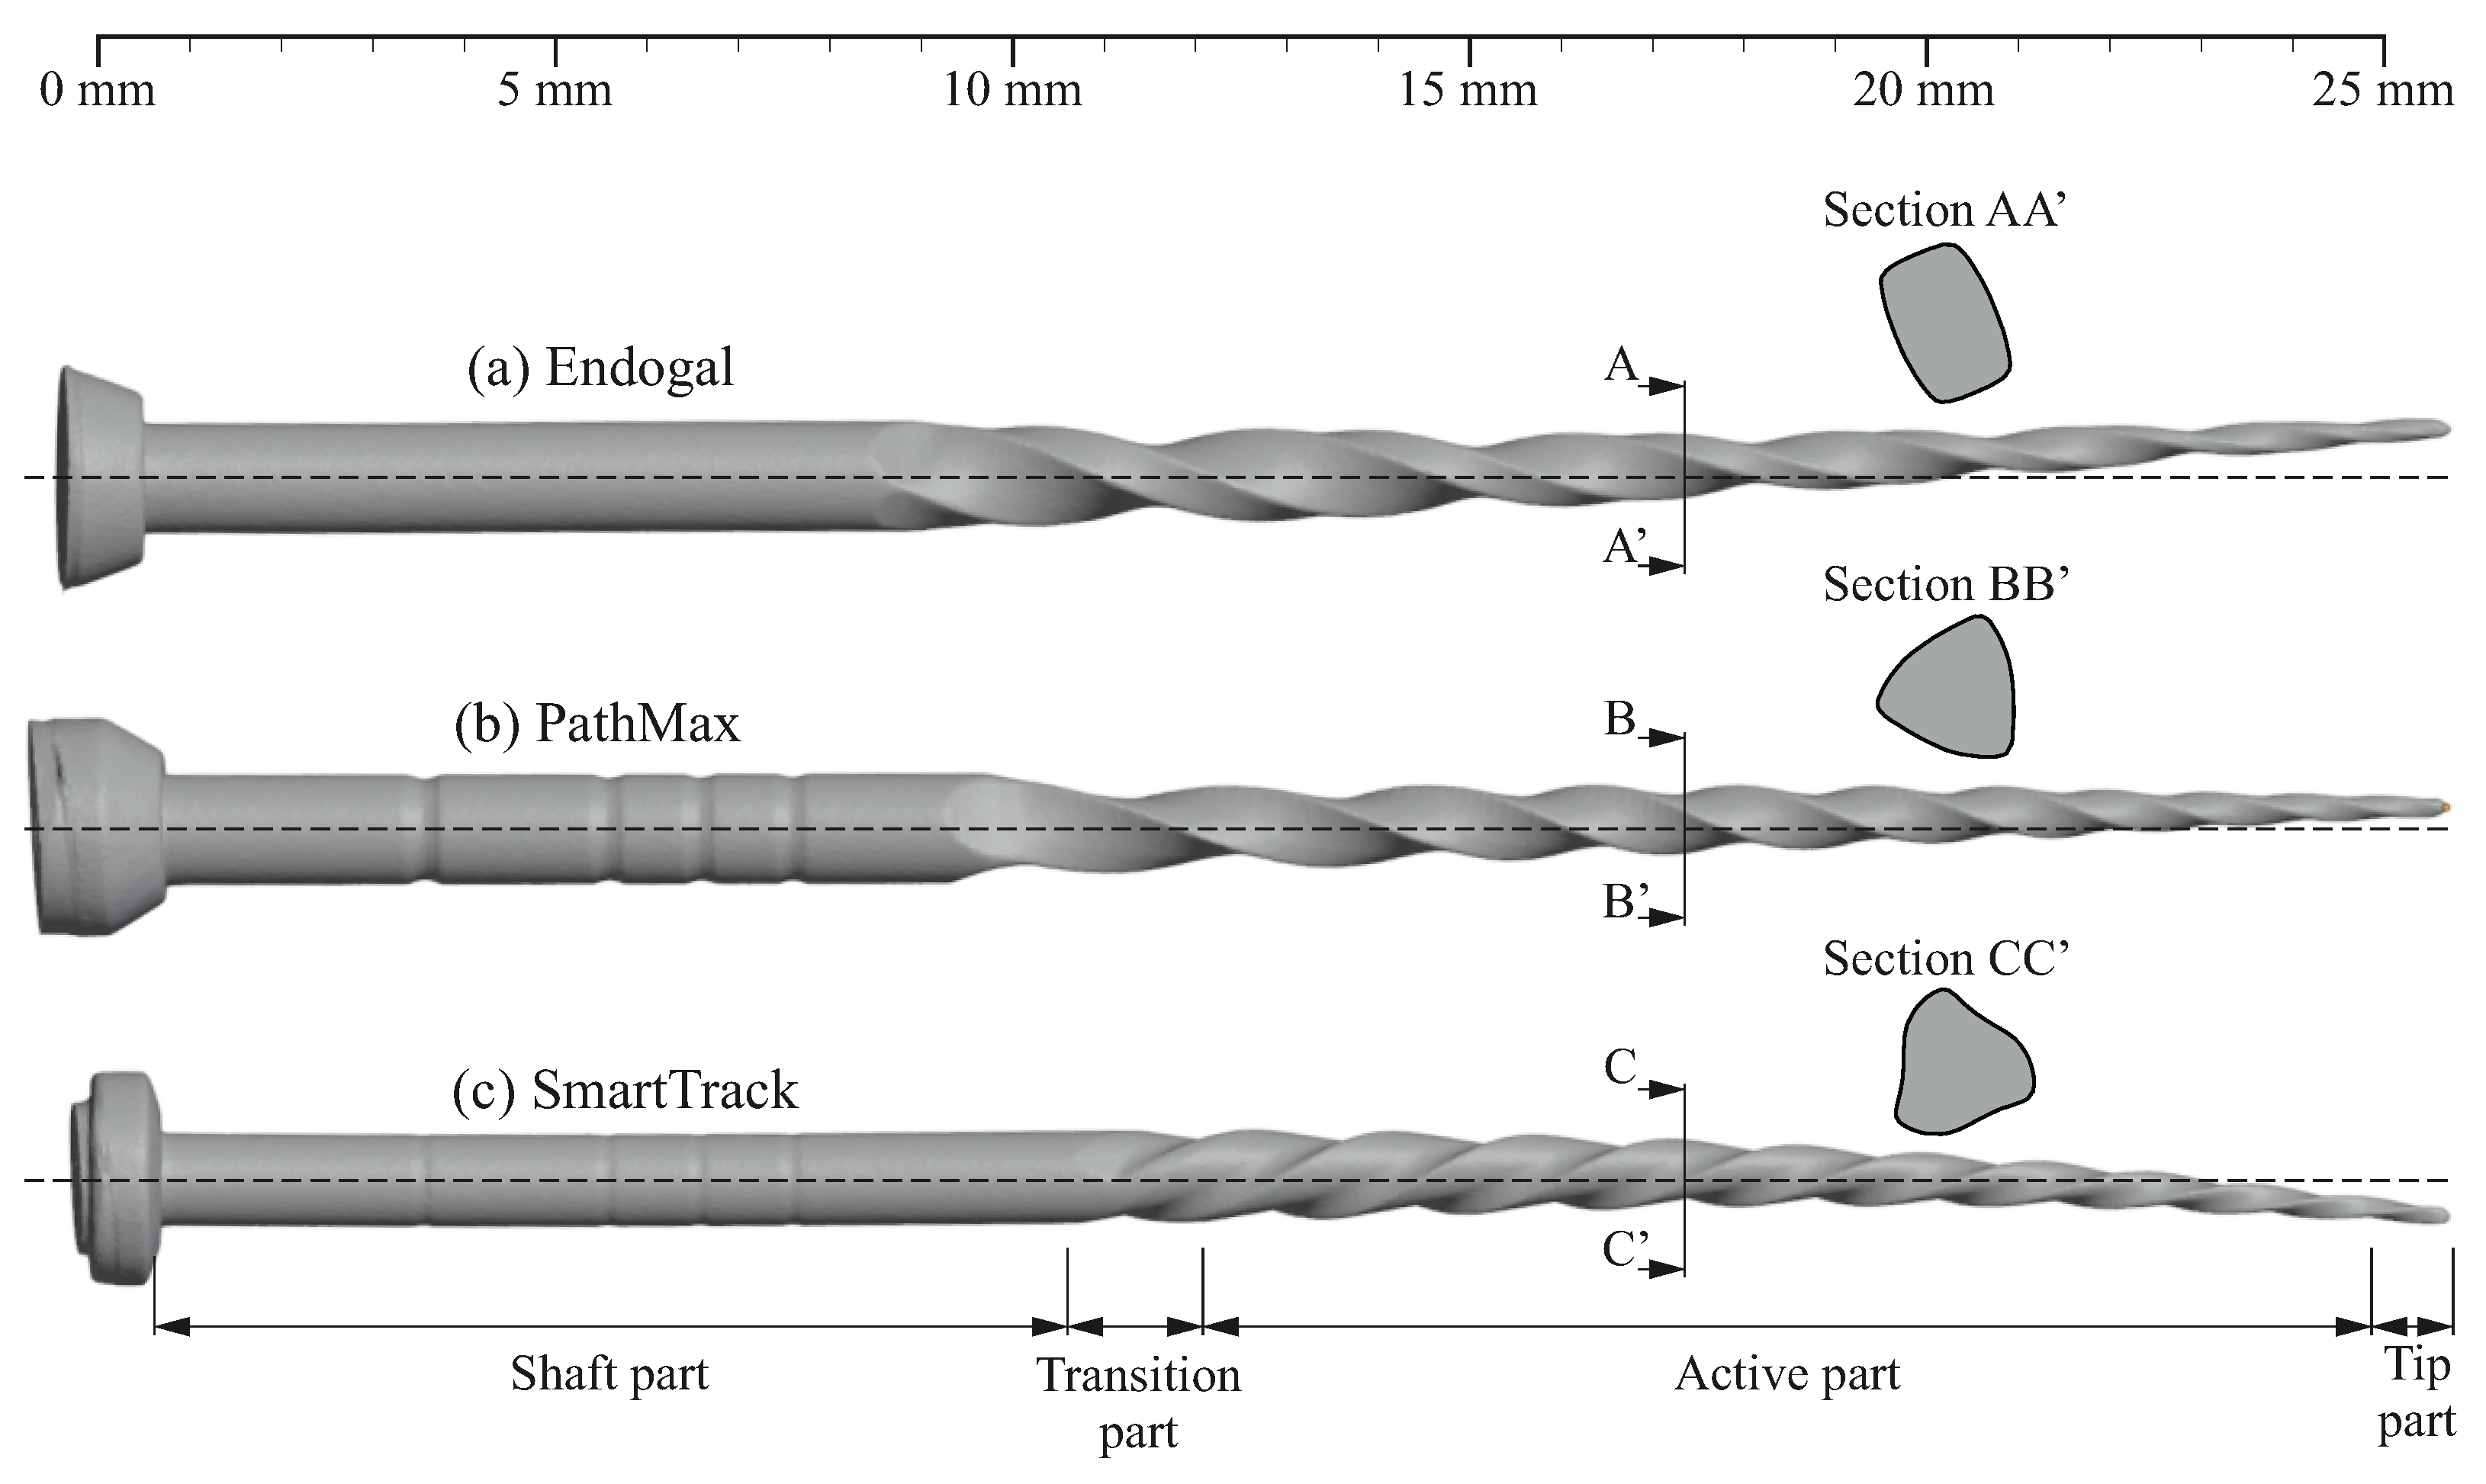
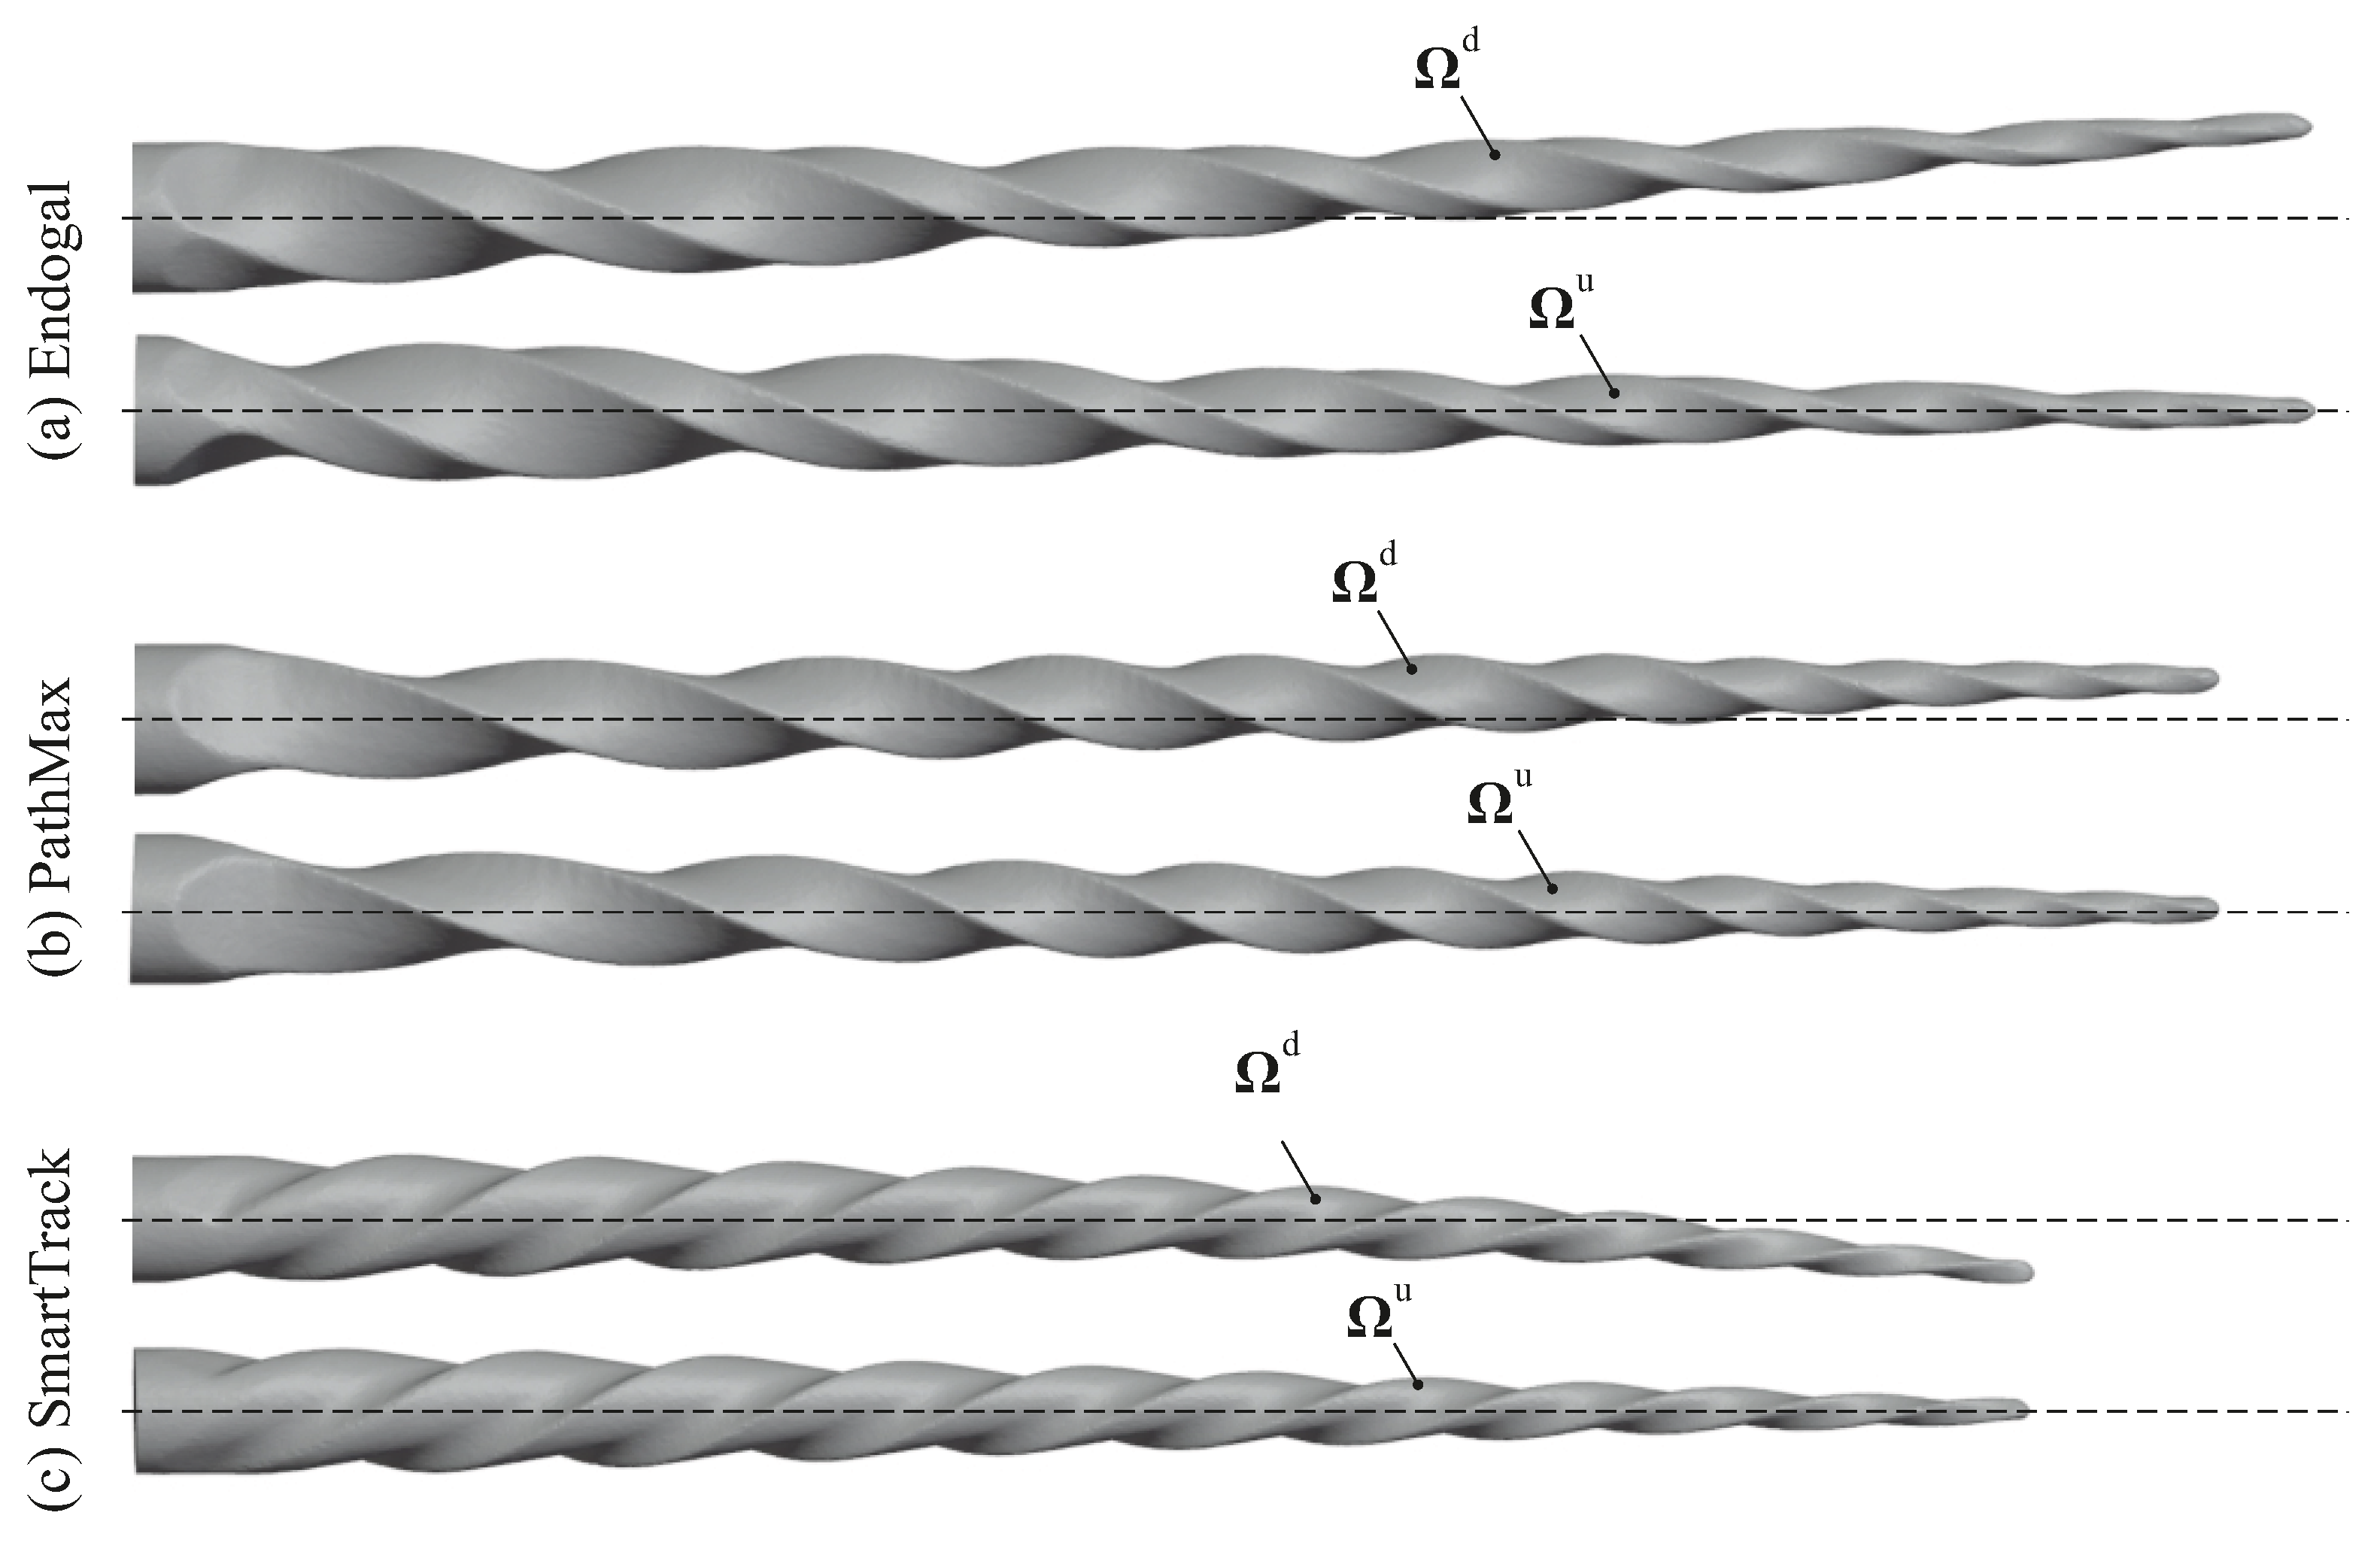
Figure 1 shows three sample surfaces
of endodontic files obtained using micro-CT scans, where four characteristic zones can be distinguished for each file.
The four zones comprise the following:
The active part containing the flutes, which are machined into the raw material to remove diseased pulp tissue in the canal, shave dentin from the canal space, and shape the canal so that it can be filled properly.
The shaft, which has a circular cross-section and connects the active part with the support of the endodontic file (which is not included in the model).
The transition part, which allows for a smooth transition from the cross-section of the active part to the cross-section of the shaft.
The endodontic file tip.
The goal of this work is to convert the discretized surface of the endodontic file into a parametric surface and then build a finite element model of it using this parametric surface. Assuming that the STL file containing the points and triangles that define surface is provided, the steps to achieve the goals of this work are as follows:
- Step 1
Recovery of the original undeformed shape of the endodontic file. As a consequence of the mechanical properties of the NiTi material usually used to manufacture these endodontic files (high flexibility, etc.), the original shape of endodontic files becomes rapidly distorted when they are manipulated to be scanned. For this reason, a methodology is proposed to recover the original shape of the file.
- Step 2
Derivation of a parametric representation of the endodontic file. A collection of mathematical tools is used to obtain a parametric function that provides, for a given set of parametric coordinates of the files, the three-dimensional coordinates of a point over the reconstructed surface of the file.
- Step 3
Construction of a finite element model of the endodontic file. The previously obtained mathematical functions that describe the surface of the endodontic file are used to build a finite element model. These steps include the finite element mesh generation, the definition of loading and boundary conditions, and the specification of a non-linear material.
In the following sections, each one of these steps is thoroughly described.
2.1. Recovery of the Original Undeformed Shape of the Endodontic File
As mentioned earlier, the mechanical properties of the endodontic files make them easy to deform. It is therefore common for the CT-scanned geometry contained in the STL files to differ from its original undeformed shape . Here, superscript d stands for deformed and superscript u stands for undeformed.
This section proposes a methodology for recovering the original undeformed geometry of the endodontic files which consists of two steps: first, the neutral axis of the deformed endodontic file is approximated, and, second, the undeformed geometry of the endodontic file is retrieved.
Assuming that the deformation of the endodontic file is mainly produced by bending, its neutral axis may be approximated by a fourth-degree parametric curve
defined as follows:
where
is the intrinsic coordinate of the parametric curve. For any point along this curve, the tangent vector is given by
, which is defined as follows:
The objective is to determine a set of parameters that best approximates the curve to the neutral axis of the deformed endodontic file. These parameters can be divided into two subsets: subset , which controls the initial location and direction of the curve, and subset , which controls higher-order curvature and bending.
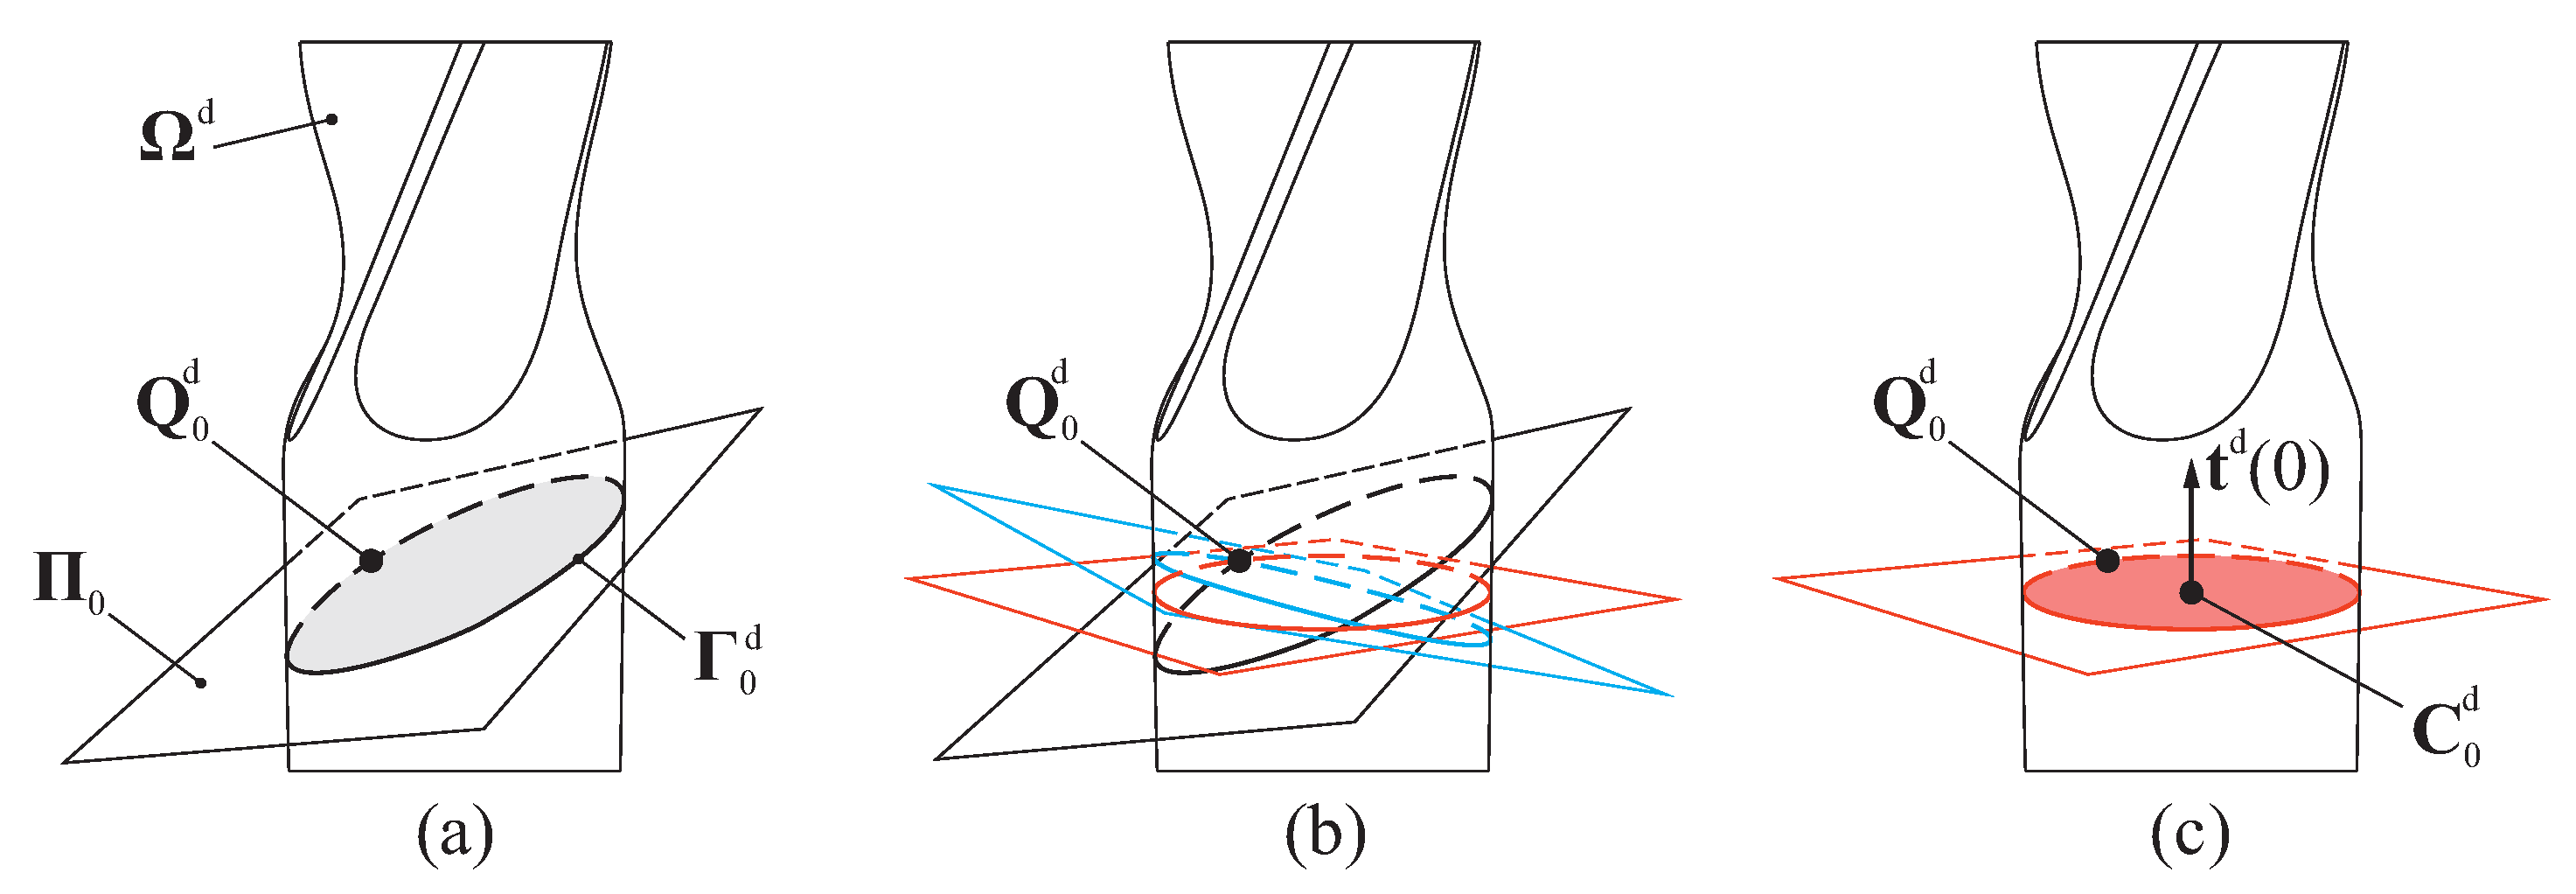
Let us consider a point with coordinates , which is located in the shaft portion of the endodontic file. A plane , which contains point and has normal vector , intersects in a closed contour . This contour is defined by a polyline comprising sequentially connected straight-line segments.
The position of the centroid of
is defined by point
with coordinates
, and its principal centroidal second moments of area are given by
and
. The values for the parameters in subset
are obtained under these conditions by solving the following minimization problem:
The idea behind this minimization process is that the cross-section of the shaft part, even in its deformed configuration, must be as circular as possible
. Furthermore, the constraints of the minimization problem enforce that
. Allow us to emphasize that, for each iteration of the minimization process, the contour
(and the corresponding derived values of
,
,
,
, and
) is numerically computed from the intersection of
with plane
, whose orientation is controlled by
and
. This process is summarized in
Figure 2.
Having calculated the values in subset
, a trial curve
for the deformed neutral axis can be defined by considering arbitrary values for the subset
. For any given value of
, a plane
can be defined by point
and normal vector
. Such a plane
intersects
in a contour
, whose centroid is located at point
. Under these conditions, the values for the parameters in subset
are obtained by solving the following minimization problem:
Here,
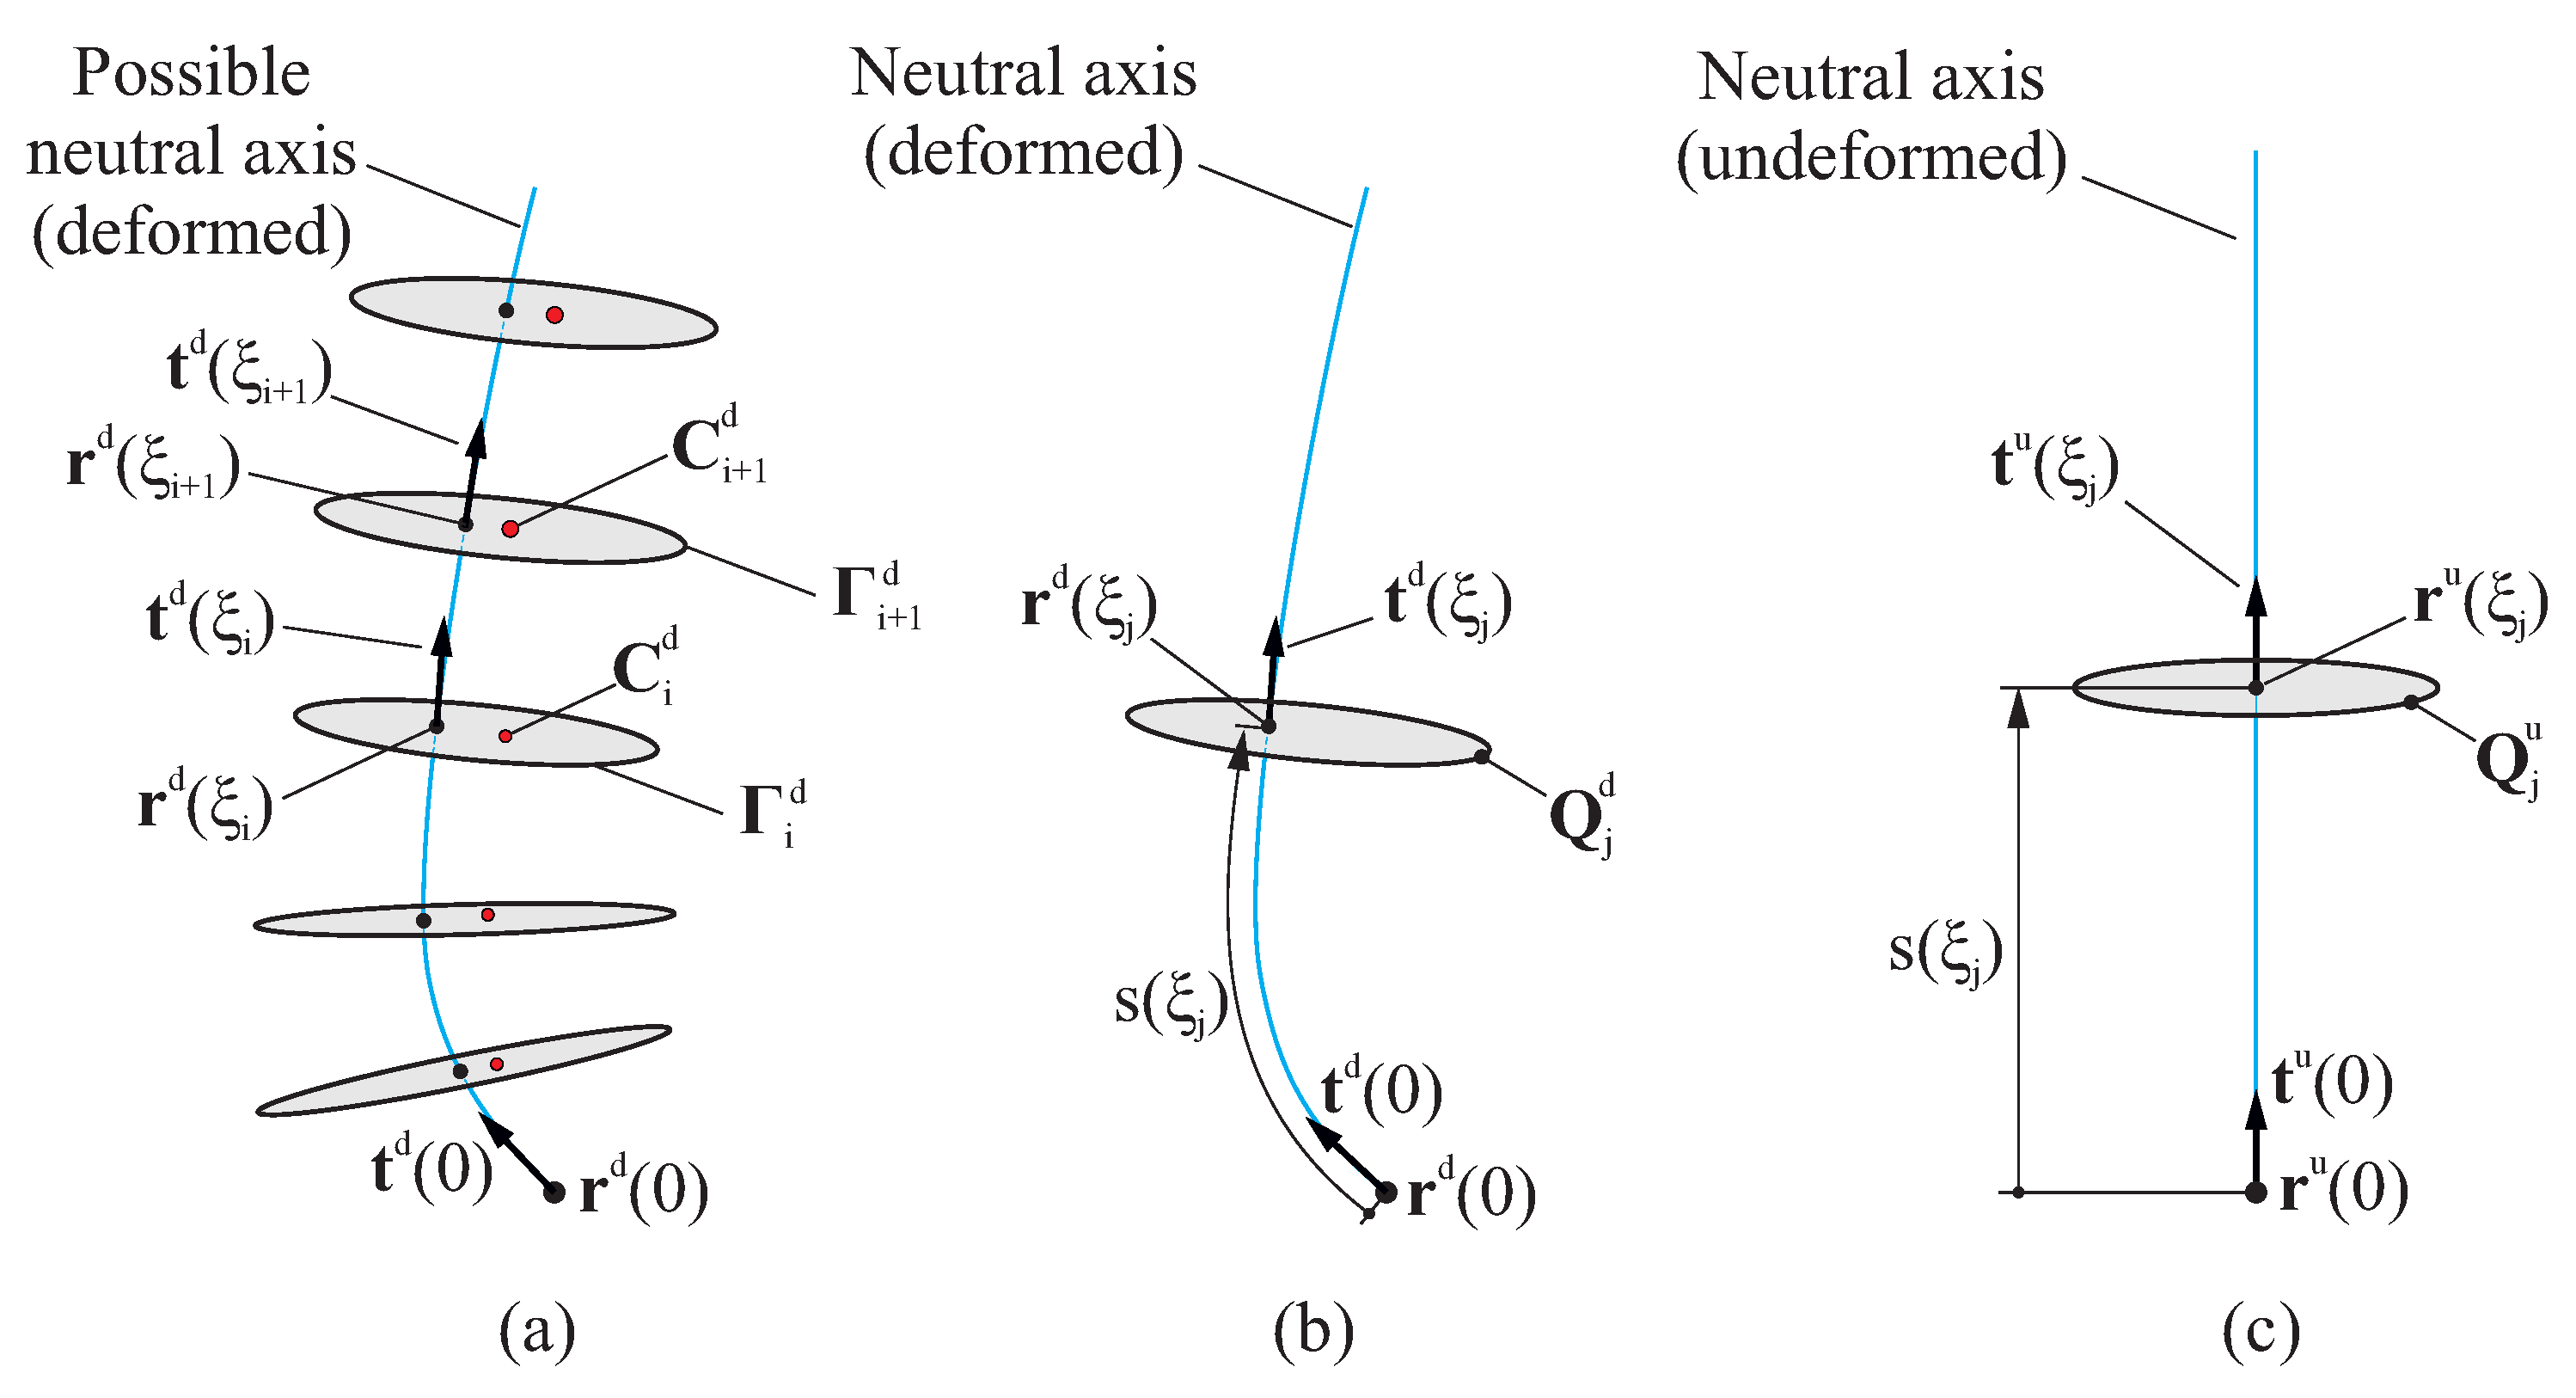
represents an arbitrary number of sections that are evenly distributed along the file’s length. The idea behind this minimization process is that the deformed neutral axis must pass as closely as possible to the centroids of the cross-sections of the file. Allow us to emphasize that, for each iteration of the minimization process, the contour
(and the corresponding position of centroid
) is numerically computed from the intersection of
with plane
. This minimization process is summarized in
Figure 3a.
After the parameters in both subsets
and
have been estimated, the undeformed geometry of the endodontic file
can be retrieved. For each point
, the associated value
is estimated by finding the plane
that contains
and has normal vector
, as illustrated in
Figure 3b.
Next, an affine transformation is applied to obtain the undeformed position of point
from its deformed position
, mapping it from the local reference system defined by the point
and the direction
to a canonical reference system defined by the point
and the direction
, which are defined as:
where
represents the arc length of the deformed neutral axis from
to
(see
Figure 3c) and is computed as follows:
It should be noted that, to fully define the affine transformation, it is assumed that there is no torsional deformation of the endodontic file; that is, there is no rotation around the z-axis. In the case of the shaft zone, the deflection is considered negligible due to its greater rigidity; therefore, this region does not require ‘unbending’.
2.2. Derivation of a Parametric Representation of the Endodontic File
Following the steps indicated in the previous section, we can obtain a representation of the surface of the file close to its undeformed state. However, is nothing more than a transformation of the points and triangles of the STL from the original CT scan. In this sense, the errors inherent to the CT scan and the irregularity of the points and triangles remain. The surface defined by may therefore not be a reasonable basis for obtaining a mesh for finite element analysis.
To solve this issue, this section presents a series of methodologies for obtaining a parametric function
that will ultimately allow us to obtain a representation of the file with mitigated scanning errors. This parametric function is defined as follows:
where
is the angular coordinate and
is the longitudinal coordinate along the file’s axis, as defined in
Figure 3c. Additionally,
is a function that, for a given value of coordinate
s, provides the radial distance from the central axis to the file surface at angular position
.
The function
is constructed specifically for each value of
s. For this purpose, let us consider the contour
that is obtained from the intersection of the triangulated surface
and the plane
that contains point
and has a normal vector of
. The contour
is defined by a collection of
points
connected by straight-line segments (
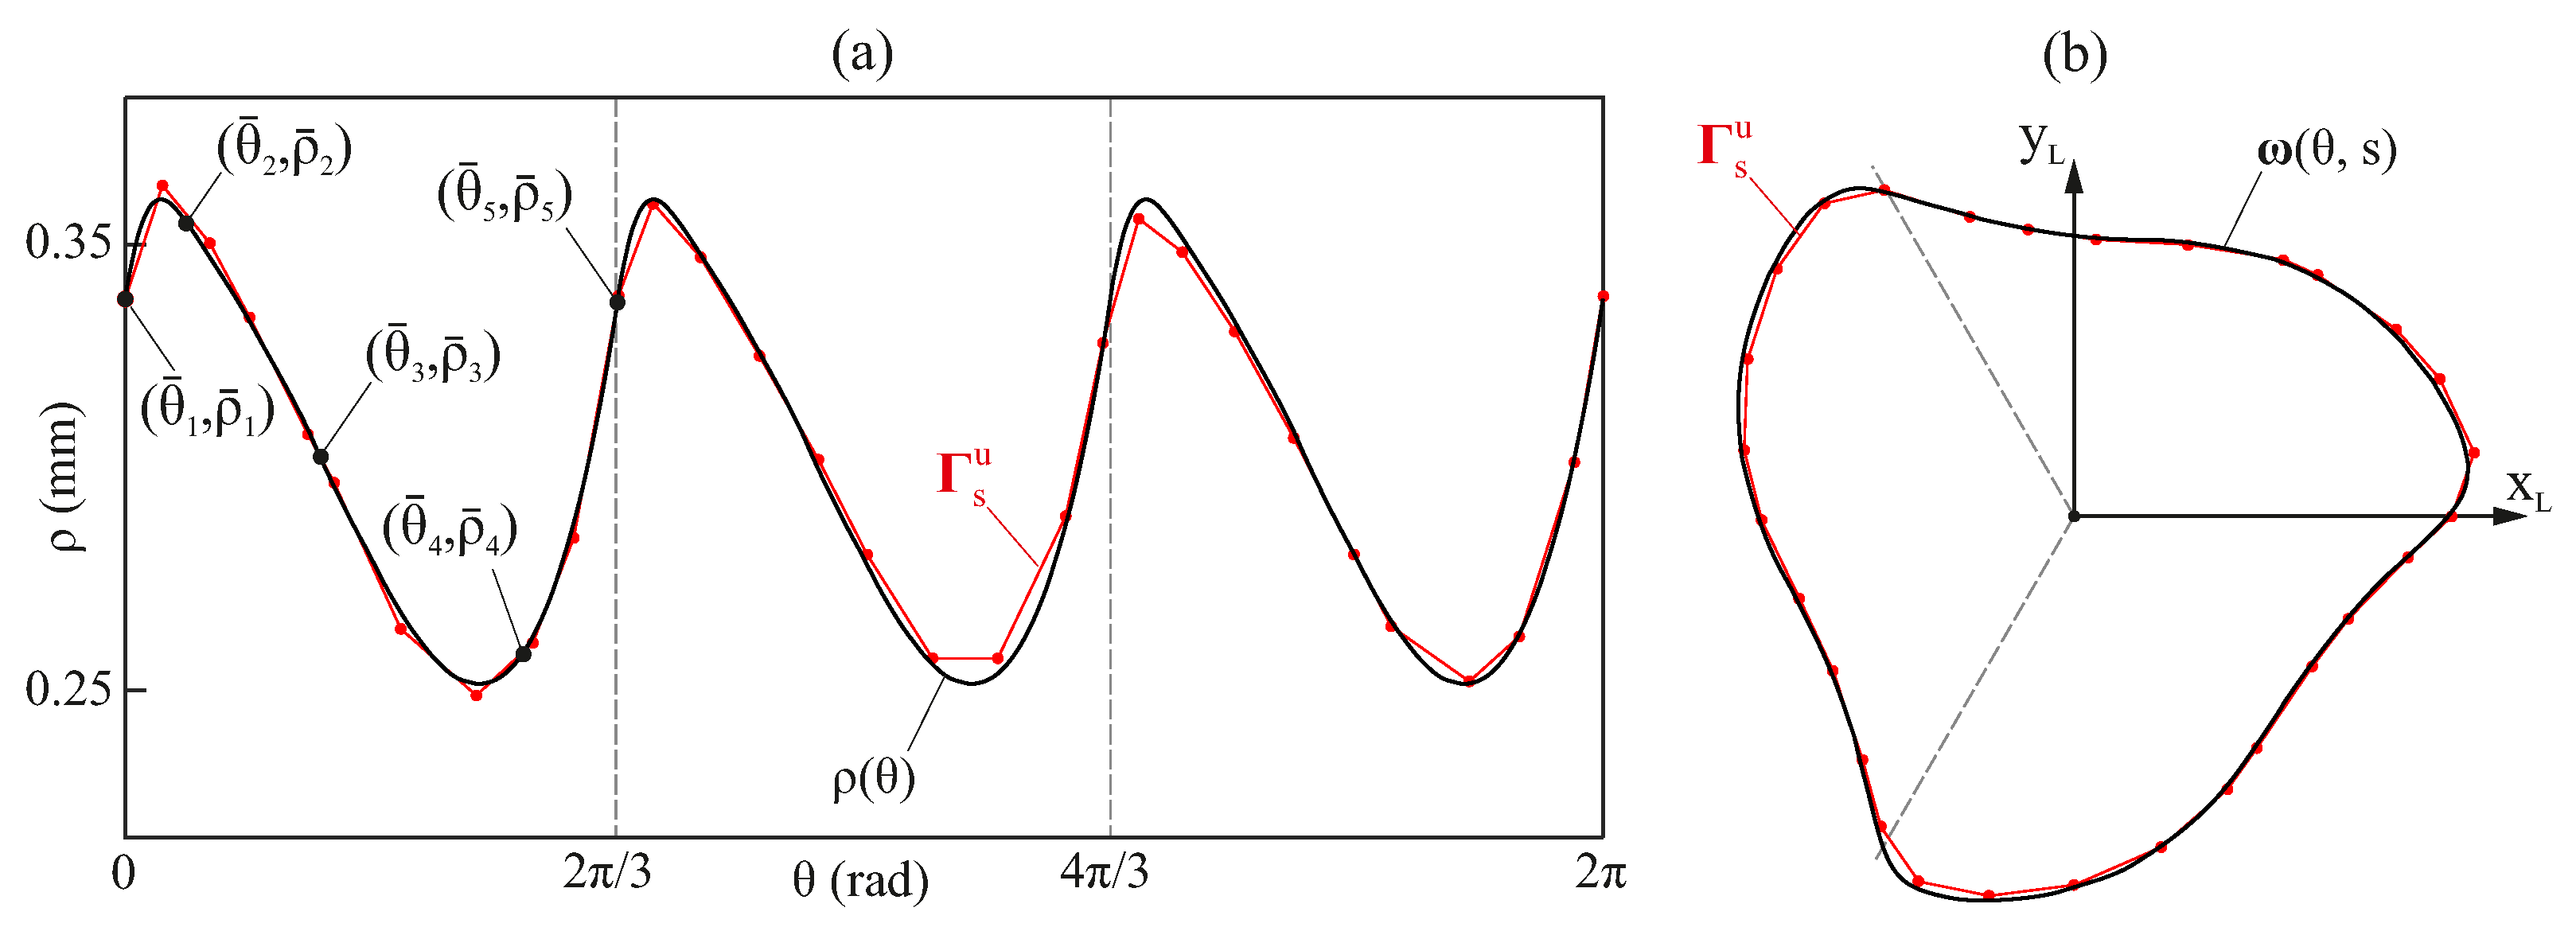
Figure 4a).
The set of Cartesian coordinates
that define
is converted into polar coordinates
, yielding a periodic, piecewise function (
Figure 4b). To construct the radial contour function
for each section
s, we approximate a cubic Hermite interpolating function
to the data points
. Accordingly, the periodic function
is defined as follows:
where the function mod maps the angle
into the interval
, with
denoting the number of periods in the cross-section of the endodontic file’s active part. This mapping is conducted to leverage the cyclic symmetry of the endodontic files and improve the quality of the resulting parametric surface.
The cubic Hermite function
is defined by a collection of
knots
, which, in turn, define
interpolation intervals. For each interval, the cubic Hermite interpolant
is given by the following equation [
14]:
where
and
are the angular bounds of the interval,
and
are the corresponding radial values, and
and
are the second derivatives at the endpoints of the interval.
The second derivatives in the cubic Hermite interpolation are computed by solving a tridiagonal linear system derived from clamped boundary conditions. The system is defined as follows:
For interior points
,
For the first point
(left clamped end),
For the last point
(right clamped end),
Magnitudes
and
in Equations (
9) and (
10) represent the first derivative of
at
and
, respectively. These magnitudes need to be specified to capture the complete definition of the function.
To adjust the cubic Hermite function
to points
, the minimization problem is defined as follows:
The conditions under which this optimization is performed are as follows: The first knot must be located at and the last knot must be located at . Between these endpoints, the knots must form a strictly increasing sequence such that . Furthermore, to ensure the continuity of at the beginning and end of each cyclic period, it is required that and .
It must be highlighted that the cubic Hermite function
is defined in the interval
. Then, it is the operator mod in Equation (
6) which remaps the angle
into this interval. After finding the values that minimize the objective function, the function
is determined for coordinate
s (
Figure 5a). Finally, using Equation (
6), the points on the surface of the reconstructed file are obtained (
Figure 5b).
2.3. Construction of a Finite Element Model of the Endodontic File
This section outlines the procedure for generating finite element models automatically for stress analysis of endodontic files. The process follows the typical steps involved in FE model development: discretizing the volume into finite elements, defining the material properties of the elements, and specifying the loading and boundary conditions.
In the first step, the volume of the endodontic file is discretized into tetrahedral elements using a constrained Delaunay tetrahedralization [
15]. This method requires that the boundary surfaces of the endodontic file be represented as a set of triangles, which will constitute the external faces of the tetrahedra in the final mesh. This boundary representation is constructed by carrying out the following steps:
The external surfaces of the endodontic file are defined analytically using the parametric equation , which provides the Cartesian coordinates of points on the file’s surface regarding their parametric coordinates and s.
The positions of the surface nodes are determined analytically according to the desired number of elements in the longitudinal and angular directions. It should be emphasized that all nodes of the FE mesh are computed analytically.
The surface is discretized into triangular faces using the nodes established in the previous step.
Using this boundary representation, the tetrahedral mesh is generated using the constrained Delaunay tetrahedralization implemented in the TetGen library [
16]. This tetrahedralization preserves the positions of the predefined surface nodes, ensuring that the resulting tetrahedra retain the specified boundary faces.
Once the FE mesh has been generated, material properties are assigned to its elements. The literature presents various approaches to defining the mechanical behavior of NiTi alloys in finite element analyses, ranging from linear [
3,
17,
18] to non-linear [
5] models.
In the final step, the FE model’s loading and boundary conditions are established. Different boundary conditions may be considered, from those replicating standard experimental tests, such as those specified in ISO 3630-1:2008 [
19], to those simulating the rotation of endodontic files within the root canal [
1].
3. Results
Three different endodontic files were studied in this work (Endogal, PathMax, and SmartTrack). The surfaces
of these endodontic files were obtained using a micro-CT scan (Skyscan 1176, Bruker-MicroCT, Kontich, Belgium) under the following exposure parameters: 56.0–58.0
,
,
, four frames, 720 projections,
resolution, a tungsten target from
to
, and a pixel size of
. The resulting surfaces are shown in
Figure 1, and the numbers of vertices and triangles that define them are presented in
Table 1.
In the following subsections, the steps of the proposed methodology are illustrated numerically. Additionally, examples are provided to demonstrate how the resulting parametric surfaces can be used in reverse engineering processes.
3.1. Recovery of the Original Undeformed Geometries of the Endodontic Files
Following the steps outlined in the previous section, the original undeformed geometries of the endodontic files are recovered. First, the neutral axis of each file is retrieved, and then their undeformed geometry is obtained
. This process is depicted in
Figure 6, where the original deformed surfaces (
) and the recovered undeformed surfaces (
) of the endodontic files under study are shown. It can be observed that the proposed methodology is able to recover the original undeformed surfaces of the endodontic files, which are free from the bending that typically occurs during their manipulation.
3.2. Derivation of Parametric Representations of the Endodontic Files
The next step in this process is to obtain a parametric surface for describing the geometry of the endodontic files under study. This process involves constructing a parametric curve for each considered longitudinal coordinate s, which is achieved using cubic Hermite functions with ten knots for the Endogal file and six knots for the PathMax and SmartTrack files.
Figure 7 shows the resulting
function for the three considered endodontic files, for a specific value of longitudinal coordinate
s. The red lines in the figure also show the original contours
, expressed in polar coordinates, which were used to fit the cubic Hermite functions
. The optimized positions of the knots that define
are also shown, located in the interval
.
Figure 7 shows that the way in which the function
is calculated allows for the mitigation of the irregularities inherent to the CT scanning process, as well as the identification of potential manufacturing errors and deviations from the theoretical surfaces that typically exhibit cyclic symmetries.
After finding
for each longitudinal coordinate
s, the parametric representation of the endodontic files
is obtained.
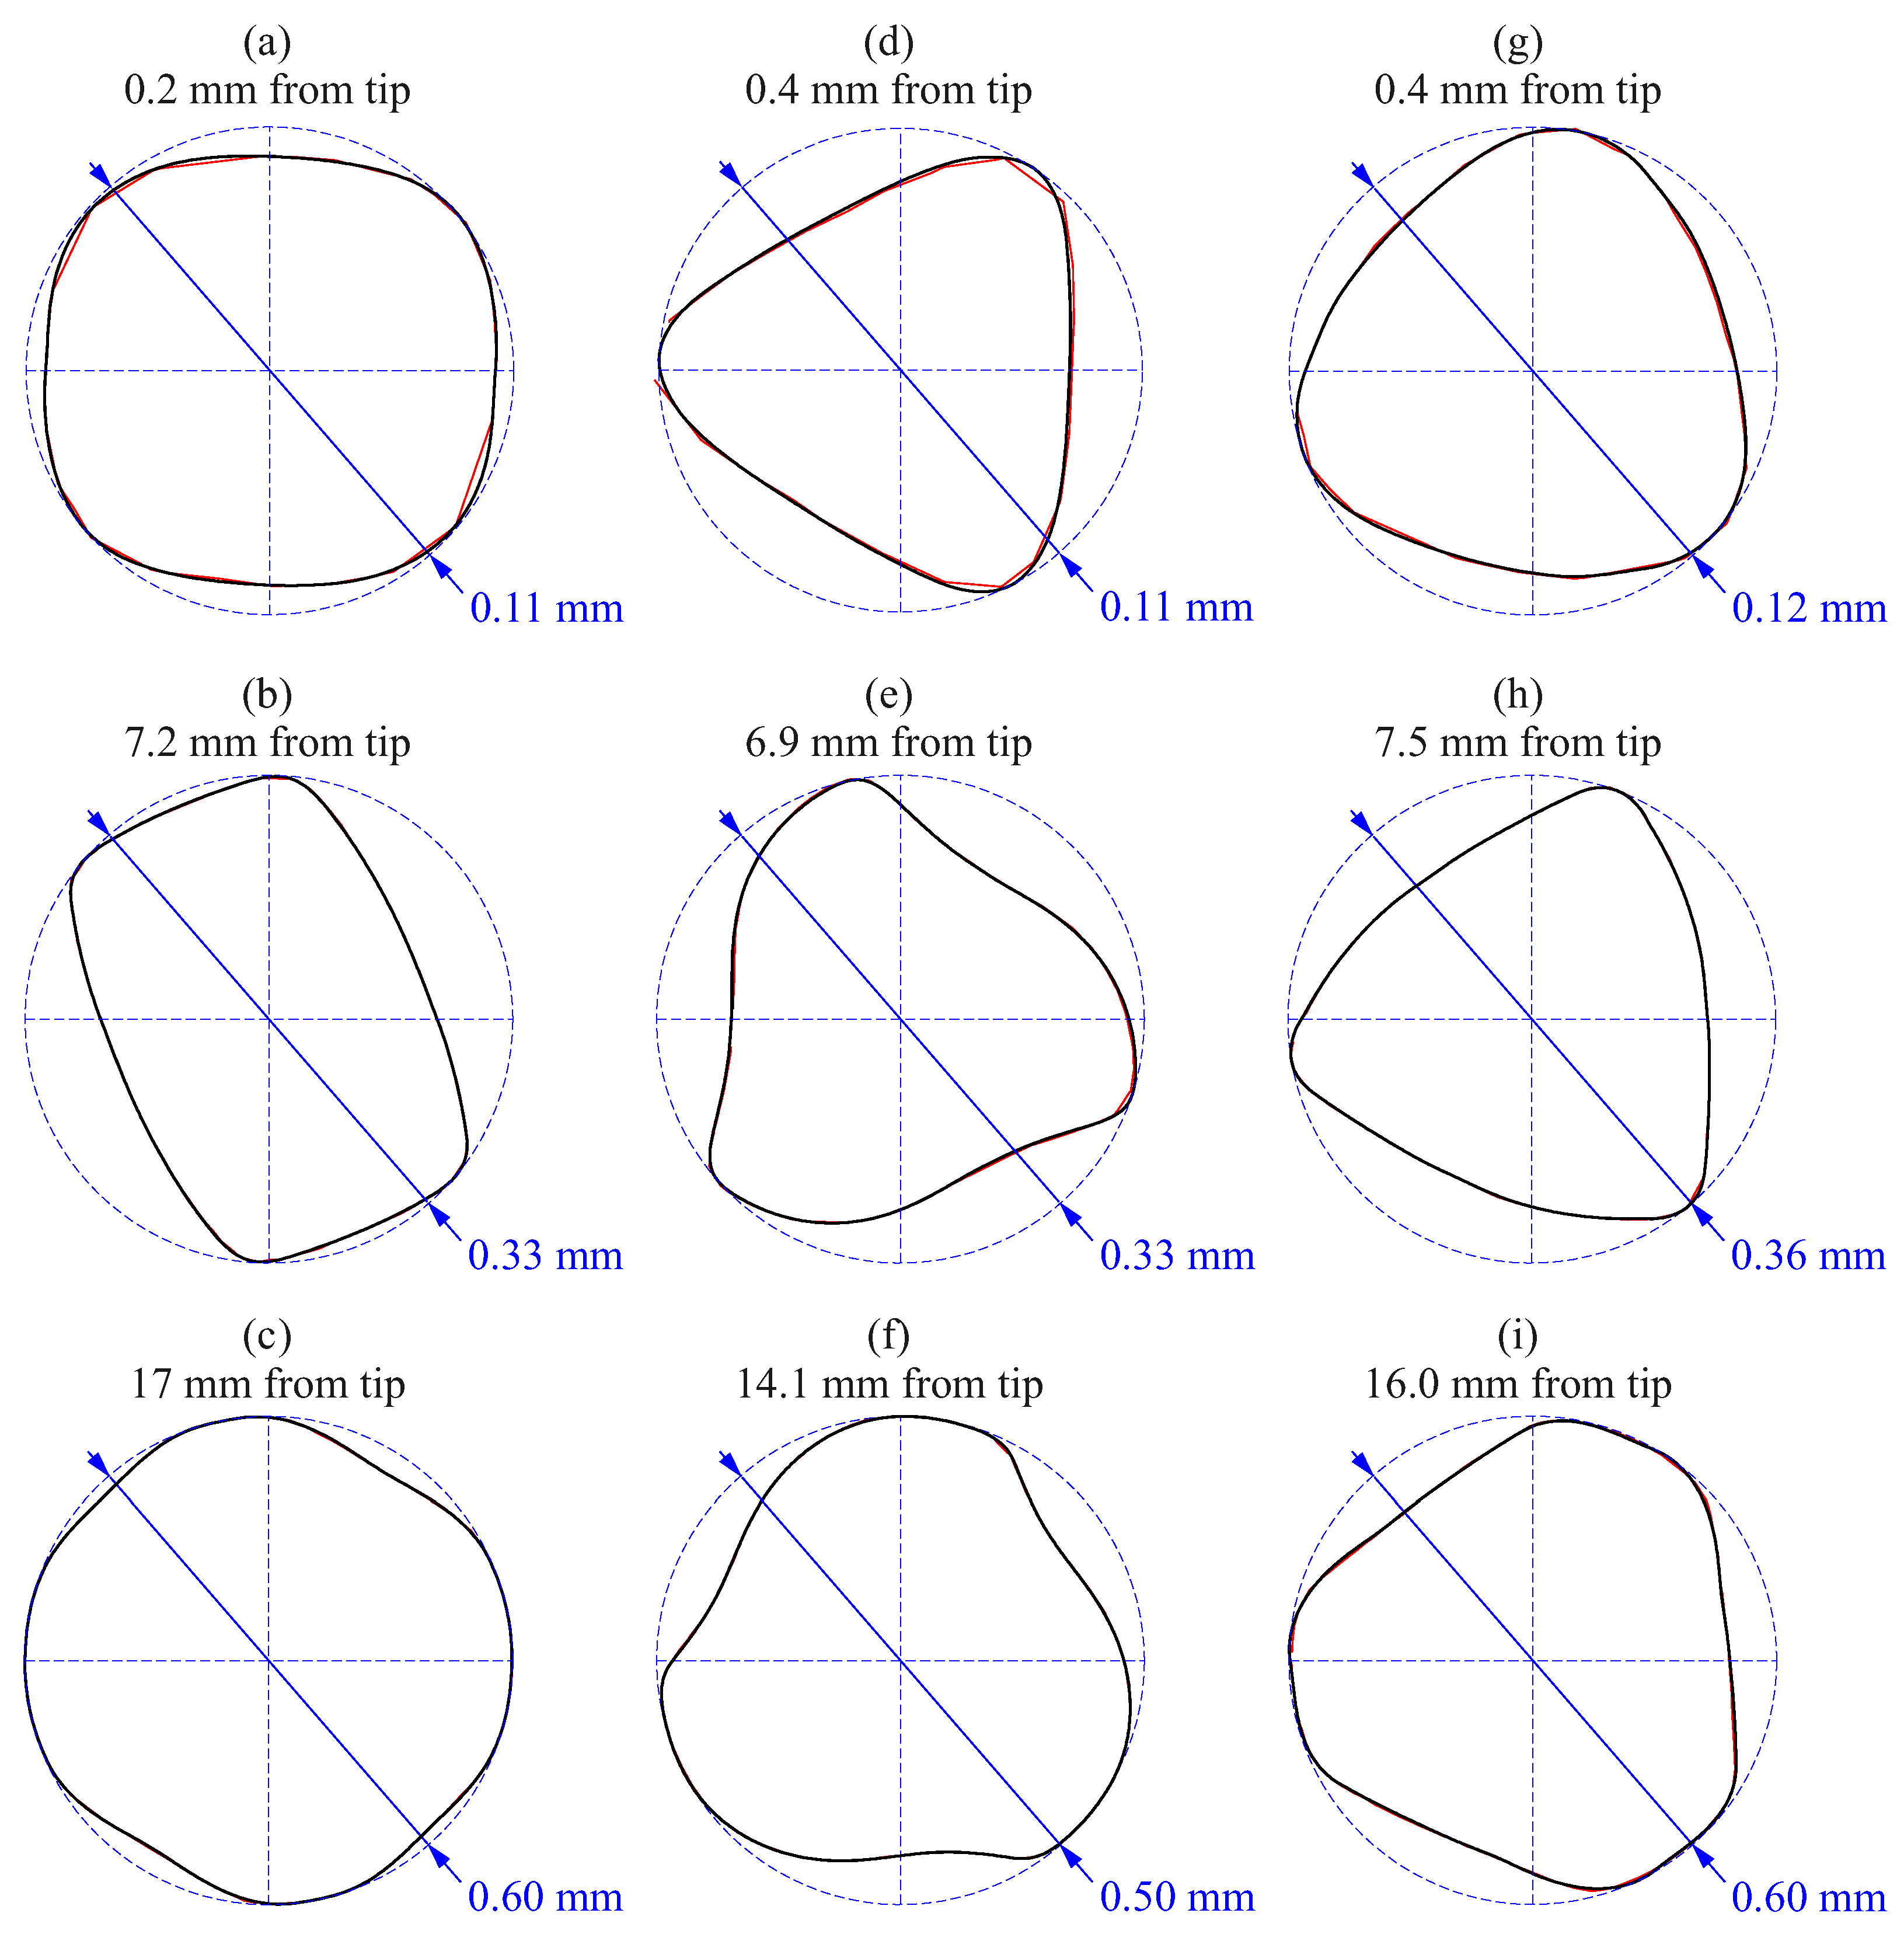
Figure 8 shows the resulting
function at different coordinates
s for the three endodontic files. The red lines in the figure also represent the original contours
that have been used to fit the cubic Hermite functions. It can be observed from these figures that the parametric surface successfully approaches the actual geometry of the file at the tip, the active part, and the transition part.
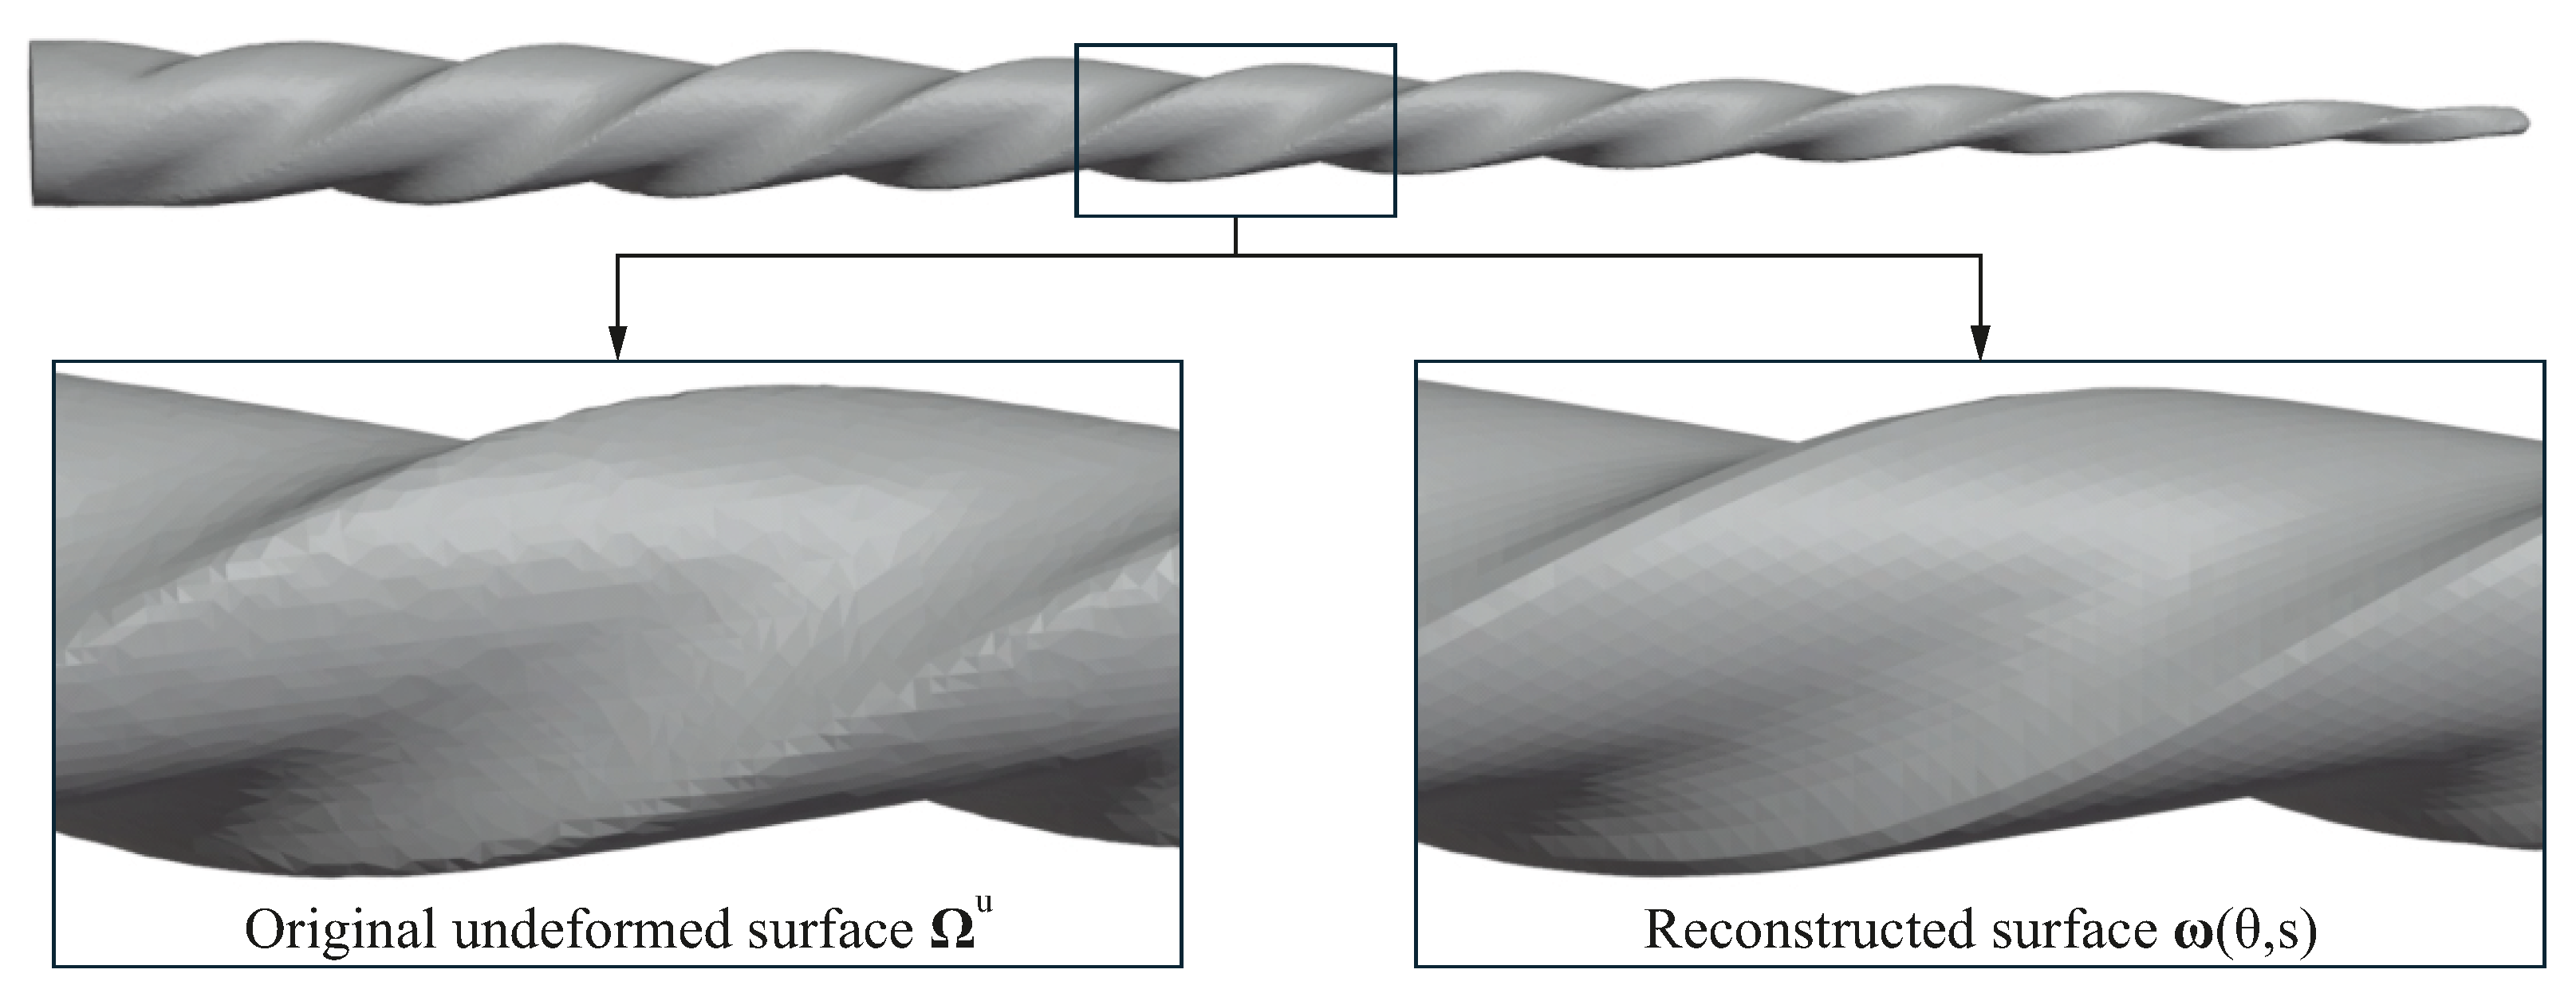
As a result of this process, the parametric function
enables the generation of computer models of endodontic files, in which a set of triangular facets represents the external surface. Although this may appear similar to the original STL-based representation, the quality of the reconstructed surface is significantly improved, as illustrated in
Figure 9.
This improvement is further illustrated in the histograms presented in
Figure 10. Here, the quality of the triangular facets that represent the files’ external surface is assessed using the
metric introduced by Knupp [
20]. This metric assigns a value of
to an equilateral triangle and a value of 0 as the triangle becomes increasingly distorted. In the ideal case, therefore, all triangular facets would achieve
. These histograms show that the reconstructed meshes succeed in concentrating a larger percentage of elements within the range of
, where element quality is maximized. Conversely, the original triangular meshes display higher percentages of elements in lower-quality ranges. This improvement occurs despite the fact that the reconstructed surfaces contain fewer elements overall, with approximately
triangles compared to about
in the original STL surfaces.
3.3. Construction and Analysis of Finite Element Models of the Endodontic Files
To conclude the presentation of this study’s methodologies, the third step involves constructing finite element models of the endodontic files under consideration, following the approaches described in the authors’ previous studies [
3,
5]. Here, the finite element meshes are generated from the reconstructed parametric surfaces of the files.
For illustrative purposes, only torsional analyses are presented, although the proposed methodology is equally applicable to other loading scenarios. The material behavior is modeled as non-linear, following the Auricchio formulation [
21], with NiTi material parameters adopted from [
6].
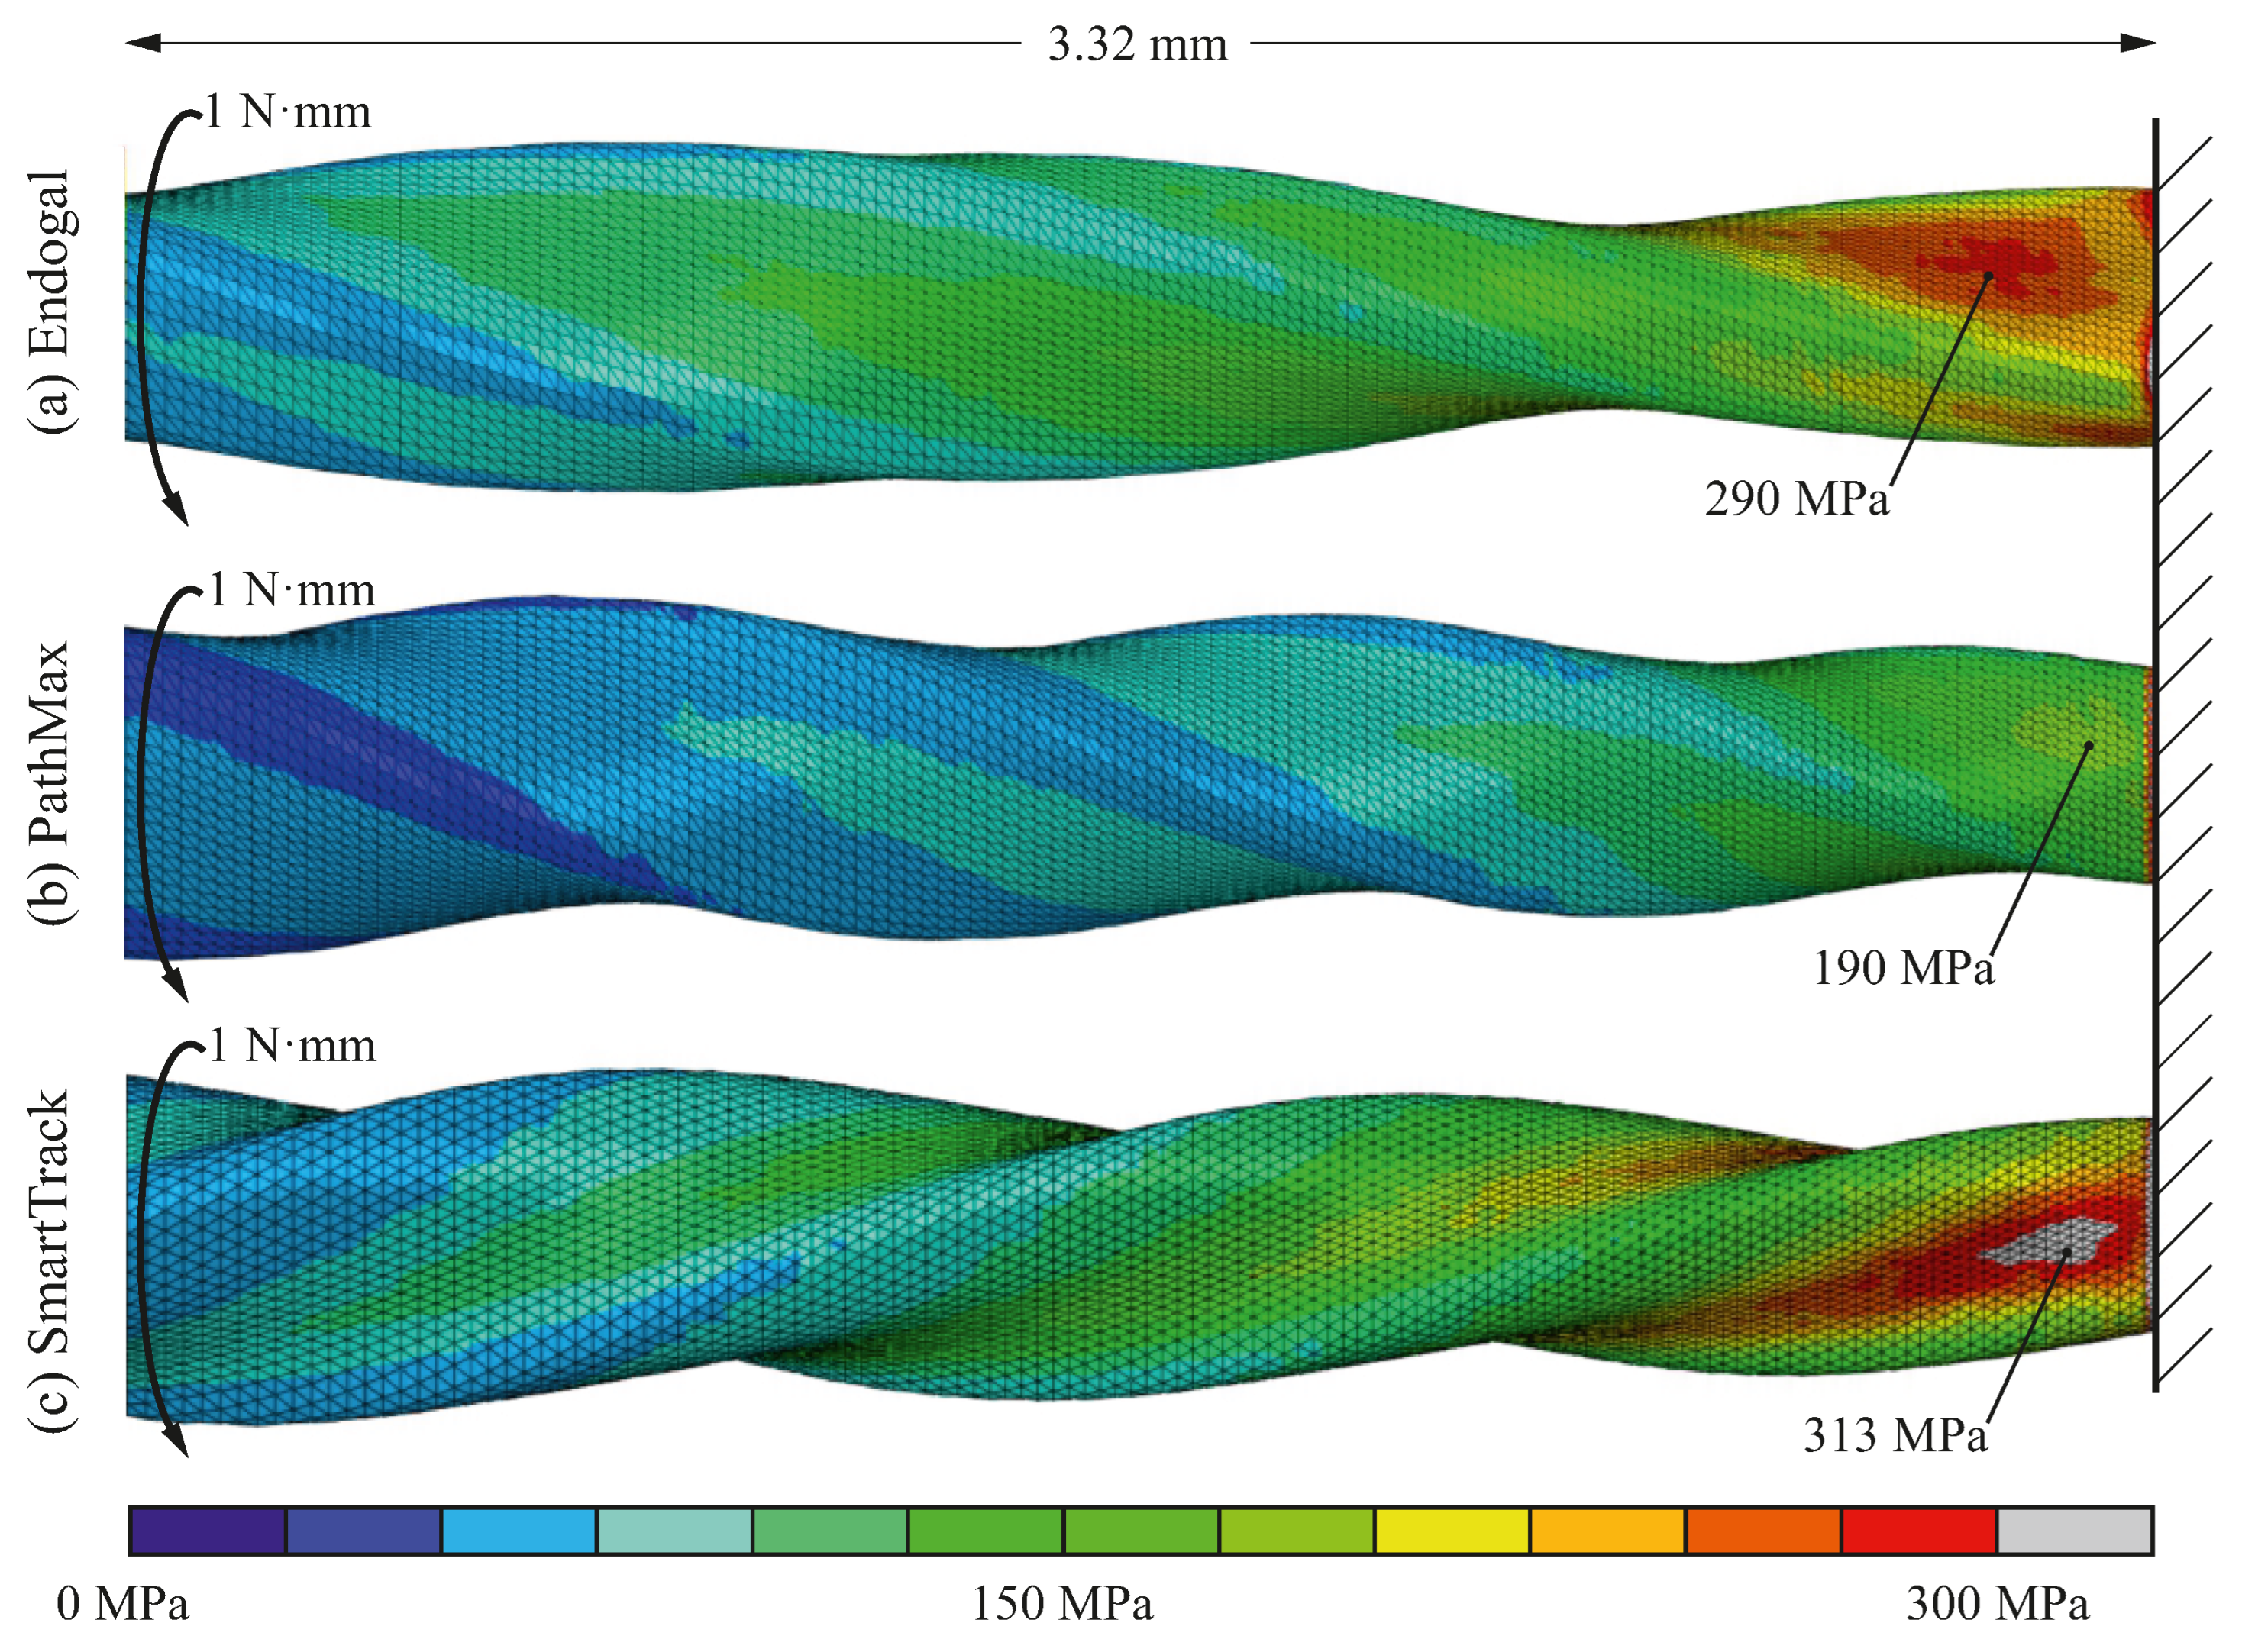
Figure 11 presents details of the von Mises stress distribution for the three endodontic files, focusing on the region near the tip, where the maximum stresses typically occur. Each file is subjected to a torque of
applied at the shaft, while the geometry is clamped
from the tip, replicating the testing conditions defined by ISO 3630-1:2008 [
19] and outlined in [
5]. The results confirm that the finite element meshes derived from the parametric surfaces are smooth, consistent, and regular across all three specimens. This is unlike those generated directly from the original STL files, which frequently display geometric artifacts and meshing irregularities.
3.4. Automated Reversed Engineering to Find the Pitch and the Taper of the Files
Finally, accessing the parametric surface of the file facilitates reverse engineering processes aimed at identifying the original design parameters. Employing the previously obtained function
, it is possible to derive a reliable estimation of the pitch of the files. To estimate the local pitch
in a variable-pitch setting, we employ the following formulation:
where
denotes the angular position (in radians) of a reference flute at axial coordinate
s, and
is the number of flutes. The derivative
represents the local angular rate of change of the flute and allows the computation of the axial length associated with a complete rotation. The appearance of the factor
in the pitch expression is due to the geometric configuration of a multi-fluted helical instrument. For a file with
identical flutes uniformly distributed around the circumference, the angular separation between two consecutive flutes is
radians. This formulation generalizes the classical constant-pitch case and remains valid even when the cross-sectional geometry or flute shape varies along the instrument.
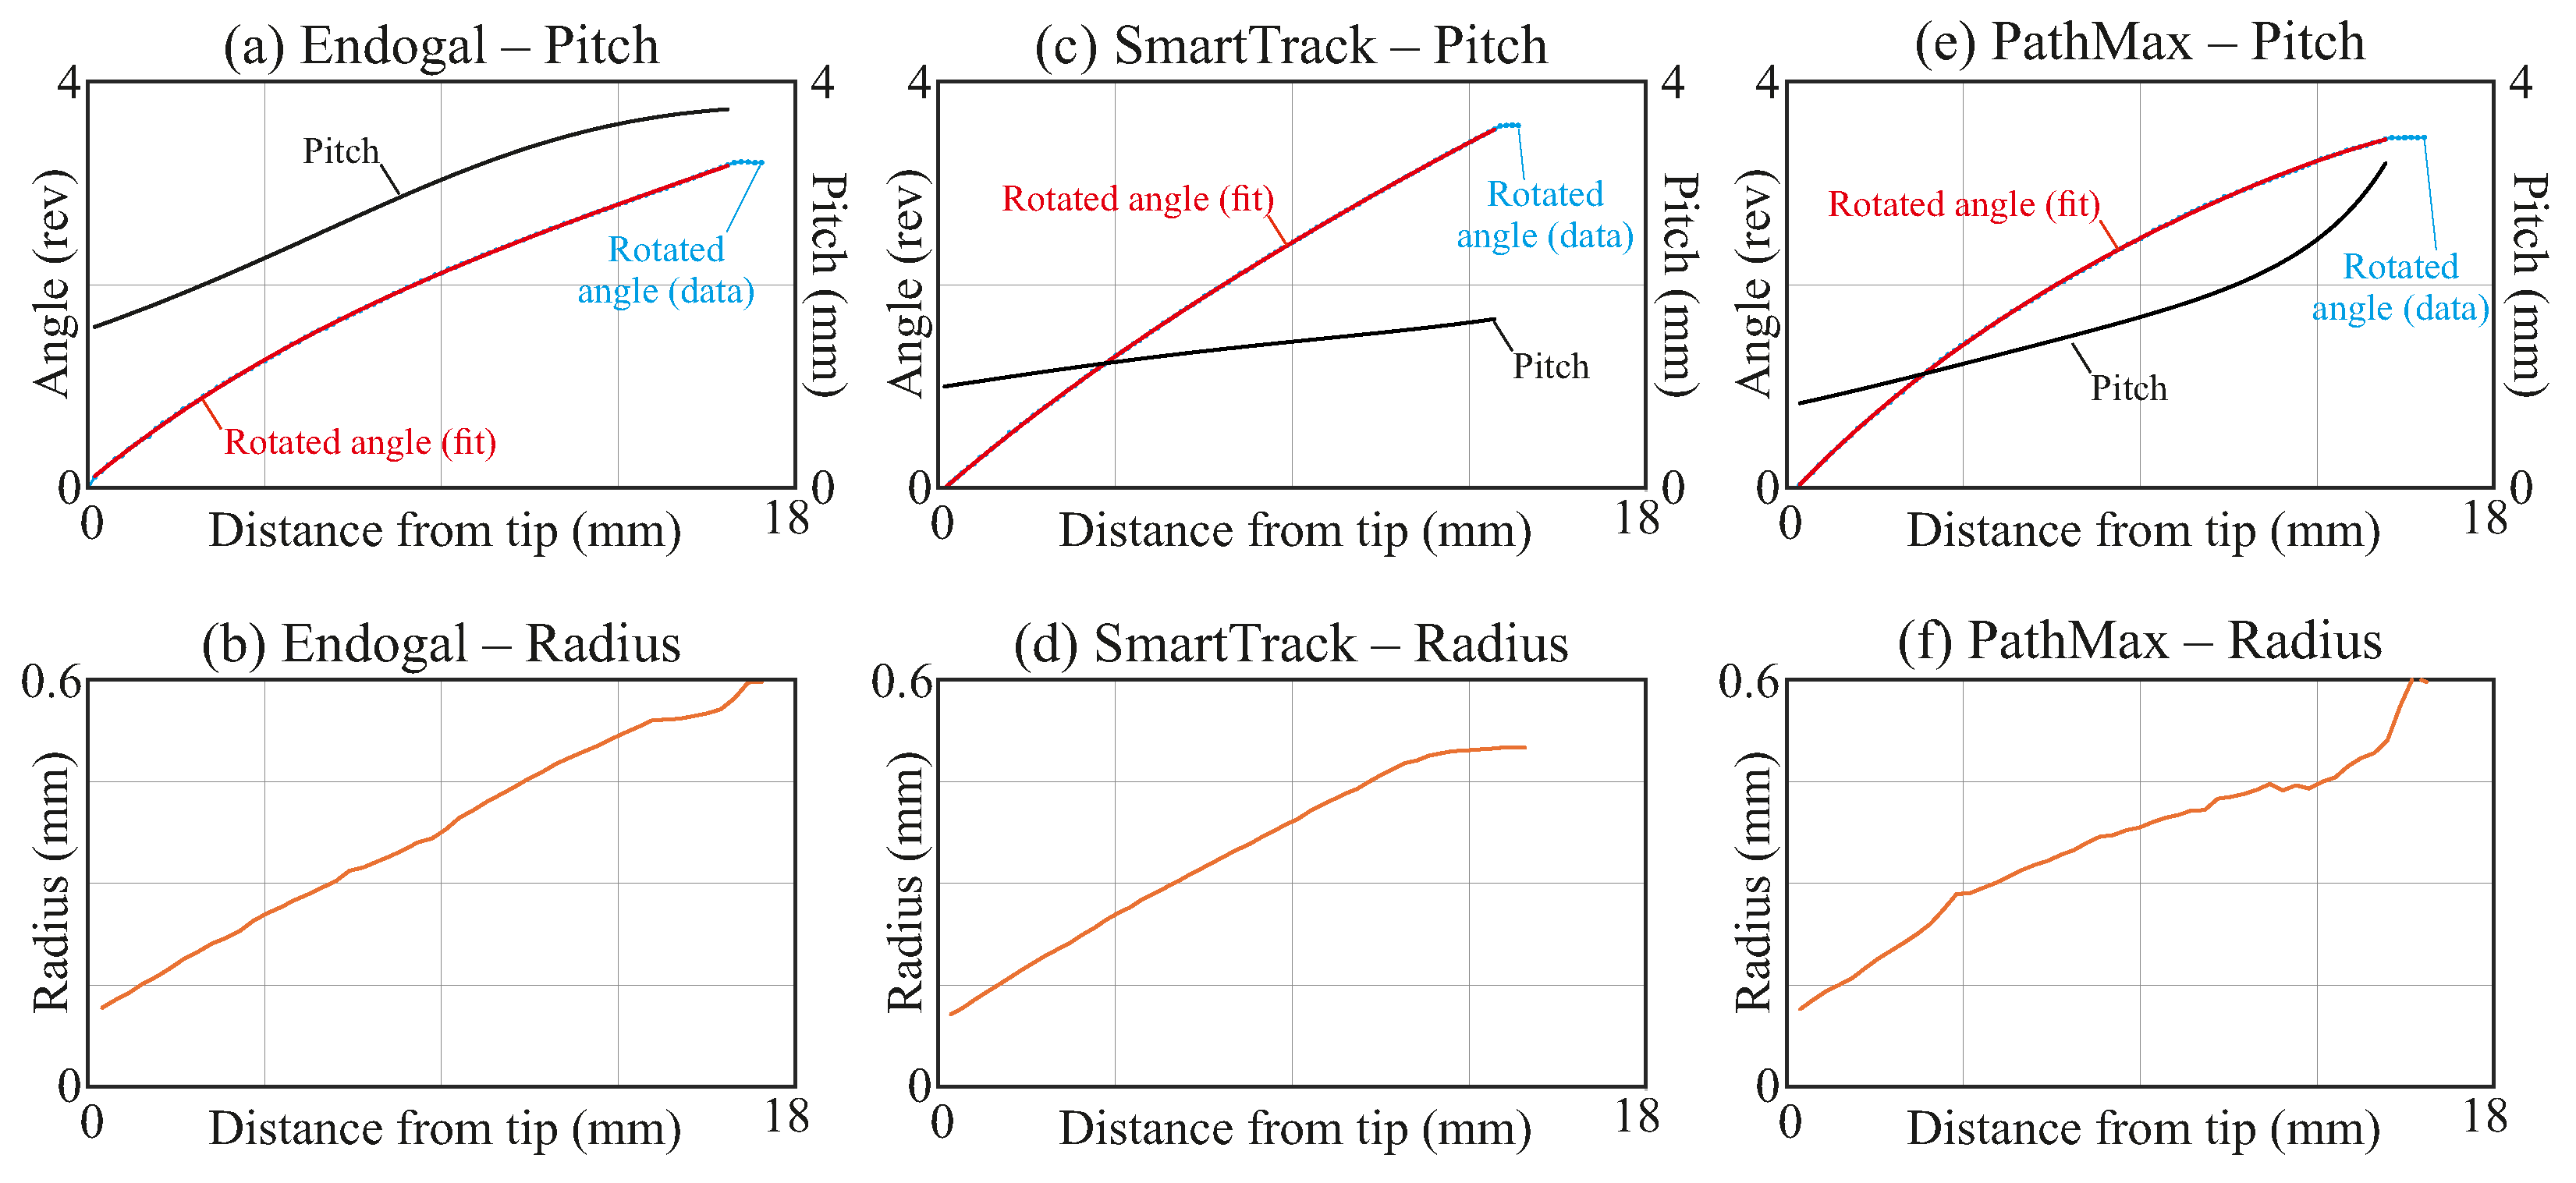
The angular position of a reference flute is determined by identifying, for each cross-section at axial coordinate s, the angular coordinate at which the radial profile attains a local maximum. This extremum corresponds to a well-defined geometric feature of the flute, which is tracked consistently across all sections. By always following the same flute and the same type of geometric feature, a continuous and coherent angular trajectory is obtained. This operation is performed for several equally spaced cross-sections along the instrument’s length. Note that is treated as an unwrapped angular function, increasing continuously beyond radians to reflect the accumulated helical rotation.
For each of the three files analyzed, the resulting values of
were fitted with high accuracy to a fourth-degree polynomial.
Figure 12a,c,e shows the discrete values of
(blue dotted line with markers) together with the fitted fourth-degree polynomial model (solid red curve) for the three files. Points near the tip and the base of the instruments were excluded from the fit. Near the base, flute rotation has not yet initiated, resulting in theoretically infinite pitch; near the tip, the geometry becomes less regular and the angular position
cannot be reliably identified.
The fourth-degree polynomial models fitted to exhibited excellent agreement with the computed data points. The coefficients of determination for each fit were exceptionally high: for PathMax, for SmartTrack, and for Endogal. These values indicate that more than of the variance in the observed angular positions is captured by the polynomial models, confirming the robustness of the fitting procedure. Consequently, the derivative , required to compute the local pitch, can be obtained analytically from the fitted polynomials with high precision and numerical stability.
The corresponding values of the local pitch
, computed from the analytical derivative of the fitted
curve, are also shown in
Figure 12, using a secondary
y-axis. This facilitates the visualization of the flute’s angular progression and its associated pitch along the instrument’s length simultaneously.
An additional advantage of determining the radial function
is that it enables a straightforward estimation of the file’s diameter at each axial position
s. Specifically, for each cross-section, the diameter can be computed simply as twice the maximum value of
, i.e., the radial extent of the file at that section. This information is particularly valuable, as it allows for the characterization of the file’s taper, a key parameter in endodontic file design that influences cutting efficiency and canal shaping behavior. This diameter profile has also been computed in the present study and is depicted in
Figure 12b,d,f for the three files, allowing for direct visualization of the variation in file thickness along its working length.
4. Discussion
Computational reproductions of endodontic file geometries are highly valuable for a variety of applications [
22], including detailed inspections of a geometry to detect manufacturing defects or wear due to use [
23], the generation of finite element models for stress and deformation analysis [
24], and the execution of reverse engineering processes such as identifying the design parameters of files [
13].
There are several methods for generating the computational geometry of endodontic files, ranging from CAD-based parametric designs to micro-CT scans of actual files. CAD models offer flexibility and control over design parameters but may overlook fine details or real-world imperfections. In contrast, micro-CT scans capture highly accurate geometries, including wear and manufacturing defects, but require specialized equipment and may be harder to process for computational use.
Hybrid approaches offer an intermediate solution, obtaining the initial geometry through micro-CT scanning and then using it to create a parametric CAD model. This combines the accuracy of scan-based data with the flexibility of CAD representations. However, these approaches often require extensive post-processing, demanding significant computational resources and expertise in multiple software tools. As noted by Kim [
25] and Bonessio [
12], this process typically involves 3D modeling steps to reduce scan noise and manually refine intricate features such as file tips and sharp edges, making the workflow both time-consuming and technically demanding.
This work presents a set of methodologies that bridge the gap between the point cloud data obtained from micro-CT scans (via STL files) and the automated generation of finite element models. Additionally, it details the automated recognition of design parameters. The proposed methodologies include the reconstruction of the original undeformed geometry of the file from its scanned geometry, which may have undergone bending deformations due to handling, and the creation of a parametric surface representation of the file geometry, replacing the discretized mesh obtained directly from the STL. Issues such as scan noise and surface irregularities are corrected during the generation of the parametric surface, resulting in a cleaner and more accurate representation that is suitable for computational modeling (
Figure 9).
While the process is time-consuming and technically demanding, generating parametric surfaces of endodontic files from STL data has been previously accomplished using specialized software, such as Hexagon VGStudio [
12] and NX I-Deas [
25]. However, even with these tools, the recovery of the file’s original undeformed geometry (accounting for bending or manipulation-induced distortions) is not possible to the extent achieved in this work (
Figure 6).
The method for recovering the file’s original undeformed geometry relies on two basic assumptions: (i) that the torsional deformation of the file is negligible when compared with its bending deformation and overall dimensions, and (ii) that the file’s neutral axis coincides with the centroid of its cross-sections. With respect to the first assumption, even if torsional deformation were present, the original shape of the file could still be recovered; however, the reconstructed model would retain the torsional deformation inherent in the scanned geometry. The second assumption may lead to inaccuracies in the case of off-center endodontic files [
26]. This limitation highlights a potential avenue for future research.
Additionally, general-purpose software such as VGStudio and I-DEAS is powerful for a wide range of applications but can be inefficient when applied to specific problems. In particular, the leveraging of characteristic features of endodontic files, such as their cyclic geometry, has not been optimized. In contrast, the proposed methodology, based on the use of cubic Hermite functions, allows these features to be explicitly considered by enforcing cyclic geometry constraints (
Figure 7 and
Figure 8). A critical benefit of using these curves and imposing cyclic symmetry is that local defects and scan noise are effectively suppressed, resulting in a smoother and more consistent representation of the file. An additional advantage of the proposed approach is that the entire process is automated and does not require specialized skills for handling such software tools.
Nonetheless, parts of the process still require some human intervention: selecting a point
in the shaft region of the file, choosing the number of knots for the Hermite curve interpolation, and specifying the parameters for generating the finite element model (e.g., mesh density, material properties). The selection of the number of knots in the Hermite curve interpolation is particularly important for balancing accuracy and smoothness; having too few knots oversimplifies the geometry, while having too many causes overfitting and sensitivity to noise, which is especially problematic in CT scan data. By selecting the appropriate number of knots, the file’s representation can be improved compared with the original STL (
Figure 9). Special attention must be paid to files with cross-sections that feature a sharp edge, since the
continuity imposed during the minimization for knot determination should be removed to reproduce such edges accurately.
The quality of the reconstructed endodontic surfaces, represented by sets of triangular facets, is higher than that of the original STL files (
Figure 10). Notably, this improvement is achieved with a smaller number of triangular facets, as the proposed method facilitates the adaptation of element density according to the user’s requirements. Ensuring the high quality of this set of triangular facets is essential, as the quality of the tetrahedral finite element mesh generated by constrained Delaunay tetrahedralization strongly depends on that of the initial surface mesh [
27,
28].
Endodontic files with parametric surfaces are particularly useful for discretizing their geometry into finite elements. The availability of a parametric surface enables the generation of finite element models that are free from various errors, such as deformations and noise. Additionally, it allows for localized mesh refinement without being constrained by the original STL triangle mesh, unlike restricted Delaunay triangulations. Regenerating the triangle mesh from the parametric surface results in more accurate geometric models, with greater computational efficiency, and ensures mesh topology consistency between different experiments. This can be observed in
Figure 11, where the von Mises stress results are presented for the three endodontic files.
Although assessing the strength of these files is outside the scope of this work, these figures demonstrate important differences in the maximum von Mises stress produced in the endodontic files under torsional testing. These maximum von Mises stresses range from in the PathMax file to in the SmartTrack file.
An additional feature of the files’ reconstructed parametric surfaces is that they enable us to conduct reverse engineering analyses to determine essential design parameters such as the pitch [
29] or the taper [
30]. Other studies [
13] estimated the variable pitch by discretely measuring the axial distance between homologous points on consecutive flutes, relying on the identification of corresponding geometric features across successive cross-sections. While this approach provides a direct geometric interpretation of pitch, it has several limitations: it is sensitive to noise or ambiguity in identifying homologous points, requires precise spatial alignment, and produces inherently discrete results that, necessarily, lack smoothness or continuity.
In contrast, as demonstrated in
Figure 12, the methodology proposed in the present work estimates the local pitch based on the estimated angular trajectory
of a reference flute. This approach offers several advantages: it provides a smooth and differentiable representation of pitch along the instrument, reduces sensitivity to local measurement noise, and enables the computation of pitch at any point along the file in a continuous manner. Furthermore, by relying on the radial function
extracted from high-resolution cross-sectional data, the method ensures consistency and repeatability across the entire file length.
The analyzed geometric parameters (pitch and taper) are not only mathematically and mechanically relevant but also carry significant clinical implications, particularly regarding instrument fatigue resistance, dentin preservation, and long-term treatment outcomes. In terms of pitch, a shorter pitch length has been associated with a more uniform stress distribution along the instrument’s cutting flutes, which, in turn, enhances cyclic fatigue resistance and reduces the likelihood of unexpected fractures [
5,
31]. Conversely, instruments with a longer pitch may exhibit improved debris removal but can experience higher localized stresses, which compromise their mechanical durability [
5].
Evidence suggests that greater taper values improve canal shaping and facilitate the removal of infected dentin, thereby enhancing disinfection efficacy [
32,
33]. However, this comes at the expense of increased dentin removal and a higher risk of microcrack propagation in root dentin under cyclic loading, which may predispose the tooth to vertical root fracture [
31,
32]. Interestingly, some studies suggest that an increased taper does not necessarily translate into superior antimicrobial outcomes, particularly when disinfection relies on advanced adjunctive methods such as photodynamic therapy [
34]. From a clinical perspective, this underlines the importance of balancing taper enlargement with dentin preservation, as excessive dentin removal could jeopardize the long-term prognosis of the tooth [
32,
35].
5. Conclusions
This work presents a robust and automated methodology to reconstruct, parameterize, and analyze the geometry of endodontic files from micro-CT scan data. By addressing the limitations inherent in scan-based and CAD-based approaches, the proposed methodology enables the accurate recovery of undeformed geometry, the construction of smooth and editable parametric surfaces, and the efficient generation of high-quality finite element models.
The method represents a significant advance in endodontic file modeling due to the following:
It corrects bending deformations introduced during scanning;
It reduces surface noise and mesh irregularities;
It allows analytical control over mesh density and quality;
It enables precise extraction of key geometric features such as pitch and taper.
This study used case studies from three commercial file systems (Endogal, PathMax, and SmartTrack) to validate the effectiveness of the approach. The recovered geometries and parametric representations closely match the intended file shapes while offering additional flexibility for reverse engineering and simulation. In particular, we observed that the proposed methodology yields triangular meshes of higher quality than those directly extracted from the original STL files, which, in turn, ensures the generation of finite element meshes of improved quality.
Furthermore, by leveraging cubic Hermite interpolation and exploiting cyclic symmetry, the methodology achieves smoother, more accurate surface reconstructions than those obtained directly from STL files. The process also permits the derivation of continuous and differentiable functions for pitch and radius, which enhances the characterization and comparison of instrument designs.
Overall, this study bridges the gap between CT-based scanning and computational design, providing a powerful framework for both manufacturers and researchers involved in endodontic instrument analysis, optimization, and development.
