Abstract
Image datasets with imbalanced sampling, masking, missing and noise brought challenges to the development of an intelligent agricultural monitoring system. To tackle these issues, this paper proposes a cloud-based, multi-model integrated intelligent monitoring vision platform for agricultural greenhouse crops (named the CloudCropFuture platform), complete with algorithmic APIs, facilitating streamlined data-driven decision-making. For the CloudCropFuture platform, we first propose an image augmentation technology that employs an improved diffusion model to rectify deficiencies in image data, thereby enhancing the accuracy of agricultural image analysis. Experimental results demonstrate that on datasets enhanced by this method, the average precision of multiple YOLO models is improved by 5.6%. Then, a multi-level growth monitoring platform is introduced, integrating enhanced YOLOv11-based image models for more accurate and efficient crop observation. Furthermore, an intelligent model base comprising multiple integrated detection methods is established for assessing agricultural pests, maturity, and quality, leveraging the enhanced performance of vision models. CloudCropFuture offers a holistic solution for intelligent monitoring in agricultural greenhouses throughout the entire crop growth cycle. Through model verification and application across various greenhouse crops, this work has demonstrated the ability of the intelligent platform to provide reliable and stable monitoring performance. This research paves the way for the future development of agricultural technologies that can adapt to the dynamic and challenging conditions of modern farming practices.
1. Introduction
Advanced information technologies have ushered agricultural greenhouse monitoring into the big data era [1]. Artificial Intelligence (AI) has emerged as a key driver of transformation in agriculture, enhancing yields, optimizing resources, and streamlining practices over the past decades [2,3]. Techniques like machine learning, computer vision, and robotics enable soil health monitoring, weather prediction, and automated harvesting [4], while AI-driven systems support early pest/disease detection to minimize crop loss [5]. Despite its potential, AI adoption faces challenges, including data quality issues, infrastructure gaps, and ethical considerations [6], requiring continued research to build resilient agricultural systems.
Computer vision (CV), a core AI subset, has become integral to intelligent agriculture [7]. It revolutionizes pest/disease detection, fruit ripeness assessment, and crop quality evaluation by analyzing real-time images from sensors or drones [8]. For example, deep learning models detect leaf diseases to enable precise pesticide use [9], while CV-based ripeness assessment optimizes harvesting times [10]. Postharvest, AI-driven quality control systems grade produce to ensure market quality, promoting sustainability by reducing resource waste.
Among CV technologies, the YOLO algorithm stands out in smart agriculture for its real-time object detection capabilities [11]. It supports pest/disease detection for early intervention [12], crop maturity assessment to reduce waste [13], and quality grading for market readiness [14]. Its speed and accuracy make it suitable for large-scale operations where timely decisions are critical.
Despite these advancements, YOLO models face challenges and limitations in real-world greenhouse environments. High-quality annotated training data is costly and labor-intensive to acquire [15]. Performance is hindered by variable lighting, complex backgrounds, and plant diversity, while computational demands challenge resource-constrained agricultural settings [16]. Greenhouse-specific issues like occlusion, small pests, and poor image quality further reduce generalization of existing vision systems.
Due to the problems of image acquisition technology in agricultural scenes, image augmentation technology has been widely used in the field of intelligent agricultural visual monitoring in recent years [17]. It plays a crucial role in smart agriculture by improving the quality of visual data captured in the field, which is essential for accurate analysis and decision-making. Advanced algorithms like YOLOv11, a state-of-the-art object detection model, have been integrated with image enhancement techniques to address challenges such as low-light conditions, shadows, and occlusions that commonly affect image quality in agricultural settings [18]. Meanwhile, the application of diffusion models in image augmentation for agricultural visual detection has been a topic of extensive research [19]. They have been employed to improve the detection of pests and diseases, assess crop maturity, and conduct quality inspections of agricultural products. For instance, the YOLO-FT detection algorithm has been introduced to enhance pollination through object detection technology, demonstrating significant improvements in model complexity and performance [20]. However, the integration of diffusion models in image enhancement for agricultural visual detection is facing issues: computational complexity, the need for large datasets for training, and the variability of agricultural environments present significant hurdles [21]. In agricultural production, crop growth monitoring demands extreme time sensitivity, necessitating that object detection models achieve accurate identification of crop status within minimal timeframes. Concurrently, model size directly correlates with storage and computational resource consumption on edge devices and mobile platforms, where such resources are inherently constrained. Excessively large model scales may result in reduced detection efficiency, thereby compromising the real-time responsiveness of monitoring and analysis systems. Consequently, the selection of object detection models must carefully balance considerations of lightweight design and real-time performance.
Furthermore, although lightweight detection models are specifically designed for efficiency to accommodate edge deployment, they frequently underperform in the complex scenarios encountered in greenhouses [22]. These environments are characterized by three key challenges: small targets (such as tiny insects measuring just a few millimeters), dense occlusion from intertwined plant structures where leaves and stems overlap to form complex visual barriers [23], and significant variation across different crop types and growth stages. Compounding these challenges, many proposed models are trained and validated on idealized datasets captured in laboratory conditions, where lighting is carefully controlled, backgrounds are simplified to solid colors, and targets are presented in optimal viewing conditions. This practice severely limits their generalization capability in practical greenhouse applications where environmental conditions are far more variable and unpredictable [24].
Notably, existing related systems in the field of agricultural monitoring exhibit limitations when addressing greenhouse-specific challenges. For instance, some early platforms prioritize environmental parameter sensing. They monitor factors like temperature, humidity, and CO2 levels through IoT devices, while lacking deep integration with advanced visual detection models [25]. These systems can provide detailed data on greenhouse climate conditions but fail to connect this information with actual crop health status. This disconnect prevents them from providing actionable insights into how environmental factors affect plant conditions, leaving a critical gap between environmental data and crop condition analysis that hinders informed decision-making.
Other specialized systems suffer from narrow functional scope, concentrating solely on single-task applications that address only one aspect of crop monitoring. For example, Wang et al. [26] proposed an improved YOLOv8 algorithm specifically designed for detecting vegetable diseases in greenhouse plant environments. While this model performs exceptionally well in identifying vegetable diseases, its functionality is limited to disease detection and it cannot simultaneously monitor the growth conditions of other crops. Similarly, Xiao et al. [15] focused their research on using the YOLOv8 model to identify fruit ripeness, with a primary emphasis on accurately determining fruit ripeness. However, the study did not address other factors such as pests and diseases that may impact crop yield and quality. Additionally, the GFS-YOLO11 model developed by Wei et al. [18] can effectively detect the maturity of multiple tomato varieties, but its application scope is also primarily limited to the specific task of maturity detection. These studies indicate that while these specialized systems have achieved results in their respective fields, their functional scope is relatively narrow, optimized, and applied for single tasks, and therefore unable to meet the comprehensive monitoring needs of modern agricultural production. The limitations of single-task applications mean that these systems have certain limitations in practical applications, being unable to provide comprehensive and integrated monitoring solutions for agricultural production, thereby affecting the comprehensiveness and accuracy of agricultural production decisions. Therefore, developing systems with a broader functional scope that can simultaneously address multiple aspects of crop monitoring is of great significance for improving agricultural production efficiency and crop quality.
Aiming at the above shortcomings, this paper utilizes an improved diffusion model for image enhancement, thereby providing an effective solution to address the issue of low-quality crop image data and enhance the accuracy of subsequent visual analysis tasks. Furthermore, we propose intelligent agricultural growth monitoring models based on enhanced YOLOv11 variants specifically optimized for complex greenhouse scenarios, which can solve the problem of intelligent monitoring of agricultural greenhouses from the perspective of the whole life cycle of crop growth. The methods and models proposed in this paper are integrated into the cloud-based intelligent model base, and the intelligent control and analysis data intelligence platform (named the CloudCropFuture) for agricultural greenhouses is developed. The contributions of this work can be summarized as follows:
- (1)
- An image augmentation technology with an improved diffusion model is proposed to alleviate the defects of image data such as noise and low resolution.
- (2)
- A set of enhanced YOLOv11-based CV performance-boosting models is proposed for monitoring the pests, maturity, and quality of multiple agricultural greenhouse crops.
- (3)
- A cloud-based platform (CloudCropFuture) is proposed, integrating multi-model Application Programming Interfaces (APIs) and three functional subsystems for comprehensive and intelligent crop monitoring.
- (4)
- Extensive experiments on multiple greenhouse crops enable optimal model selection based on accuracy, speed, or other specific needs.
The rest of the article structure is arranged as follows: First, the related preliminary information about the utilized algorithms is briefly introduced in Section 2.1. Then, the introduction of the proposed intelligent monitoring system for agricultural greenhouses is described in Section 2.2. Next, the enhanced diffusion model and visual performance-boosted YOLO models are proposed for agricultural pest-, maturity-, and quality-monitoring tasks. In Section 3, extensive experiments are performed to comprehensively evaluate the performance of the models in the intelligent model base. Finally, the conclusions and future work are presented.
2. Materials and Methods
2.1. Preliminaries
2.1.1. Diffusion Models
Diffusion models are a class of probabilistic generative models based on Markov chains [27]. These models simulate the diffusion process of data distribution to accomplish the generation of high-quality data from noisy data. A diffusion model consists of two distinct processes: the forward diffusion process and the reverse generation process.
- (1)
- Forward Diffusion Process
The forward diffusion process can be represented as a Markov chain that gradually adds noise to the data, causing the data to progressively deviate from the original distribution. Specifically, let denote the original data and represent the data after steps of noise addition. The transition probability from to is denoted as . The forward diffusion process can be formulated as:
where is the total number of diffusion steps, represents the noise scale at step , and denotes the identity matrix [27]. The Markovian property ensures that the state of each step depends solely on the previous state.
- (2)
- Reverse Generation Process
The reverse generation process aims to recover high-quality data from noisy data . This process is typically implemented using a neural network, denoted as . The objective of the denoising process is to minimize the following loss function:
where is the denoising network, and represents the network parameters [28].
2.1.2. The Related Work Regarding YOLO Models
This article aims to investigate the advanced nature of the YOLO object detection algorithm in the field of deep learning and its broad applicability across various agricultural scenarios. Since its first release, YOLO has gone through several iterations [29]. Each version of the YOLO model comes in different variants, each of which has been meticulously designed to meet specific performance and efficiency requirements [30]. Taking YOLOv8 as an example, this detector encompasses five distinct model scales: YOLOv8n (nano), YOLOv8s (small), YOLOv8m (medium), YOLOv8l (large), and YOLOv8x (extra-large). These different versions cater to various requirements and allow users to choose the one that best suits their specific needs [31].
For the task of crop recognition and detection, this study selected lightweight models including YOLOv5n, YOLOv8n, YOLOv9-t, YOLOv10n, and YOLOv11n for in depth research and application. These models maintain high detection accuracy while featuring compact architectures, fast detection speeds, and excellent real-time performance. Detailed analyses are as follows:
- (1)
- YOLOv5n [32]: With its lightweight architecture and rapid detection capabilities, YOLOv5n is ideal for real-time monitoring on devices with limited computational resources. The robustness under variable lighting and complex backgrounds makes it suitable for agricultural fields.
- (2)
- YOLOv8n [33]: Building upon its predecessor, this model enhances detection performance through optimized network structures. It achieves a balance between accuracy and efficiency, making it effective for scenarios requiring both speed and precision in crop health assessment.
- (3)
- YOLOv9-t [34]: Specifically tailored for mobile devices, it reduces model complexity while preserving detection accuracy. Innovations like the C3Ghost module and lightweight feature fusion techniques improve computational efficiency, enabling edge-device deployment in agriculture.
- (4)
- YOLOv10n [35] and YOLOv11n [36]: As the most recent version in the series, they incorporate advanced technologies such as multi-scale training, task-aligned loss functions, and streamlined architectures. They achieve state-of-the-art speed–accuracy trade-offs, introducing unified multi-task processing through minimal code modifications, significantly enhancing adaptability for large-scale farmland monitoring.
Through comparative analysis of these models’ performance in crop recognition tasks, this research aims to provide high-efficiency, real-time monitoring solutions for agricultural production, thereby advancing the development of agricultural intelligence.
2.1.3. The YOLOv11 Models
YOLOv11 [36], released by Ultralytics Inc. (London, UK) as the latest iteration in their YOLO series (e.g., YOLOv8), has garnered significant attention in the field of object detection for its remarkable accuracy and efficient processing speed. This model inherits and optimizes the architecture of its predecessors within the Ultralytics ecosystem by introducing a series of innovations. These include the C3k2 (Cross Stage Partial with kernel size 2) block, SPPF (Spatial Pyramid Pooling—Fast), and C2PSA (Convolutional block with Parallel Spatial Attention) components, which contribute to improving the model’s performance in several ways, such as enhanced feature extraction [37].
As shown in Figure 1, the YOLOv11 architecture consists of three main parts, i.e., the Backbone, Neck, and Head. In the Backbone, the C3k2 module replaces a single large convolution with two small ones for more efficient feature fusion. The SPPF mechanism enhances multi-scale feature capture through fast spatial pyramid pooling. The C2PSA component introduces spatial attention, improving the detection of complex or occluded objects by focusing on key image areas. In the Neck, the C3k2 module further refines multi-scale feature fusion via upsampling and feature map concatenation. In the Head, multiple C3k2 modules process multi-scale features at different depths. After convolution, batch normalization, and activation function processing, the Head outputs bounding box coordinates, objectness scores, and class scores [37].
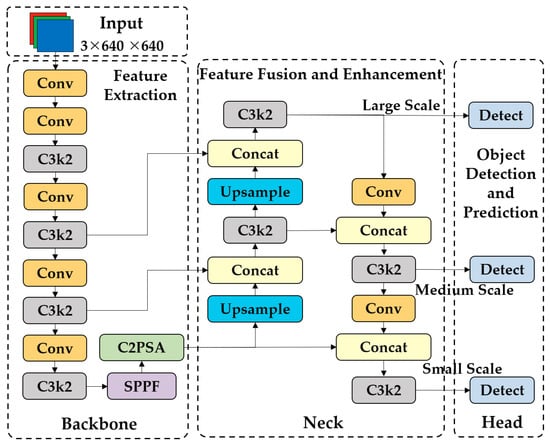
Figure 1.
The structure of the YOLOv11 network.
In terms of performance, YOLOv11 demonstrates substantial improvements over its predecessors. According to benchmark tests on the COCO dataset, YOLOv11 achieves higher mean average precision (mAP) while maintaining faster inference speeds compared to earlier versions. As a derivative variant, YOLOv11n adopts a streamlined architecture and optimized parameter configurations, significantly reducing model complexity while retaining high detection accuracy [37]. Therefore, it is suitable for real-time applications requiring rapid processing.
2.2. Intelligent Monitoring Platform for the Agricultural Greenhouse (CloudCropFuture)
In this section, we present a comprehensive overview of the proposed CloudCropFuture platform, which collectively forms an efficient and intelligent agricultural management system designed to advance agricultural technology development and application. As shown in Figure 2, the overall architecture of the platform integrates a multi-layer design and diverse hardware devices, achieving intelligent agricultural management. It contains three core subsystems, i.e., the Growth Environment Data Acquisition and Monitoring System, the Intelligent Control System of Greenhouse, and the Crop Growth Intelligence Analysis System.
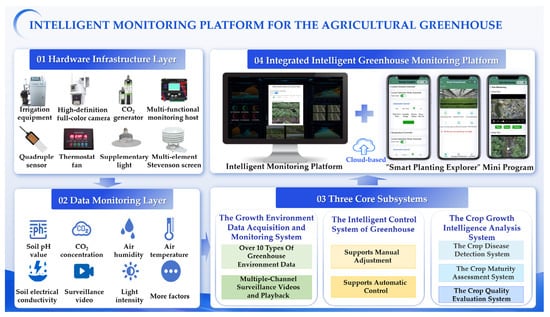
Figure 2.
Overall architecture of the CloudCropFuture platform.
First, the Growth Environment Data Acquisition and Monitoring System serves as the foundation of the platform. It employs a sensor network deployed across farmland to collect real-time critical environmental parameters, including soil moisture, temperature, light intensity, and air quality. Processed data provides precise environmental insights for agricultural production, enabling farmers to better understand crop growth conditions and make data-driven cultivation decisions. This subsystem ensures reliable data support for subsequent intelligent control and analysis, enhancing the precision and efficiency of agricultural operations.
Second, the Intelligent Control System of Greenhouse acts as the operational unit of the platform. Leveraging data from the monitoring system, it automates greenhouse environmental regulation through devices such as smart vents and CO2 injectors. Key functionalities include dynamic adjustment of light intensity and CO2 concentration to maintain optimal growth conditions. It reduces labor costs while improving crop yield and quality through enhanced automation.
Third, the Crop Growth Intelligence Analysis System denotes the innovation highlights of the proposed platform. It comprises three AI analyzing modules: the Crop Disease Detection System, the Crop Maturity Assessment System, and the Crop Quality Evaluation System. Powered by pre-trained YOLO object detection model APIs, this subsystem demonstrates compatibility with diverse models to meet varying real-time requirements, support lightweight deployment, and ensure analytical accuracy. Through advanced analysis of crop morphological features, it precisely evaluates disease severity, maturity stages, and quality grades, delivering scientific decision-making for agricultural production. The three subsystems are introduced one by one below.
2.2.1. The Growth Environment Data Acquisition and Monitoring System
Due to increasingly severe global climate change and ecological environment issues, as well as the sensitivity and dependence of traditional agricultural production methods to environmental changes, the application of crop growth environmental data collection and monitoring systems has become increasingly crucial. For instance, in traditional agricultural practices, farmers primarily rely on sensory experience to analyze growing environments. This approach often leads to crop growth limitations caused by imprecise crop growth environmental assessments, thereby affecting yield and quality. Therefore, precise environmental data collection and real-time monitoring have become key to improving agricultural production efficiency and quality.
The Growth Environment Data Acquisition and Monitoring System integrates various high-precision sensors, HD full-color surveillance cameras, and other hardware equipment to achieve real-time monitoring and accurate assessment of agricultural production environments, shown in Figure 3. The system can monitor multiple critical environmental parameters including air temperature/humidity, soil conditions, and light intensity, among others. It demonstrates several notable advantages:
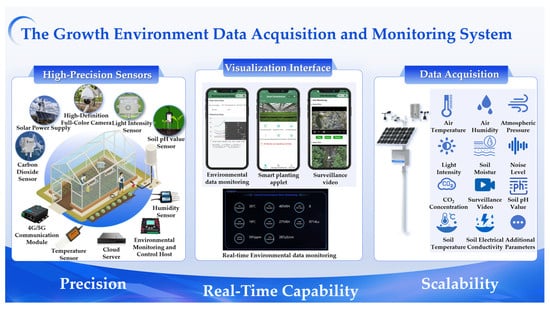
Figure 3.
The Growth Environment Data Acquisition and Monitoring System.
- (1)
- High precision: Equipped with high-accuracy sensors, the system precisely captures environmental data, effectively avoiding errors caused by subjective judgments, thereby providing scientific data support for crop growth.
- (2)
- Real-time capability: The system enables continuous environmental monitoring, ensuring immediate access to disturbances. This allows users to promptly adjust cultivation strategies, maintaining optimal growing conditions for crops.
- (3)
- Scalability: The system supports flexible integration of additional monitoring devices to detect diverse environmental parameters without limitations, meeting the needs of various agricultural scenarios.
Through dedicated platforms or mini-programs, users can conveniently access real-time environmental data, simplifying farm management, reducing labor costs, and enhancing production efficiency. Furthermore, the application of such systems promotes the transformation of agriculture toward intelligent and precision-oriented practices, strengthens overall agricultural competitiveness, and provides robust technical support to address climate change and ecological challenges.
2.2.2. The Intelligent Control System of Greenhouse
The high reliance on manual labor in traditional agricultural production coupled with low efficiency and difficulties in achieving precise control mean that the modernization of agricultural practices has been constrained to some extent. Therefore, the application of intelligent greenhouse control systems is becoming critically important.
The Intelligent Control System of Greenhouse, based on IoT technology, utilizes environmental monitoring hosts and cloud platforms as core control units, and its framework is shown in Figure 4. By integrating actuators such as supplemental lights, CO2 generators, curtain ventilators, and irrigation equipment, it achieves precise regulation of key environmental parameters like light intensity and CO2 concentration within greenhouses.
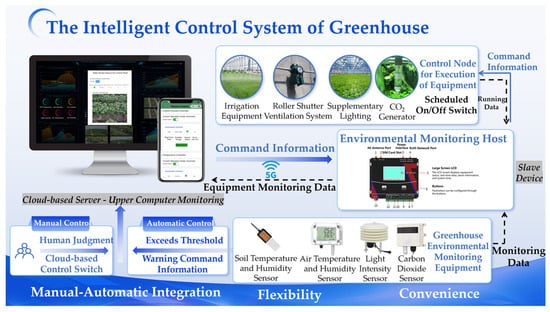
Figure 4.
The Intelligent Control System of Greenhouse.
The system combines manual and automatic control modes, offering users flexible operational options. In automatic control mode, the cloud platform analyzes real-time data (e.g., light intensity, CO2 levels) collected by the greenhouse environmental monitoring system. When parameters exceed preset thresholds, the system immediately sends commands to activate devices like supplemental lights and CO2 generators to maintain environmental equilibrium. This automatic response mechanism ensures continuous optimization of greenhouse conditions while minimizing human intervention. In manual control mode, users can adjust equipment in real time via mobile apps or web interfaces based on their experience and judgment. This approach provides greater autonomy, allowing tailored adjustments to meet specific crop requirements.
2.2.3. The Crop Growth Intelligence Analysis System
Under traditional agricultural production models, farmers primarily rely on personal experience to assess crop diseases, maturity, and quality. However, this approach is prone to misjudgments, leading to inadequate disease control, improper harvesting, and quality declines. As modern agriculture moves toward scale and efficiency, there is a growing need for precise, real-time monitoring of crop growth. Consequently, the presented platform has developed an intelligent monitoring and analysis system for crop growth based on YOLO-based models. This system transforms traditional monitoring by integrating advanced image recognition models to achieve comprehensive digital perception and intelligent diagnosis of crop physiological and pest/disease conditions.
The system consists of three modules: the Crop Disease Detection System, the Crop Maturity Assessment System, and the Crop Quality Evaluation System. As illustrated in the workflow of Figure 5, users can upload crop images through the platform or extract image frames from surveillance videos (Input Layer). In the Processing Layer, the system calls on a pre-trained object detection model (YOLO-based) API. The model integration functions as follows: The pre-trained YOLO-based models are encapsulated as a callable API and deployed in the Processing Layer. When the system receives input images, it triggers this API. The API then uses the integrated pre-trained model to analyze the images. After analysis, the model generates image recognition results. These results are further matched with the knowledge base in the Processing Layer. Finally, in the Output Layer, the system feeds back image detection results (with visualized markings, e.g., bounding boxes on crops in images) and corresponding suggestions to the user through the platform.
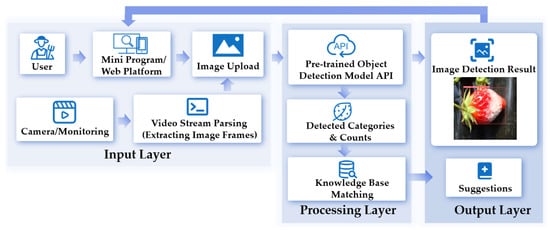
Figure 5.
The workflow of the Crop Growth Intelligence Analysis System.
The pre-trained object detection model API serves as a core interface, enabling the selection of the most suitable models from an intelligent model base according to user requirements for real-time performance and accuracy. This ensures efficient and precise crop image detection. The intelligent model base incorporates multiple state-of-the-art object detection models, including YOLOv5n, YOLOv8n, YOLOv9-t, YOLOv10n, YOLOv11n, and the enhanced YOLOv11n models, each with distinctive features in detection accuracy and speed. These models cater to diverse needs, such as real-time performance, lightweight deployment, and high-precision analysis.
- (1)
- The Crop Disease Detection System
Traditional disease monitoring relies on farmers’ experience, leading to subjective misjudgments or delayed detection due to limited professional knowledge. This often results in unchecked disease spread, causing yield losses, quality degradation, and economic impacts. To address this challenge, a Crop Disease Detection System is developed. The system utilizes a trained object detection model API to perform real-time analysis on image frames extracted from surveillance video streams, providing precise disease detection results and targeted prevention recommendations. Simultaneously, users can upload crop images through the platform or mini-programs, where the system analyzes and feeds back disease conditions, offering convenient and professional diagnostic services.
- (2)
- The Crop Maturity Assessment System
Accurate maturity assessment is critical for optimizing harvest timing, crop quality, and economic returns. Traditional methods, which depend on subjective visual judgment, are inefficient, costly, and often inaccurate. These limitations frequently result in premature or delayed harvesting, thereby reducing market value. To tackle these issues, we have developed a Crop Maturity Detection System that integrates trained object detection model APIs. This system enables real-time detection and analysis of crop maturity conditions, providing farmers with data-driven scientific harvesting guidance.
- (3)
- The Crop Quality Evaluation System
The quality of crops directly impacts the market competitiveness of agricultural products, consumer acceptance, and economic returns. Traditional quality detection methods primarily rely on manual experience and intuitive judgment, which suffer from limitations such as low efficiency, high costs, and insufficient accuracy. These methods often fail to provide objective and precise assessments of crop quality, leading to inconsistencies in quality control and instability in agricultural markets. Additionally, the inefficiency of traditional methods in detecting large-scale samples restricts the expansion of agricultural production and the improvement of quality control technologies. Therefore, a Crop Quality Evaluation System is developed in this project that leverages trained object detection model APIs to analyze crop quality characteristics in real time. It provides scientific criteria for agricultural product classification and quality grading.
2.2.4. Platform’s Main Functional Architecture
As illustrated in Figure 6, the platform integrates three core subsystems to deliver a comprehensive suite of functionalities. Data and On-Site Monitoring facilitates both real-time data acquisition and historical data analysis. It also enables real-time monitoring of site conditions, with the capability to play back recorded monitoring data as needed.
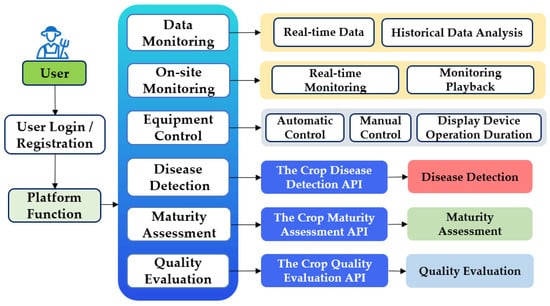
Figure 6.
Platform’s main functional architecture.
The Intelligent Control subsystem provides integrated equipment control capabilities, including automatic control for efficient and standardized operations, and manual control offering flexibility to handle specific situations. Furthermore, this subsystem displays device usage time to assist in maintenance and utilization management.
The Crop Growth Intelligence Analysis (leveraging intelligent model base) subsystem embeds a powerful intelligent model base. This base incorporates cutting-edge object detection models such as YOLOv5n, YOLOv8n, YOLOv9-t, YOLOv10n, YOLOv11n, and enhanced variants of YOLOv11n. Each of these models has unique characteristics in terms of detection accuracy and speed. Based on this model base, the platform implements three key analytical functions through algorithmic APIs: disease detection, maturity assessment, and quality evaluation.
Specifically, for integrating the trained models into the platform, the trained object detection models, which are developed using datasets customized for specific crop types and application needs, are packaged into algorithmic APIs (namely the Crop Disease Detection API, the Crop Maturity Assessment API, and the Crop Quality Evaluation API, as shown in Figure 6). These APIs act as bridges between the models and the platform. When a user initiates a function like disease detection through the platform interface, the relevant API is triggered. The API then calls the corresponding trained model, transmits the input data to the model, and retrieves the model’s output (detection results). Finally, the API returns these results to the platform for display to the user. In this way, the trained models are seamlessly integrated into the platform’s functional architecture, enabling the end-to-end operation of functions from user request to result feedback.
2.3. Enhanced Visual Models Boosting Performance of CloudCropFuture Monitoring Platform
2.3.1. Enhanced Diffusion Model for the Augmentation of Image Datasets
To enhance the quality of crop image datasets and boost the accuracy of intelligent crop detection and analysis, this work employs the ResShift model to upscale low-resolution images for specific crop categories. ResShift, an efficient diffusion model for image super-resolution, significantly reduces diffusion steps, thereby accelerating inference without compromising performance [38]. By constructing a Markov chain that transfers residuals between high- and low-resolution images, ResShift achieves greater efficiency than other diffusion-based methods. Its application enhances image clarity and detail, which is beneficial for subsequent analysis. This method is especially valuable in agriculture, as it preserves the authenticity and fidelity of the original images.
This work employs the Real-world Image Super-Resolution task of the ResShift model (with parameter settings task realsr, scale 4, version v3) to increase the resolution of input images by 4 times, so as to enhance the quality of the image dataset. As shown in Figure 7, the model first preprocesses the input low-resolution (LR) image, initially improving the resolution through the upsampling operation, and calculates the residual information (Residual Calculation) as follows:
where represents the original high-resolution (HR) image, and represents the image obtained after the low-resolution image (LR) undergoes the upsampling operation. Based on this residual information, the model constructs an efficient Markov chain for the Forward Process as follows:
where the high-resolution image (HR) is gradually added with noise and transformed into a low-resolution image (LR). In the Reverse Process, the model learns the distribution:
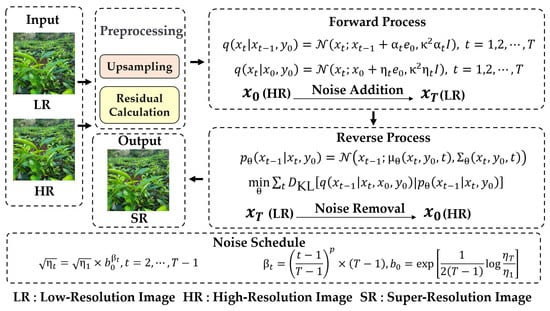
Figure 7.
The architecture and process flow of the ResShift model for super-resolution image.
Then, the noise is removed from the low-resolution image , and the high-resolution image is restored. This Markov chain based on the residual shift mechanism can achieve efficient super-resolution with only 15 sampling steps, avoiding the inefficiency of the hundreds of iterations needed in traditional diffusion models. At the same time, the flexible Noise Schedule mechanism of the model is dynamically adjusted by
where , precisely balancing image details and realism, ensuring the retention of key texture and structural information during resolution enhancement, and making the images visually closer to real-world observations. The ResShift model performs excellently on both synthetic and real-world datasets, can better adapt to diverse image types and application scenarios, provides reliable technical support for the high-quality processing of agricultural image datasets, and also lays a solid foundation for the development of agricultural intelligent detection technologies.
2.3.2. Visual Performance Boosting for YOLOv11-Based Models
Crop image datasets have significant differences in features such as shape, color, and texture, presenting a major challenge for crop identification and detection tasks. To broaden the application of the proposed platform and enhance its adaptability, this study delves into the YOLO series of object detection algorithms and improves them. The proposed platform has developed and applied multiple models, including YOLOv5, YOLOv8, YOLOv9, YOLOv10, YOLOv11, and an enhanced YOLOv11 model for crop identification and detection. Small-object detection and occluded-scene detection are technical challenges in agriculture. To boost detection performance in these complex scenarios, this study proposes a YOLOv11-based improvement strategy with the following strategies:
Firstly, to strengthen detection in occluded scenes, the Separated and Enhancement Attention Module (SEAM) is introduced. It processes input features with depthwise separable convolutions and residual connections, uses multi-head attention to enhance unoccluded region responses, and suppresses background regions under occlusion.
Secondly, to further enhance model performance, the Content-Aware ReAssembly of Features (CARAFE) module, an efficient content-aware upsampling technique, is adopted. It dynamically generates upsampling kernels, adaptively reassembles feature maps, and improves resolution while preserving semantic information, enabling the network to capture object details more effectively.
- (1)
- The Separated and Enhancement Attention Module
Occurrence of occlusion in crop growth images often causes alignment errors, local confusion, feature loss, and performance drop in detection models. To address this issue, the SEAM is integrated into the YOLOv11n architecture. It aims to compensate for the response loss in occluded regions by enhancing the response in unoccluded areas.
As illustrated in Figure 8, the SEAM structure displays its components and connections. The input feature map first undergoes depthwise separable convolution. This operation filters each channel individually, reducing parameters and preventing overfitting. It allows for per-channel learning and extraction of features in unoccluded regions, preserving their original feature information. The GELU activation function and BatchNorm layer further stabilize training and enhance feature expression. Next, the feature map enters the pointwise convolution layer, which fuses outputs from different depths. This integration of inter-channel information and capturing of channel dependencies not only boosts the expressiveness of features in unoccluded regions but also enriches the feature basis for subsequent attention mechanisms.
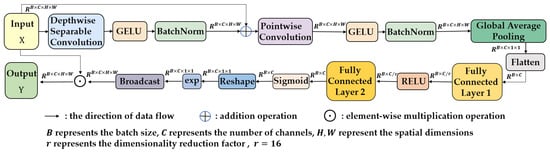
Figure 8.
The structure of the SEAM.
Following feature fusion, the feature map is processed through a two-layer fully connected network. Global average pooling compresses the feature map to , extracting global feature information. The first fully connected layer reduces the dimension to , and a RELU activation function introduces nonlinearity, enabling the model to learn more complex feature relationships. The second fully connected layer restores the dimension to , further integrating channel information and strengthening inter-channel connections.
To enhance the response in unoccluded regions, the SEAM maps the output of the fully connected layer to the interval using a Sigmoid function, generating attention weight maps. An exponential function then expands the value range of these maps to , creating a monotonic mapping that increases tolerance to positional errors and further amplifies the response in unoccluded regions while maintaining overall feature map stability.
Finally, the processed attention weight maps are reshaped and broadcast to match the dimensions of the original feature maps, and then multiplied elementwise with them. This operation enables the model to focus on target regions, particularly unoccluded ones, thereby strengthening the feature responses in unoccluded regions [39].
- (2)
- The Content-Aware ReAssembly of Features Module
The CARAFE module, a feature upsampling method, dynamically generates upsampling kernels in a content-aware manner for efficient feature map reassembly [40]. Integrating CARAFE into YOLOv11n enhances the network ability to perform content-aware upsampling, improving feature representation and boosting object detection performance.
As illustrated in Figure 9, CARAFE comprises two main components: the Kernel Prediction Module (KPM) and the Content-Aware Reassembly Module (CARM). The KPM first compresses the input feature map channels through a Channel Compressor to reduce computational cost. It then leverages a Content Encoder to generate upsampling kernels based on the local neighborhood information of the compressed feature map. The CARM subsequently utilizes these dynamically generated kernels to compute a weighted sum of the local neighborhood of the input feature map. This process results in the upsampled feature map, where each pixel value is a weighted combination of its neighbors.
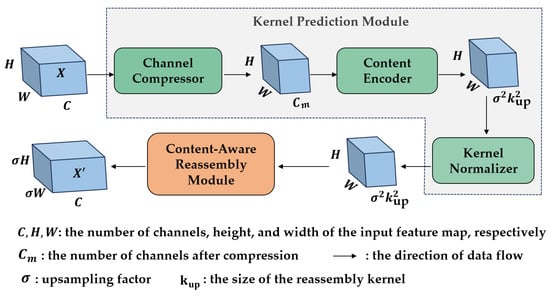
Figure 9.
The structure of the CARAFE.
The design of CARAFE offers several advantages. First, it leverages a large receptive field to aggregate contextual information, which helps in better capturing global object features. Second, as a content-aware module, it dynamically generates upsampling kernels based on local content. This allows for adaptive processing of features at different positions, thereby enhancing the model’s adaptability to complex scenes. Moreover, CARAFE introduces minimal computational overhead, avoiding significant increases in inference time. This efficiency enables seamless integration into modern networks without considerable efficiency loss.
- (3)
- The Enhanced YOLOv11n Models
By incorporating the SEAM or CARAFE modules, the improvement strategy significantly boosts the accuracy and reliability of YOLOv11 models in complex agricultural scenes, particularly for small objects and occluded scenarios, offering a promising solution to address detection challenges in such contexts within the agricultural sector.
Building upon the baseline YOLOv11n, this work introduces three enhanced variants, i.e., the YOLOv11n-SEAM (YOLOv11n-Se), the YOLOv11n-CARAFE (YOLOv11n-Ca), and the YOLOv11n-SEAM-CARAFE (YOLOv11n-SC), through strategic integration of the above two modular components. These variants share a unified structural framework (Figure 10), where SEAM and CARAFE are deployed at standardized positions within the network, ensuring consistency across all models while enabling flexible module combinations. The architectural parameters of each variant are summarized in Table 1, highlighting their incremental computational costs and performance trade-offs.
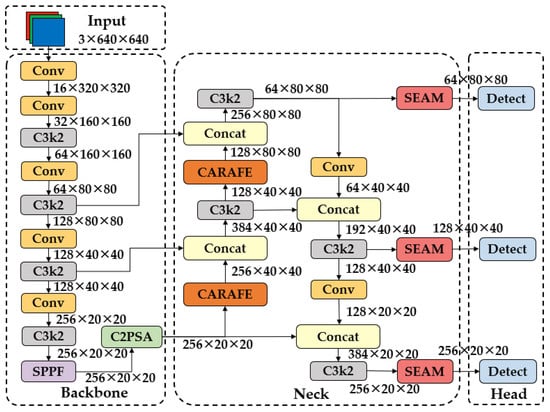
Figure 10.
The structure of the YOLOv11n-SC network.

Table 1.
Comparison of parameters of the enhanced YOLOv11n models.
In both YOLOv11n-Se and YOLOv11n-SC, the SEAM is positioned immediately after the Concat and C3k2 operations preceding each detection layer. This placement leverages the multi-scale features generated during feature fusion, allowing SEAM to selectively amplify responses in unoccluded regions through its attention mechanism. For instance, in dense foliage scenes where overlapping leaves obscure target boundaries, SEAM suppresses redundant background channels (e.g., obscured stems) while enhancing texture-rich leaf regions through depthwise separable convolutions and exponential activation. Similarly, the CARAFE is integrated into both YOLOv11n-Ca and YOLOv11n-SC by replacing traditional upsampling layers in the Neck network. The dynamic kernel prediction of the CARAFE adaptively reassembles features based on local context, preserving critical details like insect antennae or disease spots that are blurred by fixed interpolation kernels.
The modularity of the enhanced YOLOv11n series allows practitioners to tailor model selection to specific agricultural scenarios. For occlusion-dominant environments, YOLOv11n-Se provides cost-effective occlusion handling. In contrast, YOLOv11n-Ca is ideal for scale-sensitive tasks such as detecting small pests on crops, where its dynamic upsampling preserves micron-level features. The full SEAM-CARAFE integration offers a balanced solution for complex mixed scenarios. This flexibility, combined with the unified architectural framework (Figure 10), establishes the enhanced YOLOv11n models as a scalable toolkit for intelligent precision agriculture applications.
3. Results and Discussion
This section presents a comprehensive performance evaluation of the core object detection models that constitute the intelligent model base of the CloudCropFuture platform. These models provide the analytical power for the platform’s key APIs, including the Crop Disease Detection API, the Crop Maturity Assessment API, and the Crop Quality Evaluation API.
The experiments herein are designed to evaluate these models on public datasets corresponding to the three intelligent analysis systems. The results validate the performance of each model and provide a quantitative basis for selecting the most suitable model from the platform’s intelligent model base for a specific agricultural task.
In this study, all experiments on the proposed intelligent systems were conducted under consistent hardware and software configurations to ensure reliability and comparability. The computational environment consisted of a cloud server equipped with an NVIDIA GeForce RTX 4080 GPU (16 GB), an Intel(R) Xeon(R) Gold 6326 CPU (base frequency 2.90 GHz), and 386367 MB of RAM, running on the Ubuntu 20.04.1 LTS operating system with Python 3.10, CUDA 11.7, and PyTorch 2.0.
For experimental parameters, several key configurations were manually standardized across all models to ensure fair comparison: eight working threads, a batch size of eight, and uniformly specified training epochs for each dataset. All other hyperparameters and configurations adhered strictly to the respective models’ default settings without manual adjustments, including the input image size (640 × 640 pixels) and random seeds. Specifically, the random seed was set to 0 for YOLOv5n and YOLOv9-t, and 42 for the remaining models in the study. All models were trained from scratch on the employed datasets without leveraging transfer learning or fine-tuning.
This paper uses standard image detection evaluation indicators, including mAP@0.5, precision, and recall. To comprehensively evaluate the performance of various YOLO models and the enhanced YOLOv11n models, we employ a suite of metrics that quantify detection accuracy, robustness, and computational efficiency. These metrics are defined as follows:
Precision (P) measures the proportion of correctly identified positive instances among all predicted positives, reflecting the model’s ability to avoid false alarms. It is calculated as:
where (True Positive) denotes correctly detected objects, and (False Positive) represents incorrect detections.
Recall (R) quantifies the model’s capability to identify all relevant instances in the dataset, penalizing missed detections:
where (False Negative) denotes undetected true targets.
Mean average precision (mAP@0.5) evaluates the model’s localization and classification accuracy under an Intersection over Union (IoU) threshold of 0.5. For each class, the average precision (AP) is computed as the area under the precision–recall curve, and averages across all classes:
where is the number of object classes.
F1-Score harmonizes precision and recall into a single metric, providing a balanced assessment of classification performance. It is the harmonic mean of and :
Frames Per Second (FPS) quantifies inference speed, measuring the number of images processed per second. It is calculated as:
where is the total inference time for .
Parameters represent the total number of learnable weights and biases within the optimized inference model. This metric reflects the model’s size and memory footprint. A lower parameter count indicates a more compact model that is easier to deploy on storage-constrained devices.
GFLOPs (Giga Floating Point Operations) measure the computational complexity of the model for a single forward pass with a standard input size. They quantify the theoretical amount of computation required for one inference. Models with lower GFLOPs demand less computational power, leading to potential energy savings and higher achievable frame rates on compatible hardware.
The values for parameters and GFLOPs reported in the following sections are derived from the final, optimized inference model rather than the initial training graph, which provides a more accurate assessment of the model’s practical deployment efficiency.
3.1. The Crop Disease Detection System
3.1.1. Introduction on Datasets
To verify the applicability of the Crop Disease Detection System across multiple crops, experiments are conducted on four public crop datasets. The crop disease datasets utilized in this study are publicly available and can be accessed through the URLs provided in Table 2. As detailed in Table 3, the Strawberry Disease Dataset and Tea Leaf Disease Dataset follow the original training, validation, and testing splits. The Pepper Pest Dataset and Tomato Leaf Disease Dataset are re-split with a ratio of 0.7/0.15/0.15 (training/validation/testing) using a random seed of 42.
Table 2.
Crop disease dataset links.
Table 3.
Crop disease datasets.
3.1.2. Comparisons of Model Performances
To provide a basis for model selection in the Crop Disease Detection System, this study conducted systematic testing of the YOLOv5n, YOLOv8n, YOLOv9-t, YOLOv10n, and YOLOv11n models on different crop disease datasets.
As shown in Table 4, on the Strawberry Disease Dataset, various YOLO models demonstrated differentiated performance. YOLOv5n achieved balanced detection performance with a high frame rate of 289.6 FPS, attaining 79.2% precision, 77.6% recall (R), and 78.0% mAP@0.5, making it suitable for large-scale rapid screening scenarios with high real-time requirements. Although YOLOv8n showed slightly reduced metrics compared to YOLOv5n, it maintained 274.8 FPS while featuring a compact model size and low hardware requirements, making it ideal for resource-constrained edge devices. YOLOv9-t demonstrated exceptional precision and mAP@0.5, but with a lower FPS of 82.0, suitable for scenarios demanding extremely high accuracy with low time sensitivity. YOLOv10n exhibited balanced metrics, serving as a versatile strawberry disease detection model. YOLOv11n showed lower recall but faster processing speed (197.3 FPS), appropriate for rapid preliminary screening.
Table 4.
Experimental results on crop disease datasets.
As shown in Figure 11a, the F1-scores of all models initially increased and then decreased with confidence threshold variations. The specific peak positions and F1-score values differed slightly among models, providing guidance for selecting confidence thresholds in practical applications. Figure 11b clearly illustrates the trade-off between inference time and detection accuracy across models: YOLOv5n and YOLOv8n combine fast processing speeds with high mAP@0.5, making them suitable for scenarios requiring both real-time performance and accuracy; YOLOv9-t achieves high mAP@0.5 at the cost of longer inference time, suitable for offline high-precision analysis tasks; YOLOv10n strikes a balance between these aspects, while YOLOv11n features short inference times with relatively lower mAP@0.5, applicable for rapid screening scenarios prioritizing speed over strict accuracy requirements.
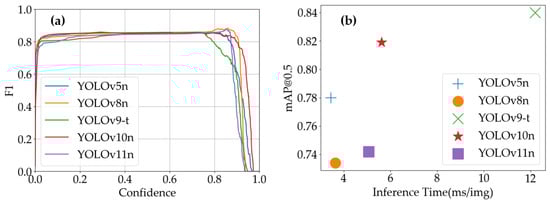
Figure 11.
YOLO models’ performance on Strawberry Disease Dataset: (a) YOLO models’ F1-scores vs. confidence; (b) inference time vs. mAP@0.5 of YOLO models.
As shown in Table 4, when tested on the Pepper Pest Dataset, the YOLO models demonstrated distinct performance characteristics and application scenarios. YOLOv5n exhibited outstanding detection accuracy with a processing speed of 278.5 FPS, making it suitable for large-scale rapid screening scenarios requiring strong real-time performance in pepper pest detection. Its capability to process extensive image volumes within short timeframes enables timely identification of pest signs. While YOLOv8n showed a marginally faster processing speed, its slightly reduced detection accuracy and recall made it preferable for preliminary screening stages where speed prioritization allows moderate accuracy compromises. YOLOv9-t achieved superior detection accuracy but operated at a slower 81.8 FPS, positioning it for precision-oriented applications with low time sensitivity, such as laboratory-based detailed pest analysis and research. YOLOv10n emerged as the top performer in this dataset with exceptional mAP@0.5 (92.2%) and a balanced processing speed (177.3 FPS), establishing itself as a versatile model for practical pepper pest detection scenarios. Its optimized balance between accuracy and efficiency makes it ideal for diverse applications including farm-level daily monitoring and pest management systems. Though YOLOv11n showed relatively weaker detection performance, its faster processing speed (198.9 FPS) rendered it effective for preliminary screening phases where detection scope reduction and operational efficiency outweigh strict recall requirements.
Figure 12 reveals that YOLOv10n’s precision–recall curve maintains superior accuracy in high-recall regions, demonstrating enhanced capability to identify positive samples while preserving detection precision. This characteristic proves particularly valuable for comprehensive pest detection applications requiring thorough inspection. As illustrated in Figure 12, YOLOv10n’s dominance in mAP@0.5 highlights its exceptional comprehensive performance, achieving an optimal balance between detection accuracy and moderate inference time to meet diverse practical requirements.
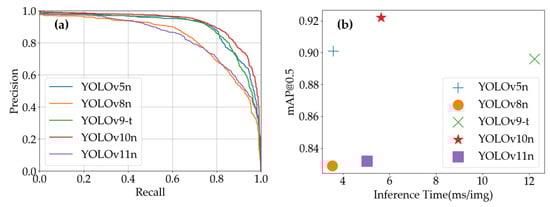
Figure 12.
YOLO models’ performance on Pepper Pest Dataset: (a) YOLO models’ precision–recall curves; (b) inference time vs. mAP@0.5 of YOLO models.
As shown in Table 4, during testing on the Tea Leaf Disease Dataset, the YOLO models demonstrated unique performance characteristics and application scenarios. YOLOv5n achieved an excellent detection accuracy (96.9% precision) and processing speed (287.4 FPS), with an exceptionally high mAP@0.5 (99.0%). This makes it ideal for large-scale, real-time disease screening in tea fields, where both speed and precision are critical. YOLOv8n exhibited remarkable recall (99.2% R), indicating its ability to detect nearly all disease instances. Although its precision was lower than YOLOv5n, its processing speed (272.1 FPS) positioned it for scenarios prioritizing comprehensive disease detection, such as preliminary full-coverage analysis requiring subsequent detailed evaluation. YOLOv9-t achieved a detection accuracy comparable to YOLOv5n (96.6% P), but with a slower processing speed (81.3 FPS). It is therefore more suitable for precision-critical, time-insensitive applications, such as laboratory-based disease analysis and severity assessment. YOLOv10n achieved the highest precision (97.4% P) among the models, with a moderate processing speed of 176.2 FPS. This balance makes it ideal for detailed disease classification studies where accuracy is paramount, but some trade-offs in speed are acceptable. YOLOv11n achieved an exceptional recall rate (99.2% R) and high mAP@0.5 (99.0%), comparable to YOLOv8n and YOLOv10n, respectively. However, its precision (87.7% P) was slightly lower than some other models. With a processing speed of 198.4 FPS, it can be used in scenarios that require a balance between detection performance and speed.
As illustrated in Figure 13a, YOLOv9-t’s precision–recall curve dominates other models in high-precision regions, demonstrating its ability to maintain superior accuracy while preserving robust recall rates. This characteristic is particularly advantageous for applications demanding extreme precision, such as detailed disease categorization and severity grading. Figure 13b highlights YOLOv5n’s combination of short inference times and high mAP@0.5 values, enabling rapid detection tasks without compromising accuracy. These attributes make it especially suitable for real-time online disease monitoring systems. As shown in Figure 14, which presents the partial recognition results of multiple YOLO models on the Tea Leaf Disease Dataset, the YOLOv5n model falsely detected disease-free regions as diseased leaves, while other models correctly identified the samples.
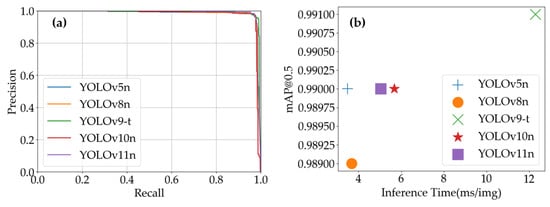
Figure 13.
YOLO models’ performance on Tea Leaf Disease Dataset: (a) YOLO models’ precision–recall curves; (b) inference time vs. mAP@0.5 of YOLO models.
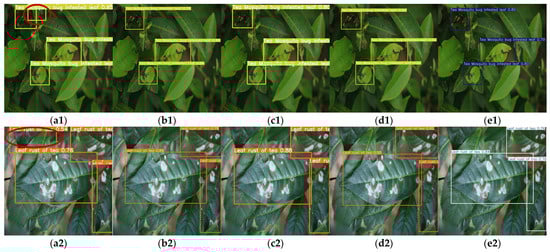
Figure 14.
Detection results (with misidentifications highlighted by red ellipses) of Tea Leaf Disease Dataset via multiple YOLO models: (a1,a2) YOLOv5n, (b1,b2) YOLOv8n, (c1,c2) YOLOv9-t, (d1,d2) YOLOv10n, and (e1,e2) YOLOv11n on two disease types.
As shown in Table 4, during testing on the Tomato Leaf Disease Dataset, the YOLO models demonstrated distinct performance characteristics and application scenarios. YOLOv5n achieved a high recall rate (89.0% R), effectively identifying most disease instances, with a fast processing speed (286.2 FPS) and 88.3% mAP@0.5. This makes it suitable for rapid detection scenarios prioritizing recall and real-time performance, such as large-scale preliminary screening of tomato diseases. YOLOv8n showed comparable metrics to YOLOv5n but with slightly lower mAP@0.5 (84.3%) and a processing speed of 284.6 FPS. It provided marginally reduced accuracy at a near-equivalent speed, making it applicable for speed-critical scenarios tolerant of moderate precision compromises. YOLOv9-t exhibited relatively lower performance across metrics (75.1% P, 78.0% R, 82.3% mAP@0.5) and the slowest processing speed (81.4 FPS). YOLOv10n balanced moderate processing speed (176.3 FPS) with improved detection accuracy (85.4% P, 76.9% R, 86.0% mAP@0.5), positioning it for use in scenarios requiring reliable accuracy with acceptable speed limitations, such as detailed laboratory-based disease analysis. YOLOv11n demonstrated intermediate performance between YOLOv5n and YOLOv10n (77.7% P, 85.9% R, 83.2% mAP@0.5, 196.1 FPS), achieving a practical balance between accuracy and speed for general detection scenarios without extreme requirements.
As illustrated in Figure 15, YOLOv5n’s combination of short inference time and high mAP@0.5 confirms its capability to maintain detection accuracy while executing tasks rapidly. This dual advantage makes it particularly suitable for real-time online disease monitoring systems where timely detection and reliability are paramount.
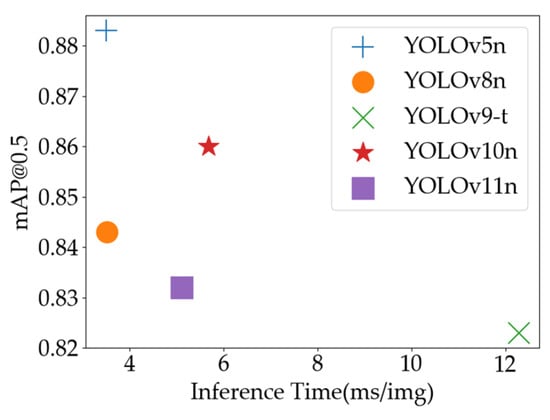
Figure 15.
Inference time vs. mAP@0.5 of YOLO models on Tomato Leaf Disease Dataset.
In summary, this study conducted a comprehensive evaluation of multiple YOLO series models through systematic experiments on diverse crop disease image datasets, integrating analyses of YOLO models’ precision–recall curves and inference time versus mAP@0.5 diagrams to assess their performance. For practical implementation, the optimal YOLO model can be selected according to specific operational requirements and application scenarios. For instance, in strawberry disease detection, YOLOv9-t is prioritized for scenarios demanding exceptional detection accuracy, while YOLOv10n emerges as the balanced choice for pepper pest detection, harmonizing accuracy and processing speed. In tea leaf disease detection, YOLOv5n stands out for its high precision coupled with efficient processing capabilities. For tomato leaf disease detection, its high accuracy and rapid inference make it well-suited for both rapid screening and reliable identification. These research outcomes provide robust guidance for intelligent crop disease detection in agricultural production, significantly enhancing the efficiency and accuracy of disease identification. By facilitating timely implementation of control measures, this work supports the mitigation of disease impacts on crop yield and quality, thereby advancing precision agriculture and sustainable farming practices.
3.2. The Crop Maturity Assessment System
3.2.1. Introduction on Datasets
To evaluate the broad applicability and robustness of our proposed maturity assessment system, we validated it using public datasets for two distinct crops. Accessible URLs for the crop maturity datasets used in this study are listed in Table 5. An introduction to these datasets and a description of the preprocessing work are presented in Table 6.
Table 5.
Crop maturity dataset links.
Table 6.
Crop maturity datasets.
As shown in the table, the Tea Leaf Age Dataset follows the open-source training, validation, and testing splits. The tea leaf images are categorized into four classes based on age, representing different quality levels: from A (1–2 days old, highest quality) to D (over 7 days old, unsuitable for brewing). The original image resolution is 340 × 340. In this study, we used the ResShift model to enhance the image resolution to above 640 × 640. The augmented dataset, named Augmented Tea Leaf Age Dataset, is made available for other researchers.
The Tomato Maturity Dataset comprises 804 images of tomatoes at different stages of ripeness. It includes six classes: b_fully_ripened, b_half_ripened, b_green, l_fully_ripened, l_half_ripened, and l_green. Since the dataset only includes training and validation sets, we re-split it randomly into training, validation, and testing sets at a ratio of 0.7/0.15/0.15. Each tomato is classified by size (big or little) and maturity stage (fully ripened, half ripened, or green), forming the categories mentioned above. Prefixes “b” and “l” denote big and little tomatoes, respectively, while suffixes specify maturity stages, systematically organizing tomatoes into three maturity levels for both size groups.
3.2.2. Comparisons of Model Performances
In this study, we conducted a comprehensive evaluation of various YOLO model versions on crop maturity datasets, providing guidance for model selection in practical applications. By holistically considering metrics such as detection accuracy and processing speed, optimal models can be selected based on specific task requirements. Detailed experimental results are presented as in Table 7. As clearly shown in Table 7, the performances of YOLO models exhibit significant differences between the Original Tea Leaf Age Dataset and the augmented dataset. On the Original Tea Leaf Age Dataset, YOLOv5n demonstrated high recall, indicating its effectiveness in identifying most tea leaf age instances. While its precision was relatively lower, it achieved an mAP@0.5 of 86.1% with a fast processing speed (274.7 FPS), making it suitable for large-scale preliminary screening scenarios requiring high recall and real-time performance. YOLOv8n showed improved precision compared to YOLOv5n but with reduced recall, achieving an mAP@0.5 of 83.2% and maintaining rapid processing (271.5 FPS). This balanced performance positions it for applications requiring moderate accuracy and recall without extreme prioritization. YOLOv9-t excelled in precision and mAP@0.5 but operated at a slower speed (81.8 FPS), rendering it ideal for high-precision, time-insensitive scenarios such as detailed leaf age analysis in laboratory settings. YOLOv10n exhibited balanced precision and recall, achieving an mAP@0.5 of 87.2% with moderate processing speed (178.9 FPS), making it suitable for scenarios demanding stability and comprehensive performance. YOLOv11n demonstrated comparable precision and recall, achieving an mAP@0.5 of 87.0% and faster processing (196.7 FPS), showcasing versatile applicability for general detection tasks requiring both accuracy and speed.
Table 7.
Experimental results on the Tea Leaf Age Dataset.
On the Augmented Tea Leaf Age Dataset enhanced using the ResShift model, all models showed notable performance improvements, with the average precision increasing by 5.6 percentage points and the average mAP@0.5 increasing by 2.8 percentage points. YOLOv5n’s mAP@0.5 rose to 88.8% with accelerated processing (296.7 FPS), confirming the efficacy of data augmentation in enhancing both accuracy and speed for real-time applications. YOLOv8n achieved higher precision despite slight recall fluctuations, attaining an mAP@0.5 of 85.7% and faster processing (290.7 FPS), reinforcing its suitability for scenarios requiring a balanced accuracy–recall trade-off. YOLOv9-t displayed a significant mAP@0.5 improvement, validating the advantage of data augmentation in boosting detection accuracy for complex models, thereby enhancing its competitiveness in precision-critical research contexts. YOLOv10n achieved substantial gains in precision and recall, reaching an mAP@0.5 of 90.3%, demonstrating superior target recognition capabilities on augmented data for high-accuracy applications. YOLOv11n exhibited marked precision enhancement and an mAP@0.5 of 89.8%, further solidifying its adaptability for general-purpose detection scenarios. These results underscore the transformative potential of data augmentation in optimizing model performance across diverse agricultural applications.
Through comparative analysis of model performance on original and augmented datasets, the significant efficacy of data augmentation strategies in enhancing detection accuracy and overall performance becomes evident. Taking YOLOv11n as an example, its precision improved from 80.3% on the original dataset to 89.8% on the augmented dataset, validating the effectiveness of the ResShift-based enhancement strategy. By increasing image resolution in the dataset, data augmentation enables models to learn richer features, resulting in superior performance in practical detection tasks.
Inter-model comparisons reveal that YOLOv5n and YOLOv8n achieved substantial mAP@0.5 improvements through data augmentation while maintaining high processing speeds, making them ideal for real-time application scenarios. YOLOv9-t demonstrated exceptional detection accuracy on augmented data, positioning it as the preferred choice for precision-critical tasks despite its slower processing speed. Both YOLOv10n and YOLOv11n attained high mAP@0.5 values (90.3% and 89.8%, respectively) with moderate processing speeds, indicating their balanced trade-off between accuracy and efficiency.
Integrated analysis of Figure 16a–c provides an intuitive visualization of performance variations across datasets. Figure 16a clearly illustrates the mAP@0.5 improvements from data augmentation and relative performance differences among models. Figure 16b,c reveal F1-score patterns under varying confidence thresholds, further confirming the positive impact of data augmentation while elucidating comprehensive performance dynamics under different confidence requirements.
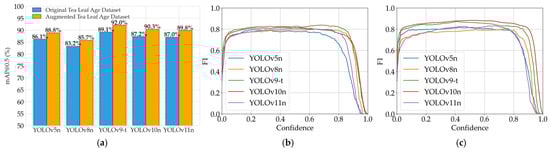
Figure 16.
Model performance evaluation for Crop Maturity Assessment System: (a) model performance comparison (mAP@0.5); (b) YOLO models’ F1-scores vs. confidence on Original Tea Leaf Age Dataset; (c) YOLO models’ F1-scores vs. confidence on Augmented Tea Leaf Age Dataset.
In conclusion, this study validates the performance characteristics of various YOLO models in crop object detection tasks through experiments on the Tea Leaf Age Dataset, while demonstrating the effectiveness of the ResShift-based augmentation strategy. For practical applications, optimal YOLO versions can be selected based on specific task priorities: YOLOv5n or YOLOv8n for rapid screening scenarios requiring speed; YOLOv9-t for precision-dominated research applications; and YOLOv10n/YOLOv11n for scenarios demanding balanced accuracy–speed performance.
As clearly shown in Table 8, the performance of YOLO models varies significantly on the Tomato Maturity Dataset. Overall, each model exhibits distinct characteristics in detection accuracy and processing speed. YOLOv5n demonstrates strong detection accuracy while maintaining high processing speed (291.3 FPS), achieving 78.1% precision, 78.0% recall, and 83.1% mAP@0.5, making it suitable for large-scale rapid tomato maturity screening scenarios requiring real-time performance. YOLOv8n shows slightly inferior overall performance with 74.6% precision, 72.3% recall, 76.4% mAP@0.5, and a processing speed of 261.5 FPS, applicable for speed-prioritized scenarios tolerant of moderate accuracy compromises. Despite its slower processing speed (81.0 FPS), YOLOv9-t achieves superior detection accuracy with 77.1% precision, 78.4% recall, and 83.8% mAP@0.5, positioning it for precision-critical detailed analysis scenarios with low time sensitivity. YOLOv10n strikes a balance between accuracy and speed, attaining 82.9% precision, 73.6% recall, 82.0% mAP@0.5, and moderate processing speed (164.5 FPS), suitable for scenarios requiring stable detection and comprehensive performance. YOLOv11n exhibits balanced capabilities with 81.0% precision, 70.9% recall, 79.9% mAP@0.5, and faster processing (197.0 FPS), serving as a versatile option for general detection tasks demanding both accuracy and speed considerations.
Table 8.
Experimental results on the Tomato Maturity Dataset.
By synthesizing the insights from Figure 17, the performance variations of YOLO models on the Tomato Maturity Dataset can be comprehensively analyzed. Figure 17a reveals how the F1-scores of each model fluctuate across different confidence thresholds. Notably, YOLOv10n maintains high F1-scores over a wide range of confidence thresholds, demonstrating its robust balance between precision and recall. This characteristic makes it particularly suitable for scenarios requiring consistent detection performance under varying confidence requirements. YOLOv5n and YOLOv9-t also exhibit strong stability, sustaining relatively high F1-scores across most confidence intervals, which underscores their reliability for applications prioritizing steady detection outcomes. The inference time vs. mAP@0.5 diagram further highlights the trade-offs between computational efficiency and detection accuracy. YOLOv5n and YOLOv8n stand out with shorter inference times (higher FPS), making them ideal choices for real-time applications where rapid processing is critical. In contrast, YOLOv9-t achieves the highest mAP@0.5 despite its longer inference time, positioning it as the optimal model for precision-driven analytical tasks. YOLOv10n and YOLOv11n strike a commendable equilibrium between inference speed and detection accuracy, catering to scenarios that demand a balanced approach to both metrics.
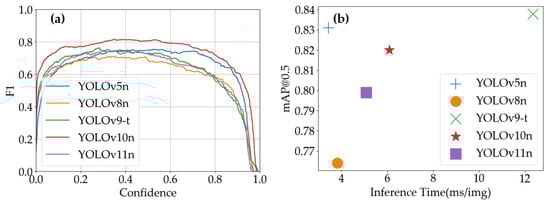
Figure 17.
YOLO models’ performance on Tomato Maturity Dataset: (a) YOLO models’ F1-scores vs. confidence; (b) inference time vs. mAP@0.5 of YOLO models.
The partial detection results of various YOLO models on the Tomato Maturity Dataset are shown in Figure 18. For the big tomato samples (first row), YOLOv5n (Figure 18(a1)) and YOLOv10n (Figure 18(d1)) mistakenly identified background clutter as tomatoes, while YOLOv8n (Figure 18(b1)) incorrectly segmented a single whole tomato into two separate detections. Among these models, only YOLOv9-t (Figure 18(c1)) and YOLOv11n (Figure 18(e1)) correctly identified the big tomatoes. In the second row showing small tomato samples, YOLOv5n (Figure 18(a2)) and YOLOv9-t (Figure 18(c2)) produced false detections. YOLOv8n (Figure 18(b2)) failed to detect one partially occluded small tomato (missed detection). Conversely, YOLOv10n (Figure 18(d2)) and YOLOv11n (Figure 18(e2)) correctly identified all small tomatoes.
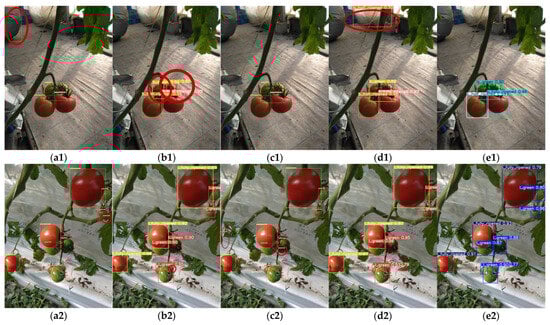
Figure 18.
Detection results (with misidentifications highlighted by red ellipses) of Tomato Maturity Dataset via multiple YOLO models: (a1,a2) YOLOv5n, (b1,b2) YOLOv8n, (c1,c2) YOLOv9-t, (d1,d2) YOLOv10n, and (e1,e2) YOLOv11n on different sizes (big and little).
In summary, the performance of YOLO models on the Tomato Maturity Dataset reflects distinct strengths tailored to diverse operational needs. For real-time applications emphasizing speed, YOLOv5n or YOLOv8n are recommended due to their rapid inference capabilities. High-precision analytical tasks benefit most from YOLOv9-t, which prioritizes detection accuracy even at the cost of processing speed. For scenarios requiring a harmonious balance between accuracy and efficiency, YOLOv10n and YOLOv11n emerge as versatile solutions. Practical implementations should therefore align model selection with specific priorities, such as speed, precision, or a balanced compromise, to optimize the interplay between detection efficacy and computational performance in agricultural applications.
3.3. The Crop Quality Evaluation System
3.3.1. Introduction on Datasets
In the field of food safety and quality control, fruit quality detection is an important research subject. To evaluate and enhance the performance of the Crop Quality Evaluation System, this study carried out a series of experiments based on the public Fruit Freshness Detection Dataset, which is publicly available at https://github.com/zijianchen98/Fruit-freshness-detection-dataset (accessed on 22 October 2024). The dataset contains images of three types of fruits (apples, bananas, and oranges) at different levels of quality (fresh, normal, and rotten), divided into nine categories in total: fresh_apple, normal_apple, rotten_apple, fresh_banana, normal_banana, rotten_banana, fresh_orange, normal_orange, and rotten_orange, as shown in Table 9. The dataset consists of 2241 training images, 481 validation images, and 480 testing images, making a total of 3202 images, thus providing rich samples for visual fruit quality detection studies. By using this dataset, this study verified the recognition ability of the proposed crop quality monitoring system at different quality levels and explored its potential practical value.
Table 9.
Dataset of fruit freshness categories.
3.3.2. Comparisons of Model Performances
As evident from Table 10, all YOLO versions achieved outstanding performance on the Fruit Freshness Detection Dataset, with metrics such as precision, recall, and mean average precision consistently reaching high levels. While detection accuracy and processing speed varied across models, each exhibited unique strengths. YOLOv5n demonstrated robust detection accuracy alongside fast processing speed (289.3 FPS), achieving 99.0% precision, 98.3% recall, and 99.2% mAP@0.5. YOLOv8n similarly delivered excellent performance with 99.1% precision, 98.2% recall, 99.3% mAP@0.5, and rapid processing (271.3 FPS). Although YOLOv9-t operated at a slower speed (81.2 FPS), it maintained high precision, recall, and mAP@0.5, making it suitable for precision-focused tasks. YOLOv10n balanced accuracy and speed with 99.0% precision, 98.1% recall, 99.2% mAP@0.5, and 174.9 FPS. YOLOv11n showcased comprehensive capabilities, attaining 99.1% precision, 98.6% recall, 99.3% mAP@0.5, and faster processing (197.7 FPS).
Table 10.
Experimental results on the Fruit Freshness Detection Dataset.
Complementary figures provide deeper insights into model performance variations. Figure 19a illustrates the precision–recall trade-offs across different thresholds. All models exhibit PR curves approaching the top-left corner, indicating sustained high precision and recall across thresholds. Figure 19b depicts F1-score variations under varying confidence levels, revealing that most models maintain high F1-scores across a broad confidence range, which underscores their robust overall performance. Figure 19c further explores the relationship between inference time and detection accuracy. Notably, YOLOv8n and YOLOv11n achieve high mAP@0.5 with relatively short inference times, while YOLOv5n, despite having a slightly lower mAP@0.5, offers the fastest processing.
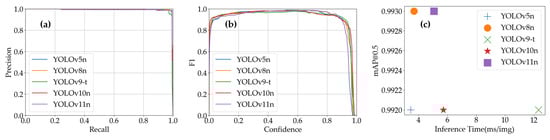
Figure 19.
YOLO models’ performance evaluation on Fruit Freshness Detection Dataset: (a) YOLO models’ precision–recall curves; (b) YOLO models’ F1-scores vs. confidence; (c) inference time vs. mAP@0.5 of YOLO models.
The distinct characteristics of YOLO models on this dataset align with diverse application requirements. For real-time scenarios demanding rapid processing, YOLOv5n and YOLOv8n are optimal choices, combining high accuracy with exceptional speed. YOLOv10n serves as a balanced solution for moderate real-time needs, while YOLOv11n’s comprehensive performance ensures reliability across varied scenarios. These findings highlight the adaptability of YOLO models to prioritize speed, precision, or equilibrium based on operational demands in the Crop Quality Evaluation System.
Figure 20 shows that most detections by various YOLO models on the Fruit Freshness Detection Dataset are correct. However, YOLOv9-t (Figure 20(c1)) and YOLOv10n (Figure 20(d1)) misclassified fresh bananas as normal bananas, while YOLOv8n (Figure 20(b1)) and YOLOv10n (Figure 20(d1)) exhibited duplicate detections. YOLOv11n (Figure 20(e1)) even detected partially visible bananas in the upper-left corner, while its other results are accurate.
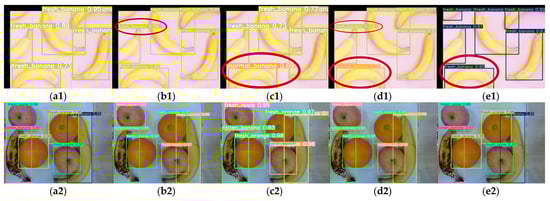
Figure 20.
Detection results (with misidentifications highlighted by red ellipses) of Fruit Freshness Detection Dataset via multiple YOLO models: (a1,a2) YOLOv5n, (b1,b2) YOLOv8n, (c1,c2) YOLOv9-t, (d1,d2) YOLOv10n, (e1,e2) YOLOv11n.
3.4. The Enhanced YOLOv11n Models
In this study, we conducted systematic ablation studies to isolate and quantify the contributions of the proposed enhanced modules (SEAM and CARAFE) to model performance. Specifically, we constructed three enhanced YOLOv11n variants based on the baseline YOLOv11n model: (1) YOLOv11n-Se, which only integrates the SEAM; (2) YOLOv11n-Ca, which solely incorporates the CARAFE module; and (3) YOLOv11n-SC, which combines both the SEAM and CARAFE modules. This design allows us to evaluate the independent effects of each module and their synergistic impact when used together.
The performance of these enhanced variants across multiple datasets is summarized in Table 11, with a comprehensive comparison between all enhanced YOLOv11n models and other YOLO lightweight detectors provided in Appendix A (Table A1).
Table 11.
Enhanced YOLOv11n models: comparative results on multiple datasets.
The experimental results highlight significant variations in the impact of integrating the SEAM and CARAFE modules into the YOLOv11n architecture. Their effectiveness is closely tied to both the module design principles and dataset characteristics. In occlusion-prone agricultural imaging scenarios, SEAM partially validated its design intent on the Tea Leaf Disease Dataset: precision improved from 87.7% to 97.1%, indicating enhanced discriminative capability for high-confidence targets through its depthwise separable convolutions and channel attention mechanisms, which amplify features in unobstructed regions. However, its exponential amplification strategy for attention weights caused excessive suppression of low-response features, resulting in a sharp recall decline from 99.2% to 82.3%, highlighting missed detection risks in complex occlusion scenarios. The contradiction arises from SEAM’s channel attention mechanism, which lacks spatial granularity control. Features in low-contrast areas, such as leaf edge lesions, are weakened by global attention weights, while the monotonic exponential amplification exacerbates feature distribution imbalance. Additionally, SEAM’s computational overhead (average FPS reduction of 23.1%) and unstable performance gains (e.g., 1.0% mAP@0.5 decline on the Pepper Pest Dataset) suggest its suitability for specialized scenarios with high occlusion rates and significant background noise rather than general optimization.
In contrast, the CARAFE module demonstrates stronger generalizability through its content-aware dynamic upsampling mechanism. On the Pepper Pest Dataset, it achieved a 5.8% mAP@0.5 improvement with only a 13.8% FPS reduction, proving that dynamic kernel generation effectively preserves fine details of small targets, such as pest limb textures, while maintaining computational efficiency through channel compression and lightweight kernel prediction networks. Notably, CARAFE achieved 99.4% recall on the Tea Leaf Disease Dataset (vs. 99.2% in the baseline), indicating its ability to capture transitional regions between lesions and healthy tissues through locality-aware upsampling kernels, mitigating edge blurring caused by traditional interpolation.
The YOLOv11n-SC model reveals the complexity of module synergy. On the Tea Leaf Disease Dataset, the combined model achieved 99.1% mAP@0.5, matching CARAFE alone and significantly outperforming the baseline, indicating that SEAM enhances CARAFE feature reorganization by suppressing background channel noise to focus on lesion regions. However, on the Pepper Pest Dataset, the combined model’s mAP@0.5 (88.6%) slightly trailed CARAFE alone (89.0%), suggesting that SEAM might disrupt multi-scale feature associations for small targets. Furthermore, the combined computational overhead of the two modules reduced FPS by 31.4%, posing challenges for real-time detection tasks.
From a data characteristics perspective, the performance fluctuations of SEAM correlate strongly with occlusion levels and target–background contrast. On the Tomato Leaf Disease Dataset, where color differences between diseased and healthy regions are subtle, SEAM struggles to distinguish fine feature variations, inadvertently introducing noise (0.7% mAP@0.5 decline). In contrast, CARAFE’s superior performance on the Tea Leaf Disease Dataset (99.1% mAP@0.5) benefits from the morphological diversity of lesions, with dynamic kernels adapting to lesions of varying shapes and sizes, thereby avoiding scale bias inherent in fixed upsampling kernels. Notably, on the Original Tea Leaf Age Dataset, the combined model achieved 87.9% mAP@0.5, surpassing both the baseline (87.0%) and CARAFE alone (86.0%), demonstrating effective synergy between SEAM channel purification and CARAFE detail enhancement when targets exhibit uniform scales and moderate background interference.
Visual detection results are presented in Figure 21 for the Original Tea Leaf Age Dataset, with additional results for the Pepper Pest Dataset (Figure A1), Tea Leaf Disease Dataset (Figure A2), and Tomato Leaf Disease Dataset (Figure A3) provided in Appendix B for reference. A comparative analysis between YOLOv11n and YOLOv11n-SC (proposed) on the Original Tea Leaf Age Dataset reveals significant differences in leaf recognition performance. YOLOv11n exhibits imprecise judgment of leaf integrity. For instance, in Figure 21(a1), it incorrectly identifies and labels incomplete leaves. This may stem from the model’s failure to adequately capture critical shape features during the feature extraction stage, leading to misjudgment of leaf completeness. In contrast, YOLOv11n-SC demonstrates superior performance, accurately identifying complete leaves without such erroneous labeling. This indicates enhanced feature extraction and analysis capabilities that enable precise perception of leaf integrity characteristics, effectively avoiding false identification of incomplete leaves.
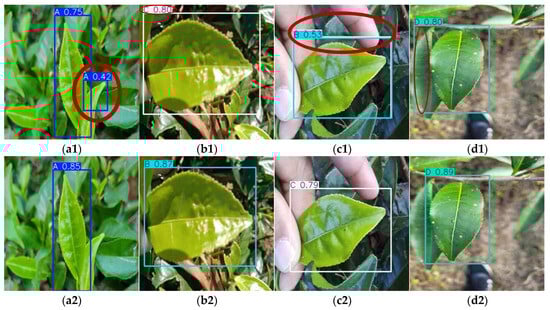
Figure 21.
Detection results (with inaccuracies highlighted by red ellipses) of the Original Tea Leaf Age Dataset via YOLOv11n and YOLOv11n-SC (proposed): (a1–d1) and (a2–d2) show the results of YOLOv11n and YOLOv11n-SC, respectively, on categories A-D of the dataset.
Furthermore, their performance in duplicate detection and recognition errors presents a stark contrast. YOLOv11n not only commits recognition errors but also displays duplicate detection phenomena, as evidenced in Figure 21(b1) and Figure 21(c1). This could be attributed to the model’s oversensitivity to similar leaf features and insufficient discriminative capability between different leaf categories. Comparatively, YOLOv11n-SC shows reduced duplicate detection and misclassification, highlighting improvements in object detection localization and classification accuracy. These enhancements enable more precise determination of leaf categories and positions, effectively mitigating redundant detection and recognition errors. Regarding bounding box localization accuracy, YOLOv11n detection boxes often fail to precisely encompass tea leaf contours, as shown in Figure 21(d1), reflecting the imprecise capture of leaf boundary features. Conversely, YOLOv11n-SC generates bounding boxes that better conform to actual leaf contours, fully containing target leaves. It demonstrates superior performance in object boundary localization, enabling more accurate determination of tea leaf positions.
Figure 22 presents the normalized confusion matrices of YOLOv11n and YOLOv11n-SC on the Pepper Pest Dataset, involving categories like Myzus persicae Sulz (MP), Bemisia tabaci (BT), thrips (T), caterpillar (C), and background. For YOLOv11n in (a), the diagonal elements (correct classifications) for MP, BT, T, and C show certain classification capabilities. For instance, the diagonal value of C is 0.99, yet some lighter-colored diagonal blocks imply potential misclassifications. In contrast, YOLOv11n-SC in (b) exhibits more prominent and darker diagonal elements for these pest categories. Specifically, the diagonal value of BT jumps to 0.96, and that of T rises to 0.89. This indicates that, by leveraging SEAM’s attention-based enhancement of unoccluded regions and CARAFE’s content-aware feature reconstruction, YOLOv11n-SC achieves higher correct classification rates. The off-diagonal elements (misclassifications) in (b) are mitigated. For example, the value of BT and background drops from 0.21 in (a) to 0.04 in (b), meaning it reduces misclassifications of one pest as background. Overall, the comparison shows that YOLOv11n-SC outperforms YOLOv11n in accurately classifying pepper pests, validating the effectiveness of the proposed modifications in enhancing classification precision on this dataset.
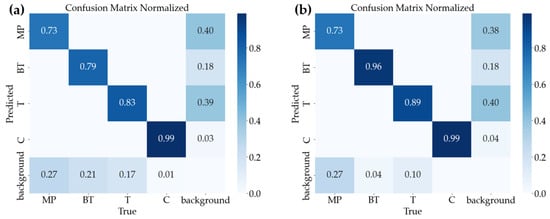
Figure 22.
Normalized confusion matrix comparison between YOLOv11n and YOLOv11n-SC (proposed) on Pepper Pest Dataset: (a) YOLOv11n; (b) YOLOv11n-SC.
In summary, the CARAFE emerges as a core component for enhancing YOLOv11n model accuracy due to its content-aware characteristics and computational efficiency, demonstrating particularly significant advantages in detail-sensitive small object detection scenarios. While the SEAM can optimize discriminative capability in high-occlusion scenarios, its performance gains remain limited. The combination of these two modules exhibits partial synergistic potential in complex background datasets, yet requires in-depth optimization regarding feature interaction mechanisms and computational load distribution.
4. Conclusions and Future Work
This study aims to develop a cloud-based intelligent greenhouse platform, named the CloudCropFuture platform, offering smarter and more efficient agricultural solutions. It integrates environmental monitoring, control systems, and intelligent crop analysis, which covers disease/pest detection, maturity, and freshness assessment. To enhance image quality, the ResShift model was introduced to boost resolution, and experiments confirmed its effectiveness across multiple YOLO models. We conducted extensive experiments on multiple crop datasets using various YOLO-based object detection algorithms to evaluate model performance. Users could choose suitable models based on specific application needs. Results showed that the enhanced YOLOv11n models performed well across datasets, supporting the feasibility and preliminary effectiveness of the approach in the agricultural scenarios evaluated.
The proposed platform and technical improvements achieve comprehensive coverage from environmental monitoring to intelligent crop analysis, laying a foundation for advancing modern agriculture. The integration of cloud computing and deep learning technologies shows promise for enhancing crop management efficiency and accuracy, with potential applications in precision agriculture and sustainable development.
Despite the preliminary achievements, this study has several limitations that need to be acknowledged:
- (1)
- Hardware Constraints: The current experimental validation was conducted under controlled hardware environments (e.g., stable network conditions). However, real-world agricultural settings often face challenges such as limited rural network bandwidth and unstable power supply, which may affect the platform’s deployment feasibility and real-time performance. The adaptability of the platform to low-resource hardware environments remains untested.
- (2)
- Training Data Availability: The model training and evaluation rely on existing public datasets, most of which are real-world data from actual farm environments. However, the Fruit Freshness Detection Dataset is lab-based. Despite this, the diversity in growth stages, environmental variations, and emerging pest/disease types may still be limited due to the availability of high-quality open-source datasets, potentially affecting the models’ robustness when facing real-world variations not covered in the training data.
- (3)
- Generalization Across Crop Species: The experimental datasets primarily cover a limited range of crop types. The performance of the proposed models on less-common crops has not been validated, limiting the generalizability of the findings across diverse agricultural scenarios.
- (4)
- Real-World System Evaluation Constraints: A comprehensive and scientific evaluation of the full system’s real-world performance, including its scalability, long-term reliability, and practical impact in operational agricultural settings, has not yet been completed. This limitation primarily stems from challenges in establishing long-term cooperation with commercial agricultural partners. Such partners are essential for accessing real farm environments, conducting multi-seasonal trials, and collecting on-site operational data. Consequently, the current validation remains confined to lab-based experiments, and the system’s real-world applicability requires further empirical testing.
To address the above limitations and advance the platform, future research will focus on the following directions:
- (1)
- Model Optimization: Optimizing the YOLOv11n-SC model structure to increase processing speed without sacrificing detection accuracy. Exploring new modules or technologies is also worth considering.
- (2)
- Cross-Domain Adaptability: Expanding research beyond limited crop datasets by exploring transfer learning and domain adaptation methods. This will enable existing models to quickly adapt to new crops or environments, reducing the need for large-scale labeled data for new crops and lowering training costs.
- (3)
- System Deployment and Long-Term Evaluation: Transitioning from proof-of-concept validation to real-world deployment. A thorough evaluation of the full system’s scalability, latency, and reliability in operational farm settings over multiple growing seasons will be conducted, focusing on the following: (a) System Performance Under Real-World Constraints: Measuring end-to-end latency, API throughput under concurrent user loads, and network bandwidth requirements in typical rural connectivity scenarios (e.g., unstable 4G/5G or satellite networks); (b) Fault Tolerance and Hardware Adaptability: Assessing system behavior under hardware-related challenges such as sensor outages, limited computing resources, and power disruptions, and developing lightweight backup mechanisms for low-resource environments; (c) Model Stability Across Diverse Scenarios: Evaluating long-term model performance across seasonal changes, emerging pests/diseases, and varying climatic conditions, using augmented training data to enhance robustness; (d) Practical Impact and Usability: Quantifying the platform’s influence on agricultural decision-making, resource efficiency, and productivity through structured pilot studies with partner farms, with a focus on usability for farmers with limited technical background.
- (4)
- Policy Support and Promotion: Collaborating with governments and agricultural institutions to promote policy incentives for intelligent greenhouse technology. Strengthening publicity and training programs will help raise awareness of intelligent agriculture among farmers, facilitating the adoption of the CloudCropFuture platform in practice.
This iterative optimization and empirical validation will be crucial to transforming the CloudCropFuture platform from a preliminary prototype into a scalable, resilient, and farmer-centric tool for precision agriculture.
Author Contributions
Conceptualization, R.C., B.S. and L.Y.; resources, Z.Z., B.S., X.Y. and L.Y.; writing—original draft preparation, R.C. and L.Y.; writing—review and editing, R.C., Z.Z. and Z.Y., L.Y.; supervision, Z.Y., X.Y. and L.Y.; project administration, J.Z., X.Y. and L.Y.; funding acquisition, Z.Z., X.Y. and L.Y. All authors have read and agreed to the published version of the manuscript.
Funding
This research was funded by the National Natural Science Foundation of China (NSFC) under Grants 62473121 and 62403416, in part by the Zhejiang Provincial Natural Science Foundation of China under Grant No. LZ25F030006, and in part by the National Training Program of Innovation and Entrepreneurship for Undergraduates under Grant 202410346055.
Institutional Review Board Statement
Not applicable.
Data Availability Statement
The raw data supporting the conclusions of this article will be made available by the authors on request.
Conflicts of Interest
The authors declare no conflicts of interest.
Appendix A
Table A1.
Experimental results of YOLO models on multiple datasets.
Table A1.
Experimental results of YOLO models on multiple datasets.
| Dataset | Method | P (%) | R (%) | mAP@0.5 (%) | FPS | Parameters | GFLOPs |
|---|---|---|---|---|---|---|---|
| Pepper Pest | YOLOv5n | 90.7 | 87.7 | 90.1 | 278.5 | 1,764,577 | 4.1 |
| YOLOv8n | 82.7 | 75.7 | 82.9 | 282.5 | 3,006,428 | 8.1 | |
| YOLOv9-t | 89.3 | 84.8 | 89.6 | 81.8 | 2,618,120 | 10.7 | |
| YOLOv10n | 90.4 | 87.1 | 92.2 | 177.3 | 2,695,976 | 8.2 | |
| YOLOv11n | 78.8 | 77.5 | 83.2 | 198.9 | 2,582,932 | 6.3 | |
| YOLOv11n-Se | 76.5 | 78.1 | 82.2 | 153.4 | 2,686,420 | 6.5 | |
| YOLOv11n-Ca | 87.7 | 82.5 | 89.0 | 171.5 | 2,723,036 | 6.6 | |
| YOLOv11n-SC | 87.3 | 81.8 | 88.6 | 136.4 | 2,826,524 | 6.8 | |
| Tea Leaf Disease | YOLOv5n | 96.9 | 83.3 | 99.0 | 287.4 | 1,769,989 | 4.2 |
| YOLOv8n | 89.5 | 99.2 | 98.9 | 272.1 | 3,007,028 | 8.1 | |
| YOLOv9-t | 96.6 | 83.0 | 99.1 | 81.3 | 2,619,680 | 10.7 | |
| YOLOv10n | 97.4 | 82.5 | 99.0 | 176.2 | 2,697,536 | 8.2 | |
| YOLOv11n | 87.7 | 99.2 | 99.0 | 198.4 | 2,583,712 | 6.3 | |
| YOLOv11n-Se | 97.1 | 82.3 | 91.9 | 153.5 | 2,687,200 | 6.5 | |
| YOLOv11n-Ca | 87.4 | 99.4 | 99.1 | 169.2 | 2,723,816 | 6.6 | |
| YOLOv11n-SC | 87.6 | 99.0 | 99.1 | 137.0 | 2,827,304 | 6.8 | |
| Tomato Leaf Disease | YOLOv5n | 77.0 | 89.0 | 88.3 | 286.2 | 1,768,636 | 4.2 |
| YOLOv8n | 76.2 | 86.7 | 84.3 | 284.6 | 3,007,013 | 8.1 | |
| YOLOv9-t | 75.1 | 78.0 | 82.3 | 81.4 | 2,619,290 | 10.7 | |
| YOLOv10n | 85.4 | 76.9 | 86.0 | 176.3 | 2697146 | 8.2 | |
| YOLOv11n | 77.7 | 85.9 | 83.2 | 196.1 | 2,583,517 | 6.3 | |
| YOLOv11n-Se | 71.7 | 86.4 | 82.5 | 152.1 | 2,687,005 | 6.5 | |
| YOLOv11n-Ca | 76.0 | 86.4 | 84.3 | 168.5 | 2,723,621 | 6.6 | |
| YOLOv11n-SC | 77.3 | 86.8 | 83.2 | 136.1 | 2,827,109 | 6.8 | |
| Original Tea Leaf Age | YOLOv5n | 73.9 | 86.1 | 86.1 | 274.7 | 1,764,577 | 4.1 |
| YOLOv8n | 83.2 | 77.4 | 83.2 | 271.5 | 3,006,428 | 8.1 | |
| YOLOv9-t | 88.9 | 79.8 | 89.1 | 81.8 | 2,618,120 | 10.7 | |
| YOLOv10n | 83.0 | 81.1 | 87.2 | 178.9 | 2,695,976 | 8.2 | |
| YOLOv11n | 80.3 | 82.7 | 87.0 | 196.7 | 2,582,932 | 6.3 | |
| YOLOv11n-Se | 83.2 | 76.2 | 84.2 | 151.2 | 2,686,420 | 6.5 | |
| YOLOv11n-Ca | 81.9 | 77.5 | 86.0 | 171.2 | 2,723,036 | 6.6 | |
| YOLOv11n-SC | 86.4 | 80.0 | 87.9 | 138.5 | 2,826,524 | 6.8 |
Appendix B

Figure A1.
Detection results (with inaccuracies highlighted by red ellipses) of the Pepper Pest Dataset via YOLOv11n and YOLOv11n-SC (proposed): (a1–d1) and (a2–d2) show the results of YOLOv11n and YOLOv11n-SC, respectively.

Figure A2.
Detection results (with inaccuracies highlighted by red ellipses) of the Tea Leaf Disease Dataset via YOLOv11n and YOLOv11n-SC (proposed): (a1–d1) and (a2–d2) show the results of YOLOv11n and YOLOv11n-SC, respectively.

Figure A3.
Detection results (with inaccuracies highlighted by red ellipses) of the Tomato Leaf Disease Dataset via YOLOv11n and YOLOv11n-SC (proposed): (a1–d1) and (a2–d2) show the results of YOLOv11n and YOLOv11n-SC, respectively.
References
- Tong, Y.-S.; Lee, T.-H.; Yen, K.-S. Deep Learning for Image-Based Plant Growth Monitoring: A Review. Int. J. Eng. Technol. Innov. 2022, 12, 225–246. [Google Scholar] [CrossRef]
- Min, X.; Ye, Y.; Xiong, S.; Chen, X. Computer Vision Meets Generative Models in Agriculture: Technological Advances, Challenges and Opportunities. Appl. Sci. 2025, 15, 7663. [Google Scholar] [CrossRef]
- Friha, O.; Ferrag, M.A.; Shu, L.; Maglaras, L.; Wang, X. Internet of Things for the Future of Smart Agriculture: A Comprehensive Survey of Emerging Technologies. IEEE/CAA J. Autom. Sin. 2021, 8, 718–752. [Google Scholar] [CrossRef]
- Li, H.; Guo, Y.; Zhao, H.; Wang, Y.; Chow, D. Towards Automated Greenhouse: A State of the Art Review on Greenhouse Monitoring Methods and Technologies Based on Internet of Things. Comput. Electron. Agric. 2021, 191, 106558. [Google Scholar] [CrossRef]
- Jia, W.; Guo, Z.; Zhang, W.; Zhang, H.; Liu, B. MSFNet: A Multi-Source Fusion-Based Method with Enhanced Hierarchical Spectral Semantic Perception for Wheat Disease Region Classification. Appl. Sci. 2025, 15, 7317. [Google Scholar] [CrossRef]
- Padhiary, M.; Saha, D.; Kumar, R.; Sethi, L.N.; Kumar, A. Enhancing Precision Agriculture: A Comprehensive Review of Machine Learning and AI Vision Applications in All-Terrain Vehicle for Farm Automation. Smart Agric. Technol. 2024, 8, 100483. [Google Scholar] [CrossRef]
- Liu, J.; Wang, X. Plant Diseases and Pests Detection Based on Deep Learning: A Review. Plant Methods 2021, 17, 22. [Google Scholar] [CrossRef]
- Hoque, A.; Padhiary, M. Automation and AI in Precision Agriculture: Innovations for Enhanced Crop Management and Sustainability. Asian J. Res. Comput. Sci. 2024, 17, 95–109. [Google Scholar] [CrossRef]
- Wang, D.; Zhang, M.; Li, M.; Lin, J. Fruits and Vegetables Preservation Based on AI Technology: Research Progress and Application Prospects. Comput. Electron. Agric. 2024, 226, 109382. [Google Scholar] [CrossRef]
- S.S., V.C.; S., A.H.; Albaaji, G.F. Precision Farming for Sustainability: An Agricultural Intelligence Model. Comput. Electron. Agric. 2024, 226, 109386. [Google Scholar] [CrossRef]
- Lasri, I.; Douiri, S.M.; El-Marzouki, N.; Riadsolh, A.; Elbelkacemi, M. YOLO-Based Approach for Intelligent Apple Crop Health Assessment. In Artificial Intelligence, Data Science and Applications; Lecture Notes in Networks and Systems; Springer: Cham, Switzerland, 2024; Volume 838, pp. 71–77. [Google Scholar] [CrossRef]
- Rabbani, A.; Hussain, M. YOLOv1 to YOLOv10: A Comprehensive Review of YOLO Variants and Their Application in the Agricultural Domain. arXiv 2024. [Google Scholar] [CrossRef]
- Yue, G.; Liu, Y.; Niu, T.; Liu, L.; An, L.; Wang, Z.; Duan, M. GLU-YOLOv8: An Improved Pest and Disease Target Detection Algorithm Based on YOLOv8. Forests 2024, 15, 1486. [Google Scholar] [CrossRef]
- Goyal, R.; Nath, A.; Niranjan, U. Weed Detection Using Deep Learning in Complex and Highly Occluded Potato Field Environment. Crop Prot. 2024, 187, 106948. [Google Scholar] [CrossRef]
- Xiao, B.; Nguyen, M.; Yan, W.Q. Fruit Ripeness Identification Using YOLOv8 Model. Multimed. Tools Appl. 2023, 83, 28039–28056. [Google Scholar] [CrossRef]
- Dinca, M.A.; Popescu, D.; Ichim, L.; Angelescu, N. Ensemble of Efficient Vision Transformers for Insect Classification. Appl. Sci. 2025, 15, 7610. [Google Scholar] [CrossRef]
- Yang, G.; Wang, J.; Nie, Z.; Yang, H.; Yu, S. A Lightweight YOLOv8 Tomato Detection Algorithm Combining Feature Enhancement and Attention. Agronomy 2023, 13, 1824. [Google Scholar] [CrossRef]
- Wei, J.; Ni, L.; Luo, L.; Chen, M.; You, M.; Sun, Y.; Hu, T. GFS-YOLO11: A Maturity Detection Model for Multi-Variety Tomato. Agronomy 2024, 14, 2644. [Google Scholar] [CrossRef]
- Diwan, T.; Anirudh, G.; Tembhurne, J.V. Object Detection Using YOLO: Challenges, Architectural Successors, Datasets and Applications. Multimed. Tools Appl. 2022, 82, 9243–9275. [Google Scholar] [CrossRef] [PubMed]
- Sharma, S. Manu Vardhan Advancing Precision Agriculture: Enhanced Weed Detection Using the Optimized YOLOv8T Model. Arab. J. Sci. Eng. 2024, 50, 7343–7360. [Google Scholar] [CrossRef]
- Cui, B.; Liang, L.; Ji, B.; Zhang, L.; Zhao, L.; Zhang, K.; Shi, F. Jean-Charles Créput Exploring the YOLO-FT Deep Learning Algorithm for UAV-Based Smart Agriculture Detection in Communication Networks. IEEE Trans. Netw. Serv. Manag. 2024, 21, 5347–5360. [Google Scholar] [CrossRef]
- Lei, Z.; Zhang, Y.; Wang, J.; Zhou, M. Cloud-Edge Collaborative Defect Detection Based on Efficient Yolo Networks and Incremental Learning. Sensors 2024, 24, 5921. [Google Scholar] [CrossRef]
- Dai, M.; Dorjoy, H.; Miao, H.; Zhang, S. A New Pest Detection Method Based on Improved YOLOv5m. Insects 2023, 14, 54. [Google Scholar] [CrossRef]
- Zhang, X.; Bu, J.; Zhou, X.; Wang, X. Automatic Pest Identification System in the Greenhouse Based on Deep Learning and Machine Vision. Front. Plant Sci. 2023, 14, 1255719. [Google Scholar] [CrossRef]
- Vishwakarma, A.; Sahu, A.; Sheikh, N.; Payasi, P.; Rajput, S.K.; Srivastava, L. IOT Based Greenhouse Monitoring and Controlling System. In Proceedings of the 2020 IEEE Students Conference on Engineering & Systems (SCES), Prayagraj, India, 10–12 July 2020; IEEE: New York, NY, USA, 2020. [Google Scholar] [CrossRef]
- Wang, X.; Liu, J. Vegetable Disease Detection Using an Improved YOLOv8 Algorithm in the Greenhouse Plant Environment. Sci. Rep. 2024, 14, 4261. [Google Scholar] [CrossRef]
- Sohl-Dickstein, J.; Weiss, E.A.; Maheswaranathan, N.; Ganguli, S. Deep Unsupervised Learning Using Nonequilibrium Thermodynamics. In Proceedings of the 32nd International Conference on International Conference on Machine Learning, Lille, France, 6 July 2015. [Google Scholar]
- Shao, S.; Wang, P.; Yan, R. Generative Adversarial Networks for Data Augmentation in Machine Fault Diagnosis. Comput. Ind. 2019, 106, 85–93. [Google Scholar] [CrossRef]
- Gao, D. Automatic Target Detection in Vehicle Images Based on YOLOv10 Deep Learning Algorithm. Appl. Comput. Eng. 2024, 88, 171–178. [Google Scholar] [CrossRef]
- Shen, J.; Wang, Q.; Zhao, M.; Hu, J.; Wang, J.; Shu, M.; Liu, Y.; Guo, W.; Qiao, H.; Niu, Q.; et al. Mapping Maize Planting Densities Using Unmanned Aerial Vehicles, Multispectral Remote Sensing, and Deep Learning Technology. Drones 2024, 8, 140. [Google Scholar] [CrossRef]
- Aibin, M.; Li, Y.; Sharma, R.; Ling, J.; Ye, J.; Lu, J.; Zhang, J.; Coria, L.; Huang, X.; Yang, Z.; et al. Advancing Forest Fire Risk Evaluation: An Integrated Framework for Visualizing Area-Specific Forest Fire Risks Using UAV Imagery, Object Detection and Color Mapping Techniques. Drones 2024, 8, 39. [Google Scholar] [CrossRef]
- Jocher, G. Ultralytics/Yolov5. Available online: https://github.com/ultralytics/yolov5 (accessed on 22 October 2024).
- Jocher, G.; Chaurasia, A.; Qiu, J. YOLOv8 by Ultralytics. Available online: https://github.com/ultralytics/ultralytics (accessed on 9 March 2024).
- Wang, C.-Y.; Yeh, I.-H.; Liao, H.-Y.M. YOLOv9: Learning What You Want to Learn Using Programmable Gradient Information. In Proceedings of the 18th European Conference on Computer Vision (ECCV 2024), Milan, Italy, 29 September–4 October 2024. [Google Scholar]
- Wang, A.; Chen, H.; Liu, L.; Chen, K.; Lin, Z.; Han, J.; Ding, G. YOLOv10: Real-Time End-to-End Object Detection. Available online: https://arxiv.org/abs/2405.14458 (accessed on 29 May 2024).
- Jocher, G.; Qiu, J. Ultralytics YOLO11 (Version 11.0.0). Available online: https://github.com/ultralytics/ultralytics (accessed on 5 October 2024).
- Khanam, R.; Hussain, M. YOLOv11: An Overview of the Key Architectural Enhancements. arXiv 2024. [Google Scholar] [CrossRef]
- Yue, Z.; Wang, J.; Loy, C.C. Resshift: Efficient diffusion model for image super-resolution by residual shifting. Adv. Neural Inf. Process. Syst. 2023, 36, 13294–13307. [Google Scholar]
- Wang, Y.; Zhang, J.; Kan, M.; Shan, S.; Chen, X. Self-Supervised Equivariant Attention Mechanism for Weakly Supervised Semantic Segmentation. In Proceedings of the 2020 IEEE/CVF Conference on Computer Vision and Pattern Recognition (CVPR), Seattle, WA, USA, 14–19 June 2020. [Google Scholar]
- Wang, J.; Chen, K.; Xu, R.; Liu, Z.; Loy, C.C.; Lin, D. CARAFE: Content-Aware ReAssembly of FEatures. In Proceedings of the 2019 IEEE/CVF International Conference on Computer Vision (ICCV), Seoul, Republic of Korea, 27 October–2 November 2019. [Google Scholar]
Disclaimer/Publisher’s Note: The statements, opinions and data contained in all publications are solely those of the individual author(s) and contributor(s) and not of MDPI and/or the editor(s). MDPI and/or the editor(s) disclaim responsibility for any injury to people or property resulting from any ideas, methods, instructions or products referred to in the content. |
© 2025 by the authors. Licensee MDPI, Basel, Switzerland. This article is an open access article distributed under the terms and conditions of the Creative Commons Attribution (CC BY) license (https://creativecommons.org/licenses/by/4.0/).