Featured Application
A novel, non-destructive imaging method for observing the Meissner effect in superconductors is demonstrated in this work, using miniaturized scanning quantum magnetometry based on solid-state defect qubits. This approach enables the direct visualization of magnetic field profiles, offering a practical and accessible way to characterize superconducting properties. The technique is well-suited for applications in science education and as an early-stage diagnostic tool for identifying superconductivity.
Abstract
The direct visualization of the Meissner effect is achieved by mapping the expulsion of static magnetic fields from a high-
superconductor, specifically Yttrium Barium Copper Oxide (YBCO). This is accomplished using a miniaturized scanning magnetometer based on an ensemble of nitrogen-vacancy (NV) centers in diamond, operating under ambient room-temperature conditions. By comparing the magnetic field profiles above the YBCO sample at temperatures above and below its critical temperature , we observe clear suppression and distortion of the magnetic field in the superconducting state. These observations are consistent with both magnetic simulations and expected characteristics of the Meissner effect. This work introduces a novel and practical method for visualizing the Meissner effect, offering potential applications in educational demonstrations and the diagnostic testing of superconductivity using room-temperature quantum magnetometry.
1. Introduction
The Meissner effect is one of the most compelling signatures of superconductivity, characterized by the expulsion of external magnetic fields when a material is cooled below its critical temperature and enters the superconducting state [1]. This phenomenon results in the levitation of a superconductor above a magnet and underpins various practical applications, such as magnetic levitation trains [2,3]. The Meissner effect occurs in both type-I and type-II superconductors; however, while type-I superconductors exhibit complete magnetic flux expulsion below their critical field , type-II superconductors allow partial penetration through vortices or mixed states, which exist between the lower and upper critical fields ( and ) [4]. The Meissner effect has been experimentally studied using a range of techniques, including [5,6,7]. More recently, quantum magnetometry based on solid-state defects, particularly nitrogen-vacancy (NV) centers in diamond, has enabled the highly sensitive, high-resolution imaging of magnetic fields [8,9,10,11,12,13]. NV-based techniques such as nanometer-scale scanning magnetometry and micrometer-scale wide-field microscopy have been used to image magnetic vortices in type-II superconductors [14]. Additionally, NV centers have been used to confirm superconductivity by observing the Meissner effect below the transition temperatures and high pressures. Although most of these measurements require cryogenic environments, a method that allows the direct visualization of the Meissner effect under ambient, room-temperature conditions can offer intuitive insight into superconducting phenomena, especially for educational and demonstrational purposes.
In this paper, we demonstrate a miniaturized scanning magnetometer with millimeter-scale resolution operating at ambient room temperature, which is used to map static magnetic field profiles over an Yttrium Barium Copper Oxide (YBCO) high-Tc superconductor levitated by external magnets. Note that even if the YBCO is cooled by liquid nitrogen, the sensor operates under ambient conditions [15,16]. By comparing the magnetic field distributions above the YBCO disk at temperatures above and below its critical temperature, we observe a clear suppression of the magnetic field in the superconducting state, consistent with the Meissner effect.
This method offers a novel approach for visualizing the Meissner effect using quantum magnetometers. It serves as an easy-to-use tool for educational demonstrations of superconductivity and experimental technique for the simple characterization of superconductors.
2. Experimental Methods
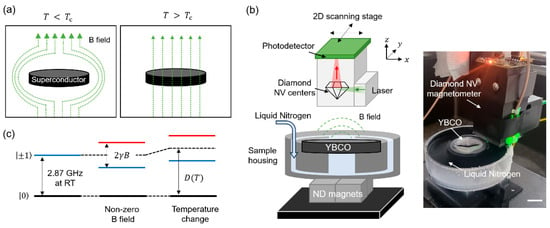
Figure 1a illustrates the Meissner effect, in which an external magnetic field is expelled from a superconductor when cooled down below its critical temperature, . Measuring magnetic field profiles above and below allows the direct visualization of the Meissner effect, which is the primary goal of this study. To achieve this, we use a custom-built scanning magnetometer equipped with ensemble NV centers, capable of scanning a two-dimensional (2D) area with millimeter-scale resolution.

Figure 1.
Miniaturized scanning magnetometry. (a) Schematics illustration of the Meissner effect. When a superconductor is cooled below critical temperature , it enters the superconducting state and expels magnetic fields. (b) Schematic and photograph of the miniaturized scanning magnetometer and the YBCO sample stage. The magnetometer’s vertical position can be adjusted using a micromanipulator, and two stepper motors enable scanning in two lateral (2D) directions. Ensemble NV centers in diamond, located at the bottom of the sensor, detect static magnetic fields from the sample. The YBCO disk is positioned in a plastic housing placed atop four Nd magnets, and is continuously cooled by liquid nitrogen. Scale bar = 2 cm. (c) Energy level diagrams of the NV center. The relative energy splitting between the states is used to measure static magnetic fields along the NV’s crystal axis (), while their common shift relative to the state is sensitive to temperature changes via the temperature-dependent zero-field splitting, .
Figure 1b presents the schematic and photograph of the scanning magnetometer. It consists of a fiber-coupled compact NV-based quantum sensor and a mobile 2D scanning stage driven by two stepper motors along guiding rails.
The quantum sensor contains ensemble NV centers in a type 1b diamond plate (3 mm 3 mm 0.3 mm, oriented along the <100> crystal direction) with an NV density of 1013/cm3. The sensor is integrated with optics, including lenses, dichroic filter, and a photodetector. A fiber-coupled 532 nm external laser (24 mW) is collimated and focused onto the diamond using a fiber collimator and a gradient-index (GRIN) lens to excite the NV centers. Photoluminescence (PL) from the NV centers is collected by the same GRIN lens and detected by the photodetector after filtering through the dichroic mirror. A Microwave field around 3 GHz, generated externally and amplified, is delivered to the sensor via a coaxial cable and an integrated double split-ring resonator. Further details on the magnetometer design are available in Ref. [17].
The scanning magnetometer is positioned above a 3D-printed plastic housing that holds a high- superconductor. In this study, we use a commercial Yttrium Barium Copper Oxide (YBCO) disk (Quantum Levitation, Rehovot, Israel) with a diameter of 4.5 cm and thickness of 0.8 cm. Four neodymium (Nd) magnets (1.5 cm 1.5 cm 1 cm each) are placed below the disk to generate magnetic fields for the levitation and lateral stabilization of the superconducting disk. The housing includes a container for liquid nitrogen to cool the YBCO below ( = 93 K) [18]. Liquid nitrogen is continuously supplied to maintain the superconducting phase. The housing is also designed to prevent the tilting of the YBCO disk during operation.
Figure 1c shows the ground-state spin levels of the NV center. The ground-state spin Hamiltonian is expressed as
where is the spin-1 operator, is its z-component, is the temperature-dependent zero-field splitting (ZFS), is the NV gyromagnetic ratio (2.8 ), and is the external magnetic field. The NV’s spin-1 ground state includes , ±1, with separated from the degenerate states by 2.87 GHz at room temperature. The value of varies with temperature due to changes in the spin–spin interaction induced by thermal expansion or contraction of the diamond lattice. A static magnetic field lifts the degeneracy between via the Zeeman effect.
Initialization and readout of the NV’s spin states are achieved optically. Electron spin resonances are detected through a reduction in the NV’s PL signal when the microwave frequency matches the spin transition between either and or and . This technique, known as optically detected magnetic resonance (ODMR), enables identifying the resonance frequencies and detection of static magnetic fields by measuring their shifts. Beyond magnetic field sensing, the NV center can also be used to monitor temperature changes. This is performed by measuring the common shifts in the states relative to the , since is temperature-dependent. In this study, we use the frequency difference between the states (Zeeman splitting) to detect the magnetic field above YBCO while simultaneously measuring their common shifts, i.e., D(T), to probe the temperature of YBCO.
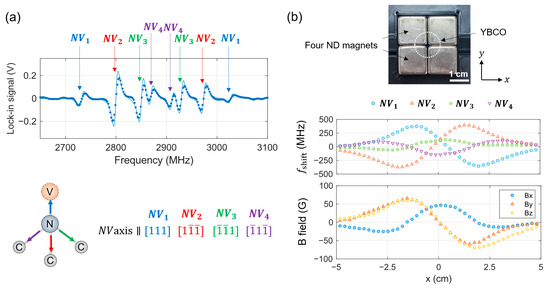
In a diamond crystal, there are four possible NV orientations, i.e., , , , and . The NV center is sensitive to magnetic fields projected along its crystal axis (or quantization axis). Since our quantum sensor is based on an ensemble of NV centers containing about an equal number of all orientations, we can measure magnetic field components along four different spatial directions, enabling vector magnetometry. As a result, the ODMR spectrum exhibits four pairs of Zeeman-split resonances.
To improve the signal-to-noise ratio, we applied lock-in detection to the ODMR spectrum. The PL signal was modulated using an oscillating microwave field and demodulated with a lock-in amplifier. An example of the resulting lock-in data is shown in Figure 2a, clearly displaying four pairs of spin resonances. By analyzing the frequency shifts in the four NV center groups, we can reconstruct the magnitude and direction of the magnetic field from the Nd magnets through the YBCO sample, both below and above .

Figure 2.
Vector magnetometry using four NV orientations. (a) Lock-in detection of the ODMR spectrum reveals four pairs of NV spin resonances, corresponding to the four crystallographic orientations of NV centers in the diamond lattice. The bottom panel illustrates the diamond crystal structure and the four possible NV axes. (b) Top: photograph of the four Nd magnets. The dashed circle marks the size and position of the YBCO disk on top of the magnets. Middle: frequency shifts () of the four NV orientations as the magnetometer scans along the x-axis over the magnets. The coordinate (x, y) = (0, 0) corresponds to the center of the Nd magnet array. Bottom: 3D magnetic field components (, , and ) reconstructed from the frequency shift data shown in the middle panel.
Figure 2b presents an example of frequency shifts measured as the magnetometer scans along the x-axis above the YBCO surface at room temperature () with the y-position fixed at y = −0.5 cm. The vertical distance (along the z-axis) between the magnetometer and the YBCO surface is maintained at h = 1.7 cm. These measurements capture the magnetic field from the Nd magnets when the YBCO is in its normal (non-superconducting) state. Note that the resonance frequencies from the NV center groups may coincide with certain magnetic field values; however, their frequencies can still be resolved by analyzing the continuous frequency shift profiles along the scan path. From the frequency shifts corresponding to the four NV orientations in Figure 2a, we extract the three-dimensional (3D) magnetic field components, , , and as shown in the bottom panel of Figure 2b.
3. Results and Discussion
3.1. Comparison of Magnetic Field Profiles Below and Above
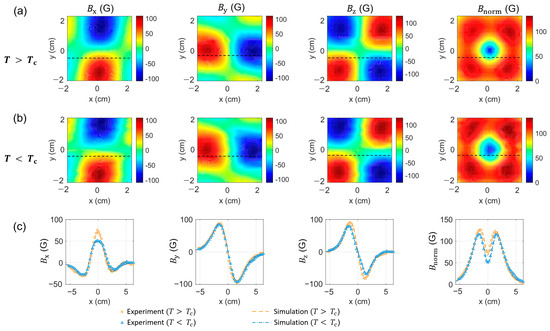
Figure 3 compares the magnetic field profiles of the YBCO disk below and above Tc. The scanning magnetometer was positioned h = 1.7 cm above the YBCO surface, and scanned an area of 4.3 cm 4.3 cm with a step size of 2.15 mm. Measurement in each step took a total of 20 s, including time for both data acquisition (18 s) and vibration settling after translation (2 s). Using vector magnetometry with four NV orientations, we obtained 3D magnetic field components, , , and . We also computed the total magnetic field magnitude, , to visualize the overall magnetic field strength.

Figure 3.
Comparison of magnetic field profiles above and below , (a,b) Experimental images of the magnetic field components , , and at (a) and (b). (c) Linecut data of , , and along the dashed lines in (a,b). Circular and triangular makers represent experimental data, while dashed and dot-dashed curves indicate corresponding simulation results. Note that the linecuts are taken at a greater distance along the x-axis.
At room temperature (), the NV centers image stray magnetic fields from the four Nd magnets, as shown in Figure 3a. In contrast, at (cooled with liquid nitrogen), the magnetic fields from the magnets are suppressed above the YBCO due to the Meissner effect, as illustrated in Figure 3b. This suppression is more clearly visualized in the linecut data. For example, Figure 3c presents a linecut at y = −0.5 cm, where a significant reduction in the component is visible compared to the component. Conversely, if the linecut is taken along the y-axis, the situation is reversed, with the reduction in the component becoming more pronounced than that in the component. Additionally, both the maps and linecut profiles demonstrate the suppression of magnetic fields above the YBCO disk below .
We also performed magnetic simulations using COMSOL Multiphysics 5.4. The model incorporated the magnetic properties of Nd, the sample-sensor separation h = 1.7 cm, and the superconducting properties of YBCO (assuming perfect diamagnetism below ). The simulation results closely match the experimental data, as indicated by the dashed and dot-dashed curves in Figure 3c.
3.2. Magnetic Field Profiles as a Function of Distance from YBCO
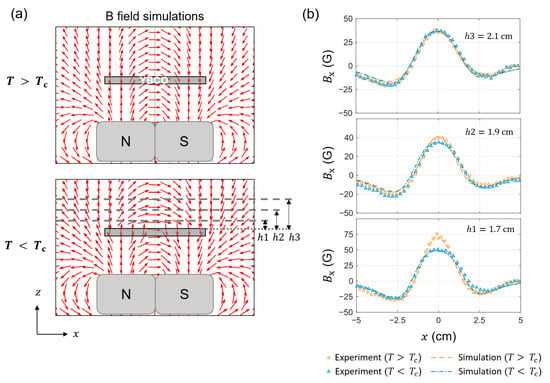
To further confirm the Meissner effect, we performed additional linecut measurements under the same conditions as in Figure 3c, but at three different heights above the YBCO surface: h1 = 1.7 cm, h2 = 1.9 cm, and h3 = 2.1 cm. Figure 4a shows COMSOL simulations of the magnetic field cross-section (x − z plane) from the Nd magnets interacting with the YBCO disk, above and below . Figure 4b presents the corresponding linecut measurements. The experimental data (circular and triangular markers) agree well with the simulations (dashed and dot-dashed lines). At greater distances (e.g., h3), the magnetic field profiles are nearly identical for both above and below , indicating a minimal shielding effect. In contrast, at closer distances (e.g., h1), the difference between the profiles above and below becomes more pronounced, consistent with the expected Meissner effect, where magnetic field suppression and distortion are strongest near the superconductor surface.

Figure 4.
Magnetic field profiles at various heights from the YBCO disk. (a) Simulated magnetic field profiles from the Nd magnets when the YBCO disk is at (top) and (bottom), showing the expected field distribution with and without the Meissner effect. (b) Experimental measurements of the components at three different heights above the YBCO surface: h1 = 1.7 cm, h2 = 1.9 cm, and h3 = 2.1 cm, as shown in (a). Circular and triangular makers represent data at and , respectively. Dashed and dot-dashed curves are corresponding simulation results.
3.3. Temperature Imaging of YBCO
As discussed in Section 2 and shown in Figure 1c, the NV center can also detect temperature changes by monitoring the common shift in the level relative to through the temperature dependence of . While measuring Zeeman splitting to determine the static magnetic field, we simultaneously extracted the common frequency shift , which was used to determine the temperature above YBCO. Figure 5 shows linecut measurements of at two heights: h1 = 1.7 cm and h3 = 2.1 cm, with the YBCO cooled below . At the farther distance (h3), the frequency shift (and hence temperature) remains nearly constant. However, at the closer distance (h1), we observe significant spatial variations in , indicating that the NV centers detect the temperature above the YBCO via thermal radiation.

Figure 5.
Sensing temperature changes from the YBCO disk. During the magnetic field measurements at shown in Figure 4b, the magnetometer simultaneously detects shifts in the common frequency . Using the temperature-dependence of the zero-field splitting (), we extract relative temperature changes induced by the YBCO. Data are shown for two different vertical distances from the YBCO surface: h1 = 1.7 cm and h3 = 2.1 cm, highlighting the distance-dependent thermal radiation from the cooled superconductor.
To convert into the temperature, we used the relation , which is valid in the temperature range of 280–330 K [10]. Although this rate becomes nonlinear at lower temperatures and may not yield precise temperature values, it provides qualitative evidence that the YBCO is below its critical temperature. For precise temperature estimation, calibration with an additional thermometer and the use of accurate values at low temperatures would be required [19].
4. Conclusions
In this work, we present a novel approach for visualizing the Meissner effect by directly imaging magnetic fields interacting with a superconductor. We employ A miniaturized scanning magnetometry based on diamond NV centers to map the static magnetic field profiles produced by Nd magnets above a YBCO high- superconductor. When the YBCO is cooled below its critical temperature, the magnetic fields from the Nd magnets are expelled and distorted due to the Meissner effect. By measuring the resonance frequencies of four NV center orientations, we perform vector magnetometry, allowing us to determine both the magnitude and direction of local magnetic fields.
By comparing the magnetic images obtained above and below , we observe a clear suppression of the magnetic field when YBCO enters the superconducting state. This suppression becomes more pronounced as the sensor approaches the YBCO surface, consistent with magnetic simulations and expected spatial characteristics of the Meissner effect. Simultaneously, by tracking the common frequency shift in the NV center spin states, we qualitatively monitor temperature changes above the YBCO disk and confirm sufficient cooling below .
The method demonstrated here offers an accessible and non-invasive approach to visualize the Meissner effect and probe superconductivity using an experimental setup that operates at room temperature ambient conditions, even while the superconductor itself is cryogenically cooled. Although a YBCO disk is used as an example in this study, the method can be readily extended to other superconductors with diverse geometries, such as wires, tapes, or bulk samples, provided that the magnetic field profiles are large enough to be resolved by the sensor. This makes the technique well-suited for both educational and research applications, enabling the intuitive and direct visualization of magnetic field distributions over superconductors.
Author Contributions
W.C., C.P., J.P., D.L. (Dongkwon Lee) and D.L. (Donghun Lee) conceived and designed the experiments; W.C., C.P., M.L., H.-Y.K., K.Y.L., S.D.L. and D.J.C. constructed the experimental setup; W.C., C.P. and J.P. performed the experiments, analysis, and simulations; S.-H.K. and D.L. (Donghun Lee) directed and supervised the project; W.C., C.P. and D.L. (Donghun Lee) wrote the manuscript with contributions from all co-authors. All authors have read and agreed to the published version of the manuscript.
Funding
This work was supported by a grant to the Defense Specialized Project funded by the Defense Acquisition Program Administration and the Agency for Defense Development of South Korea.
Institutional Review Board Statement
Not applicable.
Informed Consent Statement
Not applicable.
Data Availability Statement
The data presented in this study are available on request from the corresponding author due to privacy concerns.
Conflicts of Interest
Authors Myeongwon Lee, Hong-Yeol Kim, Keun Young Lee, Sung Dan Lee, Dong Jae Cheon and Seong-Hyok Kim were employed by the LG Electronics Inc. The remaining authors declare that the research was conducted in the absence of any commercial or financial relationships that could be construed as a potential conflict of interest.
Abbreviations
The following abbreviations are used in this manuscript:
| YBCO | Yttrium Barium Copper Oxide |
| NV | Nitrogen-vacancy |
| Nd | Neodymium |
| PL | Photoluminescence |
| GRIN | Gradient-index |
| ZFS | Zero-field splitting |
| ODMR | Optically detected magnetic resonance |
References
- Meissner, W.; Ochsenfeld, R. Ein Neuer Effekt Bei Eintritt Der Supraleitfähigkeit. Naturwissenschaften 1933, 21, 787–788. [Google Scholar] [CrossRef]
- Zhu, Q.; Wang, S.-M.; Ni, Y.-Q. A Review of Levitation Control Methods for Low- and Medium-Speed Maglev Systems. Buildings 2024, 14, 837. [Google Scholar] [CrossRef]
- Lee, E.; Ma, K.B.; Wilson, T.L.; Chu, W.-K. Superconductor-Magnet Bearings with Inherent Stability and Velocity-Independent Drag Torque. In Proceedings of the 1999 IEEE/ASME International Conference on Advanced Intelligent Mechatronics (Cat. No.99TH8399), Atlanta, GA, USA, 19–23 September 1999; pp. 806–811. [Google Scholar]
- Saipuddin, S.F.; Hashim, A.; Suhaimi, N.E. Type I and Type II Superconductivity. In Superconducting Materials: Fundamentals, Synthesis and Applications; Slimani, Y., Hannachi, E., Eds.; Springer Nature: Singapore, 2022; pp. 123–146. ISBN 978-981-19-1211-5. [Google Scholar]
- Nishio, T.; Dao, V.H.; Chen, Q.; Chibotaru, L.F.; Kadowaki, K.; Moshchalkov, V.V. Scanning SQUID Microscopy of Vortex Clusters in Multiband Superconductors. Phys. Rev. B 2010, 81, 020506. [Google Scholar] [CrossRef]
- Coffey, M.W. Magnetic Force Microscopy of Layered Superconductors. Phys. Rev. B 2000, 61, 15361–15369. [Google Scholar] [CrossRef]
- Loudon, J.C.; Midgley, P.A. Imaging Flux Vortices in Type II Superconductors with a Commercial Transmission Electron Microscope. Ultramicroscopy 2009, 109, 700–729. [Google Scholar] [CrossRef] [PubMed]
- On Ho, K.; Kuen Leung, W.; Yung Pang, Y.; Yau Yip, K.; Xie, J.; Man Liu, Y.; Sofia Rotelli, A.; Yin Leung, M.; Yin Chow, H.; To Lai, K.; et al. Studying Critical Parameters of Superconductor via Diamond Quantum Sensors. New J. Phys. 2025, 27, 023013. [Google Scholar] [CrossRef]
- Waxman, A.; Schlussel, Y.; Groswasser, D.; Acosta, V.M.; Bouchard, L.-S.; Budker, D.; Folman, R. Diamond Magnetometry of Superconducting Thin Films. Phys. Rev. B 2014, 89, 054509. [Google Scholar] [CrossRef]
- Xu, Y.; Yu, Y.; Hui, Y.Y.; Su, Y.; Cheng, J.; Chang, H.-C.; Zhang, Y.; Shen, Y.R.; Tian, C. Mapping Dynamical Magnetic Responses of Ultrathin Micron-Size Superconducting Films Using Nitrogen-Vacancy Centers in Diamond. Nano Lett. 2019, 19, 5697–5702. Available online: https://pubs.acs.org/doi/10.1021/acs.nanolett.9b02298 (accessed on 25 July 2025). [CrossRef] [PubMed]
- Joshi, K.R.; Nusran, N.M.; Tanatar, M.A.; Cho, K.; Meier, W.R.; Bud’ko, S.L.; Canfield, P.C.; Prozorov, R. Measuring the Lower Critical Field of Superconductors Using Nitrogen-Vacancy Centers in Diamond Optical Magnetometry. Phys. Rev. Appl. 2019, 11, 014035. [Google Scholar] [CrossRef]
- Nusran, N.M.; Joshi, K.R.; Cho, K.; Tanatar, M.A.; Meier, W.R.; Bud’ko, S.L.; Canfield, P.C.; Liu, Y.; Lograsso, T.A.; Prozorov, R. Spatially-Resolved Study of the Meissner Effect in Superconductors Using NV-Centers-in-Diamond Optical Magnetometry. New J. Phys. 2018, 20, 043010. [Google Scholar] [CrossRef]
- Pelliccione, M.; Jenkins, A.; Ovartchaiyapong, P.; Reetz, C.; Emmanouilidou, E.; Ni, N.; Bleszynski Jayich, A.C. Scanned Probe Imaging of Nanoscale Magnetism at Cryogenic Temperatures with a Single-Spin Quantum Sensor. Nat. Nanotechnol. 2016, 11, 700–705. [Google Scholar] [CrossRef] [PubMed]
- Dailledouze, C.; Hilberer, A.; Schmidt, M.; Adam, M.-P.; Toraille, L.; Ho, K.O.; Forget, A.; Colson, D.; Loubeyre, P.; Roch, J.-F. Imaging the Meissner Effect and Flux Trapping of Superconductors under High Pressure Using N-V Centers. Phys. Rev. Appl. 2025, 23, 064067. [Google Scholar] [CrossRef]
- Le Sage, D.; Arai, K.; Glenn, D.R.; DeVience, S.J.; Pham, L.M.; Rahn-Lee, L.; Lukin, M.D.; Yacoby, A.; Komeili, A.; Walsworth, R.L. Optical Magnetic Imaging of Living Cells. Nature 2013, 496, 486–489. [Google Scholar] [CrossRef] [PubMed]
- Barry, J.F.; Schloss, J.M.; Bauch, E.; Turner, M.J.; Hart, C.A.; Pham, L.M.; Walsworth, R.L. Sensitivity Optimization for NV-Diamond Magnetometry. Rev. Mod. Phys. 2020, 92, 015004. [Google Scholar] [CrossRef]
- Choi, W.; Park, C.; Lee, D.; Park, J.; Lee, M.; Kim, H.-Y.; Lee, K.-Y.; Lee, S.-D.; Jeon, D.; Kim, S.-H.; et al. Scanning Miniaturized Magnetometer Based on Diamond Quantum Sensors and Its Potential Application for Hidden Target Detection. Sensors 2025, 25, 1866. [Google Scholar] [CrossRef] [PubMed]
- Wu, M.K.; Ashburn, J.R.; Torng, C.J.; Hor, P.H.; Meng, R.L.; Gao, L.; Huang, Z.J.; Wang, Y.Q.; Chu, C.W. Superconductivity at 93 K in a New Mixed-Phase Y-Ba-Cu-O Compound System at Ambient Pressure. Phys. Rev. Lett. 1987, 58, 908–910. [Google Scholar] [CrossRef] [PubMed]
- Gali, Á. Ab Initio Theory of the Nitrogen-Vacancy Center in Diamond. Nanophotonics 2019, 8, 1907–1943. [Google Scholar] [CrossRef]
Disclaimer/Publisher’s Note: The statements, opinions and data contained in all publications are solely those of the individual author(s) and contributor(s) and not of MDPI and/or the editor(s). MDPI and/or the editor(s) disclaim responsibility for any injury to people or property resulting from any ideas, methods, instructions or products referred to in the content. |
© 2025 by the authors. Licensee MDPI, Basel, Switzerland. This article is an open access article distributed under the terms and conditions of the Creative Commons Attribution (CC BY) license (https://creativecommons.org/licenses/by/4.0/).