Abstract
High levels of dissolved salts in irrigation water sources limit melon cultivation in northeastern Brazil. In this context, nitrogen fertilization has been employed as one strategy to alleviate the effects of salt stress on plants. This study aimed to evaluate the effect of different nitrogen sources on cantaloupe melon cultivation under fertigation and irrigation with water of the same salinity and different cationic concentrations (Na+ and Ca+). The research consisted of two experiments, each following a randomized complete block design in a 4 × 2 factorial arrangement with four replicates. The treatments included four levels of electrical conductivity of the nutrient solution (2.0; 3.0; 4.0; and 5.0 dS m−1) and two nitrogen sources of different origins: NO3− [Ca(NO3) and KNO3] and NH4+ [CH4N2O and NH4H2PO4]. The following factors were chlorophyll pigments, chlorophyll a fluorescence, and fruit weight. Nitrogen fertilization with NH4+ mitigated salt stress by increasing the synthesis of chlorophyll a and carotenoids in plants irrigated with NaCl-based saline water. Furthermore, there was no influence of nitrogen sources on chlorophyll a fluorescence. Finally, NO3− fertilization reduced the effects of salt stress on the leaf mass ratio, specific leaf area under Ca2+ fertigation, and relative growth rate of leaf area in melons under cationic prevalences of Na+ or Ca2+ (associated with Cl−).
1. Introduction
The melon (Cucumis melo L.) is a cucurbit with morphological characteristics of herbaceous plants, and its main product is the fruit, which is primarily consumed fresh [1]. In 2022, the global production reached 28.55 million tons of melon fruits [2] and Brazilian melon production, in the same year, amounted to 699.2 thousand tons across 27.4 thousand hectares. In Brazil, 97.5% of melon production comes from the Northeast Region, specifically the states of Rio Grande do Norte and Ceará contributing 77.5% of the national total. The state of Pernambuco produced 41.4 thousand tons, representing 5.92% of the national production [3].
Among the factors of melon production in this region of Brazil, it is worth highlighting nitrogen fertilization and irrigation. There are reports of the use of CH4N2O, Ca(NO3) or (NH4)2SO4 as N sources [4], with doses associated with the production function, since nitrogen is decisive in the cost of crop production. On the other hand, under saline conditions, lower Cl− concentrations were found in plants exposed to high levels of NO3− and vice versa [4]. There are also reports for the cv. Gália (aeroponic system) that ammonium nutrition exerted a negative effect on plant growth and tended to increase the level of total N in plant tissue and resulted in higher Na and Cl and lower Ca, K, and NO3 levels in plant tissue [4]. In fact, plants activate different pathways for assimilation depending on N source, either separately or in combination; plants that prefer NO3− may show symptoms of toxicity to NH4+, while those that prefer NH4+ may develop a less efficient NO3− uptake system [5].
This information is very important in the productive context of northeast Brazil, since brackish waters, predominantly in Na+, Ca2+, and Cl−, are used in the irrigation and fertigation of crops, including melon plants [6]. Melons plants are considered moderately salt-tolerant [7]; with reports of salinity limits of 3.3 dS m−1 [8] and 2.5 dS m−1 [9] for different growing situations, climatic conditions, and cultivars, the common point is that the reduction in the number of fruits per melon plant is the main cause of yield loss in the melon cultivars sensitive to salinity [10].
In terms of photosynthetic parameters, chlorophyll bio-synthesis and nitrogen metabolism in melon plants are found to be affected due to high salinity, i.e., leaf photosynthetic pigment and the fluorescence of chlorophyll a are important indicators of crop tolerance to salinity [11,12], as it is a consequence of the osmotic and water conditions’ effects on the photosynthetic efficiency of plants [13].
Moreover, the analysis of chlorophyll a fluorescence reveals the level of excitation energy that stimulates photosynthesis and helps distinguish the inhibition or loss in the electron transfer process of Photosystem II [14]. In this regard, it is also observed that the accumulation of salts in irrigation water hampers water absorption, which is essential for photosynthetic pigments, and thus, this excess of toxic ions in plant tissues causes an imbalance in metabolic and biochemical functions [15,16].
In light of this, several studies have been and continue to be conducted to evaluate the interaction between salinity and nitrogen [15,17,18], since nitrogen can be used to reduce deleterious effects of salinity, with its impact varying according to the form of nitrogen applied (nitrate or ammoniacal) and the plant species studied [19]. The present study is based on the hypothesis that nitrate-based fertilization mitigates the deleterious effects caused by fertigation with saline water inducing plant tolerance to salt stress by increasing the biosynthesis of photosynthetic pigments and photochemical efficiency, which reflects in higher fruit weight.
Therefore, we propose to compare (1) the effect of NO3− or NH4+ fertilization as a mitigator of the negative effects of salinity using photosynthetic parameters and melon fruit weight as indicators and (2) fertigation ionic compositions on the photosynthetic parameters and fruit weight of melon plants irrigated with brackish water prevalent in Na+ or Ca2+ (associated with Cl−).
2. Materials and Methods
2.1. Location and Characterization of the Experimental Environment
Two experiments were conducted in a protected environment at the Fertigation and Salinity Experimental Station of the Department of Agricultural Engineering at the Federal University of Pernambuco (UFRPE/headquarters), located in the municipality of Recife, Pernambuco (8°01′05″ S latitude and 34°56′48″ W longitude, with an average altitude of 6.5 m).
The greenhouse used measures 7 × 21 m, with a ridge height of 3 m and a maximum arch height of 4.5 m, featuring nylon side screens and a 150-micron film roof. Temperature and relative humidity data, as well as global solar radiation, were collected daily using a digital thermohygrometer (Incotern) and a portable pyranometer (IF1307 Instrufiber), respectively, inside the greenhouse (Figure S1).
2.2. Characterization of Experimental Units
Thirty-two pots were used in Experiment I and another thirty-two pots in Experiment II. Each pot was placed on a masonry base measuring 0.20 × 0.20 × 0.20 m (height, length, and width), equidistant in all directions by 0.50 m. Additionally, 7.77 L pots were fitted with a drainage system consisting of fourteen holes, each 7 mm in diameter, at the lower end of the pot. A 45 cm diameter piece of Clarite mesh was placed at the bottom of the pot as a physical barrier to prevent soil loss. Finally, the pot was filled in layers, maintaining a density of 1.5 g cm−3, with a total of 9 kg of dry soil mass, corresponding to 10.170 kg of wet soil mass. (Figure 1).
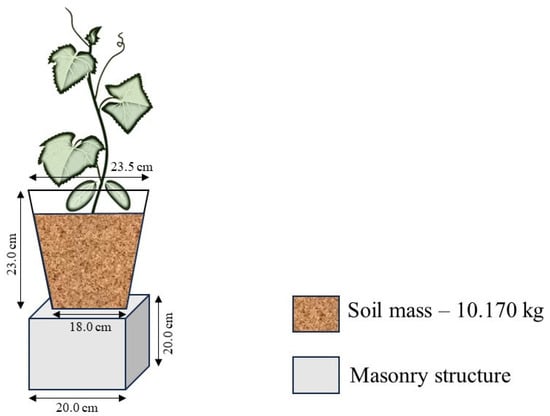
Figure 1.
Schematic drawing of the experimental units used in the research.
The soil used came from the municipality of Goiana, Pernambuco, with geographic coordinates of 7°33′38″ S and 35°00′09″ W, at an altitude of 13 m, and was collected from the 0 to 0.20 m layer. It was classified as Spodosol according to the American classification [20] and analyzed for its physical and chemical characteristics. Since the soil pH was within the range suitable for the crop and the soil did not contain exchangeable aluminum, liming was not necessary.
In the chemical characterization of the soil, the pH was 6.5. The phosphorus (P) concentration was 5.03 mg dm−3, while the levels of calcium (Ca2+), magnesium (Mg2+), sodium (Na+), and potassium (K+) were 1.75, 0.55, 0.08, and 0.07 cmolc dm−3, respectively. Aluminum (Al3+) showed a value of 0.00 cmolc dm−3, and the potential acidity (H+ + Al3+) was 0.69 cmolc dm−3. The sum of bases (SB) was 2.45 cmolc dm−3, the cation exchange capacity (CEC) was 3.14 cmolc dm−3, and the effective cation exchange capacity (ECe) was also 2.45 cmolc dm−3. The levels of copper (Cu), iron (Fe), manganese (Mn), and zinc (Zn) were 0.1, 4.0, 4.1, and 1.3 mg dm−3, respectively. Base saturation (V) was 78.03%, and the organic matter (OM) content was 5.53 g kg−1.
In the physical characterization, the soil had 952 g kg−1 of sand, 22 g kg−1 of silt, and 26 g kg−1 of clay, being texturally classified as sandy. The bulk density (Bd) was 1.50 g cm−3, the particle density (Pd) was 2.65 g cm−3, and the total porosity was 43.60%.
As for the chemical characterization of the irrigation water, the following values were observed: pH of 6.30 and electrical conductivity (EC) of 0.12 dS m−1. The concentrations of potassium (K+), calcium (Ca2+), magnesium (Mg2+), sodium (Na+), ammonia, nitrate, alkalinity, and chlorides were 2.50, 0.90, 0.46, 5.40, 0.00, 0.02, 11.70, and 15.40 mg L−1, respectively.
2.3. Experimental Design and Treatments: Experiments I and II
In both experiments, the experimental design was the same; however, in Experiment I, the levels of electrical conductivity of water (ECa) were obtained by dissolving NaCl in supply water (0.12 dS m−1), while in Experiment II, the same levels were obtained by dissolving CaCl2·2H2O in the same supply water.
Thus, the experimental design used was a randomized block design in a 4 × 2 factorial scheme, with four blocks and four repetitions, totaling thirty-two experimental units for Experiment I and another thirty-two units for Experiment II.
The treatments consisted of four salinity levels of nutrient solution (2.0, 3.0, 4.0, and 5.0 dS m−1) used in fertigation, with the fertilizer sources and nutrient quantities adopted based on the methodology proposed by Morais et al. [21]. To meet the nitrogen demand, two sources of different origins were used: for the nitrate source (NO3−), calcium nitrate and potassium nitrate were used; and for the ammoniacal source (NH4+), urea and MAP (monoammonium phosphate—composed of nitrogen and phosphorus) were used.
2.4. Irrigation Management
2.4.1. Determination of the Maximum Water Retention Capacity in the Soil, the Vase Capacity
The maximum water retention capacity of the soil (vase capacity) was determined according to the methodology of [17]. With due care to avoid the effect of precipitation, radiation, and evapotranspiration, in triplicate, three structures identical to the experimental units were exposed to saturation by capillarity until the ‘film’ was formed. They were then exposed to free drainage until they reached constant weight. Three 80 g samples of homogeneous masses of moist soil were then taken from the pots. The average water content (Equation (1) found in the three samples was taken as the maximum water retention capacity of the soil, 13%.
in which
MVC = Moisture at vase capacity (g g−1);
MDS = Mass of the dry sample (g);
MWS = Mass of the wet sample (g).
2.4.2. Determination of Current Soil Moisture and Irrigation Blade
- (a)
- Description of the moisture sensor and its calibration for Spodosol
For the daily monitoring actions of current soil moisture, Frequency Domain Reflectometry (FDR) was used, utilizing an EnviroSCAN communication port, produced by the Australian company Sentek, equipped with an RS 232 interface that records the electromagnetic signal. The soil moisture sensors are of the capacitive type ECH2O, models EC-5, with dimensions of 8.9 cm in length, 1.8 cm in width, and 0.7 cm in thickness, and 5TE (METER GROUP, Inc., Pullman, WA, USA), with dimensions of 10 cm in length, 3.2 cm in width, and 0.7 cm in thickness. The calibration process, called ‘laboratory calibration’ of θ, was developed for the EC-5 sensor by plotting the probe readings versus θ derived from the gravimetric method for the type of soil used in the experiment. The equation was developed using Microsoft Excel® regression, as shown in Equation (2) [22].
in which
ϴ = Soil moisture (m3 m−3);
Coefficients = 0.953 and −0.0451;
Sensor reading = X.
With the collection of relative frequency values (scaled frequency—SF) and the application of the calibration curve for the soil in question (Spodosol) developed by Almeida et al. (2018) [22], the current soil moisture was determined.
- (b)
- Determination of irrigation blade and irrigation interval
The irrigation interval adopted was, daily, with the irrigation blade, applied corresponding to the volume required to raise the soil moisture to the level equivalent to the pot capacity (13%). Once the irrigation blade was determined, its application was divided into three moments throughout the day, at 8:00 AM, 12:00 PM, and 3:00 PM. The irrigation blade was applied manually using a graduated beaker.
2.5. Fertigation Management
Preparation of the Nutrient Solution Used in Fertigation
In a water tank, 1000 L of supply water from UFRPE (ECw ≈ 0.12 dS m−1) was placed. The quantity of fertilizers added was adapted from that proposed by Morais et al. [21], for both nitrogen sources: NO3− or NH4+ (Table S1). Furthermore, it was ensured that the ECns value after adding the fertilizers remained the same, i.e., 2.0 dS m−1, and after the preparation was completed, the nutrient solution was divided into smaller containers according to the treatment.
2.6. Salinization of Nutrient Solutions Used on Fertigation: Experiments I and II
After dissolving the nutrients and filling the smaller, properly identified reservoirs, the required amount of salts was added to achieve the desired electrical conductivity levels of the nutrient solution (ECsn). For the solubilization of NaCl and CaCl2.2H2O in Experiments I and II, respectively, the amounts of the respective salts (Table 1) were determined based on the equation proposed by [23].

Table 1.
Ionic composition of nutrient solution used on fertigation.
2.7. Description and Management of Culture
2.7.1. The Sowing, Transplanting, and Initiation of Treatments
The reference crop used was the F1 Caribbean Gold RZ hybrid melon of the cantaloupe Harper type. Sowing was performed manually in 55 cm3 tubes filled with Basaplant substrate, with one seed per tube.
After sowing, the seedlings were kept in the dark for the first few days after sowing—DAS. The seedlings were transplanted into pots (one seedling per pot) 15 DAS. During transplantation, the seedlings were positioned so that the collar region—the transition zone between the root system and the stem—was not buried and was level with the soil, avoiding excessive blade. At this stage, the seedlings had two definitive leaves and were selected based on uniform morphological characteristics (size, number of leaves, and vigor).
Initially, until 14 days after transplanting (DAT), irrigation for all treatments was conducted using a low electrical conductivity solution (ECns = 2.0 dS m−1). From 15 DAT onward, the respective treatments were initiated, meaning the plants were irrigated with nutrient solutions containing salts as specified by the treatments. This occurred after the seedlings had acclimatized to the conditions of the greenhouse.
2.7.2. Plant Vertical Tutoring
After transplanting into the pots, the seedlings were tutored using strings to grow upright until reaching the height of the trellis (2.5 m) (Figure 2).
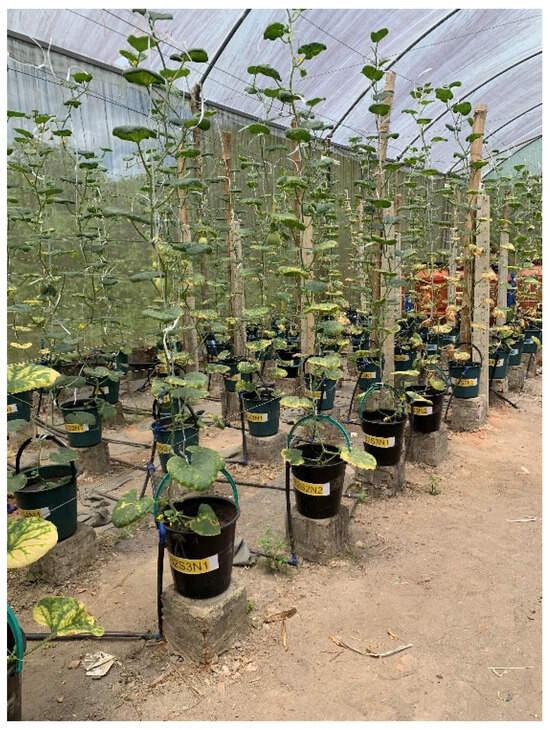
Figure 2.
Arrangement of the plants after vertical tutoring.
2.7.3. Pruning Management
The plant was tutored to grow with a single stem, removing all shoots/stems up to the 11th node. At the 12th, 13th, and 14th nodes, hermaphroditic flowers (future fruits) were retained. For the remaining nodes, the procedure involved removing shoots and flowers to achieve optimal conditions, ensuring the fruit was as close as possible to the main stem. Shoots were removed from all internodes up to the 20th node. At the 23rd node, the apical bud was removed (topping), as per [21].
2.7.4. Pollination and Fruit Thinning
Cross-pollination was carried out manually, with daily frequency until all plants were pollinated. Starting from the beginning of flower opening, pollination occurred between 6:00 and 7:30 a.m., using the tips of the anthers from one plant (male organ of the flower) to transfer pollen to the stigmas (female organ of the flower) of another plant, typically using an average of three male flowers per female flower. After fruit set, ensuring no further fruit abortion occurred, thinning was performed as necessary to leave only one fruit per plant. The fruits were harvested when they reached maximum development and showed signs of tissue rupture at the abscission layer of the fruit peduncle.
2.7.5. Phytosanitary Management
Pest control (Bemisia tabaci, Aphis gossypii, and Diaphania nitidalis) and diseases (Sphaerotheca fuliginea and Pseudoperonospora cubensis) were managed through chemical intervention, with preventive applications of insecticides from the chemical groups Acetamiprid and Deltamethrin (soluble powder and emulsifiable concentrate, respectively), and fungicides from the chemical groups Chlorothalonil and Sulfur (concentrated suspension and soluble powder, respectively). For the control of invasive plants in the pots, manual weeding was carried out throughout the experiment period.
2.8. Analyzed Variables
2.8.1. Photosynthetic Pigments
The quantification of photosynthetic pigment levels (Chl a, Chl b, carotenoids, total Chl, Chl a/Chl b ratio, and total Chl/carotenoids ratio) was performed 43 days after transplanting, following the laboratory method developed by [24]. From the extracts, the concentrations of chlorophylls and carotenoids in the solutions were determined using a spectrophotometer at absorbance wavelengths (470, 646, and 663 nm), using Equations (3)–(8).
| Chl a: Chlorophyll a (mg g−1 FW *) | (3) | |
| Chl b: Chlorophyll b (mg g−1 FW *) | (4) | |
| Car: Carotenoids (mg g−1 FW *) | (5) | |
| ChlT: Total Chlorophyll (mg g−1 FW *) | (6) | |
| dimensionless | (7) | |
| dimensionless | (8) | |
| * FW: fresh weight of the leaf | ||
2.8.2. Fluorescence the Chlorophyll a
Chlorophyll a fluorescence was measured 43 days after transplantation through initial fluorescence (F0—elétrons quantum−1), maximum fluorescence (Fm—elétrons quantum−1), variable fluorescence (Fv—elétrons quantum−1), maximum quantum yield of Photosystem II (Fv/Fm—elétrons quantum−1), photochemical efficiency in PSII (Fv/F0—elétrons quantum−1), and basal quantum efficiency of the non-photochemical process (Fm/F0—elétrons quantum−1) in leaves pre-adapted to darkness using leaf clamps for 30 min, between 8:00 and 10:00 AM, on the third fully expanded leaf counted from the apical bud, using a fluorometer (Brand: Fluorpen, Model: FP-100), acquired in Drasov, Czech Republic.
2.8.3. Biomass Allocation in the Photosynthetic Apparatus
For the Leaf Mass Ratio (LMR), the ratio between leaf mass and total dry mass of the plant (MDleaf/MDtotal) was calculated, expressing the fraction of non-exported dry matter, based on the equation from [25] according to Equation (9).
in which
LMR = Leaf mass ratio (g g−1);
MDleaf = Leaf dry mass (g per plant);
MDtotal = Total dry mass (g per plant).
The SLA values were obtained through the dry mass and area of the leaf discs, represented by the equation below and proposed by [26], according to Equation (10).
in which
SLA = Specific leaf area (g cm2);
MS = Leaf dry mass (g per plant);
LA = Leaf area (cm2).
Based on the leaf area data recorded at 15 and 57 days after harvest, the relative leaf area growth rate was determined according to the methodology [27], as described in Equation (11).
in which
RGR-LF = Relative growth rate of leaf area (cm day−1);
LF2 = Final leaf area measurement (cm2);
LF1 = Initial measurement of leaf area (cm2);
T2−T1 = Time interval (15–57 days);
Nl = Neperian logarithm.
2.9. Data Analysis
The normality and homoscedasticity of the data was confirmed by the Shapiro–Wilk and Levene test (p ≤ 0.05), respectively. The data were subjected to analysis of variance using the F-test, and when significance was observed at the 0.01 and 0.05 probability levels, the quantitative factors (electrical conductivity levels) were compared using regression analysis, and the qualitative factors (nitrogen sources) were compared using the Scott-Knot mean test. The statistical analyses were performed using the SISVAR statistical software, version 5.7 [28].
3. Results
3.1. Photosynthetic Pigments
In Experiment I (waters salinized with NaCl), it was found that the interaction between treatments influenced (p ≤ 0.05) the levels of Chl a and carotenoids (Car). Individually, the electrical conductivity of the nutrient solution (ECns) affected (p ≤ 0.05) Chl b, Chl a/Chl b, ChlT/Car, and Chl T. In the first experiment, no influence (p > 0.05) of the N sources, individually, was observed (Table S2).
In Experiment II (waters salinized with CaCl2), the electrical conductivity of the nutrient solution (ECns) significantly affected (p ≤ 0.05) Chl a, Chl b, Car, and Chl T, and it affected (p ≤ 0.01) Chl a/Chl b, ChlT/Car; still regarding the second experiment, individually, no significance was observed for the interaction between ECns and N sources (p > 0.05) (Table S3).
Under the prevalence of NaCl in the water, it was found that when NH4+ was used as the N source, the Chl a content was reduced at a rate of 2.3696 mg g−1 of FW for each unit increase in ECns; on the other hand, when NO3− was used as the N source, the Chl a content was minimum (9.17 mg g−1 of FW) at an ECns estimated at 4.2 dS m−1. In this sense, when comparing the N sources within each ECns, it was found that Chl a was 20.31% higher when NH4+ was used as the N source, within the ECns of 3.0 dS m−1 (Figure 3a).
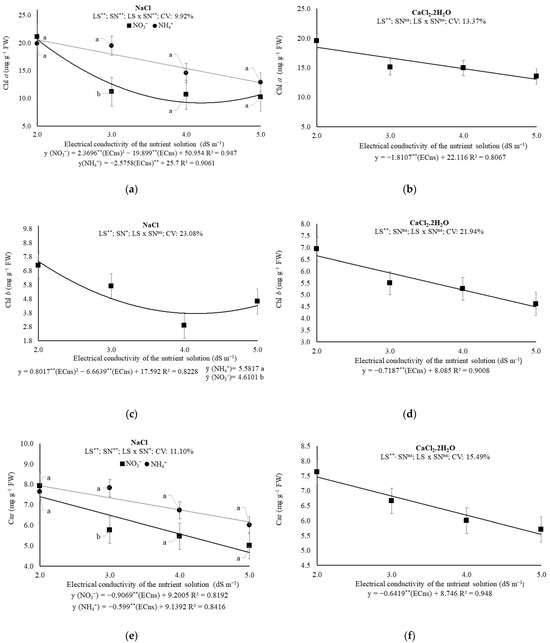
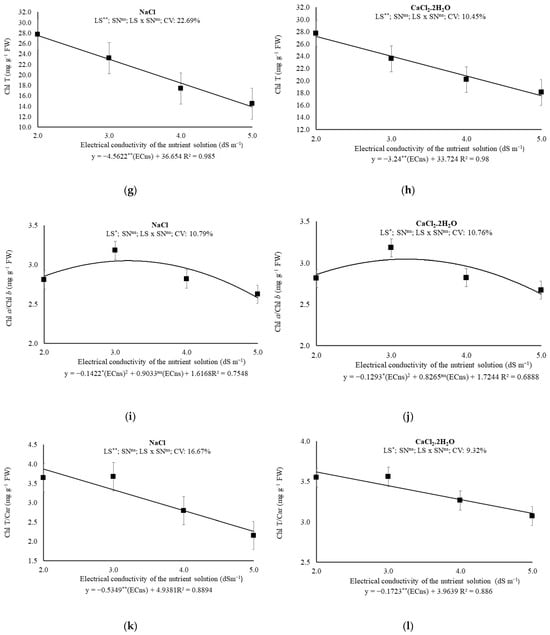
Figure 3.
(a,b) Chlorophyll a (Chl a); (c,d) Chlorophyll b (Chl b); (e,f) Carotenoids (Car); (g,h) Total Chl; (i,j) Chlorophyll a/Chlorophyll b ratio (Chl a/Chl b); and (k,l) Total Chl/Car ratio of melon plants under saline levels and nitrogen sources, 43 days after transplanting. ECns: electrical conductivity of the nutrient solution; LS: saline levels; SN: source nitrogen; CV: coefficient of variation; ** and *: significant at 0.01 and 0.05 probability levels, respectively; ns: not significant.
In the situation where the water was salinized with CaCl2.2H2O, that is, in Experiment II, a reduction (p ≤ 0.05) in the Chl a of 1.8107 mg g−1 of FW was observed for each unit increase in ECns (Figure 3b).
The Chl b content was minimum (3.74 mg g−1 FW) at ECns estimated at 4.2 dS m−1, in plants under prevalence of Na+ in the brackish water. Additionally, an isolated effect was observed for nitrogen sources; the use of NH4+ fertilization the Chl b content was 16.87% higher (Figure 3c). Under the prevalence of Ca2+ in the brackish water, the unit reduction was estimated at 8.89% for each dS m−1 increment. (Figure 3d).
For carotenoid levels, under the prevalence of Na+, reductions of 0.9069 (NO3−) and 0.599 (NH4+) mg g−1 FW were estimated for each unit increase in ECns, with losses calculated within the studied ECns range of 38.83% and 22.63%, respectively. When comparing the N sources within each ECns, it is noted that the carotenoid content is 15.43% higher (p ≤ 0.05) when NH4+ was used as the N source (ECns of 3.0 dS m−1) (Figure 3e). In Experiment II, prevalence of Ca2+, there was no effect of the interaction between treatments or of the nitrogen sources individually; however, a reduction in Car content of 0.64 mg g−1 FW was observed for each dS m−1 increment, with a total loss of 25.81% when comparing the content of plants exposed to 2.0 and 5.0 dS m−1 (Figure 3f).
As total pigments levels, the unit losses were 4.5622 and 3.24 mg g−1 FW for each dS m−1 increase in ECns, under the prevalence of Na+ or Ca2+ in the brackish water, respectively, reaching total losses, within the ECns range studied, of 49.72% or 35.68%, respectively (Figure 3g,h). The Chl a/Chl b ratio was maximum (3.17 or 3.19 mg g−1 FW) under prevalence of Na+ (ECns estimated in 3.05 dS m−1) or Ca2+ (ECns estimated in 3.04 dS m−1), respectively, with no influence of N sources being observed. (Figure 3i,j). For the Chl T/Car ratio, losses were observed of 0.53 (10.83%) and 0.17 (4.35%) mg g−1 FW for each dS m−1 increased to ECns and, comparing the Chl T/Car of plants under 2.0 and 5.0 dS m−1, losses of the order of 41.48% and 14.28%, for the prevalence of Na+ or Ca2+ on the brackish water, respectively (Figure 3k,l).
3.2. Fluorescence the Chlorophyll a
The interaction between the treatments or the isolated effect of N sources did not influence (p > 0.05) the chlorophyll a fluorescence of melon plants in Experiments I and II. For the variables initial fluorescence (F0), maximum fluorescence (Fm), and variable fluorescence (Fv), a significant effect (p ≤ 0.05) was observed, isolated for the ECns, and also for both experiments (Tables S4 and S5).
When comparing the results of plants under 2.0 and 5.0 dS m−1, the Fo values drop from 792.16 to 585.27 electrons quantum−1 (prevalence of Na+) and from 791.72 to 616.33 electrons quantum−1 (prevalence of Ca2+), which imply a unitary loss of 68.96 and 58.46 electrons quantum−1 per increased dS m−1, respectively (Figure 4a,b).
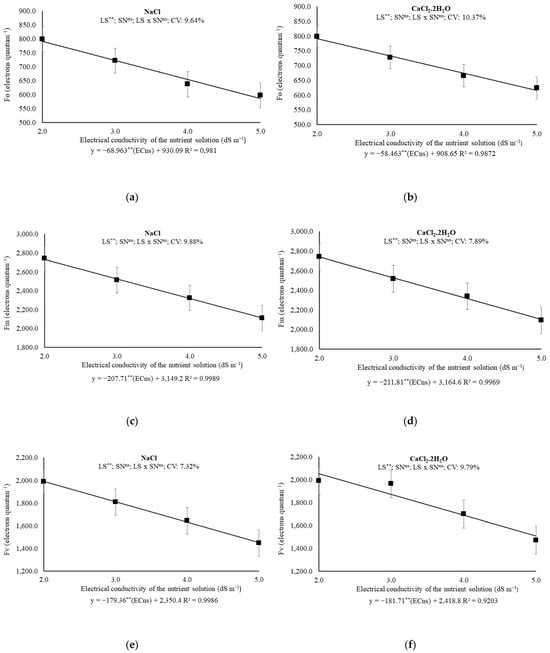
Figure 4.
(a,b) Initial fluorescence (F0); (c,d) maximum fluorescence (Fm), (e,f); variable fluorescence (Fv), 43 days after transplanting melon plants under saline levels and nitrogen sources. ECns: electrical conductivity of the nutrient solution; LS: saline levels; SN: source nitrogen; CV: coefficient of variation; **: significant at 0.01 probability levels; ns: not significant.
The increase in ECns also resulted in linear reductions in the Fm values for each unit increase in ECns. In Experiment I, the losses were at a rate of 6.60% per each increased dSm−1; within the proposed ECns range, the calculated total reduction was 22.79%. In Experiment II, the Fm values were reduced by a 6.69% per unit increase in ECns and demonstrated a reduction of 23.18% when comparing the highest and lowest estimated values (Figure 4c,d).
Reductions of 7.63 and 7.51% on Fv was estimated for each dS m−1 increased on ECns for Na+ or Ca2+ prevalence, using NO3− or NH4+ as source of N. In fact, when comparing Fv of plants exposed to 2.0 and 5.0 dS m−1, the losses reach 27.02 and 26.52% for Na+ or Ca2+ prevalence, respectively (Figure 4e,f).
3.3. Biomass Allocation in the Photosynthetic Apparatus
In Experiments I and II, it was found that the nitrogen sources influenced (p ≤ 0.01) the leaf mass ratio. In Experiment II, it was observed that the electrical conductivity of the nutrient solution (ECns) affected (p ≤ 0.05) the specific leaf area and the nitrogen sources (p ≤ 0.01). In Experiments I and II, it was found that the electrical conductivity of the nutrient solution (ECns) affected (p ≤ 0.01) the relative leaf area growth rate, as well as (p ≤ 0.01) the nitrogen sources.
For the prevalence of Na+ and Ca2+, the leaf mass ratio values were higher when NH4+ was used as the N source, with values 4.20% and 5.17% higher, respectively, when comparing the maximum and minimum means obtained (Figure 5a).
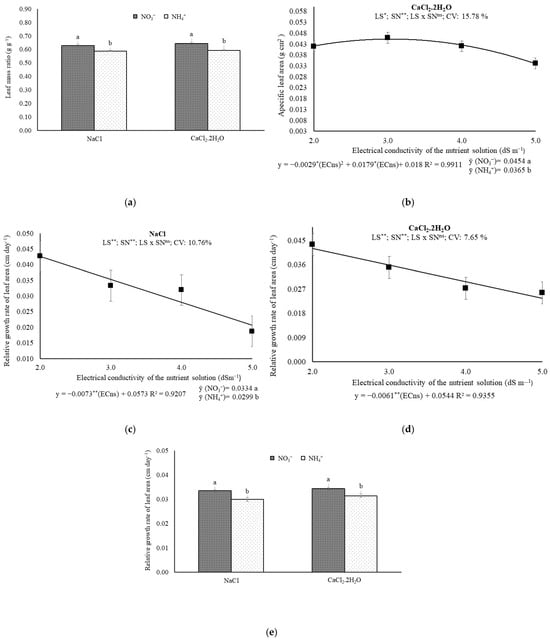
Figure 5.
(a) Leaf mass ratio, (b) specific leaf area, and (c–e) relative growth rate of leaf area 57 days after transplanting melon plants under saline levels and nitrogen sources. ECns: electrical conductivity of the nutrient solution; LS: saline levels; SN: source nitrogen; CV: coefficient of variation; ** and *: significant at 0.01 and 0.05 probability levels, respectively; ns: not significant. a,b For the leaf mass ratio, it was only significant for the nitrogen sources for both experiments, while for the specific leaf area, it was only significant for the experiment with CaCl2.2H2O.
In plants exposed to saline water with Ca2+ prevalence, the specific leaf area (SLA) was maximum (0.0456 g cm2) at the estimated ECns of 3.0 dS m−1; it was also observed that the use of NO3− resulted in a 19.60% increase in specific leaf area (Figure 5b). The SLA of plants under sodium–saline water was not affected (p > 0.05) by the treatments.
For the prevalence of Na+ in the water, it was observed that when NO3− was used as the nitrogen source, the leaf area growth rate was reduced by 12.72% for each dS m−1 increase in ECns; on the other hand, when NH4+ was used as the nitrogen source, the decrease was 15.27% for each dS m−1 increase in ECns (Figure 5c,d). When comparing the means for the prevalence of Na+ and Ca2+, the relative leaf area growth rate values were higher when NO3− was used as the nitrogen source, with values 10.48% and 8.61% higher, respectively, when comparing the means (Figure 5e).
4. Discussion
For each kg of N, Ca(NO3) or KNO3 is typically more expensive than CH4N2O; however, from the melon grower’s point of view, other aspects must also be considered. In addition to the supply of Ca2+ or K+ and the minimization of losses through volatilization, Ca(NO3) does not imply soil acidification and is important for crops such as melons that demand Ca2+ throughout the cycle [29,30].
In this research, the same mass per liter of NO3− or NH4+ was used; however, as expected, the increase in ECns implied a reduction in the supply of NO3− and NH4+ (prevalence of Na+) and prevalence of Ca2+, throughout the crop cycle (Table S7). This reduction is a direct implication of the limitation that the osmotic issue imposes on the consumption of water and nutrients by plants; however, the results on the content of photosynthetic pigments or fruit weight, may be associated with the activation of different assimilation pathways depending on the N source, especially under high salinity conditions.
High salinity concentrations cause significant damage to plants, leading to declines in productivity and fruit quality in crops. Under salt stress, the physiological processes of plants are constantly affected in various ways, including high amounts of ions, such as Na+ or Ca2+, which cause the degradation of enzymatic structures and cellular organelles, thereby halting photosynthesis, respiration, and the synthesis of proteins and photosynthetic pigments in plants [31,32]. Furthermore, the accumulation of salts in the soil leads to physiological drought and nutrient imbalance in plants [33]; and the stress caused by the increase in salts makes plants generate reactive oxygen species (ROS) [31,34].
Além disso, pode-se sugerir que as altas concentrações elevadas de Na+ ou Ca2+, provenientes de águas salinizadas com NaCl ou CaCl2, podem ter ocasionado redução no desenvolvimento do melão, comprometendo a absorção de nutrientes e resultando em um desequilíbrio nutricional nas proporções de Na+/K+, Na+/Ca2+ e Na+/Mg2+ [35].
In a study carried out by [36] in the Mediterranean area with melon crops (var. cantalupensis Naud. Alpes) with different types of irrigation and fertilization with nitrogen and potassium in a greenhouse, he was able to demonstrate that increased salinity is one of the main factors that reduce the yield of the most varied production parameters of the plant.
4.1. Photosynthetic Pigments
The use of NH4+ as a N source, specifically for the ECns of 3.0 dS m−1 (NaCl), increased the Chl a content by 20.31%; however, for the other salt concentration levels, the Chl a concentration does not change significantly. In fact, NH4+ can increase chlorophyll content in plants, but the effect depends on the concentration and balance with other nutrients like K+. Anyway, while in similar situations mild ammonium stress induces chlorophyll accumulation, chlorosis seems to be an exclusive effect of severe ammonium toxicity [37], as observed for the other concentrations.
Under Ca2+ prevalence, in no concentration tested, the use of NH4+ or NO3− implied gains in melon Chl a. Actually, in both cases, the reduction in chlorophyll a content can be attributed to problems of membrane stability [27] and to increased degradation and/or inhibition of the synthesis of this pigment by the activity of enzymes such as chlorophyllase, hydroxylase, and dioxygenase [38]. Similar results were found by [39], who mentioned a reduction in the levels of Chl a in mini watermelon plants due to increased water salinity.
Like Chl a, under Na+ prevalence, the use of NH4+ also implied gains of Chl b of 21.7%, in isolated analysis, without significative interaction with ECns. On the other hand, there is no difference in Chl b content when using NO3− or NH4+ as N source, in plants exposed to brackish waters with a prevalence of Ca2+. These results reinforce the comments of [5] that in some situations compared to NO3−, NH4+ assimilation in plants requires less energy.
The Na+ prevalence also increase the Car content by 15.43% (3.0 dS m−1) with NH4+ as source of N. Although the source of N did not benefit the Car content at other concentration levels, it is noted that the use of NH4+ (reduction of 22.63%) mitigated the losses in relation to the use of NO3− (reduction of 38.83%), when comparing the Car content of plants exposed to 2.0 and 6.0 dS m−1. The reduction in Car content in melon can be attributed to the degradation of ß-carotene and the reduction in zeaxanthin formation; these results were observed in the present work. With different intensities, the production of carotenoids was affected [40].
Under salinity conditions (NaCl), the content of Chl a, Chl b, and Car was higher when NH4+ was used as the N source. On the other hand, for the same salinity levels tested (CaCl2), the use of NH4+ or NO3− as a N source does not affect photosynthetic pigments. In summary, under the same ECns range, the content of Chl a, Chl b, and Car will be more or less affected by the use of NO3− or NH4+ depending on the ionic prevalence of the brackish water, Na+ or Ca2+.
Testing NH4+/NO3− ratios under non-salinity conditions, Ref. [41] found that the use of NH4+ alone in yellow passion fruit plants, implied restrictions on the accumulation of dry biomass and growth; however, the isolated use of NO3− benefited the growth of plants, which presented higher levels of chlorophyll a, b, total, and carotenoids than plants with the other proportions of N. On the other hand, Ref. [37] added that excessive NH4+ accumulation in tissues is toxic for plants and exclusively NH4+-based nutrition enhances this effect. However, they consider that moderate NH4+ stress induces chlorophyll accumulation and that chlorosis is a result of severe NH4+ toxicity, as verified by these authors for Arabidopsis thaliana accessions. Finally, Ref. [5] add that physiological effects of NH4+ and NO3− have confirmed that tea plants prefer NH4+ as the dominant nitrogen (N) source.
The use of NO3− or NH4+ did not affect Chl T, but the prevalence of Ca2+ implied lower accumulated losses than the prevalence of Na+, within the same ECns range. On the other hand, from 3.17 and 3.19 dSm−1, the Chl a/Chl b ratio decreased, considering the prevalence of Na+ or Ca2+, respectively, evidencing the effect of the increased salt concentration in the nutrient solution. The reduction in total chlorophyll levels measured in plants under stress can be associated with the presence of ions at toxic levels that dehydrate mesophyll cells, inhibiting enzymes involved in carbohydrate metabolism and some stages of chlorophyll synthesis [42]. Since chlorophyll is the most important pigment for capturing light energy, its reduction leads to a decrease in photosynthesis. A decrease in total chlorophyll content in melons stressed by salinity was also observed by [43].
The pigment ratios of Chl a/Chl b and total Chl/carotenoids in the leaves showed a tendency for reduction with the increase in salinity, which can be related to the plant response to environmental changes with increasing stress. With the prolongation of ECns levels, chlorophyll synthesis gradually decreased, which occurs due to the reduction in the light energy absorption capacity of chloroplasts under high salt stress, leading to a decrease in chlorophyll content [44]. Ref. [39] also found similar results, as all chlorophyll variables in melons showed a trend of reduction with the increase in water salinity levels.
The higher efficiency of the NH4+ source in the presence of Na+ can be attributed to the reduced energy consumption during its assimilation and the activation of metabolic pathways adaptive to osmotic stress, as reported by [5,37]. In contrast, in waters rich in Ca2+, the presence of this cation contributes to membrane stability and ionic homeostasis, [45]. This reduces pigment degradation and promotes a more balanced metabolism, regardless of the N source used.
4.2. Fluorescence the Chlorophyll a
The inhibition of the accumulation of Na+ and Cl− ions due to the antagonistic effects of NH4+ and NO3− [46,47], which is used as a tolerance inducer, depends on several aspects. There are mentions in the literature of the economic advantages of using NH4+ (moderate stress) compared to NO3− [48]; however, there are also reports of the enhancement of the effects of salinity when there are greater accumulations of NH4+ in plant tissues. For [49], interactions between N nutrition and salinity vary depending on plant age, salt stress level, duration, and application method.
In this research, the effect caused by the use of NH4+ as a source of N on photosynthetic pigments is not perceived when analyzing the fluorescence of chlorophyll a. In fact, the basic fluorescence signal has characteristic levels that reflect the plant’s ‘status’ at that moment, in relation to its own metabolism and its interaction with the environment in which it is found [50]. In other words, the positive correlation between nitrogen concentrations and leaf chlorophyll content [51] can be affected by other factors, such as salinity.
From this point of view, the use of NO3− or NH4+ in salinity conditions does not affect the photochemical efficiency of plants; however, for the same salinity, the results can be analyzed differently depending on the ionic prevalence of the water Na+ or Ca2+. Although, in the present work, it is clear that the losses are associated with the increase in the concentration of salts.
It is worth noting, however, that the prevalence of Ca2+ resulted in lower accumulated losses when comparing Fo and Fv of plants under 2.0 and 5.0 dS m−1 and greater losses of Fm in the same ECns range. Ca2+ deficiency in plants implies a reduction in Fm (verified in tomato plants), in addition to damaged cell membranes (in peach plants) and impaired biosynthesis of chlorophyll and chlorophyll precursors [52]. On the other hand, excess induces the closure of leaf stomata, thus reducing photosynthesis; it affects the absorption and utilization of magnesium, and the efficiency of light energy utilization in leaves is reduced [53].
The reduction in initial fluorescence signals occurs in response to the decreased ability to transfer excitation energy from the light-harvesting system to the reaction center, likely due to the decrease in leaf water potential [54,55]. Furthermore, this reduction indicates that the activity of chlorophyll a was diminished, leading to less energy generation, which affects the proper functioning of Rubisco and, consequently, the CO2 carboxylation process [56]. According to [57], the absence of differences in Fo for the salinity levels, as well as the reduction, could indicate plant tolerance to salinity. Like us, [35] also found a reduction in Fo in mini watermelon cultivation, as the electrical conductivity of the water increased.
Variable fluorescence and maximum fluorescence were reduced with the increase in ECns, without influence from nitrogen sources. Variable fluorescence refers to the plant’s ability to transfer energy from electrons ejected from pigment molecules to the formation of NADPH, ATP, and reduced ferredoxin. Thus, its reduction can indicate that the photosynthetic apparatus was damaged by salt stress, impairing the function of Photosystem II, with negative effects on the photosynthetic process [56]. This decrease may be related to the intensity and duration of exposure to saline conditions, caused by the accumulation of various toxic ions that impaired the plants’ photosynthetic apparatus. As a result, the functioning of the reaction centers of Photosystem I and II is compromised throughout the exposure period, in relation to the stress factor [55].
Furthermore, salinity reduces energy capture at the reaction centers, directly affecting maximum fluorescence. This likely happens because the excessive accumulation of specific ions causes an imbalance in the plant’s metabolic activity, leading to the formation of reactive oxygen species, which limits the energy activity of photosynthetic pigments [58]. A study by [59] found similar results when evaluating Japanese cucumber under different electrical conductivity levels of the nutrient solution, where they observed decreases in both variable fluorescence and maximum fluorescence as the electrical conductivity of the nutrient solution increased.
4.3. Biomass Allocation in the Photosynthetic Apparatus
In this study, the leaf mass ratio was better for fertilization with NO3− in both Experiment I and II. This may be related to research showing the existence of competition in absorption between nitrate and chloride, so that increasing the nitrate concentration in the root zone can reduce chloride uptake by the plant [60].
Another point to consider is that with the increase in salinity, the specific leaf area was negatively affected, which may be related to the adjustment of the crop’s water potential and the reduction in the soil water potential, which may have allowed the maintenance of water uptake and cell turgor, consequently leading to a reduction in the plant’s specific leaf area [61]. Thus, these results agree with a study conducted by [62]. When evaluating some melon genotypes grown in substrate under saline stress, they reported a decrease in specific leaf area with the increase in ECsn.
The decrease in the relative growth rate may occur due to photosynthetic limitations resulting from stomatal closure, which leads to lower CO2 assimilation [63,64]. Thus, salt accumulation negatively affects water absorption by plants, which is a determining factor in the reduction in photosynthetic and metabolic processes, impacting plant growth as ECa increases [65]. The decrease in the relative growth rate of melon is mainly due to the reduction in leaf area and number of leaves, which can be corroborated by the study of [66], where it was demonstrated that high levels of electrical conductivity reduce stomatal conductance, transpiration, and photosynthesis, leading to a reduction in leaf area in melon plants of the Sancho and Caribbean Gold cultivars. According to [67], increasing electrical conductivity to 5.0 dS m−1 also resulted in a reduction in both the number and area of leaves. Furthermore, nitrate fertilization mitigated stress on the relative growth rate in both the Na+ and Ca2+ experiments, which may be associated with the fact that when NH4+ is used as the nitrogen source, there is a reduction in photosynthesis that coincides with increased energy suppression, indicating low energy efficiency, as evidenced by the study of [68] on zucchini (cv. Caserta), where nitrate and ammonium sources were used, and the best performance of photosynthesis-related variables under salt stress occurred with NO3−.
The association between NO3− and waters with a predominance of Ca2+ suggests a synergy that promotes greater nitrate transport and higher efficiency in carbon metabolism. This interaction may have contributed to the maintenance of leaf mass and a more stable osmotic balance, mitigating the negative effects of salinity on vegetative growth.
5. Conclusions
Under salinity conditions, the content of Chl a, Chl b, and Car of melon will be more or less affected by the use of NO3− or NH4+ depending on the ionic prevalence of brackish water, Na+ or Ca2+. The use of NH4+ as a N source (Na+ prevalence) in melon fertigation provides an increase of 20.31% in Chl a content (3.0 dS m−1); 21.7% in Chl b content; and 15.43% (3.0 dS m−1) in carotenoids content, in relation to when NO3− is used. Plants respond to the increase in salt concentration by altering the relationship between Chl a and other protective pigments, as seen in the Chla/Chlb and ChlT/Car ratios. The use of nitrogen sources, whether NO3− or NH4+, does not affect the photochemical efficiency of hybrid F1 Caribbean Gold RZ cantaloupe-type melon plants fertigated with nutrient solution up to 5.0 dS m−1, regardless of the prevalence of Na+ or Ca2+. Melon plants respond to the stress caused by the increase in the electrical conductivity of the nutrient solution in terms of specific leaf area (this only for water with Ca2+) and the relative leaf area growth rate. Additionally, both are mitigated by the use of NO3− as the nitrogen source, and the same occurs for the leaf mass ratio, in which stress was reduced with NO3− fertilization.
Supplementary Materials
The following supporting information can be downloaded at: https://www.mdpi.com/article/10.3390/app15179601/s1, Figure S1: (A) Air temperature values: Maximum temperature = Tx (°C); Average temperature = Tm (°C); Minimum temperature = Tn (°C). (B) Values of relative air humidity = RH (%) and global solar radiation= Rg (MJ m−2 day−1) inside the greenhouse during the period from 21 September to 17 November 2023 for growing of melon plants exposed to two sources of nitrogen fertilization (NO3− or NH4+) and irrigation with brackish water (salinized with NaCl or CaCl2). Ideal levels for the crop: Air temperature 25 to 30 °C [69]; Relative air humidity 65 to 75% [69]; Global solar radiation to 19.37 MJ m−2 day−1 [70]. Analysis of pigment content and chlorophyll-a fluorescence performed 43 days after transplanting.; Table S1: Sources of N and quantities of fertilizers used to prepare 1000 L of nutrient solution for cantaloupe melon cultivation in substrate (Adapted from Morais et al. [21]).; Table S2: Analysis of variance for chlorophyll a (Chl a), chlorophyll b (Chl b), carotenoids (Car), total chlorophyll (Chl T), Chl a/Chl b ratio, and Chl T/Car ratio of melon plants exposed to two sources of nitrogen fertilization (NO3- or NH4+) and irrigation with brackish water (salinized with NaCl), 43 days after transplanting melon plants.; Table S3: Analysis of variance for chlorophyll a (Chl a), chlorophyll b (Chl b), carotenoids (Car), total chlorophyll (Chl T), Chl a/Chl b ratio, and Chl T/Car ratio of melon plants exposed to two sources of nitrogen fertilization (NO3- or NH4+) and irrigation with brackish water (salinized with CaCl2), 43 days after transplanting melon plants.; Table S4: Analysis of variance for initial fluorescence (F0), maximum fluorescence (Fm), variable fluorescence (Fv), maximum quantum yield of Photosystem II (Fv/Fm), photochemical efficiency in PSII (Fv/F0), and basal quantum efficiency of the non-photochemical process (Fm/F0) of melon plants exposed to two sources of nitrogen fertilization (NO3- or NH4+) and irrigation with brackish water (salinized with NaCl), 43 days after transplanting melon plants.; Table S5: Analysis of variance for initial fluorescence (F0), maximum fluorescence (Fm), variable fluorescence (Fv), maximum quantum yield of Photosystem II (Fv/Fm), photochemical efficiency in PSII (Fv/F0), and basal quantum efficiency of the non-photochemical process (Fm/F0) of melon plants exposed to two sources of nitrogen fertilization (NO3- or NH4+) and irrigation with brackish water (salinized with CaCl2).; Table S6: Analysis of variance of leaf mass ratio (LMR), specific leaf area (SLA) and relative growth rate of leaf area (RGR) under salinity levels of NaCl or CaCl2·2H2O and nitrogen sources, 57 days after transplanting melon plants.; Table S7: Apport of íons via fertigation in melon cultivation under salinity and N sources*.
Author Contributions
Conceptualization, G.F.d.B., E.R.d.S., C.D.G.C.d.A., G.S.d.L., T.G.F.d.S., M.V.d.S., M.B.F., Ê.F.d.F.e.S., D.d.C.D. and J.A.S.J.; Data curation, G.F.d.B., T.G.F.d.S. and J.A.S.J.; Formal analysis, G.F.d.B., E.R.d.S., C.D.G.C.d.A., T.G.F.d.S., M.V.d.S. and J.A.S.J.; Funding acquisition, G.F.d.B., M.V.d.S., M.B.F. and J.A.S.J.; Investigation, G.F.d.B. and J.A.S.J.; Methodology, G.F.d.B., E.R.d.S., C.D.G.C.d.A., M.B.F., D.d.C.D. and J.A.S.J.; Project administration, G.F.d.B. and J.A.S.J.; Resources, G.F.d.B., E.R.d.S., C.D.G.C.d.A., G.S.d.L., M.V.d.S. and J.A.S.J.; Software, G.F.d.B., E.R.d.S., C.D.G.C.d.A. and J.A.S.J.; Supervision, Ê.F.d.F.e.S. and J.A.S.J.; Validation, G.F.d.B., E.R.d.S., C.D.G.C.d.A., G.S.d.L. and J.A.S.J.; Visualization, G.F.d.B., G.S.d.L., T.G.F.d.S., M.V.d.S., M.B.F., Ê.F.d.F.e.S., D.d.C.D. and J.A.S.J.; Writing—original draft, G.F.d.B., E.R.d.S., C.D.G.C.d.A., Ê.F.d.F.e.S., D.d.C.D. and J.A.S.J.; Writing—review and editing, G.F.d.B., E.R.d.S., C.D.G.C.d.A., G.S.d.L., T.G.F.d.S., M.V.d.S., M.B.F., Ê.F.d.F.e.S., D.d.C.D. and J.A.S.J. All authors have read and agreed to the published version of the manuscript.
Funding
The scholarships were funded by the Coordination for the Improvement of Higher Education Personnel (CAPES) and the research project by the National Council for Scientific and Technological Development (CNPq) 409312/2021-5.
Institutional Review Board Statement
Not applicable.
Informed Consent Statement
Not applicable.
Data Availability Statement
I declare that the data has privacy restrictions.
Acknowledgments
We would like to thank Capes for providing the scholarship and all the human resources involved in this research.
Conflicts of Interest
The authors declare no conflicts of interest.
References
- Araújo, B.A.; Celin, E.F.; da Costa, R.S.; Calvet, A.S.F.; de Carvalho, H.H.; Bezerra, M.A. Development and Quality of Melon Fruits Grown Under Salt Stress. Rev. Bras. Eng. Agrícola Ambient. 2024, 28, e277374. [Google Scholar] [CrossRef]
- FAO. FAOSTAT. Available online: https://www.fao.org/faostat/en/#data/QCL (accessed on 30 January 2025).
- IBGE. Produção de Melão. Available online: https://www.ibge.gov.br/explica/producao-agropecuaria/melao/br (accessed on 24 January 2025).
- Feigin, A.; Rylski, I.; Meiri, A.; Shalhevet, J. Nitrogen. J. Plant Nutr. 1987, 10, 1787–1794. [Google Scholar] [CrossRef]
- Tang, D.; Liu, M.-Y.; Zhang, Q.; Ma, L.; Shi, Y.; Ruan, J. Preferential Assimilation of NH4+ over NO3− in Tea Plant Associated with Genes Involved in Nitrogen Transportation, Utilization and Catechins Biosynthesis. Plant Sci. 2020, 291, 110369. [Google Scholar] [CrossRef]
- Silva, R.C.P.; Oliveira, F.d.A.d.; de Oliveira, A.P.; de Medeiros, J.F.; Alves, R.d.C.; Paiva, F.I.G. Bell Pepper Production Under Saline Stress and Fertigation with Different K+/Ca2+ Ratios in a Protected Environment. Acta Sci. Agron. 2020, 42, e42498. [Google Scholar] [CrossRef]
- Ayers, R.S.; Westcot, D.W. A Qualidade da Água Para Irrigação; Universidade Federal da Paraíba: Campina Grande, Brazil, 1999. [Google Scholar]
- de Medeiros, J.F.; Duarte, S.R.; Fernandes, P.D.; Dias, N.d.S.; Gheyi, H.R. Crescimento e Acúmulo de N, P e K Pelo Meloeiro Irrigado Com Água Salina. Hortic. Bras. 2008, 26, 452–457. [Google Scholar] [CrossRef]
- Morais, P.L.D.; Dias, N.d.S.; de Oliveira, A.M.; de Sousa Neto, O.N.; Sarmento, J.D.A.; Gonzaga, M.I.S. Effects of Nutrient Solution Salinity on the Physiological Performance of Melon Cul-Tivated in Coconut Fiber. Rev. Caatinga 2018, 31, 713–718. [Google Scholar] [CrossRef]
- Pereira, F.A.d.L.; de Medeiros, J.F.; Gheyi, H.R.; Dias, N.d.S.; Preston, W.; Vasconcelos, C.B.e.L. Tolerance of Melon Cultivars to Irrigation Water Salinity. Rev. Bras. Eng. Agrícola Ambient. 2017, 21, 846–851. [Google Scholar] [CrossRef]
- Salim Akhter, M.; Noreen, S.; Mahmood, S.; Athar, H.-R.; Ashraf, M.; Abdullah Alsahli, A.; Ahmad, P. Influence of Salinity Stress on PSII in Barley (Hordeum vulgare L.) Genotypes, Probed by Chlorophyll-a Fluorescence. J. King Saud. Univ. Sci. 2021, 33, 101239. [Google Scholar] [CrossRef]
- Kıymacı, G.; Seymen, M.; Yavuz, D.; Türkmen, Ö.; Kurtar, E.S.; Arı, B.Ç.; Kal, Ü.; Metin, D.; Atakul, Z.; Yavuz, N. Responses of Leaf Pigment and Nutrient Contents and Photosynthetic Activity to Water Stress: Prospects for Selection of Water Stress-Tolerant Melon Landrace Genotypes. Commun. Soil Sci. Plant Anal. 2025, 1–20. [Google Scholar] [CrossRef]
- Melo, A.S.; Suassuna, J.F.; Fernandes, P.D.; Brito, M.E.B.; Suassuna, A.F.; de Aguiar Netto, A.O. Crescimento Vegetativo, Resistência Estomática, Eficiência Fotossintética e Rendimento do Fruto da Melancieira em Diferentes Níveis de Água. Acta Sci. Agron. 2010, 32, 73–79. [Google Scholar] [CrossRef]
- Santos, C.M.; Endres, L.; de Araújo Gomes, T.C.; Jadoski, C.J.; do Nascimento, L.A.; dos Santos, E.D. Photosynthetic Measurements in Lettuce Submitted to Different Agroindustrial Residue Composting. Appl. Res. Agrotechnol. 2010, 3. Available online: https://www.researchgate.net/publication/277827663_Photosynthetic_measurements_in_lettuce_submitted_to_different_agroindustrial_residue_composting (accessed on 28 August 2025).
- de Lacerda, C.N.; de Lima, G.S.; Soares, L.A.d.A.; de Fátima, R.T.; Gheyi, H.R.; de Azevedo, C.A.V. Morphophysiology and Production of Guava as a Function of Water Salinity and Salicylic Acid. Rev. Bras. Eng. Agrícola Ambient. 2022, 26, 451–458. [Google Scholar] [CrossRef]
- Silva, A.A.R.; de Lima, G.S.; de Azevedo, C.A.V.; Gheyi, H.R.; de Souza, A.R.; Fernandes, P.D. Salicylic Acid Relieves the Effect of Saline Stress on Soursop Morphysiology. Ciência Agrotecnol. 2021, 45, e007021. [Google Scholar] [CrossRef]
- Lacerda, C.F.; Ferreira, J.F.S.; Liu, X.; Suarez, D.L. Evapotranspiration as a Criterion to Estimate Nitrogen Requirement of Maize Under Salt Stress. J. Agron. Crop Sci. 2016, 202, 192–202. [Google Scholar] [CrossRef]
- Ashraf, M.; Shahzad, S.M.; Imtiaz, M.; Rizwan, M.S. Salinity Effects on Nitrogen Metabolism in Plants—Focusing on the Activities of Nitrogen Metabolizing Enzymes: A Review. J. Plant Nutr. 2018, 41, 1065–1081. [Google Scholar] [CrossRef]
- Campos, S.d.M.; de Assis Oliveira, F.; de Oliveira, F.R.A.; da Silva, R.C.P.; dos Santos Candido, W. Efeito da Salinidade e Fontes de Nitrogênio na Matéria Seca do Girassol. Rev. Verde Agroecol. Desenvolv. Sustentável 2010, 5, 24. [Google Scholar]
- Soil Survey Staff. Keys to Soil Taxonomy. Available online: https://www.nrcs.usda.gov/resources/guides-and-instructions/keys-to-soil-taxonomy (accessed on 7 April 2025).
- Morais, A.A.D.E.; Melo, R.A.d.C.; da Silva, J.; Braga, M.B.; Pereira, R.B.; Oliveira, V.R. Cultivo de Melão Nobre Tipo Cantaloupe em Substrato Sob Ambiente Protegido. 2019. Available online: https://www.embrapa.br/busca-de-publicacoes/-/publicacao/1110287/cultivo-de-melao-nobre-tipo-cantaloupe-em-substrato-sob-ambiente-protegido (accessed on 24 January 2025).
- Almeida, C.D.G.C.; Silva, D.M.O.; de Almeida, B.G.; Silva, Ê.F.d.F.e.; Barbosa, R.N.; Júnior, J.A.S. FDR ECH2O Sensor Performance in Spodosols. Dyna 2018, 85, 60–64. [Google Scholar] [CrossRef]
- Richards, L.A. Diagnosis and Improvement of Saline and Alkali Soils; US Government Printing Office: Washington, DC, USA, 1954. [Google Scholar]
- Arnon, D.I. Copper Enzymes in Isolated Chloroplasts. Polyphenoloxidase in Beta Vulgaris. Plant Physiol. 1949, 24, 1. [Google Scholar] [CrossRef]
- Evans, G.C. The Quantitative Analysis of Plant Growth; University of California Press: Berkeley, CA, USA, 1972; Volume 1, ISBN 0520094328. [Google Scholar]
- Beadle, C.L. Growth Analysis. In Photosynthesis and Production in a Changing Environment: A Field and Laboratory Manual; Springer: Berlin/Heidelberg, Germany, 1993; pp. 36–46. [Google Scholar]
- Benincasa, M.M.P. Análise de Crescimento de Plantas: Nogoes Básicas; Livraria Funep: Jaboticabal, Brazil, 2003. [Google Scholar]
- Ferreira, D.F. Sisvar: A Computer Analysis System to Fixed Effects Split Plot Type Designs. Rev. Bras. Biom. 2019, 37, 529–535. [Google Scholar] [CrossRef]
- Guelfi, D. Fertilizantes Nitrogenados Estabilizados, de Liberação Lenta ou Controlada; IPNI: Piracicaba, Brazil, 2017. [Google Scholar]
- Dias, V.P.; Fernandes, E. Fertilizantes: Uma Visão Global Sintética; BNDES: Rio de Janeiro, Brazil, 2006. [Google Scholar]
- Ahmad, P.; Ahanger, M.A.; Alyemeni, M.N.; Wijaya, L.; Egamberdieva, D.; Bhardwaj, R.; Ashraf, M. Zinc Application Mitigates the Adverse Effects of NaCl Stress on Mustard [Brassica Juncea (L.) Czern & Coss] Through Modulating Compatible Organic Solutes, Antioxidant Enzymes, and Flavonoid Content. J. Plant Interact. 2017, 12, 429–437. [Google Scholar] [CrossRef]
- Kaur, H.; Sirhindi, G.; Bhardwaj, R.; Alyemeni, M.N.; Siddique, K.H.M.; Ahmad, P. 28-Homobrassinolide Regulates Antioxidant Enzyme Activities and Gene Expression in Response to Salt- and Temperature-Induced Oxidative Stress in Brassica Juncea. Sci. Rep. 2018, 8, 8735. [Google Scholar] [CrossRef]
- Kaya, C.; Higgs, D.; Ashraf, M.; Alyemeni, M.N.; Ahmad, P. Integrative Roles of Nitric Oxide and Hydrogen Sulfide in Melatonin-induced Tolerance of Pepper (Capsicum Annuum L.) Plants to Iron Deficiency and Salt Stress Alone or in Combination. Physiol. Plant 2020, 168, 256–277. [Google Scholar] [CrossRef]
- Ahmad, P.; Abass Ahanger, M.; Nasser Alyemeni, M.; Wijaya, L.; Alam, P.; Ashraf, M. Mitigation of Sodium Chloride Toxicity in Solanum lycopersicum L. by Supplementation of Jasmonic Acid and Nitric Oxide. J. Plant Interact. 2018, 13, 64–72. [Google Scholar] [CrossRef]
- Tavakkoli, E.; Fatehi, F.; Coventry, S.; Rengasamy, P.; McDonald, G.K. Additive Effects of Na+ and Cl− Ions on Barley Growth Under Salinity Stress. J. Exp. Bot. 2011, 62, 2189–2203. [Google Scholar] [CrossRef] [PubMed]
- Contreras, J.I.; Plaza, B.M.; Lao, M.T.; Segura, M.L. Growth and Nutritional Response of Melon to Water Quality and Nitrogen Potassium Fertigation Levels Under Greenhouse Mediterranean Conditions. Commun. Soil Sci. Plant Anal. 2012, 43, 434–444. [Google Scholar] [CrossRef]
- Sanchez-Zabala, J.; González-Murua, C.; Marino, D. Mild Ammonium Stress Increases Chlorophyll Content in Arabidopsis Thaliana. Plant Signal. Behav. 2015, 10, e991596. [Google Scholar] [CrossRef]
- Zhao, H.; Liang, H.; Chu, Y.; Sun, C.; Wei, N.; Yang, M.; Zheng, C. Effects of Salt Stress on Chlorophyll Fluorescence and the Antioxidant System in Ginkgo biloba L. Seedlings. HortScience 2019, 54, 2125–2133. [Google Scholar] [CrossRef]
- Lima, G.S.; Silva, S.S.; Soares, L.A.A.; Silva, A.A.R.; Gheyi, H.R.; Nobre, R.G.; Souza, W.B.B.; Silva, S.T.A.; Guedes, M.A.; Oliveira, V.K.N. Irrigation with Saline Water in the Cultivation of Mini Watermelon Under Phosphate Fertilization. Braz. J. Biol. 2023, 83, e274991. [Google Scholar] [CrossRef]
- Arif, Y.; Singh, P.; Siddiqui, H.; Bajguz, A.; Hayat, S. Salinity Induced Physiological and Biochemical Changes in Plants: An Omic Approach Towards Salt Stress Tolerance. Plant Physiol. Biochem. 2020, 156, 64–77. [Google Scholar] [CrossRef]
- Cunha, J.G.; da Silva, R.F.; Miranda, R.d.S.; Pereira, G.A.; de Araújo Costa, E.W.; da Silva, J.F.; Prado, R.d.M.; da Silva Júnior, G.B. Ammonium and Nitrate Distinctly Regulate Photosynthetic and Growth Performance, Eliciting Antagonistic Responses in Yellow Passion Fruit Plants. Sci. Hortic. 2024, 330, 113022. [Google Scholar] [CrossRef]
- Shabala, S.; Munns, R. Salinity Stress: Physiological Constraints and Adaptive Mechanisms. In Plant Stress Physiology; CABI: Wallingford, UK, 2012; pp. 59–93. [Google Scholar]
- Castañares, J.L.; Alberto Bouzo, C. Effect of Exogenous Melatonin on Seed Germination and Seedling Growth in Melon (Cucumis melo L.) Under Salt Stress. Hortic. Plant J. 2019, 5, 79–87. [Google Scholar] [CrossRef]
- Zhang, L.-X.; Chang, Q.-S.; Hou, X.-G.; Liu, W.; Li, X.-P.; Gao, Y.-H.; Zhang, X.-L.; Ding, S.-Y.; Xiao, R.-X.; Zhang, Y. Effects of NaCl Stress on Antioxidant Capacity and Photosynthetic Characteristics of Prunella Vulgaris Seedlings. Acta Pratacult. Sin. 2017, 26, 167. [Google Scholar]
- Maathuis, F.J.M. Sodium in Plants: Perception, Signalling, and Regulation of Sodium Fluxes. J. Exp. Bot. 2014, 65, 849–858. [Google Scholar] [CrossRef]
- Guo, J.S.; Zhou, Q.; Li, X.J.; Yu, B.J.; Luo, Q.Y. Enhancing NO3− Supply Confers NaCl Tolerance by Adjusting Cl− Uptake and Transport in G. Max & G. Soja. J. Soil Sci. Plant Nutr. 2017, 17, 194–202. [Google Scholar] [CrossRef]
- Hütsch, B.W.; He, W.; Schubert, S. Nitrogen Nutritional Status of Young Maize Plants (Zea Mays) Is Not Limited by NaCl Stress. J. Plant Nutr. Soil Sci. 2016, 179, 775–783. [Google Scholar] [CrossRef]
- Tang, Z.; Liu, Y.; Guo, X.; Zu, Y. The Combined Effects of Salinity and Nitrogen Forms on Catharanthus Roseus: The Role of Internal Ammonium and Free Amino Acids during Salt Stress. J. Plant Nutr. Soil Sci. 2011, 174, 135–144. [Google Scholar] [CrossRef]
- Noor, J.; Ahmad, I.; Ullah, A.; Iqbal, B.; Anwar, S.; Jalal, A.; Okla, M.K.; Alaraidh, I.A.; Abdelgawad, H.; Fahad, S. Enhancing Saline Stress Tolerance in Soybean Seedlings through Optimal NH4+/NO3− Ratios: A Coordinated Regulation of Ions, Hormones, and Antioxidant Potential. BMC Plant Biol. 2024, 24, 572. [Google Scholar] [CrossRef]
- Vieira, D.A.d.P.; Portes, T.d.A.; Stacciarini-Seraphin, E.; Teixeira, J.B. Fluorescência e Teores de Clorofilas em Abacaxizeiro cv. Pérola Submetido a Diferentes Concentrações de Sulfato de Amônio. Rev. Bras. Frutic. 2010, 32, 360–368. [Google Scholar] [CrossRef]
- Taiz, L.; Zeiger, E.; Moller, I.M.; Murphy, A. Physiology and Plant Development, 6th ed.; Ed. Artmed: Porto Alegre, Brazil, 2017; pp. 1–888. Available online: https://books.google.com.br/books?hl=pt-BR&lr=&id=PpO4DQAAQBAJ&oi=fnd&pg=PR1&dq=Physiology+and+Plant+Develop-ment.+6th+ed.%3B+Ed.+Artmed:+Porto+Alegre,+Brazil,+2017&ots=7SFmvYJNSe&sig=4DHeO0R8kXA7lufsGhmYzyJCMPE&redir_esc=y#v=onepage&q=Physiology%20and%20Plant%20Development.%206th%20ed.%3B%20Ed.%20Artmed%3A%20Porto%20Alegre%2C%20Brazil%2C%202017&f=false (accessed on 28 August 2025).
- Aras, S.; Keles, H.; Bozkurt, E. Physiological and Histological Responses of Peach Plants Grafted onto Different Rootstocks Under Calcium Deficiency Conditions. Sci. Hortic. 2021, 281, 109967. [Google Scholar] [CrossRef]
- Liang, C.; Zhang, Y.; Ren, X. Calcium Regulates Antioxidative Isozyme Activity for Enhancing Rice Adaption to Acid Rain Stress. Plant Sci. 2021, 306, 110876. [Google Scholar] [CrossRef] [PubMed]
- Azevedo Neto, A.D.; Pereira, P.P.A.; Costa, D.P.; dos Santos, A.C.C. Fluorescência da Clorofila Como Uma Ferramenta Possível Para Seleção de Tolerância à Salinidade em Girassol. Rev. Ciência Agronômica 2011, 42, 893–897. [Google Scholar] [CrossRef]
- Freire, J.L.d.O.; Dias, T.J.; Cavalcante, L.F.; Fernandes, P.D.; de Lima Neto, A.J. Rendimento Quântico e Trocas Gasosas em Maracujazeiro Amarelo Sob Salinidade Hídrica, Biofertilização e Cobertura Morta. Rev. Ciência Agronômica 2014, 45, 82–91. [Google Scholar] [CrossRef][Green Version]
- Sá, F.V.d.S.; Gheyi, H.R.; de Lima, G.S.; Ferreira Neto, M.; de Paiva, E.P.; Silva, L.D.A.; Moreira, R.C.L. Cultivation of West Indian Cherry Irrigated with Saline Water Under Phosphorus and Nitrogen Proportions. Cabi 2020, 41, 395–406. [Google Scholar] [CrossRef]
- Oliveira, W.J.; de Souza, E.R.; Santos, H.R.B.; de França, Ê.F.; Duarte, H.H.F.; de Melo, D.V.M. Fluorescência da Clorofila Como Indicador de Estresse Salino em Feijão Caupi. Rev. Bras. Agric. Irrig. 2018, 12, 2592. [Google Scholar] [CrossRef]
- Saddiq, M.S.; Iqbal, S.; Hafeez, M.B.; Ibrahim, A.M.H.; Raza, A.; Fatima, E.M.; Baloch, H.; Jahanzaib; Woodrow, P.; Ciarmiello, L.F. Effect of Salinity Stress on Physiological Changes in Winter and Spring Wheat. Agronomy 2021, 11, 1193. [Google Scholar] [CrossRef]
- Oliveira, V.K.N.; da Silva, A.A.R.; de Lima, G.S.; dos Soares, L.A.A.; Gheyi, H.R.; de Lacerda, C.F.; de Azevedo, C.A.V.; Nobre, R.G.; Garófalo Chaves, L.H.; Dantas Fernandes, P.; et al. Foliar Application of Salicylic Acid Mitigates Saline Stress on Physiology, Production, and Post-Harvest Quality of Hydroponic Japanese Cucumber. Agriculture 2023, 13, 395. [Google Scholar] [CrossRef]
- Nobre, R.G.; de Lima, G.S.; Gheyi, H.R.; Lourenço, G.d.S.; Soares, L.A.d.A. Emergência, Crescimento e Produção da Mamoneira Sob Estresse Salino e Adubação Nitrogenada. Rev. Ciência Agronômica 2013, 44, 76–85. [Google Scholar] [CrossRef]
- Taiz, L.; Zeiger, E. Fisiologia Vegetal, 5th ed.; Ed. Artmed: Porto Alegre, Brazil, 2013. [Google Scholar]
- Sarabi, B.; Bolandnazar, S.; Ghaderi, N.; Ghashghaie, J. Genotypic Differences in Physiological and Biochemical Responses to Salinity Stress in Melon (Cucumis melo L.) Plants: Prospects for Selection of Salt Tolerant Landraces. Plant Physiol. Biochem. 2017, 119, 294–311. [Google Scholar] [CrossRef]
- Dias, A.S.; de Lima, G.S.; Pinheiro, F.W.A.; Gheyi, H.R.; dos Soares, L.A.A. Gas Exchanges, Quantum Yield and Photosynthetic Pigments of West Indian Cherry Under Salt Stress and Potassium Fertilization. Rev. Caatinga 2019, 32, 429–439. [Google Scholar] [CrossRef]
- Pan, T.; Liu, M.; Kreslavski, V.D.; Zharmukhamedov, S.K.; Nie, C.; Yu, M.; Kuznetsov, V.V.; Allakhverdiev, S.I.; Shabala, S. Non-Stomatal Limitation of Photosynthesis by Soil Salinity. Crit. Rev. Environ. Sci. Technol. 2021, 51, 791–825. [Google Scholar] [CrossRef]
- Trușcă, M.; Gâdea, Ș.; Vidican, R.; Stoian, V.; Vâtcă, A.; Balint, C.; Stoian, V.A.; Horvat, M.; Vâtcă, S. Exploring the Research Challenges and Perspectives in Ecophysiology of Plants Affected by Salinity Stress. Agriculture 2023, 13, 734. [Google Scholar] [CrossRef]
- Silva, F.H.A.; de Morais, P.L.D.; da Silva Dias, N.; de Sousa Nunes, G.H.; de Morais, M.B.; Melo, M.F.; de Albuquerque Nascimento, M.T. Physiological Aspects of Melon (Cucumis melo L.) as a Function of Salinity. J. Plant Growth Regul. 2021, 40, 1298–1314. [Google Scholar] [CrossRef]
- Lima, R.E.M.; Araújo, L.F.; Farias, L.F.d.L.; Bezerra, M.A. Biometrics, Physiology, Production, and Quality of Cantaloupe Melons Grown with Saline Waters Under Semi-Arid Conditions. Comun. Sci. 2020, 11, e3249. [Google Scholar] [CrossRef]
- Fernandes, C.d.S.; Ferreira-Neto, M.; Dias, N.d.S.; Reges, L.B.L.; Silva, L.d.A.; Moreira, R.C.L.; da Silva, A.Á.; de Paiva, E.P.; Fernandes, P.D.; Sá, F.V.d.S. The Appropriate Source of Nitrogen for Italian Zucchini Under Salt Stress Conditions. J. Soil Sci. Plant Nutr. 2022, 22, 560–570. [Google Scholar] [CrossRef]
- Costa, N.D. A Cultura Do Melão/Embrapa Semi-Árido. Embrapa Informação Tecnológica (Coleção Plantar), 3rd ed.; Ed. Embrapa Informação Tecnológica (Coleção Plantar): Brasília, Brazil, 2017; pp. 1–202. [Google Scholar]
- Siqueira, J.M.; de Oliveira, G.M.; Leitão, M.d.M.V.B.R.; Santiago, E.J.P.; Santos, G.V.d.S. Determination the Water Needs of Melon for Two Planting Seasons, in the Submedium Region of Vale Do São Francisco. Irriga 2022, 27, 825–842. [Google Scholar] [CrossRef]
Disclaimer/Publisher’s Note: The statements, opinions and data contained in all publications are solely those of the individual author(s) and contributor(s) and not of MDPI and/or the editor(s). MDPI and/or the editor(s) disclaim responsibility for any injury to people or property resulting from any ideas, methods, instructions or products referred to in the content. |
© 2025 by the authors. Licensee MDPI, Basel, Switzerland. This article is an open access article distributed under the terms and conditions of the Creative Commons Attribution (CC BY) license (https://creativecommons.org/licenses/by/4.0/).