Article

Three-Dimensional Modeling of Tidal Delta Reservoirs Based on Sedimentary Dynamics Simulations

1
School of Energy Resources, China University of Geosciences (Beijing), Beijing 100083, China
2
China Petroleum Exploration and Development Research Institute, Beijing 100083, China
3
Key Laboratory of Marine Reservoir Evolution and Hydrocarbon Enrichment Mechanism, Ministry of Education, Beijing 100083, China
4
Key Laboratory of Deep Oil and Gas, China University of Petroleum, Qingdao 266580, China
*
Authors to whom correspondence should be addressed.
Appl. Sci. 2025, 15(17), 9527; https://doi.org/10.3390/app15179527 (registering DOI)
Submission received: 2 April 2025 / Revised: 23 June 2025 / Accepted: 2 July 2025 / Published: 29 August 2025
(This article belongs to the Special Issue Advances in Petroleum Exploration and Application)

Abstract

To increase the reliability of three-dimensional (3D) geological models in areas characterized by sparse well data and poor seismic quality, a sedimentary dynamics simulation was conducted on the J7 tidal delta sedimentary reservoir in the Y gas field, which is located in the West Siberian Basin. A 3D sedimentary model of the study area was developed by defining parameters such as bottom topography, water level, tidal range, river discharge, and wave amplitude. By integrating the reservoir characteristics, the sedimentary dynamics simulation results were transformed into a three-dimensional training template for multipoint geostatistical modeling. Simultaneously, the channel and bar parameters derived from the sedimentary dynamics simulation served as variable inputs for attribute modeling. Combined with well data, a 3D geological model of the reservoir was constructed and subsequently validated using verification wells. The results demonstrate that the reliability of reservoir lithology modeling—when constrained by three-dimensional training templates generated through sedimentary dynamics simulation—is significantly higher than that achieved using sequential Indicator simulation. Three-dimensional modeling of tidal delta reservoirs, employing coupled sedimentary dynamics simulations and multipoint geostatistical methods, can effectively enhance the reliability of reservoir geological models in areas with sparse well data, thereby providing a robust foundation for subsequent well deployment and development.

1. Introduction

In recent years, a range of hydrocarbon reservoirs formed in tide-dominated delta systems have been discovered worldwide, such as the lower Cretaceous reservoir in the Alberta Basin, Canada [1], and the Jurassic gas reservoir in the West Siberia Basin, Russia. Therefore, the sedimentary system of tidal deltas has attracted increasing attention from sedimentologists [2]. Currently, the most popular approaches for investigating tidal-controlled delta deposits include field outcrop surveys, modern sediment case anatomy, seismic data, and logging curve interpretation and analysis. Field outcrops of ancient sediments are extremely rare and can offer only two-dimensional (2D) structural information; however, internal three-dimensional (3D) structural information is lacking. Great anatomical limitations exist with modern sedimentary examples. Seismic data have rather limited resolution. Research information is less available for certain areas without or with few wells because of the shortage of logging data [3].
The sedimentary dynamics approach, also called sedimentary simulation, is a sedimentology- and hydrodynamics-based technology for describing and forecasting reservoirs, which enables quantitative temporal and spatial simulations of real clastic sedimentary systems in nature [4,5,6,7]. Numerical simulation research on sedimentation started in the 1960s. After the 21st century, numerical simulation technology began to serve the oil industry and was gradually applied to sedimentation research. Today, many scholars and experts worldwide have applied the sedimentary dynamics approach to the study of sedimentary facies. Schramkowski numerically simulated tide-controlled estuaries in 2002 [8]. Toffolon and Crosato (2007) investigated the morphology of tidal-controlled estuarine sand bars [9]. In 2018, Hillen et al. examined the influence of waves on the morphology of onshore clastic deltas [10]. Weisscher et al. employed morphological dynamics modeling via Nays2D v2.0 sediment numerical simulation software to assess the effects of dynamic inflow on river and meandering river morphologies [11]. In 2019, Tang et al. conducted reservoir configuration research on tide-controlled estuaries through numerical simulation [12]. In 2020, Zhou et al. analyzed the cause of reservoir bar formation in tidal estuaries via numerical simulations of sedimentation [13]. At present, numerical simulation has become a scientific technique for exploring the sedimentary characteristics of tidally controlled deltas. The application of sedimentary dynamics simulations to tidally controlled deltas can lay a profound foundation for revealing the internal configuration and distribution law of sand bodies.
Reservoir characterization is an important task in the field of petroleum and gas exploration and development. The multipoint geostatistical method is derived from reservoir sedimentary facies modeling. It has the advantages of traditional two-point geostatistics and goal-based modeling methods, and the simulation results are more reliable. The multipoint geostatistical method introduces an innovative conceptual model—the three-dimensional training template—which emphasizes the correlation among multiple points, enabling the reproduction of the anisotropic geological structure characteristics of complex geological bodies [14]. This 3D training template forms a conceptual model by integrating diverse data and information, thereby intuitively capturing the spatial patterns of geological structures [15]. Moreover, the application of training templates facilitates the incorporation of extensive geological knowledge, ensuring that the constructed geological models possess a robust geological foundation. This approach plays a vital role in predicting the internal attribute distributions of geological structures, reservoir formation conditions, fluid flow directions, and related aspects [16,17]. In 2019, Hu et al. proposed a methodology that combines sequential Gaussian simulation with sedimentary forward modeling to guide geological modeling by determining the optimal stratigraphic sedimentary model [18]. Inspired by this, this study established a three-dimensional training template that was consistent with the sedimentary characteristics of the study area through the sedimentary dynamics method and applied it to multipoint geostatistical modeling to achieve high-precision three-dimensional modeling.

2. Regional Research Background

The Y gas field is located southeast of the Yamal Peninsula in the West Siberia Basin. The Yamal Peninsula was a large-scale paleo-uplift developed on basement faults during the Jurassic period, which controlled the distribution of the Jurassic sedimentary system and oil and gas migration. The Jurassic J7 layer primarily represents a tidal delta environment associated with a shelf uplift belt characterized by a “two depressions and one uplift” structural pattern, where tidal action plays a dominant role [19,20,21]. During the transgression period, the ancient uplift was submerged, leading to the deposition of thick mudstone. Conversely, during the regression period, portions of the paleo-uplift were exposed above the sea surface, resulting in the deposition of multiple sets of sandstone reservoirs (see Figure 1).
In recent years, industrial gas flow has successively occurred in the central part of the area, and its marine-continental transitional reservoir has good oil and gas potential. At present, there is a lack of systematic research on Jurassic reservoirs in this area. Given the limited well data and the poor quality of seismic data, a sedimentary model was developed based on the results of sedimentary dynamics simulations, and reservoir modeling was carried out using multipoint geostatistics. The sedimentary dynamics simulations reveal the three-dimensional distribution characteristics of sand bodies and interlayers, highlighting the vertical overlap between sand body and interlayer configurations. Based on these insights, a refined template of the sand body and argillaceous distribution pattern can be established, enabling the construction of a detailed reservoir model through multipoint geostatistical methods.

3. Sedimentary Dynamics Simulation

3.1. Basic Principles of Sedimentary Dynamics Simulation

Sediment dynamics simulation is a computer technology-assisted method for simulating the reservoir evolutionary process under some sedimentary context constraints. Numerical simulations can be used to better understand the deposition process and predict the distribution of sand bodies, which can greatly reduce time and economic costs. The numerical simulation of sedimentary dynamics is applicable to areas with sparse and few wells and is a useful tool for assessing the sedimentary context, identifying the sedimentary diffusion coefficient, and clarifying the sedimentary surface distribution for a few wells. To date, sedimentary dynamics simulation approaches can be broadly categorized into two types. The first category is based on sediment erosion processes governed by the Navier–Stokes equations, which are capable of reconstructing the detailed transport and erosion processes of sediments and delineating lithologic distributions, making it suitable for short-term simulations [22]. The second category, which is based on the diffusion equation, treats sediment deposition and migration as an equivalent diffusion-driven forward simulation process [23]. Compared with the first approach, the diffusion-based method simplifies sedimentary processes, reduces computational demands, and is widely applied in long-term (on the order of tens of thousands to millions of years) formation forward modeling. Given that the deposition history of the target layer spans about 30 million years, this study adopts the second approach to forecast inter-well sediment distribution. The Delft3D v3.28.03 software, developed by Delft University of Technology in the Netherlands, is employed for this purpose, offering the ability to simulate the hydrodynamic and sedimentary geomorphic evolution of shallow marine shelves, coastal zones, estuaries, lagoons, rivers, and lakes [24]. Considering that the study area predominantly features a tidal delta sedimentary system, the flow and wave modules of Delft3D are primarily utilized.

3.2. Parameter Selection

On the basis of an idealized tidal-controlled delta model, this study simulates the formation processes of tidal channels and sand bars under the coupled influence of river discharge and tidal dynamics within a tidal-controlled delta system, with a focus on the effects of discharge and tidal intensity on sand body development. During the simulation, a single-factor analysis approach is employed to identify the primary controlling factors influencing sand body morphology in the tidal delta by systematically varying river flow and tidal intensity within the model. Moreover, simulations can obtain a series of distribution data of tidal delta sand bodies and sediments under the control of rivers and tides and provide quantitative descriptions of tidal channels, tidal sand bars, the sand body distribution, and the internal muddy interlayer distribution of tidal deltas.
The sedimentary dynamics simulation requires several input parameters, including sediment content and transport process variables. Initially, a geological conceptual model is developed based on well and seismic data, encompassing the stratigraphic framework, sedimentary facies types, and their spatial distribution. This model serves as a foundation for setting and adjusting parameters within the sedimentary simulation. Subsequently, accommodation space parameters—primarily sea-level fluctuations and subsidence—are defined. Source supply parameters, such as the number of sediment sources, their directions, supply rates, lithological proportions, and associated water flow, are then specified. Finally, transport parameters, including the particle size distribution for various lithologies, are established. Then, the parameters are adjusted, the model is optimized according to the well seismic data and the sedimentary model, and a three-dimensional distribution model of sedimentary facies and sand bodies is established.
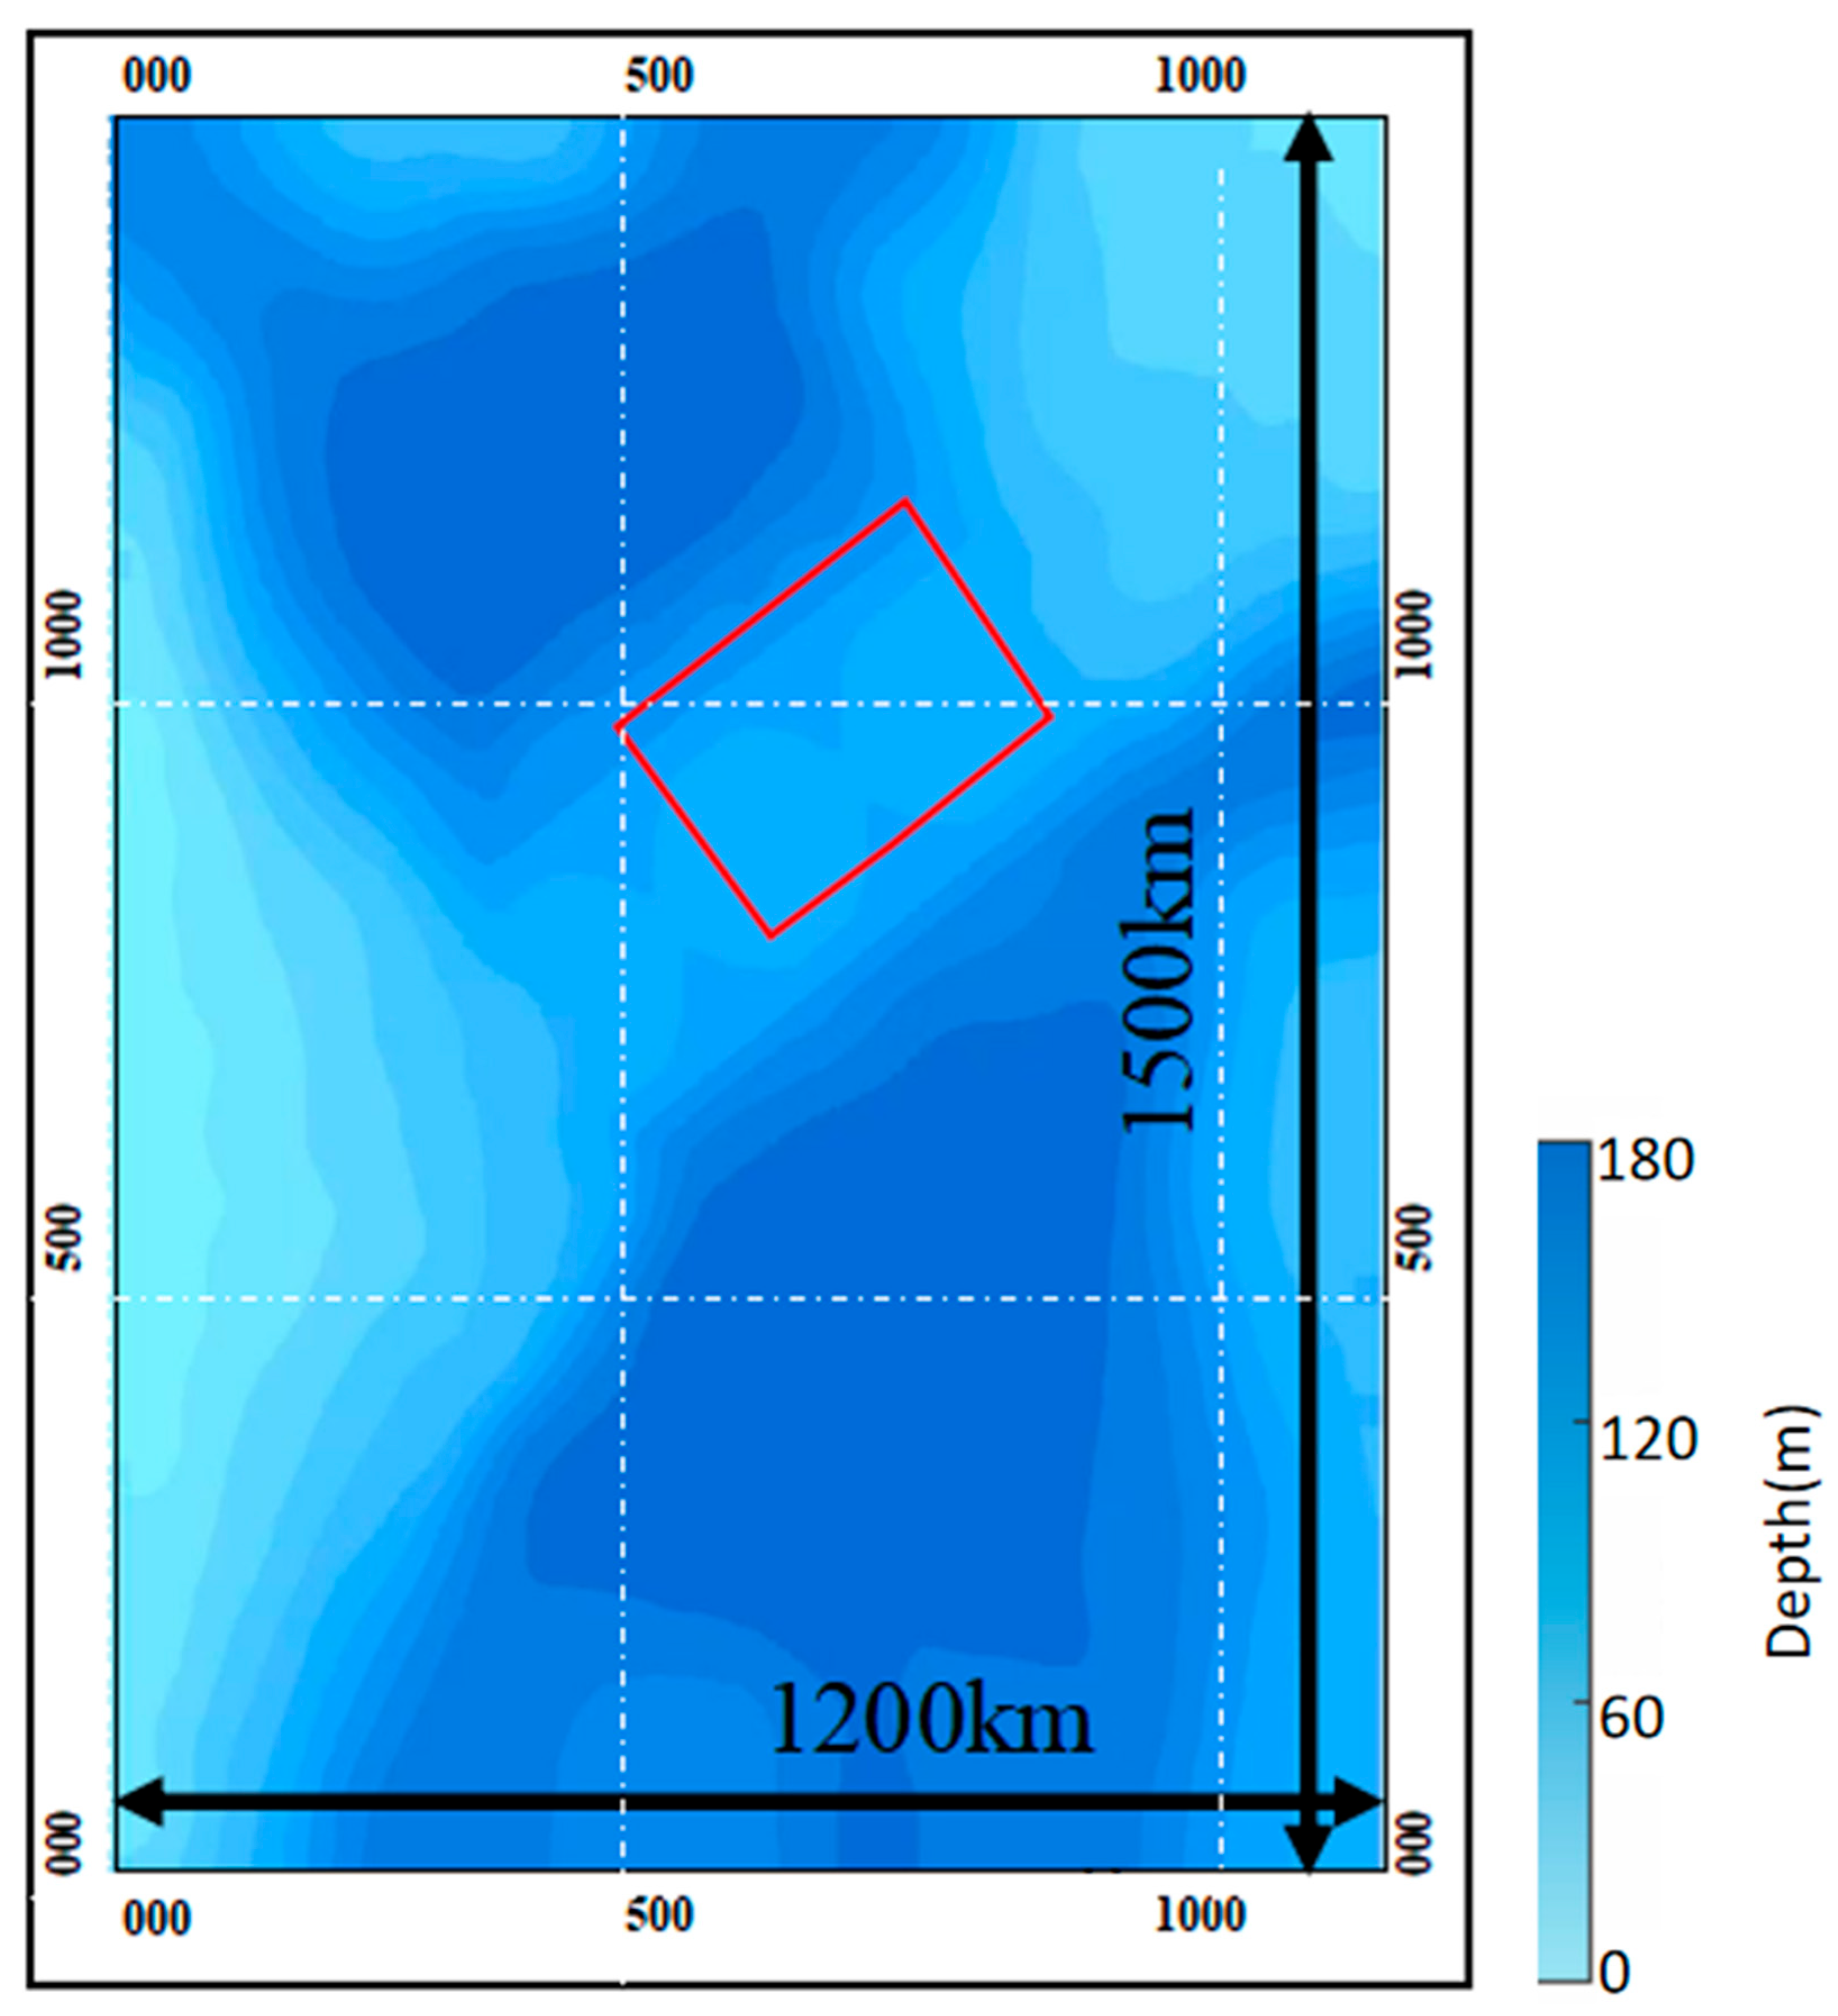
The work area is a tidal delta environment of “two depressions and one uplift” shelf uplift zone type, which is located southeast of the Yamal Peninsula in the West Siberia Basin, with an area of 2047 km2. According to previous research and modern shelf tidal delta deposition, an idealized shelf model is designed to simulate shelf uplift zone-type tidal deltas. The idealized model is a rectangle with a length of 1500 km and a width of 1200 km. The northern, eastern, and northwestern maritime boundaries are the main sources of material. Seventeen river crossings are set at the eastern, western, and northern land boundaries to simulate the river, each of which is 24 km long and wide, as shown in Figure 2.
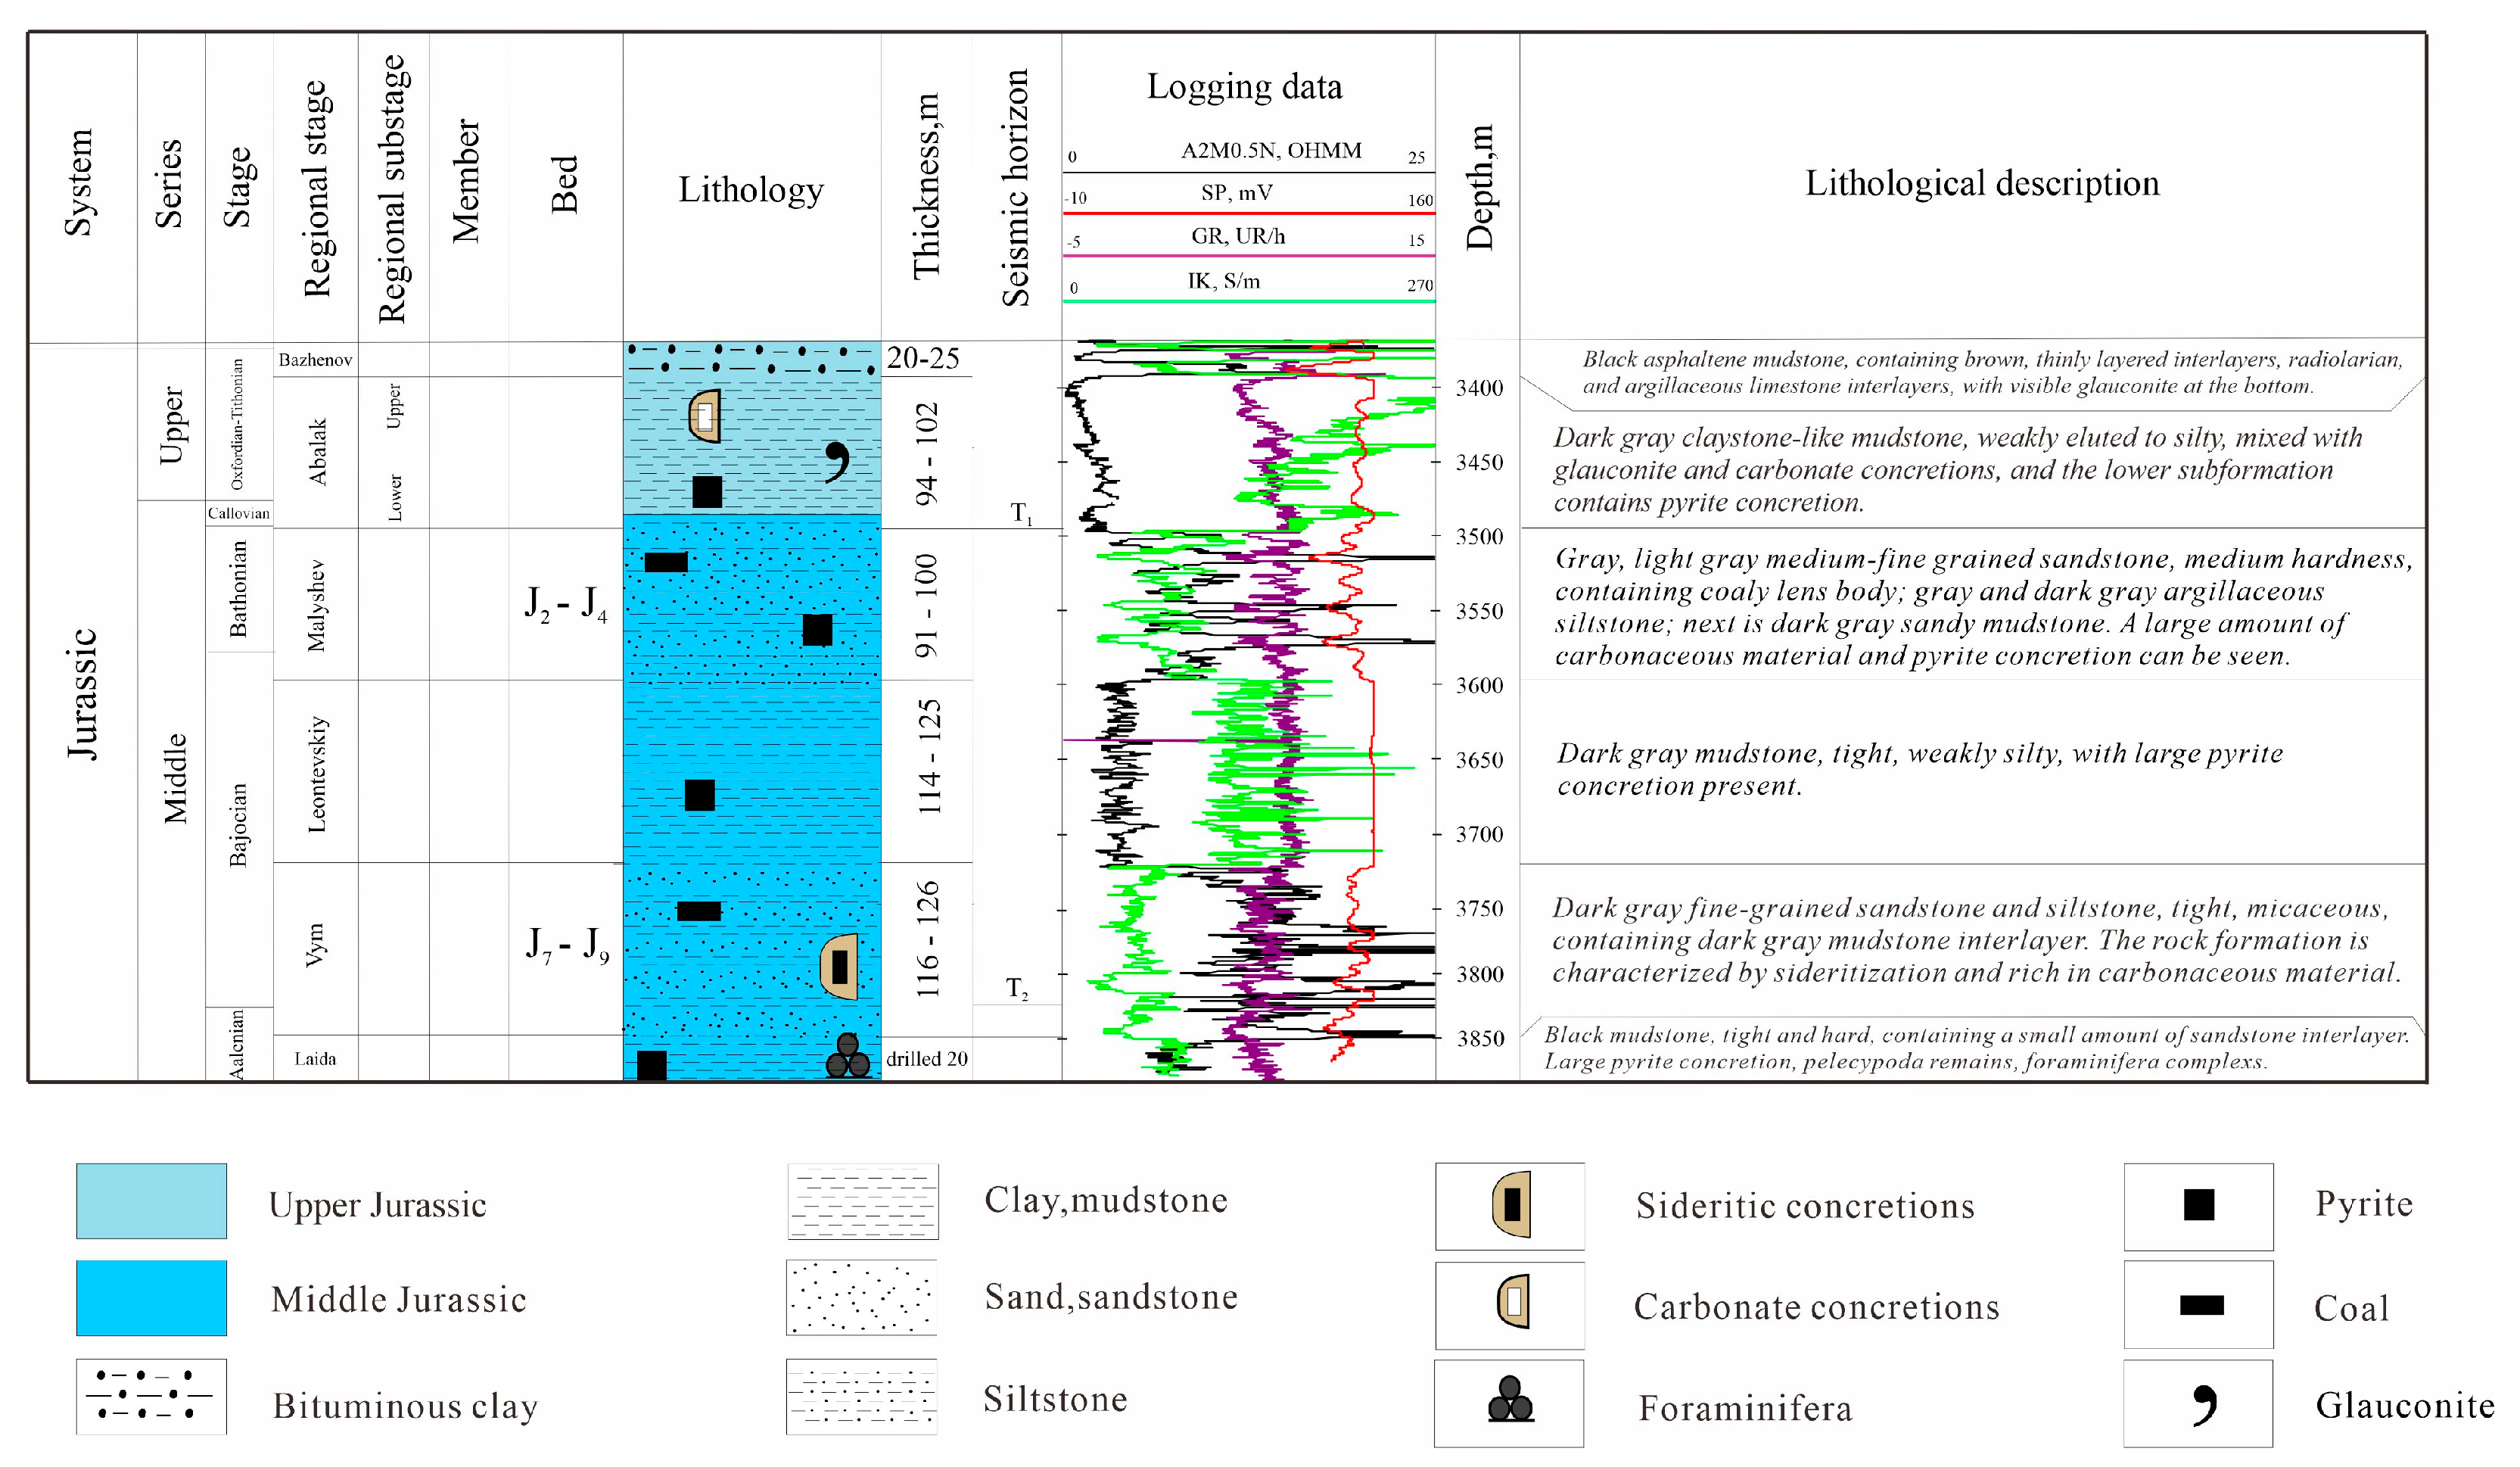
With reference to previous investigations on tidal deltas in shelf uplift zones, the hydrodynamic model is simplified relative to the equivalent diffusion model, the model in the early test stage is optimized, and a set of optimal simulation parameters is proposed as the basic model, as shown in Table 1. Taking the Jurassic Vym formation as the base shape (see Figure 3), the mesh accuracy of the model is 3 km × 3 km, the discrete time steps are 1 min, and the maximum depth is 176 m; semidiurnal tidal control is adopted, where the tidal frequency is 12 h/time and the tidal range height is 6 m; the initial water level is set at 0 m at the channel bottom in the paleo-uplift zone of the study area. The water level is set at 1 m, the river flow is 3000 m3/s, and the river sediment carrying capacity is 0.525 kg/m3. Three types of sediments are used: coarse sand, fine sand, and mud, with a content ratio of 1:1:1, and the wave height is set at 1 m [25,26].
By integrating previous research findings with analyses of the topographic, hydrodynamic, and sediment grain size characteristics of the tidal delta within the shelf uplift belt, the basic numerical model of sedimentary dynamics for the tidal delta characterized by “two depressions and one uplift” structure was refined. The sedimentary dynamics of this tidal delta system were subsequently simulated on the basis of three key factors: bottom topography, tidal processes, and water level variations. To identify the primary factors controlling the development of sand bodies within tidal deltas located in the shelf uplift belt of the “two depressions and one uplift” structural setting, and to accurately characterize the spatial distribution patterns of interlayers, five key single factors were selected for analysis: bottom topography, tidal amplitude, water level height, river discharge, and wave amplitude [27,28,29]. For each factor, two different cases were selected on the basis of the basic model, completing the simulation of 10 models in total, and Table 2 below details the parameters of each model.

3.3. Results and Discussions

3.3.1. Analysis of Bottom Shape Factors

In modern continental shelf sedimentary simulations, the bottom shape is often used as an important condition. Now, the remaining parameters are kept invariant. This paper discusses the effects of different bottom shapes on the model.
  • Sedimentary distribution analysis
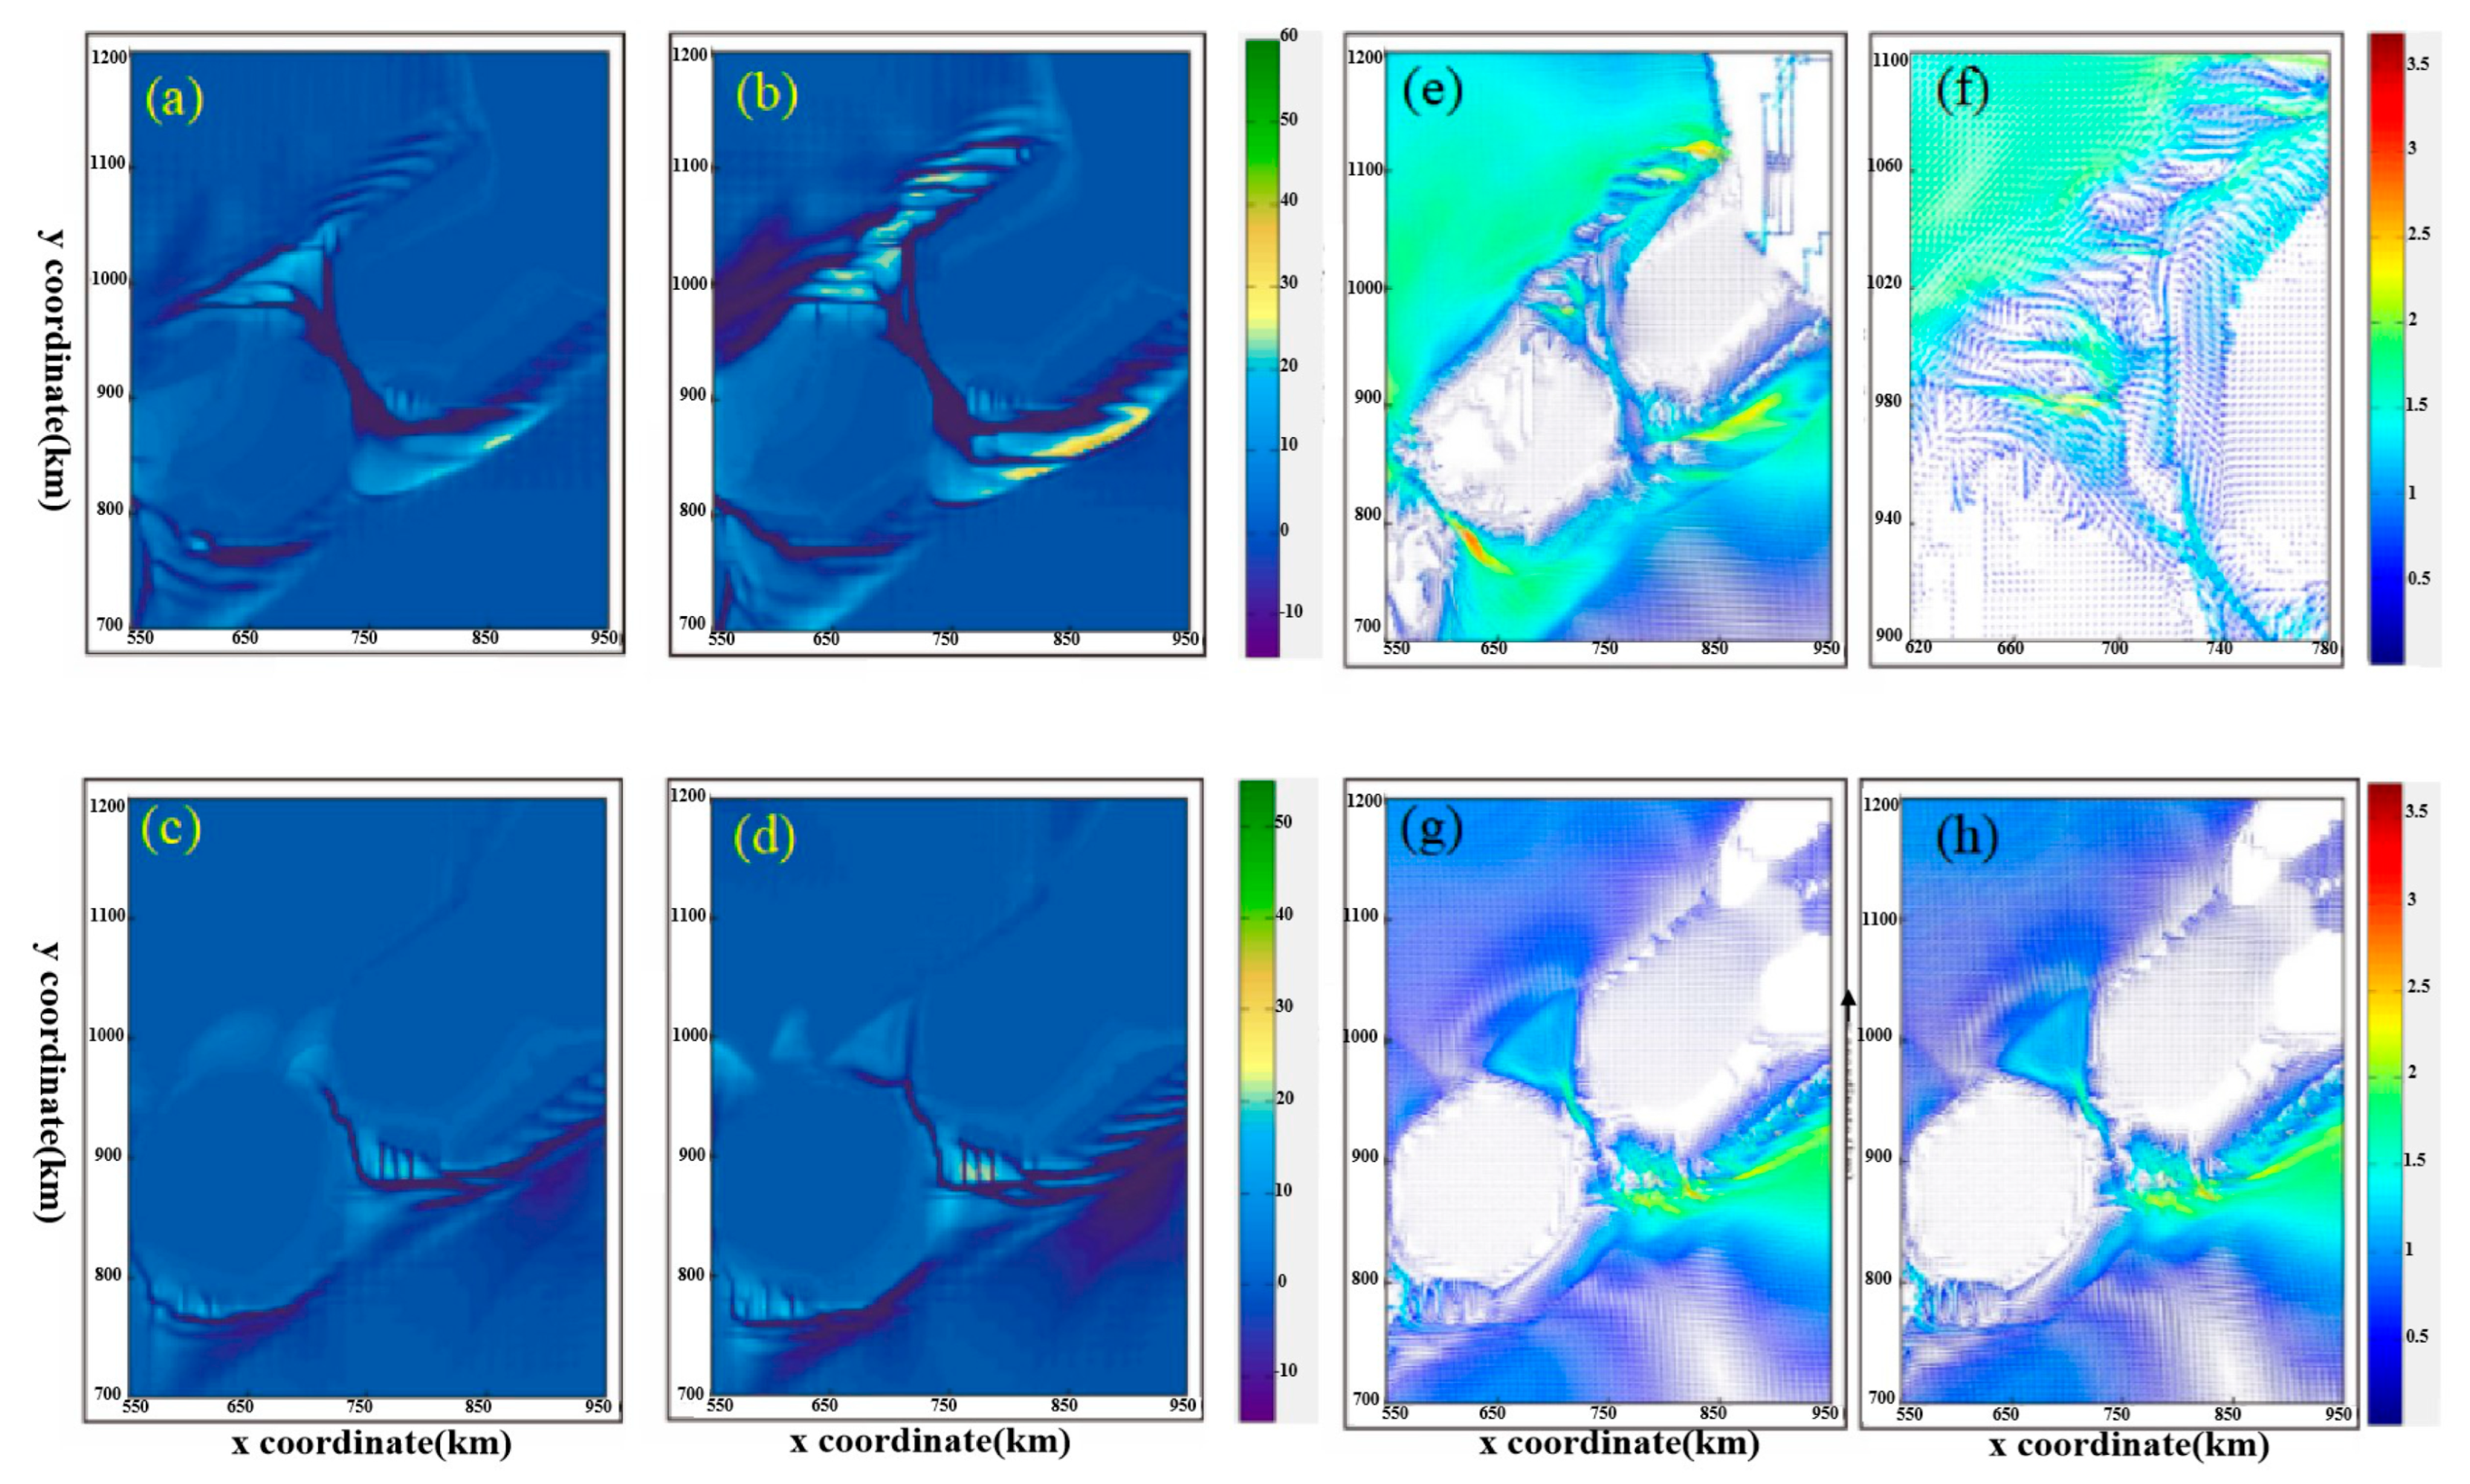
A comparison of different bottom shape models indicates that variations in bottom morphology significantly influence the development of sand bodies and fluvial channels within the study area. In the basic model, water levels in the middle and upper sections of the Vym gradually increase, with these zones predominantly characterized by sand sheets and a thin interbedded sand–mud structure. A prominent erosion surface is observed in the lower section of the Vym, representing the upper part of a regressive sequence formed under ultralow water level conditions. The associated sand bodies exhibit relatively high quality and display features typical of tidal delta bar structures within a shelf uplift zone. Although the prototype tidal bar and tidal waterway formed in the investigated area during the early simulation phase, the separation is insufficiently clear. Tidal bars and waterways clearly developed in the late stage of the simulation, and strip bars with obvious separation under the action of tidal waterways developed in the investigated area (see Figure 4). In contrast, the Malyshev layer was deposited in the high tidal level period after the gradual filling and leveling of the basin, with a few bar structures and substantial thin sand–mud interbeds. The tidal bars and tidal waterways in the investigated area during the early simulation phase are nearly undeveloped; however, during the late phase, they are not obviously developed. The development signs for the tidal bar are very weak, whereas those for the tidal waterway are few and shallow, and the development is weak.
2.
Analysis of bar characteristics
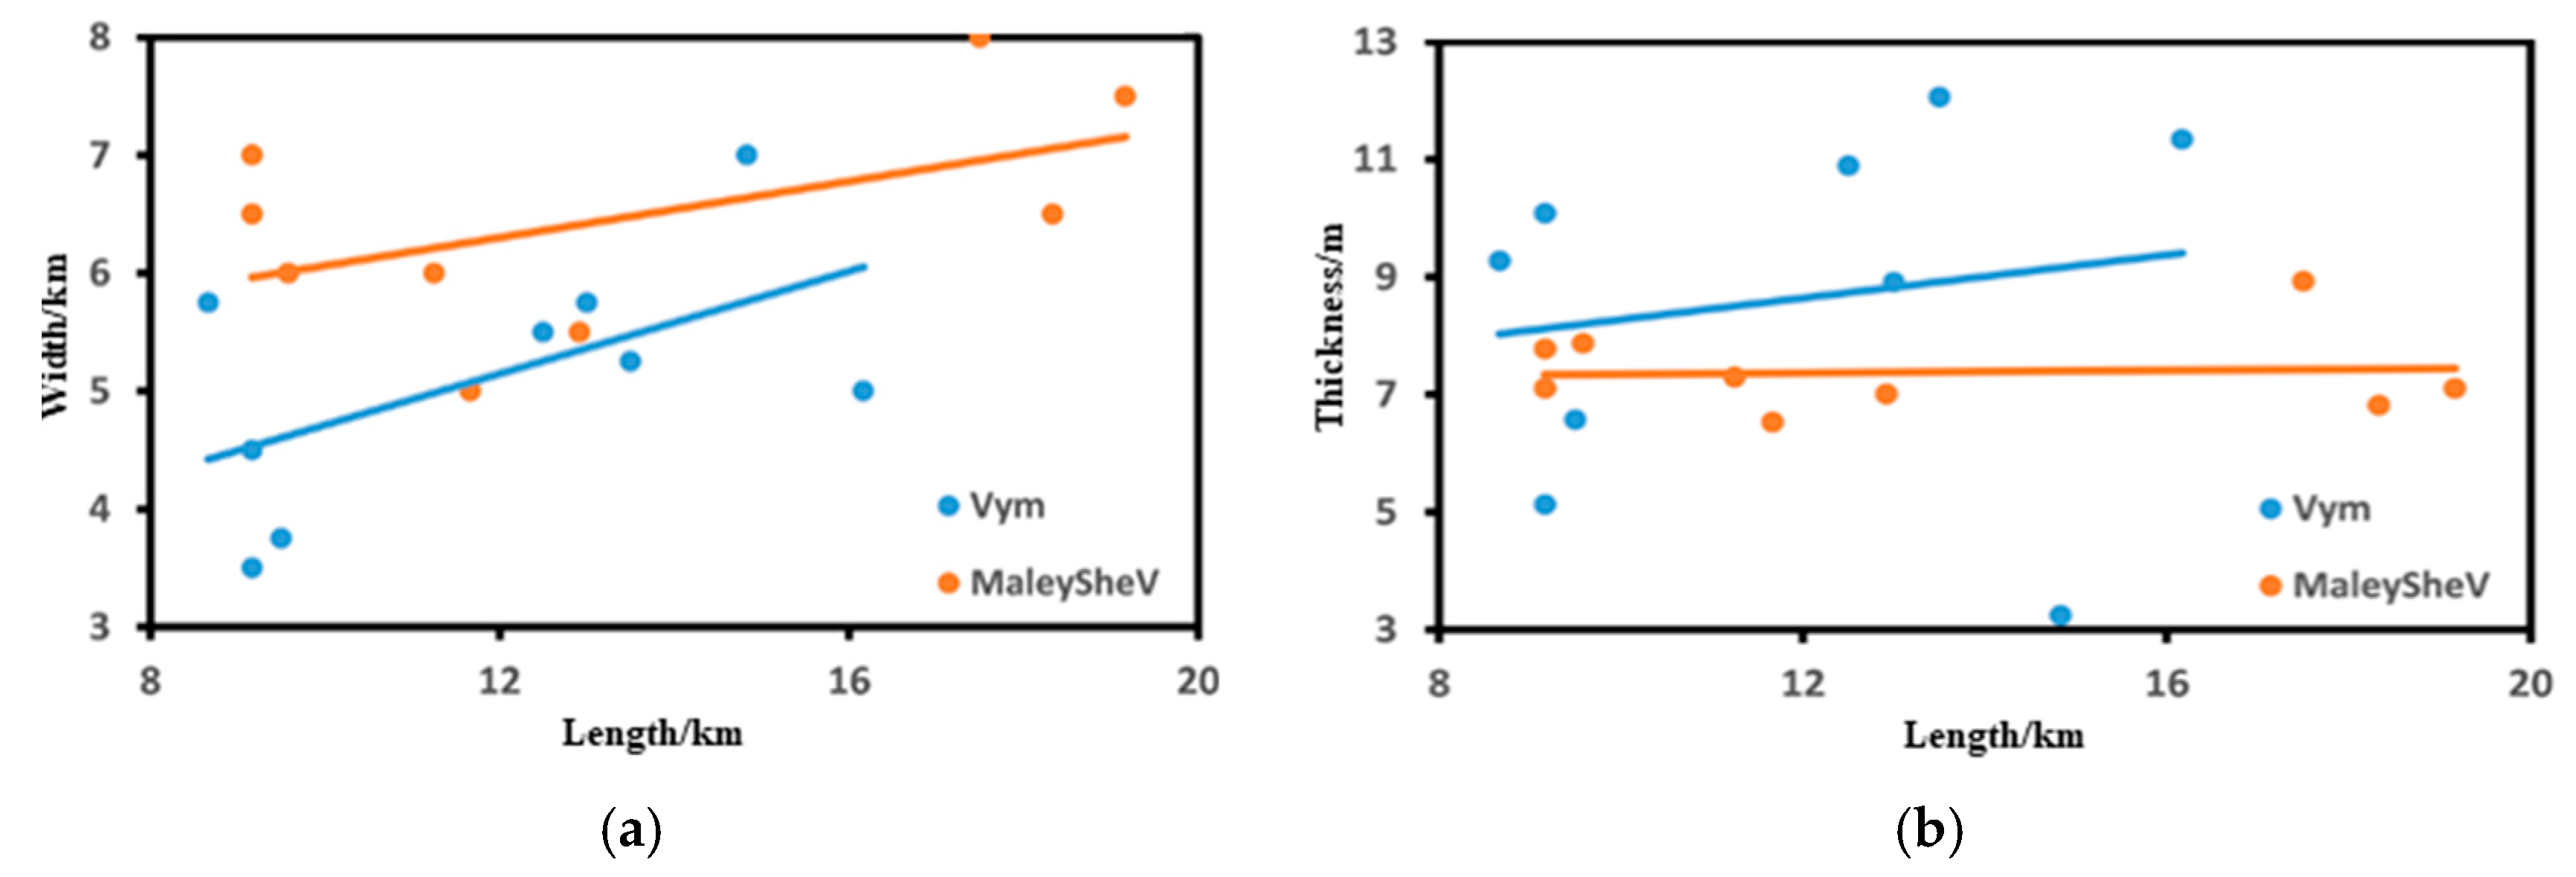
As shown in Table 3, the average length, width, and thickness are 11.83 km, 5.11 km, and 8.61 m, respectively, for the tidal bar body of the Vym layer; 14.83 km, 12.6 km, and 0.77 m, respectively, for the sand mat sand flat; and 77.47 km, 3.72 km, and 7.43 m, respectively, for the tidal channel. The average length, width, and thickness are 13.19 km, 6.44 km, and 7.38 m, respectively, for the Malyshev tidal bar; 15.86 km, 15.58 km, and 0.71 m, respectively, for the sand mat sand flat; and 57.06 km, 2.44 km, and 3.41 m, respectively, for the tidal channel. The length–width distributions and length–thickness distributions for tidal bars with different bottom shapes, sand mats–sand flats, and tidal waterways are shown in Figure 5 and Figure 6.

3.3.2. Tidal Range Factor Analysis

The tidal amplitude significantly influences bar body development in shelf sedimentary systems. Now, the relevant simulations of various tidal ranges are carried out while keeping the remaining parameters invariant. The tidal ranges are set at 2 m, 6 m, and 10 m.
  • Sedimentary distribution analysis
A comparison of models with different tidal ranges reveals that under low tidal range conditions, the development of the bar body is slow despite the accumulation of substantial sediment, with minimal sediment reworking and the formation of tidal channels, primarily along both sides of the uplift zone. In contrast, under conditions of high tidal range, a more pronounced tidal reworking effect is observed, leading to enhanced development of bar bodies and tidal distributary channels. These are characterized by substantial erosion and redeposition processes that continuously reshape the morphology of the bars. As tidal amplitude increases, the growth of tidal sand bars accelerates, and tidal channels become more prominent. A larger tidal range reflects an expanded extent of tidal influence, resulting in a greater number of bars and increased morphological complexity.
2.
Velocity distribution analysis
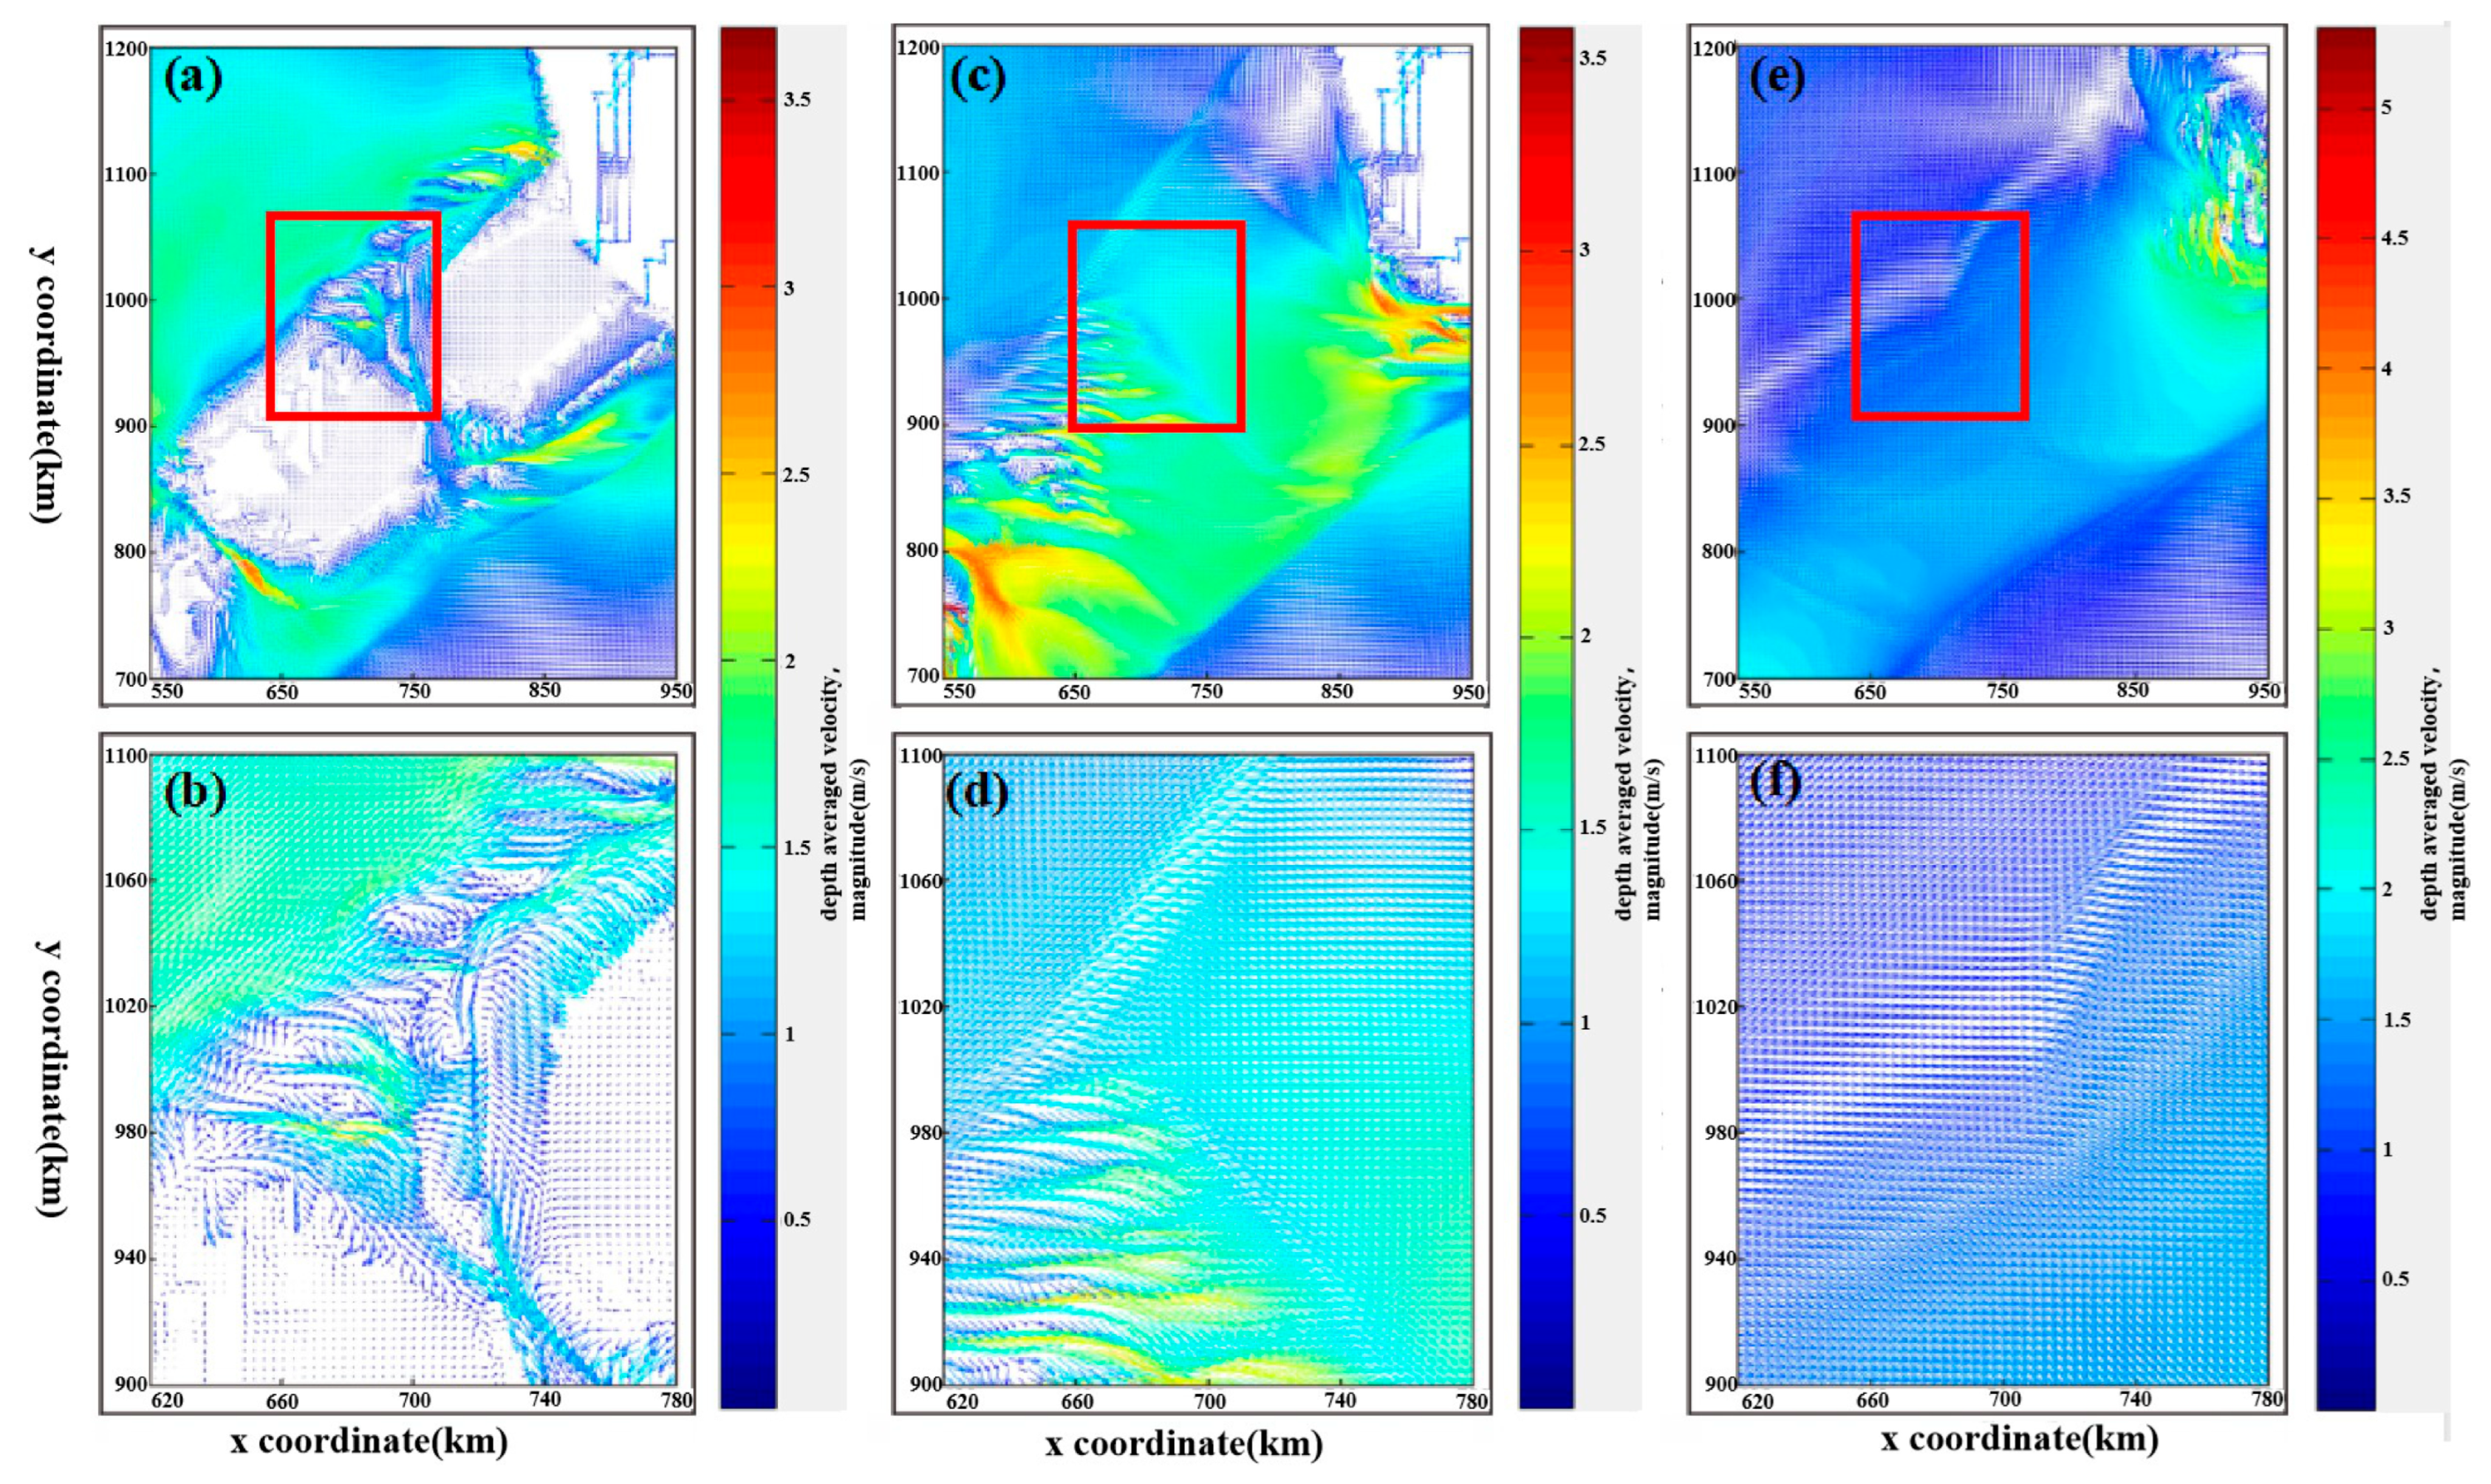
When the low tide is distinct, sedimentation occurs primarily at the ends of channels within the uplift zone, with a limited tidal influence. As the tide rises, water flows through the channels, leading to the formation of bar bodies. Under a moderate tidal range, the flow oscillation induced by tidal action significantly intensifies, resulting in the development of multiple tidal channels on both sides, which are particularly influenced by the rising tide on the northern side of the uplift belt. Under high tidal range conditions, the tidal effect reaches its maximum, and the interaction between river discharge and tidal flow generates vortex currents, facilitating the rapid formation of bars on both sides of the uplift zone. These bars frequently merge, leading to the development of strip bars, composite bars, and other complex sedimentary features, as illustrated in Figure 7.
3.
Analysis of bar characteristics
As shown in Table 4, at low tide, the average length, width, and thickness are 10.33 km, 4.61 km, and 7.70 m, respectively, for the tidal bar; 13.73 km, 10.56 km, and 0.54 m, respectively, for the sand mat sand flat; and 69.64 km, 2.23 km, and 5.55 m, respectively, for the tidal waterway. In the medium tidal range, the average length, width, and thickness are 11.83 km, 5.11 km, and 8.61 m, respectively, for the tidal bar; 14.83 km, 12.6 km, and 0.77 m, respectively, for the sand mat sand flat; and 77.47 km, 3.72 km, and 7.43 m, respectively, for the tidal channel. Under varying high tide conditions, the average dimensions of the tidal bar are 13.84 km in length, 6.49 km in width, and 10.27 m in thickness. The sand mat and sand flat exhibit average values of 19.88 km in length, 13.52 km in width, and 0.98 m in thickness. For the tidal waterway, the average length is 81.40 km, the width is 13.52 km, and the depth is 7.71 m. As illustrated in Figure 8 and Figure 9, increased tidal magnitude correlates with a higher number of bar bodies, greater average width and thickness, and a larger length-to-width ratio of bar bodies. Similarly, stronger tides correspond to increased length, width, and thickness of sand mats, as well as deeper tidal channel incision. Overall, tidal intensity shows a positive relationship with bar body length and width, sediment thickness of sand sheets, and the undercut depth of tidal channels.

3.3.3. Water Level Factor Analysis

Shelf tidal delta deposition is significantly impacted by the initial water level. The water level at the channel bottom of the uplift zone is 0 m, the low water level is 1 m, the medium water level is 15 m, and the high water level is 45 m.
  • Sedimentary distribution analysis
The low-water-level model, as the basic model, has established a prototype of tidal bars and waterways in the investigated area during the early simulation phase, despite insufficiently clear segmentation. In the late stage of the simulation, tidal bars and tidal waterways were clearly developed, with segmented strip bars forming prominently under the influence of tidal currents in the study area. During the early phase of the middle water level model simulation, numerous sand sheets formed across the region, with only minimal development of tidal channels and an absence of distinct tidal bar formation. As the simulation progressed, additional sand sheets continued to develop, accompanied by the emergence of a few tidal bars and channels in localized areas. In contrast, the simulation of the high water level model did not exhibit the development of tidal bars or tidal channels; only limited formation of sand mats was observed. A comparison of various water level models reveals that, from the tidal delta shelf to the shallow water shelf and then to the deep-water shelf, the channel-cutting property becomes increasingly weak, and the sand body concentration decreases and becomes thinner.
2.
Velocity distribution analysis
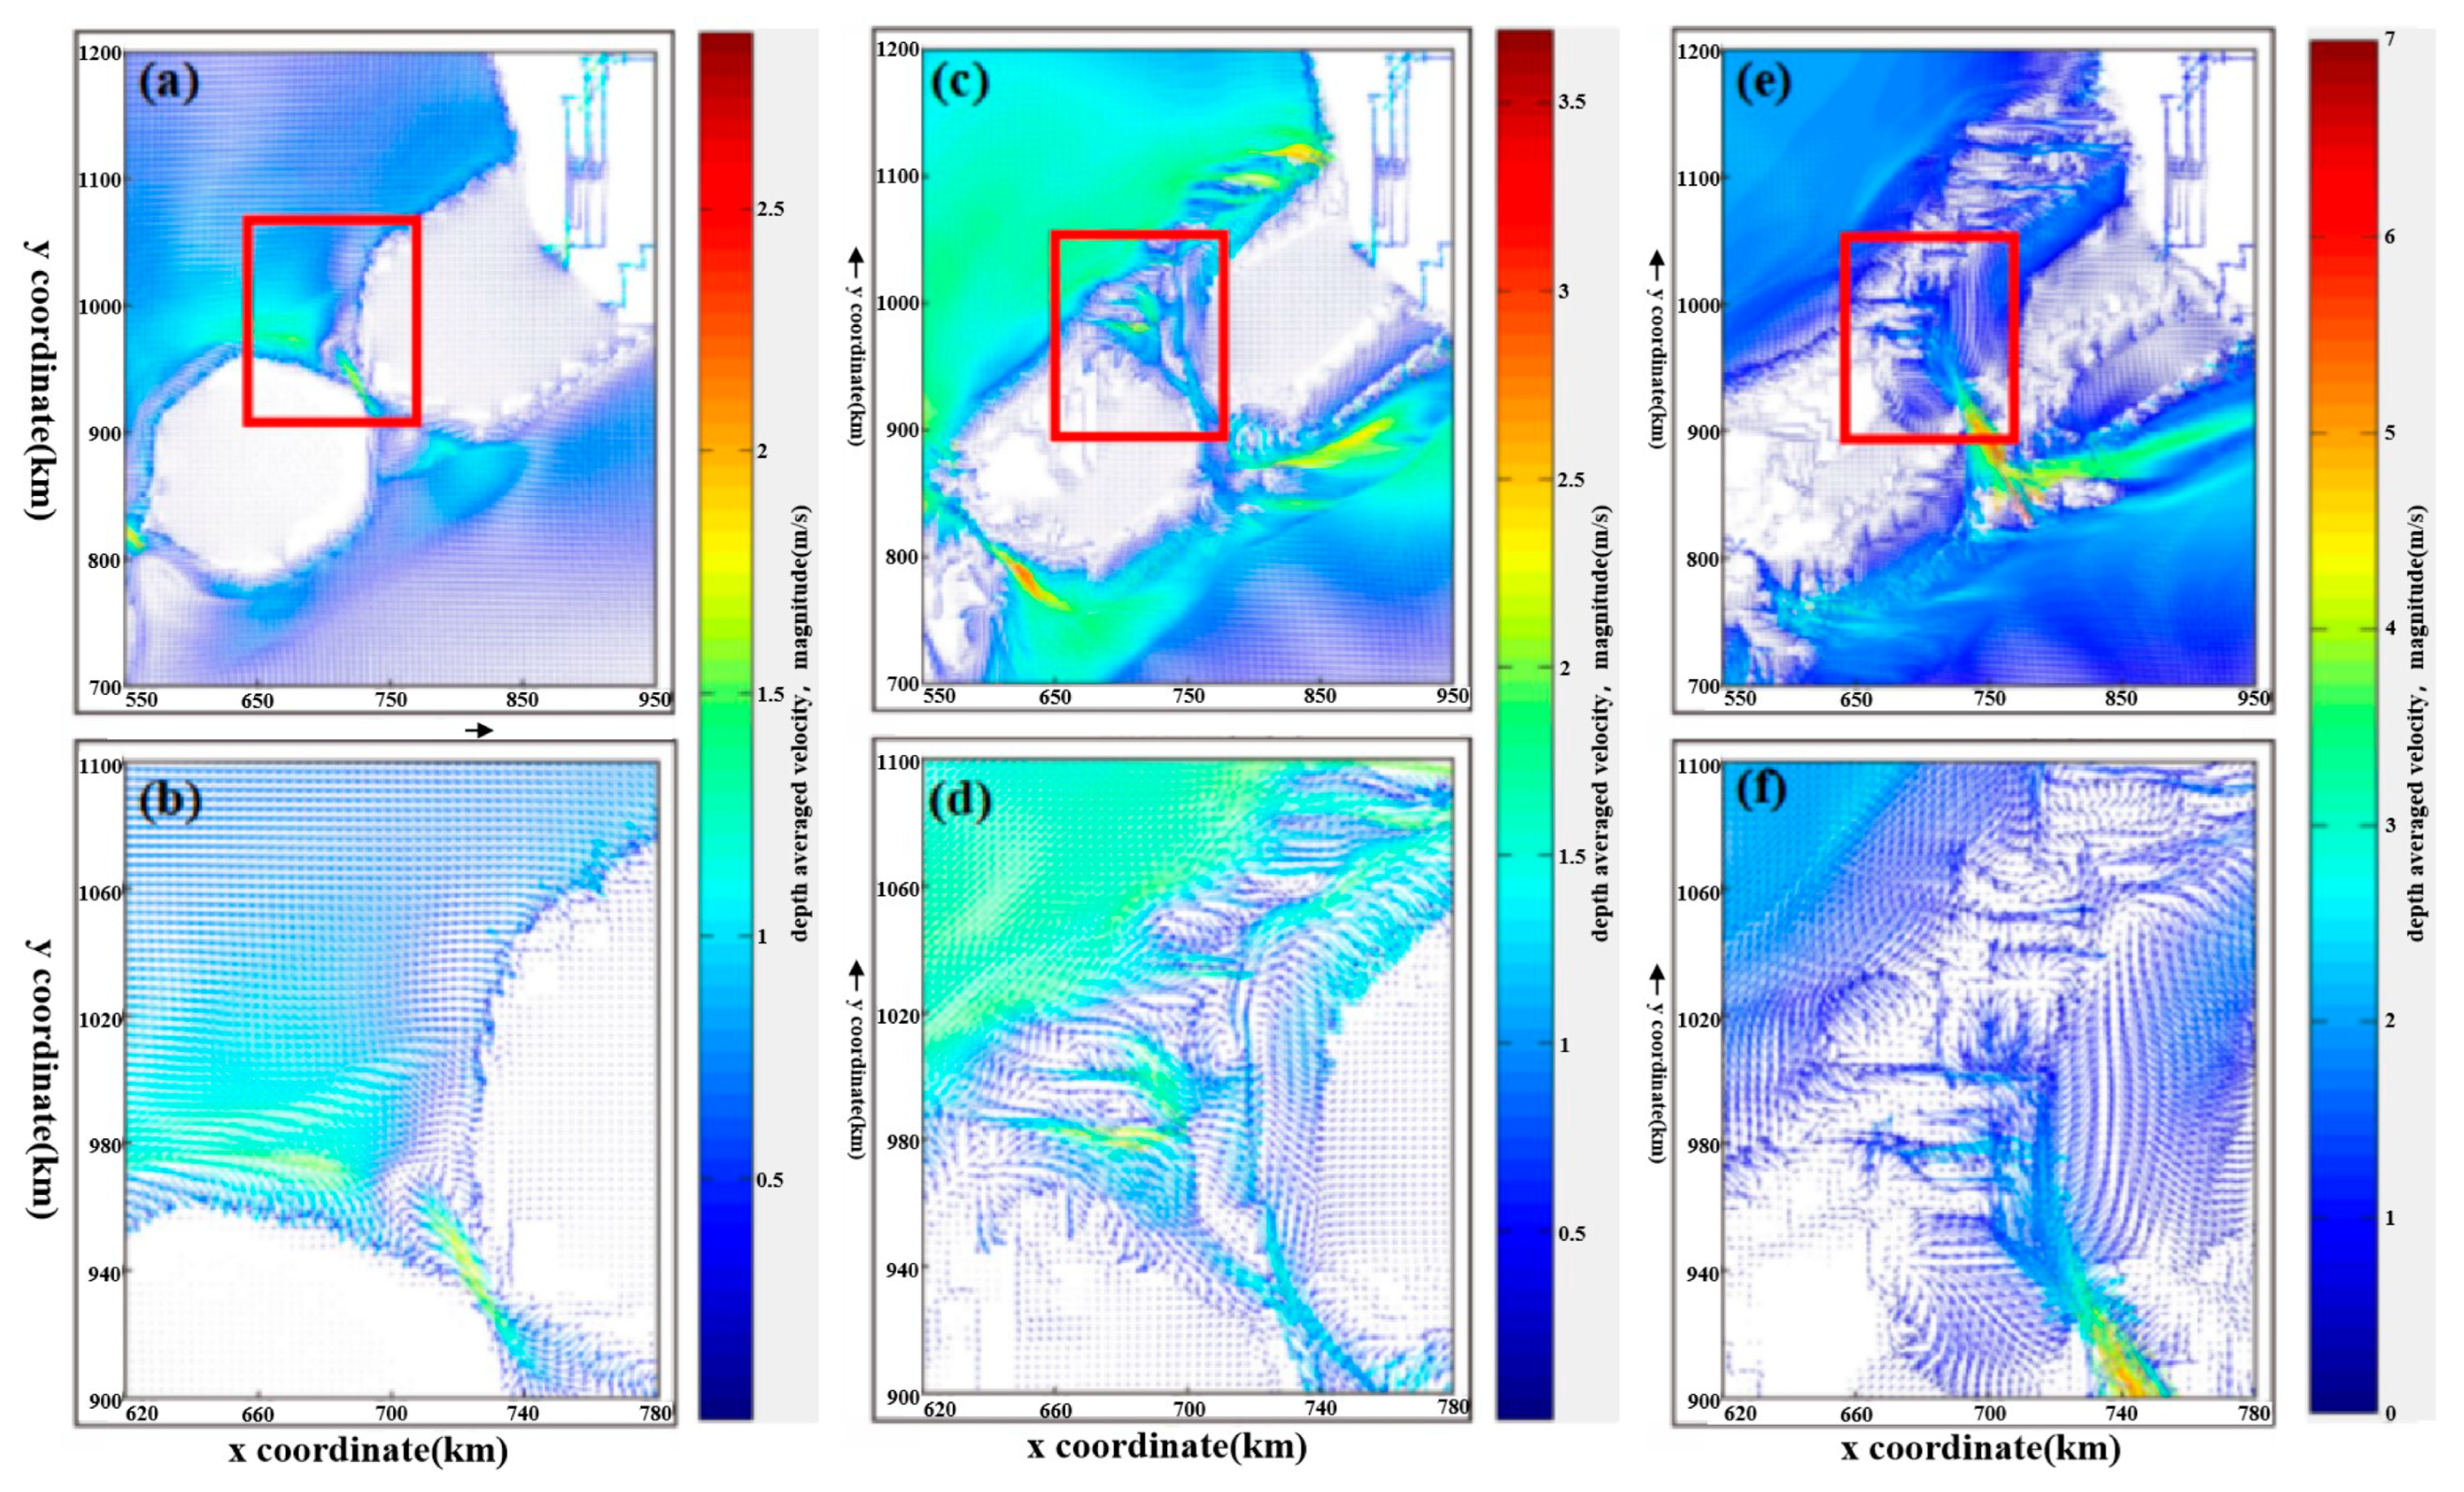
At low water levels, the flow oscillation caused by tides is obvious. Under the impact of rising tides on the uplift belt’s north side, a number of tidal waterways and bars have developed on the west and east sides of the investigated area. At the middle water level, the velocity change in the investigated area is not obvious under the same tidal action, and only a few tidal bars and waterways have developed in the west. When the water level is high, the uplift zone is submerged in deep water and subjected to fewer tides. Flow oscillation is not obvious in the investigated area, and tidal bars and waterways are not developed, as shown in Figure 10.
3.
Analysis of bar characteristics
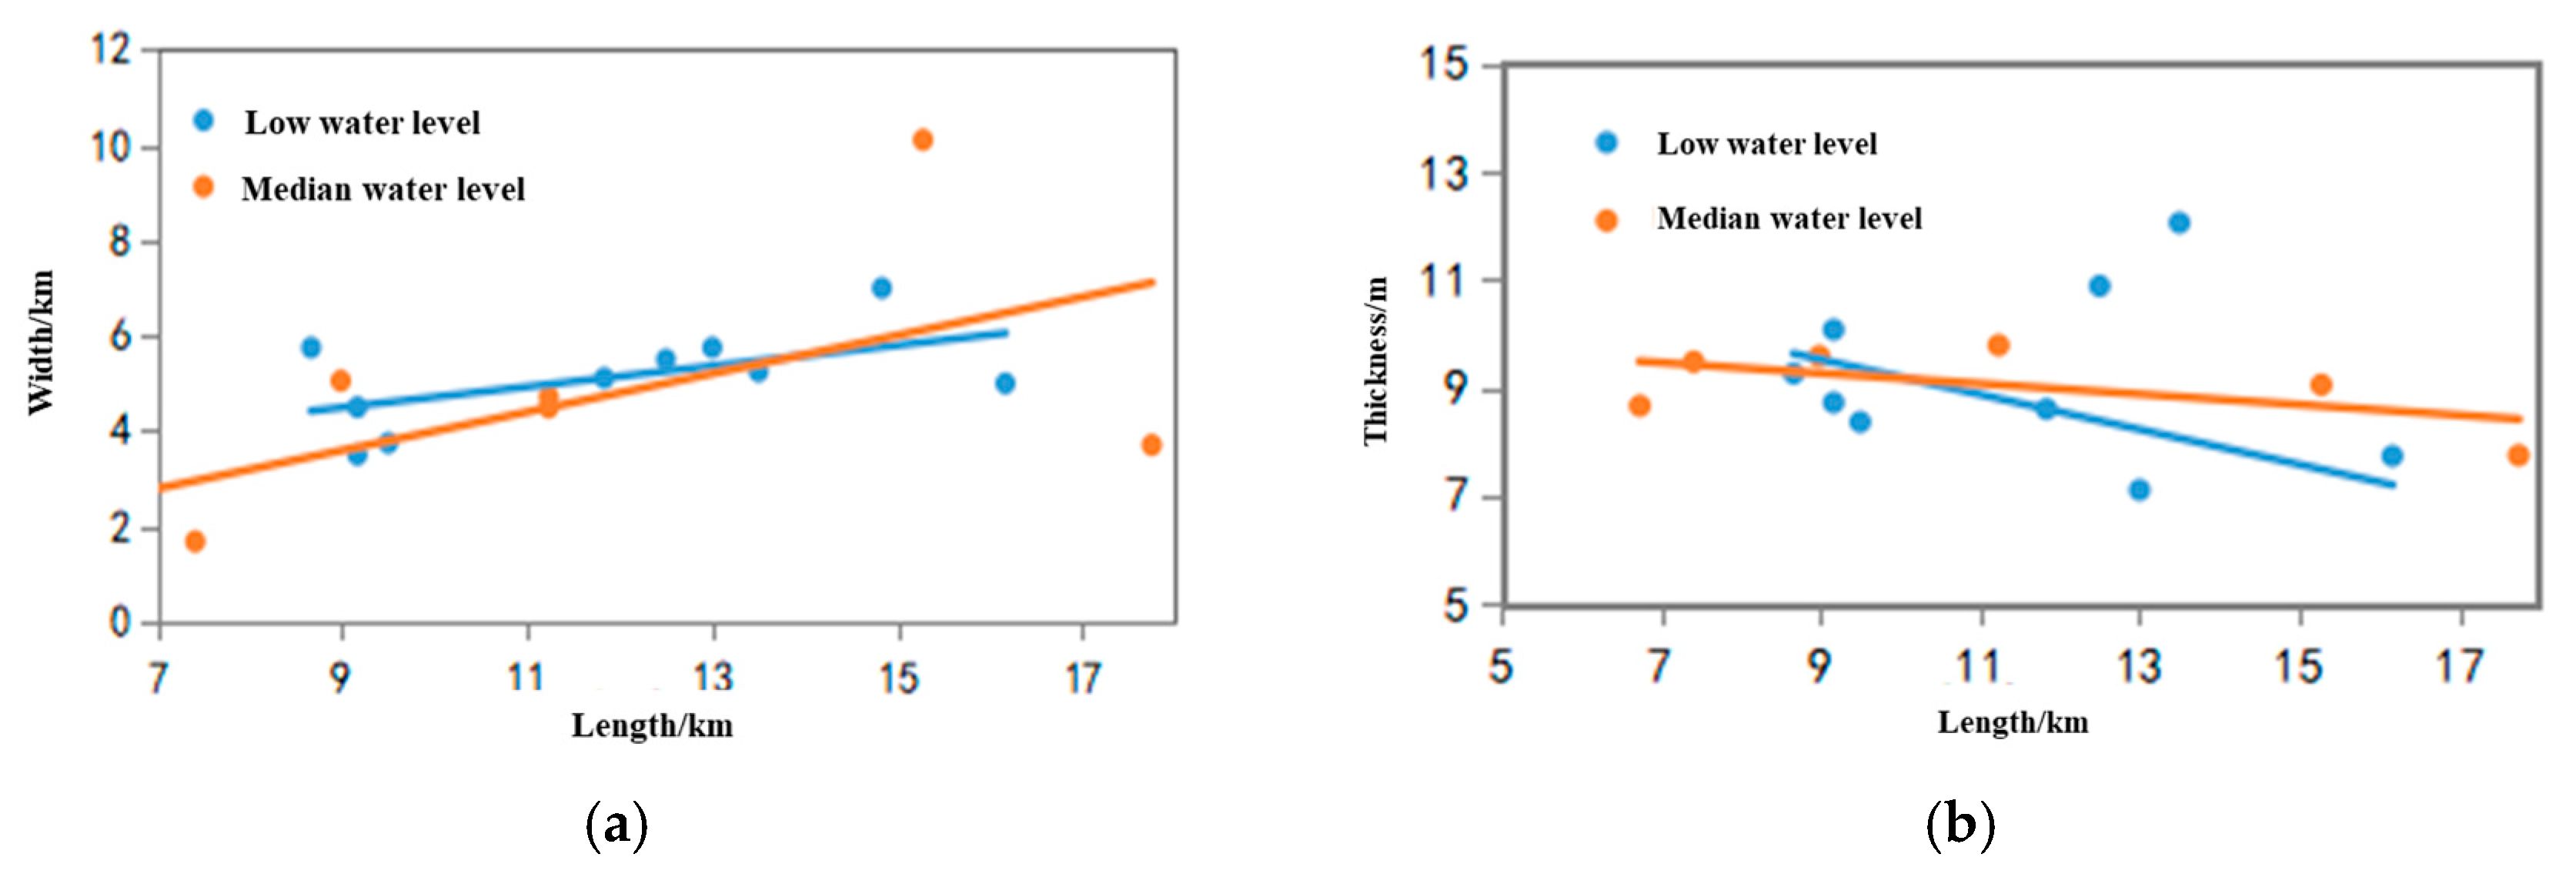
As shown in Table 5, at low water levels, the average length, width and thickness are 11.83 km, 5.11 km, and 8.61 m, respectively, for the tidal bar; 14.83 km, 12.6 km, and 0.77 m, respectively, for the sand mat sand flat; and 77.47 km, 3.72 km, and 7.43 m, respectively, for the tidal channel. At the middle water level, the tidal bar exhibits average dimensions of 11.23 km in length, 4.49 km in width, and 9.06 m in thickness. For the sand mat and sand flat, the average length is 13.55 km, the width is 11.43 km, and the thickness is 0.68 m. The tidal waterway has an average length of 70.55 km, an average width of 3.09 km, and an average depth of 5.76 m. Under high water level conditions, the sand mat and sand flat display an average length of 49.21 km, a width of 13.29 km, and a thickness of 0.64 m. The distributions of length versus width and length versus thickness for tidal bars, sand mats, sand flats, and tidal waterways across different water levels are illustrated in Figure 11 and Figure 12.

3.4. Simulation Results

On the basis of the current sediment dynamics simulation results, numerical simulations of five sediment parameters, including the model bottom shape, water level, tidal range, discharge, and wave parameters, were carried out, and a numerical sediment evolution template under the control of five factors was established. By comparing various combinations of single-factor geometries and three-dimensional structures, this study quantitatively investigates, for the first time, the process-product relationships of a shelf sedimentary system influenced by both fluvial and tidal dynamics. The sedimentary numerical simulation reveals the primary controlling factors governing the development of interlayers within shelf sedimentary systems. The system model incorporates an idealized paleogeographic topography subjected to the combined action of wave and tidal hydrodynamic forces. Statistical analyses indicate that bottom morphology, water level, and tidal range are the dominant factors significantly affecting the length and width of tidal sand bars, channels, and sand sheets, as well as the overall development of interlayers in the study area. In contrast, river discharge and wave amplitude, as secondary controlling factors, exert only a minor influence on the evolution of channels, sand bodies, and interbeds. The variation in bottom morphology notably controls the development of channels and sand bodies within the continental shelf tidal delta. In the Vym layer, which serves as the primary depositional unit, sand bodies and channels are relatively well developed. The tidal channels exhibit high segmentation, the elongated bar bodies are distinctly developed, and the interlayers are constrained in both length and thickness. In contrast, the Malyshev layer, which acts as the secondary depositional unit, shows no significant development of sand bodies or channels. The signs of tidal bar bodies in the study area are very weak. Tidal water channels are weakly developed, and the length and thickness of the interlayer are large. On average, the sand bodies and channels in the Vym layer are significantly longer, wider, and thicker (or deeper) than those in the Malyshev layer.
The foremost influencing factor of tidal deltas on the continental shelf is tidal amplitude. As the tidal range increases, the sizes of the sand bodies and waterways increase. The larger the tidal range is, the more the bar shape is eroded and redeposited. At a low tidal range, the number of widely developed intercalations is large, and the intercalations are long and thick. In the medium–high tidal range, the number of intercalations with limited development decreases, and as the tidal range increases, the intercalation length and thickness decrease. As the tidal range increases, the average length, width, and thickness (or depth) of tidal bars, sand mats, and tidal waterways increase, and the scale is positively related to the tidal range.
The development of tidal delta sand bodies and interbeds on the continental shelf is significantly influenced by the initial water level. At low water levels, tidal delta deposits tend to form on uplifted zones, resulting in relatively high-quality sand bodies. These conditions promote the formation of well-defined tidal channels and segmented strip bars. At intermediate water levels, the shallow shelf environment does not favor the development of distinct bar deposits; instead, it tends to produce scattered and thin sand sheet deposits, with only limited development of tidal bars and channels. In contrast, high water levels lead to the formation of a deep-water shelf, where sandy deposits are less likely to develop. It is dominated by long-distance suspended and slowly settling mud. No bar or waterway has developed, and only a large thin and low-concentration sand sheet has formed. When the water level is low, the interlayer is developed and thin; during the medium to high water level period, the interlayer clearly develops and thickens. With increasing initial water level, the interlayer tends to lengthen and gradually thicken.
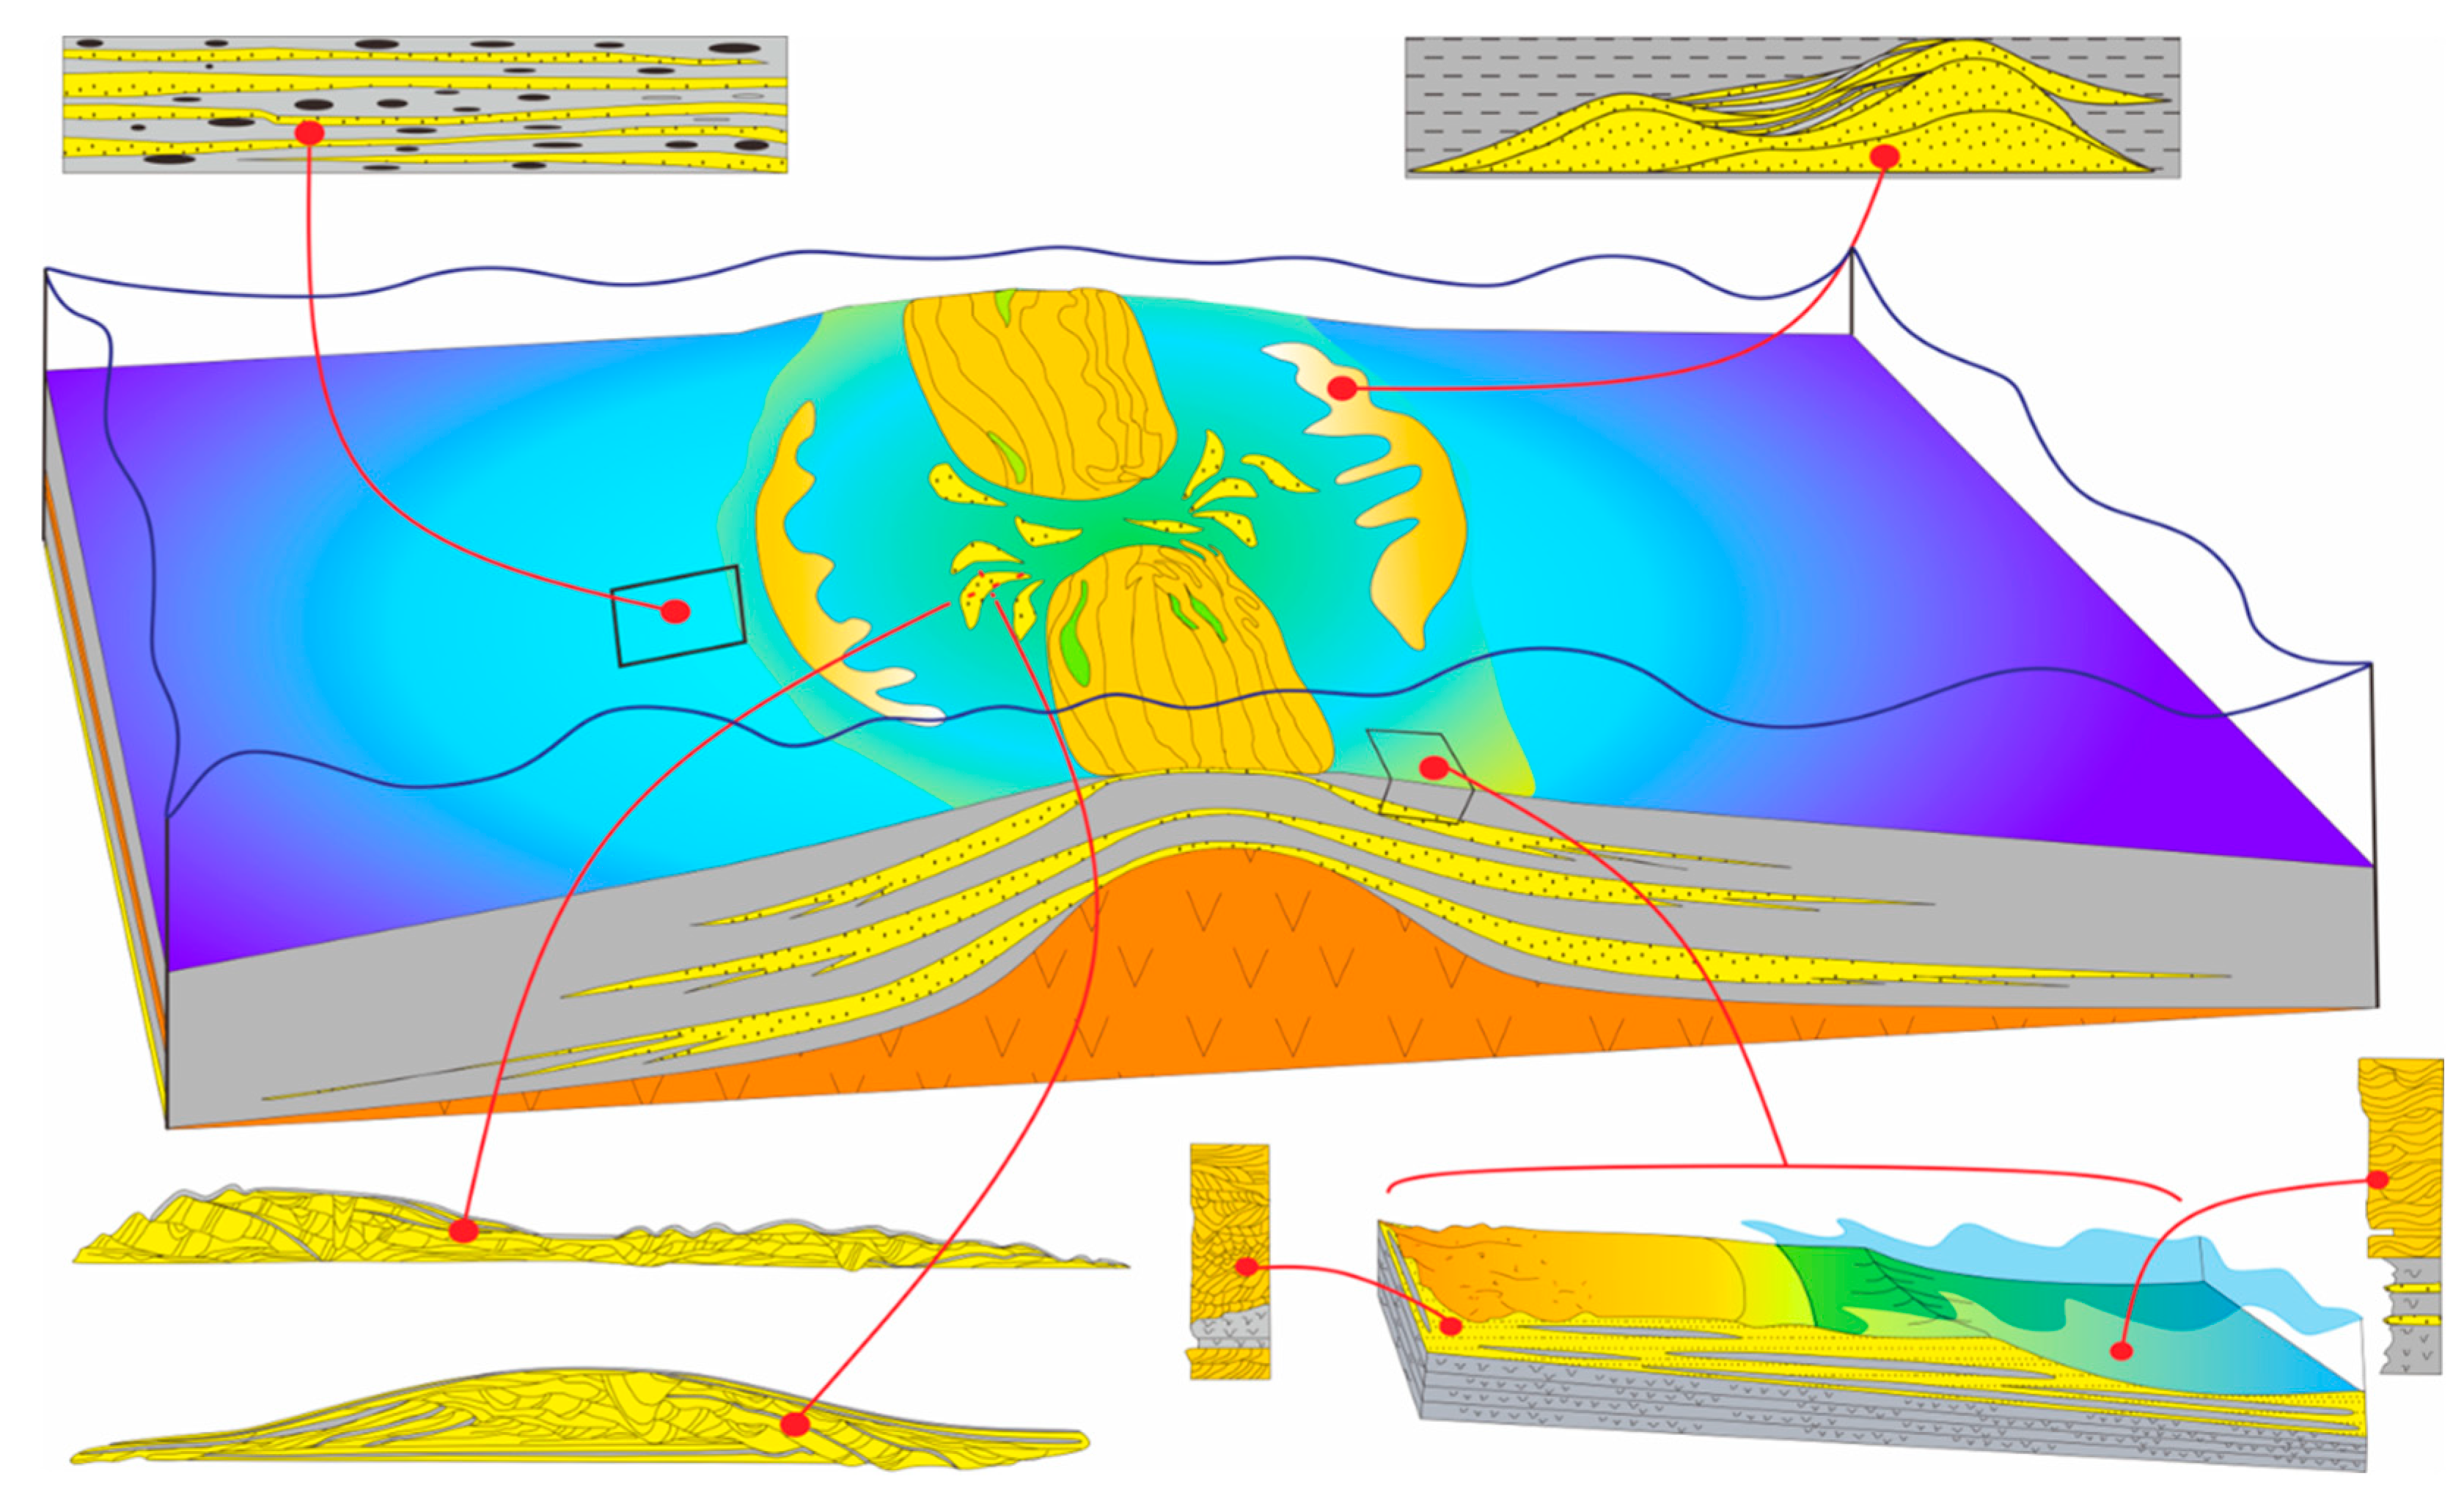
According to the sediment dynamics simulation, the sand body barrier sandwich structure of the sand bar is defined as “bidirectional accretion, vertical cutting, lateral migration, lateral deposition, and limited development”. The sand mat sand body interlayer structure is defined as “horizontal extension, vertical deposition, plate distribution, thin layer widely distributed”, as shown in Figure 13.

4. Geological Modeling Process

The J7 layer represents a typical tidal delta deposit, characterized by complex hydrodynamic conditions and highly variable reservoir properties, along with a structurally intricate geological framework. Previous sedimentary simulations of the J7 layer successfully reproduced the tidal-controlled deltaic processes, generating a comprehensive set of three-dimensional mud–sand (lithology) distribution data. These data effectively capture the interbedded nature of sand bodies and serve as a novel training template for multipoint geostatistical modeling. Building upon conventional studies that focus on areally controlled sand bodies (sedimentary surfaces), the sedimentary dynamics simulation introduces the spatial distribution of mud and sand as an external constraint in numerical simulations. This integration facilitates the development of a geological model, enables the evaluation of inter-well sand body expansion and distribution, and significantly enhances the accuracy of reservoir modeling.
Lithofacies modeling, a core and challenging aspect of stochastic reservoir simulation, aims to reconstruct the spatial distribution of sand bodies within a formation. Among the most widely adopted techniques in lithofacies modeling are point-based simulation and sequential Indicator simulation. This modeling is based on a three-dimensional training template of sedimentary dynamics, and reservoir modeling technology for tide-controlled deltas based on the MPS method is established. The specific process is as follows:

4.1. Analysis of Sedimentary Dynamics Data

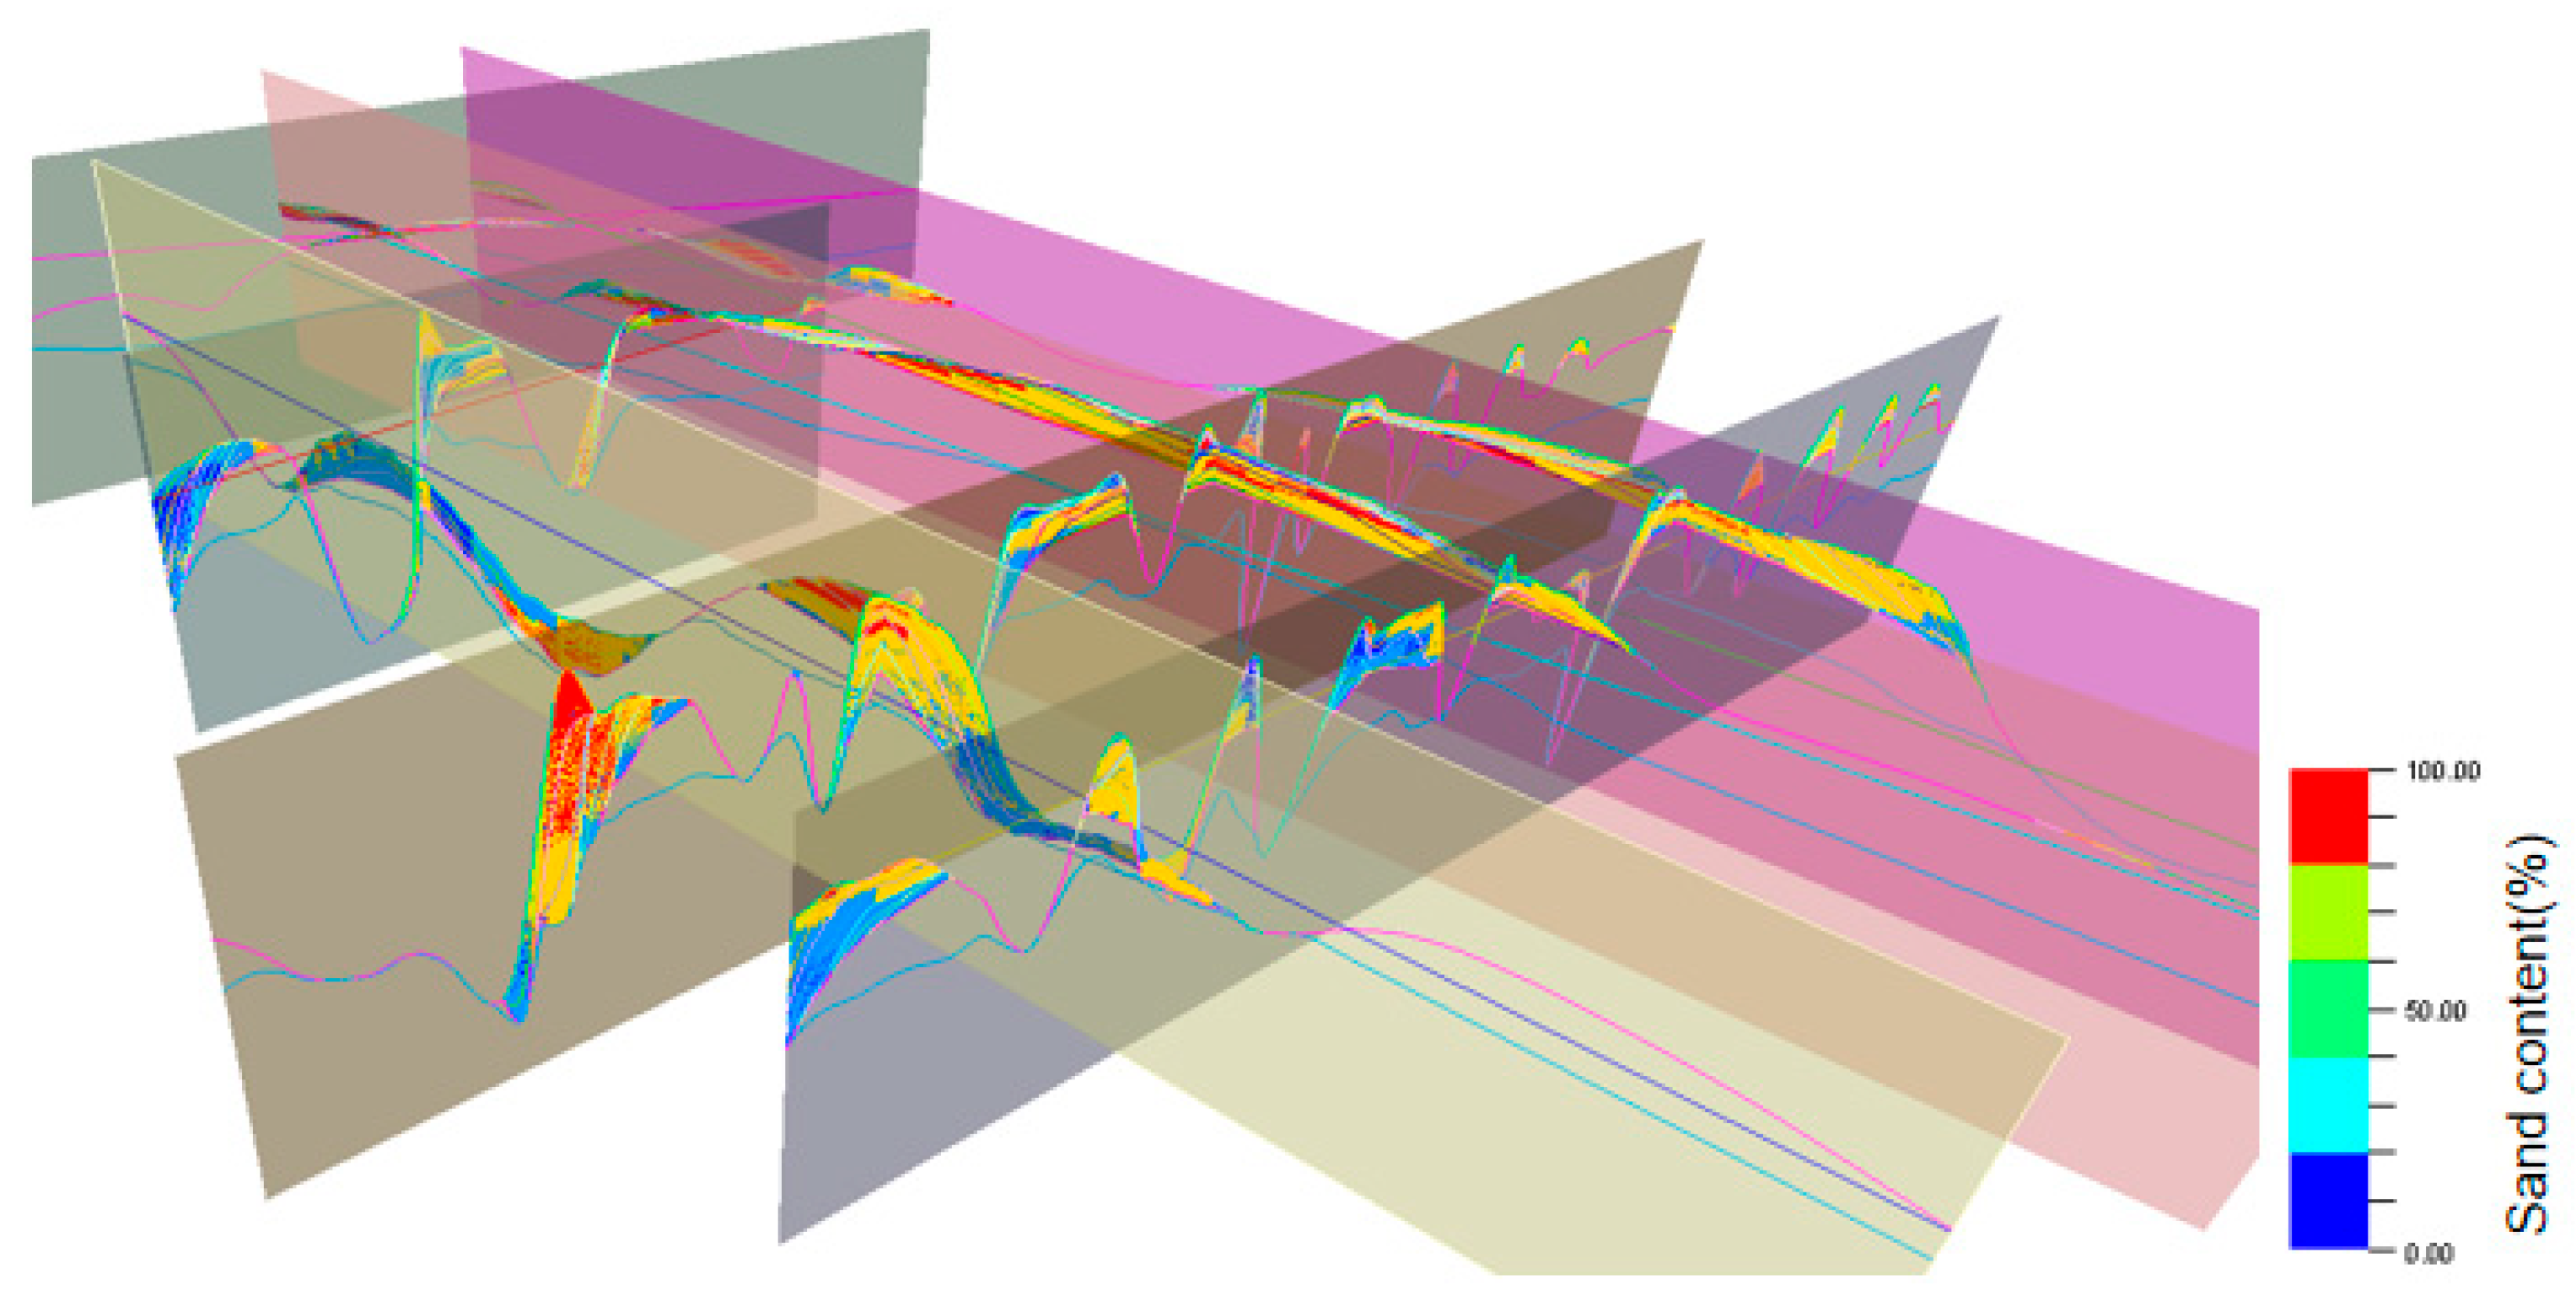
The sediment dynamics simulation outputs 400 layers of point data information and 16 time-domain layers. The 400-layer sedimentary dynamics simulation data are imported into Petrel 2021 software to obtain a three-dimensional point map [30]. When establishing the structural model level, 16 time-domain levels are used as constraints to obtain the structural model combined with the seismic time domain. Owing to the full consideration of the impact of seismic factors on the model, the conventional model is more in line with the actual model of the work area.

4.2. Generation of 3D Training Images on the Basis of Deposition Dynamics

By superimposing 400 layers of terrain data into a terrain model, combined with the existing research data in the study area, the MPS template area can be selected, the appropriate area can be limited, the useless area can be deducted, and the sand and mud can be divided according to the borehole VSH and seismic data. The relatively developed sand content formwork and sand content formwork sections of the tidal bar are shown in Figure 14 and Figure 15.

4.3. D Lithologic Model

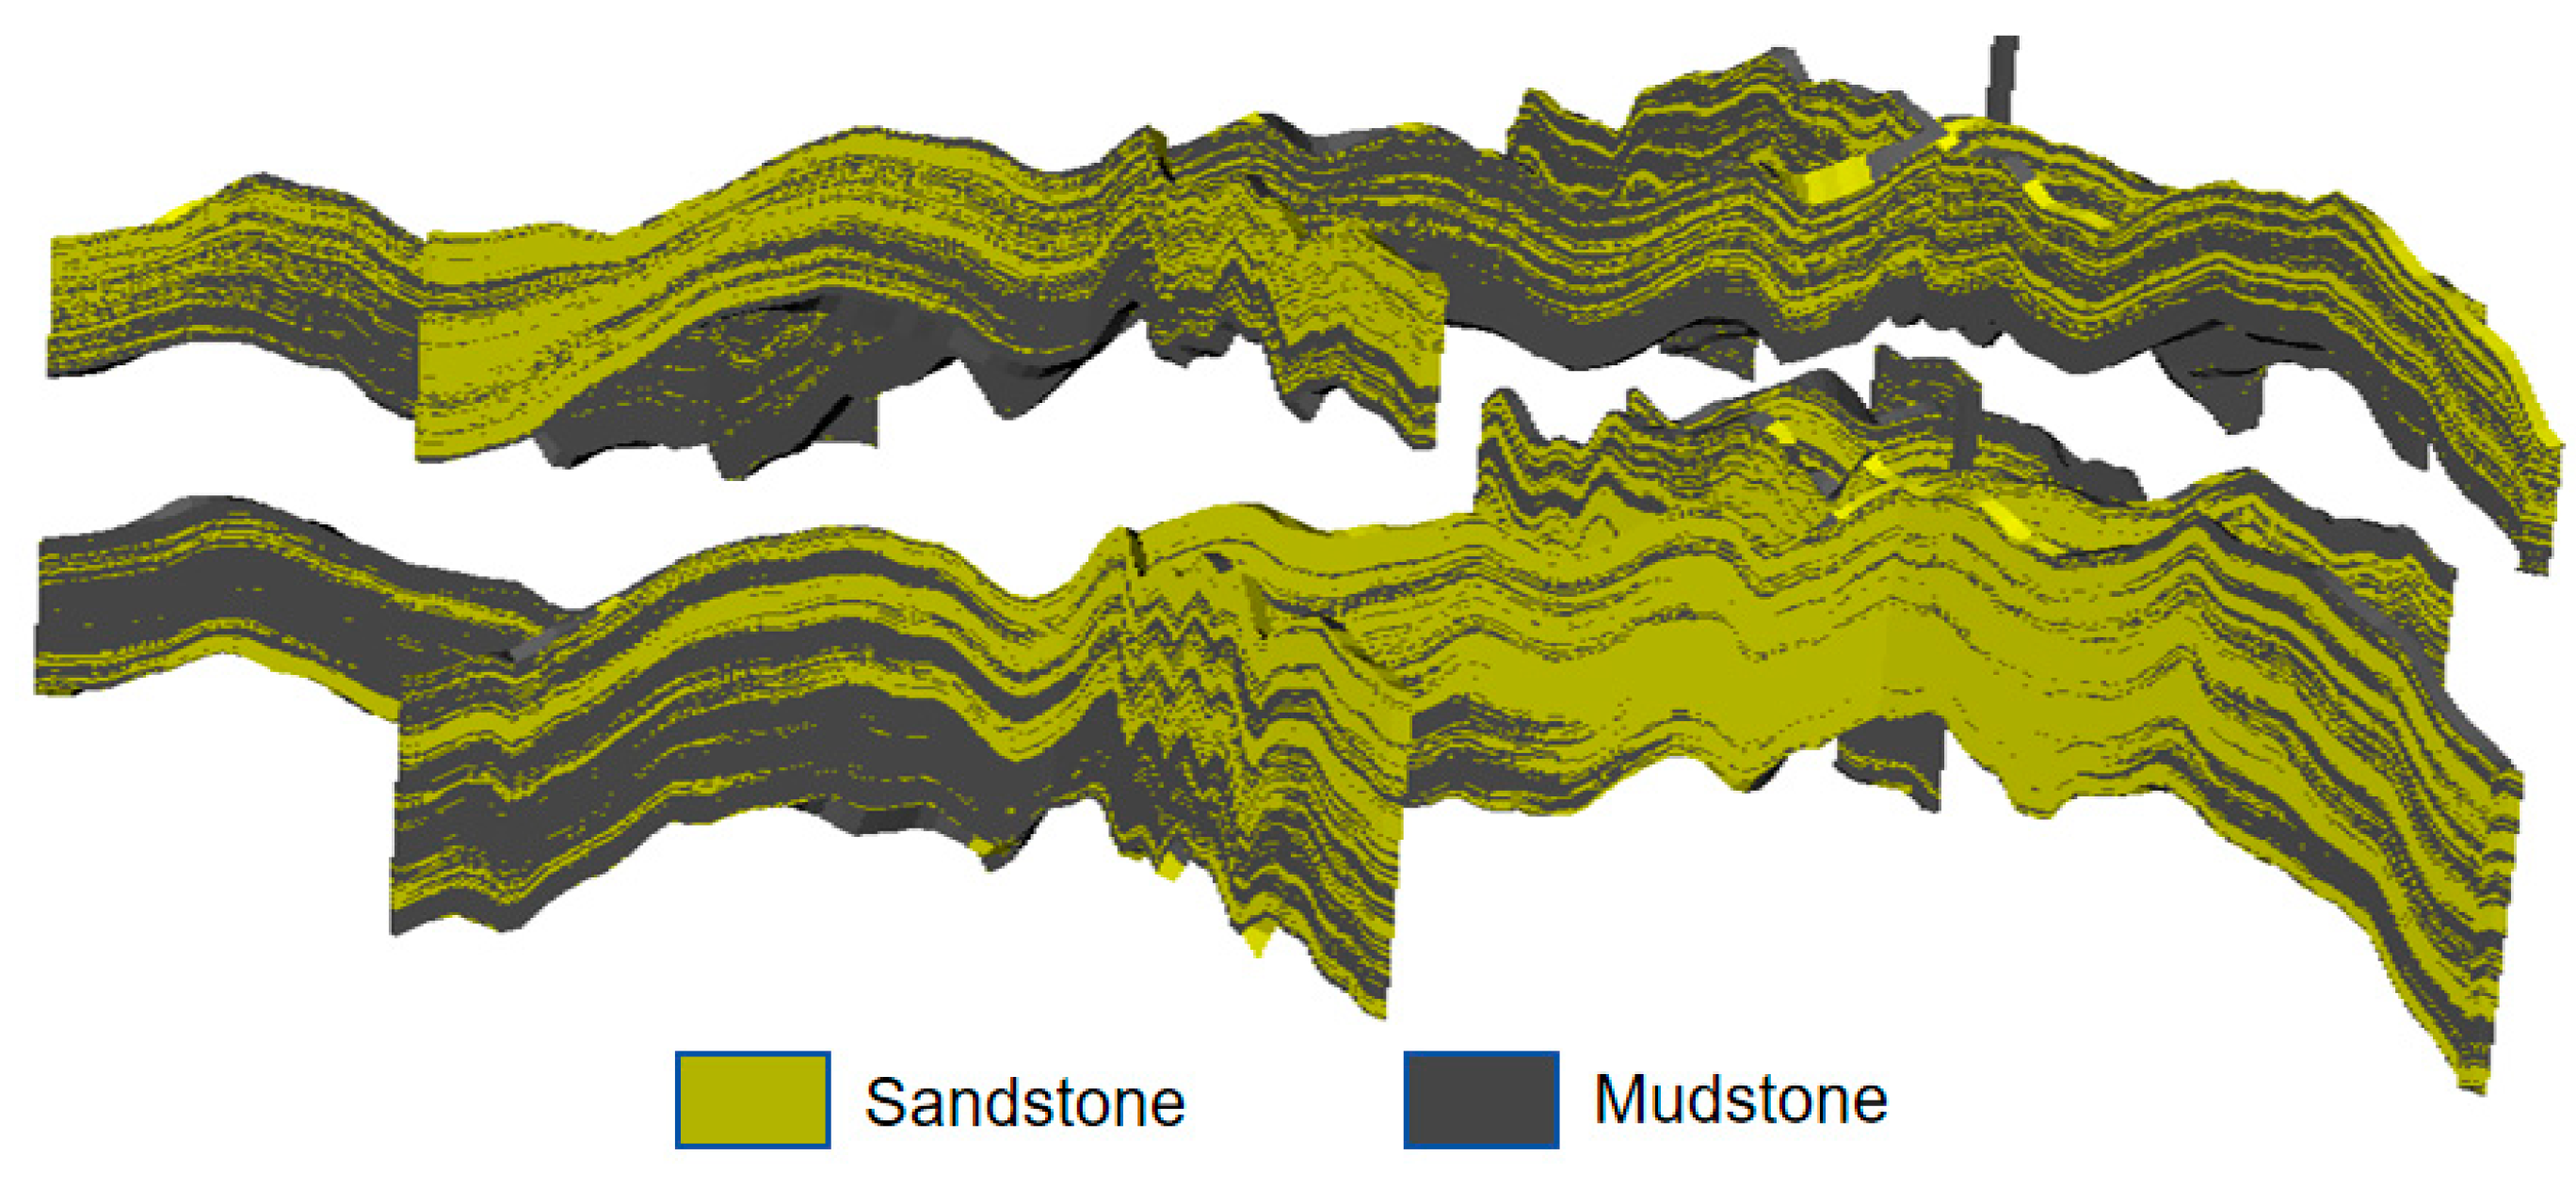
Using a three-dimensional training template derived from sedimentary dynamics simulations, a sedimentary dynamics modeling technique based on the multiple-point statistics (MPS) method was established, and sedimentary microfacies modeling of the target reservoir horizon was conducted. Integrated with seismic data interpretation, the simulation results effectively captured the development scale of sand bodies associated with different facies, yielding a facies model that aligns well with geological understanding (see Figure 16). This outcome underscores the strengths of the MPS method in modeling complex geological bodies with intricate spatial configurations and geometric forms. While traditional MPS modeling typically relies on a single bar-shaped body as a template, this study employed multiple composite bar bodies as training templates, allowing the model to autonomously select among them. The resulting model demonstrated diverse patterns of bar body superposition, thereby enhancing its applicability and reliability for research and development within the study area.

5. Conclusions

To conclude, on the basis of the quantitative simulation of sedimentary dynamics, a sedimentary evolution model of the Yamal Jurassic shelf uplift-type tidal delta, under the paleotectonic framework of “two depressions and one uplift” and influenced by mixed tidal, fluvial, and wave energy, was successfully established. The model quantitatively analyzes the length and width characteristics of the main microfacies, as well as the thickness and length characteristics of the internal interlayers. Furthermore, this study identified the primary controlling factors and internal configuration features governing the development of the sedimentary system. The horizontal and vertical distribution characteristics and spatial configuration relationships of the sand body interlayers were determined on the basis of the characteristics of the sparse wells and low seismic resolution in the study area, combined with regional research, modern sedimentary analysis, and the configuration characteristics obtained via sedimentary dynamics simulation. The research conclusions of the sand body interlayer and configuration were as follows: the main sand bar microfacies presented a sand–mud configuration mode of “bidirectional accretion, vertical cutting, lateral migration, lateral deposition and limited development”, and the sand sheet microfacies presented a sand–mud configuration mode of “lateral extension, vertical deposition, plate distribution and thin layer spread”.
A “composite template” suitable for complex sedimentary environments under special paleostructures based on sedimentary dynamics was established, and a multipoint geostatistical modeling method under the control of sedimentary dynamics was used to construct a three-dimensional lithologic model of the study area.
The results demonstrate that compared with the sequential Indicator simulation method, the innovative application of a coupled sedimentary dynamics simulations and multipoint geostatistical method can effectively enhance the reliability of reservoir geological models in areas with sparse well data and poor seismic quality.

Author Contributions

Conceptualization, Y.L.; methodology, Y.L. and B.J.; software, Y.L. and M.T.; validation, Y.L. and Y.C.; writing—original draft preparation, Y.L. and W.M.; writing—review and editing, Y.L., Y.C., L.Z. and M.T. All authors have read and agreed to the published version of the manuscript.

Funding

This research received no external funding.

Institutional Review Board Statement

Not applicable.

Informed Consent Statement

Not applicable.

Data Availability Statement

The original contributions presented in the study are included in the article, further inquiries can be directed to the corresponding authors.

Conflicts of Interest

The authors declare no conflicts of interest.

References

  1. Wightman, D.M.; Pemberton, S.G. The lower Cretaceous (Aptian) McMurray Formation: An overview of the Fort McMurray area, northeastern Alberta. Pet. Geol. Cretac. Mannville Group West. Can. 1997, 18, 312–344. [Google Scholar]
  2. Dalrymple, R.W.; Choi, K. Morphologic and facies trends through the fluvial-marine transition in tide-dominated depositional systems: A schematic framework for environmental and sequence-stratigraphic interpretation. Earth Sci. Rev. 2007, 81, 135–174. [Google Scholar] [CrossRef]
  3. Qian, W.; Yin, T.; Hou, G. A new method for clastic reservoir prediction based on numerical simulation of diagenesis: A case study of the ed1 clastic sandstones in the bozhong depression, bohai bay basin, China. Adv. Geo-Energy Res. 2019, 3, 82–93. [Google Scholar] [CrossRef]
  4. Luo, S.; Dai, R.; Liu, Z.; Lyu, Q. Experimental Study on Sedimentary Simulation of Large Area Sand Body Formation in the He 8 Member of the Sulige Region; Petroleum Industry Press: Beijing, China, 2014; pp. 98–136. [Google Scholar]
  5. Wang, Y.; Sun, Y.; Xiu, Z.; Song, Y.; Wang, K.; Xie, Q. Numerical simulation of turbidity current and sediment characteristics in submarine canyons. Haiyang Xuebao 2020, 42, 75–87. [Google Scholar]
  6. Liu, X.; Lu, S.; Tang, M.; Sun, D.; Tang, J.; Zhang, K.; He, T.; Qi, N.; Lu, M. Numerical simulation of sedimentary dynamics to estuarine bar under the coupled fluvial-tidal Control. Earth Sci. 2021, 46, 2944–2957. [Google Scholar]
  7. Zhang, K.; Wu, S.; Feng, W.; Zheng, D.; Yu, C.; Liu, Z. Discussion on evolution of bar in sandy braided river: Insights from sediment numerical simulation and modern bar. Acta Sedimentol. Sin. 2018, 36, 81–91. [Google Scholar]
  8. Schramkowski, G.P.; Schuttelaars, H.M.; Swart, H.E.D. The effect of geometry and bottom friction on local bed forms in a tidal embayment. Cont. Shelf Res. 2002, 22, 1821–1833. [Google Scholar] [CrossRef]
  9. Toffolon, M.; Crosato, A. Developing macroscale indicators for estuarine morphology: The case of the scheldt estuary. J. Coast. Res. 2007, 23, 195–212. [Google Scholar] [CrossRef]
  10. Hillen, M.M.; Geleynse, N.; Storms, J.E.A.; Walstra, D.J.R.; Groenenberg, R.M. Morphodynamic modelling of wave reworking of an alluvial delta and application of results in the standard reservoir modelling workflow. Depos. Syst. Sediment. Successions Nor. Cont. Margin 2014, 46, 167–185. [Google Scholar]
  11. Weisscher, S.A.H.; Shimizu, Y.; Kleinhans, M.G. Upstream perturbation and floodplain formation effects on chute-cutoff-dominated meandering river pattern and dynamics. Earth Surf. Process. Landf. J. Br. Geomorphol. Res. Group 2019, 44, 2156–2169. [Google Scholar] [CrossRef]
  12. Tang, M.; Lu, S.; Zhang, K.; Yin, X.; Ma, H.; Shi, X.; Liu, X.; Chu, C. A three dimensional high-resolution reservoir model of Napo Formation in Oriente Basin, Ecuador, integrating sediment dynamic simulation and geostatistics. Mar. Pet. Geol. 2019, 110, 240–253. [Google Scholar] [CrossRef]
  13. Zhou, H.; Huang, J.; Feng, W.; Liu, S.; Yin, Y. Analysis on formation factors and development characteristics of sand bar in tide-dominated estuaries—A case study based on Qiantang River. Geol. Rev. 2020, 66, 101–112. [Google Scholar]
  14. Yin, Y.; Wu, S. The progress of reservoir stochastic modeling. Nat. Gas Geosci. 2006, 17, 210–216. [Google Scholar]
  15. Wu, S.; Li, W. Multiple-point geostatistics: Theory, application and perspective. J. Palaeogeogr. 2005, 7, 137–144. [Google Scholar]
  16. Zhang, T. Incorporating geological conceptual models and interpretations into reservoir modeling using multiple-point geostatistics. Earth Sci. Front. 2008, 15, 26–35. [Google Scholar] [CrossRef]
  17. Zhang, W.; Lin, C.; Dong, C. Application of multiple-point geostatistics in geological modeling of D Oilfield in Peru. J. China Univ. Pet. (Nat. Sci. Ed.) 2008, 32, 24–28. [Google Scholar]
  18. Hua, C.; Yu, M.; Wei, H.; Liu, C. The mechanisms of energy transformation in sharp open-channel bends: Analysis based on experiments in a laboratory flume. J. Hydrol. 2019, 571, 723–739. [Google Scholar] [CrossRef]
  19. Shemin, G.G.; Deev, E.V.; Vernikovsky, V.A.; Drachev, S.S.; Moskvin, V.I.; Vakulenko, L.G.; Pervukhina, N.V.; Sapyanik, V.V. Jurassic paleogeography and sedimentation in the northern West Siberia and South Kara Sea, Russian Arctic and Subarctic. Mar. Pet. Geol. 2019, 104, 286–312. [Google Scholar] [CrossRef]
  20. Shemin, G.G.; Vernikovskiy, V.A.; Moskvin, V.I.; Vakulenko, L.G.; Deev, E.V.; Pervukhina, N.V. Lithologic and paleographic reconstruction of Jurassic system in West Siberian sedimentary basin. Oil Gas Geol. 2018, 6, 35–61. [Google Scholar]
  21. Kontorovich, A.E.; Kontorovich, V.A.; Ryzhkova, S.V.; Shurygin, B.N.; Yan, P.A. Jurassic paleogeography of the West Siberian sedimentary basin. Russ. Geol. Geophys. 2013, 54, 747–779. [Google Scholar] [CrossRef]
  22. Van der Vegt, H.; Storms, J.E.A.; Walstra, D.J.R.; Howes, N.C. Can bed load transport drive varying depositional behaviour in river delta environments? Sediment. Geol. 2016, 345, 19–32. [Google Scholar] [CrossRef]
  23. Yin, X.; Lu, S.; Liu, K.; Jiang, S.; Sun, B. Non-uniform subsidence and its control on the temporal-spatial evolution of the black shale of the Early Silurian Longmaxi Formation in the western Yangtze Block, South China. Mar. Pet. Geol. 2018, 98, 881–889. [Google Scholar] [CrossRef]
  24. Wang, H.; Wei, Q. The Theory and Application of Delft 3D Model; China Ocean Press: Beijing, China, 2018; pp. 1–7. [Google Scholar]
  25. Thanh, V.Q.; Reyns, J.; Wackerman, C.; Eidam, E.F.; Roelvink, D. Modelling suspended sediment dynamics on the subaqueous delta of the Mekong River. Cont. Shelf Res. 2017, 147, 213–230. [Google Scholar] [CrossRef]
  26. Nowacki, D.J.; Ogston, A.S.; Nittrouer, C.A.; Fricke, A.T.; Van, P.D.T. Sediment dynamics in the lower Mekong River: Transition from tidal river to estuary. J. Geophys. Res. Ocean. 2015, 120, 6363–6383. [Google Scholar] [CrossRef]
  27. Tang, T.; Huang, J.; Yin, Y.; Feng, W. Analysis of influence factors of tide-dominated estuaries based on deposition numerical simulation. Open J. Yangtze Oil Gas 2018, 3, 139–146. [Google Scholar] [CrossRef]
  28. Gugliotta, M.; Saito, Y. Matching trends in channel width, sinuosity, and depth along the fluvial to marine transition zone of tide-dominated river deltas: The need for a revision of depositional and hydraulic models. Earth Sci. Rev. 2019, 191, 93–113. [Google Scholar] [CrossRef]
  29. Xu, K.; Wren, P.A.; Ma, Y. Tidal and storm impacts on hydrodynamics and sediment dynamics in an energetic ebb tidal delta. J. Mar. Sci. Eng. 2020, 8, 810. [Google Scholar] [CrossRef]
  30. Tang, J.; Tang, M.; Lu, S.; Liu, X.; Zhang, K.; He, T.; Han, D. Three-dimensional modeling of estuary reservoir based on coupling sedimentary dynamics simulation and multipoint geostatistics method. Earth Sci. 2024, 49, 174–188. [Google Scholar]
Figure 1. Sedimentary facies model of the Middle Jurassic in the West Siberia Basin.
Applsci 15 09527 g001
Figure 2. Bathymetry model of the study area.
Applsci 15 09527 g002
Figure 3. Comprehensive geological and geophysical profile of the study area.
Applsci 15 09527 g003
Figure 4. Basic model and simulation of locally enlarged sediment erosion and flow velocity in the study area ((a) Vym layer simulates early sediment erosion; (b) Vym layer simulates late sediment erosion; (c) Malyshev layer simulates early sediment erosion; (d) Malyshev layer simulates late sediment erosion; (e) Vym layer simulates flow velocity; (f) Vym layer locally enlarged simulated flow velocity in the investigated area; (g) Malyshev layer simulates flow velocity; (h) Malyshev layer locally enlarged simulated flow velocity in the investigated area).
Applsci 15 09527 g004
Figure 5. Length–width scatter plots and length–thickness scatter plots for tidal bars with different bottom shapes. (a) Length–width scatter plot for tidal bars with different bottom shapes. (b) Length–thickness scatter plot of tidal bars with different bottom shapes.
Applsci 15 09527 g005
Figure 6. Length–width scatter plots and length–thickness scatter plots of the sand mats with different bottom shapes. (a) Length–width scatter plot of tidal sheet sands with different bottom shapes. (b) Length–thickness scatter plot of tidal sheet sands with different bottom shapes.
Applsci 15 09527 g006
Figure 7. Variation in shelf velocity under different tidal ranges ((a) simulated velocity of low tidal amplitude; (b) locally amplified simulated velocity of low tidal amplitude study area; (c) simulated velocity of medium tidal amplitude; (d) locally amplified simulated velocity of medium tidal amplitude study area; (e) simulated velocity of high tidal amplitude; (f) locally amplified simulated velocity of high tidal amplitude study area, and the local magnified view of the red box in the first column image is placed in the second row of the corresponding column).
Applsci 15 09527 g007
Figure 8. Length–width scatter plots and length–thickness scatter plots for tidal bars with different idal ranges. (a) Length–width scatter plot for tidal bars with varying tidal heights. (b) Length–thickness scatter plot for tidal bars with different tidal heights.
Applsci 15 09527 g008
Figure 9. Length–width scatter plots and length–thickness scatter plots for sand mats with different tidal ranges. (a) Length–width scatter plot of tidal sheet sand with varying tidal heights. (b) Length–thickness scatter plot of tidal sheet sand with different tidal heights.
Applsci 15 09527 g009
Figure 10. Variation in flow velocity at the shelf under various water levels ((a) simulated flow velocity and (b) locally amplified simulated flow velocity at low water level; (c) simulated flow velocity; (d) locally amplified simulated flow velocity at medium water level; (e) simulated flow velocity and (f) locally amplified simulated flow velocity at high water level, and the local magnified view of the red box in the first column image is placed in the second row of the corresponding column).
Applsci 15 09527 g010
Figure 11. Length–width scatter plots and length–thickness scatter plots for tidal bars at different water levels. (a) Length–width scatter plot for tidal bars varying in water level. (b) Length–thickness scatter plot for tidal bars with varying water levels.
Applsci 15 09527 g011
Figure 12. Length–width scatter plots and length–thickness scatter plots of the sand mats at the different water levels. (a) Length–width scatter plot of the tidal sheet sands as a function of the water level. (b) Length–thickness scatter plot of tidal sheet sands with different water levels.
Applsci 15 09527 g012
Figure 13. Sand body interlayer model.
Applsci 15 09527 g013
Figure 14. Relatively developed sand content formwork of tidal bars (layers J7–J9).
Applsci 15 09527 g014
Figure 15. Profile of relatively developed sand content formwork for tidal bars (layers J7–J9).
Applsci 15 09527 g015
Figure 16. MPS lithology 3D geological model based on sedimentary dynamics constraints.
Applsci 15 09527 g016
Table 1. Parameter settings for the numerical simulation of the deposition process.
Parameter SettingNumerical Value
Work area size, km1500 × 1200
Grid size, km3 × 3
Discrete time step, min1
Bottom shape settingVym
Tidal height, m6
Initial water level, m1
River flow, m3/s3000
Sediment particle size, μm130, 65, mud
Coarse: fine: mud1:1:1
Maximum water depth, m176
Wave height, m1
Deposition acceleration factor100
Table 2. Analysis of the main factors controlling sedimentary dynamics in the Yamal Jurassic.
ScaleModel NameFactorsTypeParametersReason for Selection
BASINHSTbottom shape\MalyshevSecondary main force layer
BASE\VymMain layer/Base model
HIGHWATERwater levelHigh water level45 mThe study area is all below the storm wave base level
MEDIUMWATERMedium water level15 mThe study area is below the wave base
BASELow water level1 mThe study area is near the wave base
HIGHTIDEtideHigh tide10 mMaximum possible tide
BASEMedium tide6 mMean tide
LOWTIDELow tide2 mMinimum tide
HIGHFLUVIALdischargeHigh discharge6000 m3/sLarge rivers
BASEMedium discharge3000 m3/sCompared with Hudson Bay at the same latitude
LOWFLUVIALLow discharge1500 m3/sSmall rivers
HIGHWAVEwaveHigh wave1.5 mLarge wave amplitude
BASEMedium wave1 mAverage wave amplitude
LOWWAVELow wave0.5 mSmall wave amplitude
Table 3. Statistics of sand bodies and channel dimensions of tidal deltas with different bottom shapes.
Bottom Shape FactorAverage Length/kmAverage Width/kmAverage Thickness/m
Tidal BarSheet Sand-Sand FlatTidal ChannelTidal BarSheet Sand-Sand FlatTidal ChannelTidal BarSheet Sand-Sand FlatTidal Channel
Vym11.8314.8377.475.1112.603.728.610.777.43
MalyShev13.1915.8657.066.4415.582.447.380.713.41
Table 4. Statistics of the sand body and channel dimensions of tidal deltas on continental shelves with different tidal ranges.
Tidal Range AmplitudeAverage Length/kmAverage Width/kmAverage Thickness/m
Tidal BarSheet Sand-Sand FlatTidal ChannelTidal BarSheet Sand-Sand FlatTidal ChannelTidal BarSheet Sand-Sand FlatTidal Channel
Low tide (2 m)10.3313.7369.644.6110.562.237.700.545.55
Medium tide (6 m)11.8314.8377.475.1112.603.728.610.777.43
High tide (10 m)13.4819.8881.406.4913.524.3110.270.987.17
Table 5. Statistics of the sand bodies and channel dimensions of the tidal deltas on the continental shelf at the different water levels.
Water Level HeightAverage Length/kmAverage Width/kmAverage Thickness/m
Tidal BarSheet Sand-Sand FlatTidal ChannelTidal BarSheet Sand-Sand FlatTidal ChannelTidal BarSheet Sand-Sand FlatTidal Channel
Low water level (2 m)11.8314.8377.475.1112.603.728.610.777.43
Medium water level (6 m)11.2313.5570.554.4911.433.099.060.685.76
High water level (10 m)-49.21--13.29--0.64-
Disclaimer/Publisher’s Note: The statements, opinions and data contained in all publications are solely those of the individual author(s) and contributor(s) and not of MDPI and/or the editor(s). MDPI and/or the editor(s) disclaim responsibility for any injury to people or property resulting from any ideas, methods, instructions or products referred to in the content.