Abstract
Water quality is crucial to the economy and ecology because a healthy aquatic eco-system supports human survival and biodiversity. We have developed the Neuro-Adapt Fuzzy Strategist (NAFS) to improve water quality index (WQI) forecasting accuracy. The objective of the developed model is to achieve a balance by improving prediction accuracy while preserving high interpretability and computational efficiency. Neural networks and fuzzy logic improve the NAFS model’s flexibility and prediction accuracy, while its optimized backward pass improves training convergence speed and parameter update effectiveness, contributing to better learning performance. The normalized and partial derivative computations are refined to improve the model. NAFS is compared with ANN, Adaptive Neuro-Fuzzy Inference System (ANFIS), and current machine learning (ML) models such as LSTM, GRU, and Transformer based on performance evaluation metrics. NAFS outperforms ANFIS and ANN, with MSE of 1.678. NAFS predicts water quality better than ANFIS and ANN, with RMSE of 1.295. NAFS captures complicated water quality parameter interdependencies better than ANN and ANFIS using principal component analysis (PCA) and Pearson correlation. The performance comparison shows that NAFS outperforms all baseline models with the lowest MAE, MSE, RMSE and MAPE, and the highest R2, confirming its superior accuracy. PCA is employed to reduce data dimensionality and identify the most influential water quality parameters. It reveals that two principal components account for 72% of the total variance, highlighting key contributors to WQI and supporting feature prioritization in the NAFS model. The Breusch–Pagan test reveals heteroscedasticity in residuals, justifying the use of non-linear models over linear methods. The Shapiro–Wilk test indicates non-normality in residuals. This shows that the NAFS model can handle complex, non-linear environmental variables better than previous water quality prediction research. NAFS not only can predict water quality index values but also enhance WQI estimation.
1. Introduction
Clean water is essential for human health, ecosystem preservation, and economic growth. Vigilant water quality monitoring aids protection and maintenance of diverse ecosystem, as well as vital economic activities like farming, tourism, and industry. Waterborne infections constitute a substantial threat in areas where water quality management is inadequate, demonstrating the indisputable link between water quality and public health [1].
Traditional water quality prediction models frequently fail to account for the intricate and ever-changing dynamics of water systems. Unfortunately, the complex interrelationships between many contaminants and environmental conditions are often not captured by these models because they use linear techniques. The difficulties of using these conventional approaches are highlighted [2]. One of the main drawbacks is the approaches cannot foresee when water quality may suddenly change due to things like industrial discharges, agricultural runoff, or weather fluctuations. ANFIS provides a versatile and precise method for modeling intricate ecological systems by integrating the learning power of artificial neural networks with the intuitive reasoning of fuzzy logic. ANFIS can outperform traditional predictive models by effectively handling the non-linear and unpredictable aspects of water quality data [3]. ANFIS is a powerful tool for water quality prediction because it uses neural networks’ learning capabilities and fuzzy logic’s capacity to handle uncertain and imprecise data [4]. The applicability of ANFIS in predictive modeling involves combining it with the turbulent flow of water optimization (TFWO) to improve software fault prediction [5]. ANFIS was determined to be superior to other machine learning (ML) models in forecasting water quality index (WQI) values [6]. The finding highlights the model’s adaptability to various environmental situations. The implementation of ANFIS does not only improve methods for predicting water quality, but also adds to the larger movement towards securing water supplies that can be sustained for years to come [7].
Additionally, hybrid models that combine ANFIS with additional ML methods have demonstrated encouraging outcomes in terms of improving the precision of predictions and the rate of convergence. A hybrid prediction model, FCM-ISSA-ANFIS, was developed for optimal coagulant dosage prediction [8]. The model shows enhanced prediction accuracy and fast convergence, which is important for real-time water treatment operation. Then, another study has compared the computing capabilities of ANFIS with Gradient Boosting Algorithms like Cat Boost, XG Boost, and Light GBM using water quality data [9]. Although Cat Boost performs better in terms of correlation scores, ANFIS offers a good option for situations that require a lot of flexibility and interpretability [9].
Another article has compared an artificial neural network (ANN) with ANFIS in predicting dissolved oxygen (DO) concentration and biological oxygen demand (BOD) in the Periyar River, India [10]. The finding shows that the ANN is better than ANFIS. Besides that, it has proved the effectiveness of ANN by demonstrating ANN’s efficacy in forecasting water quality parameters of Wangchu river with an efficiency of 97.3%, and showcasing the model’s resilience in dealing with complicated environmental datasets [11]. The study highlights that ANNs can be used in different situations, which makes the model suitable for water quality modeling. The author has demonstrated that Random Forest (RF), along with other ML models, can effectively handle complicated, multidimensional data when predicting the potability of water using various characteristics [12].
Recent research has shown that geospatial and ML techniques, combined with traditional water quality indices, can improve the assessment of both surface and groundwater. The WQI method is used to evaluate the surface and underground water sources in a Nigerian peri-urban settlement [13]. The authors state that WQI formulations should routinely incorporate microbiological markers to guarantee thorough examination. Meanwhile, in South India, groundwater potential zones were monitored using an RF ML model that integrates ten environmental and geographical indicators [14]. Important aspects like geology, rainfall, lineament density, and land use are investigated, which attain a classification accuracy of 86%. Collectively, these works demonstrate how ML and spatial analysis play an increasingly important role in enhancing groundwater resource planning and water quality monitoring.
Unlike deep learning-based models such as the LTSF-Linear model used for Huangyang Reservoir, which enhances long-term time series forecasting but lacks explainability and adaptability to local environmental standards [15], hyper-tuned ensemble ML models integrate Random Forest, Extreme Gradient Boosting, and Histogram Gradient Boosting for real-time monitoring [16]. While Bayesian-optimized explainable ML approaches [17] demonstrate high performance in dissolved oxygen prediction, they require intensive hyperparameter tuning and lack direct fuzzy logic-based adaptability to environmental uncertainties. Then, the article in [18] presents an in-depth evaluation of machine learning and statistical methods, including regression, ensemble learning, principal component analysis, and hybrid framework, for predicting and classifying water quality. The review focuses on applications to rivers and lakes within Malaysia’s environmental and regulatory framework, while also highlighting ongoing obstacles such as issues with data reliability, challenges in interpreting model outputs, and limited integration of spatio-temporal analysis and fuzzy logic. It concludes with recommendations for advancing AI-enabled water management towards more adaptive, transparent, and precise solutions.
The management of the environment and the protection of public health depend on precise predictions of water quality [19]. Since they are linearly based, conventional water quality models fail to accurately represent the complicated non-linear interactions between different contaminants. In response to these shortcomings, environmental researchers have begun to rely on statistical approaches like Pearson correlation analysis and principal component analysis (PCA) for their analysis [20]. The complexity of environmental datasets can be simplified and trends in water quality can be more easily understood through PCA, which lowers data dimensionality by identifying the most significant sources of variability [8]. Meanwhile, environmental monitoring decision-making and predictive modeling rely on Pearson correlation analysis, which allows us to quantify the strength and direction of linear correlations among water parameters [2].
Thus, the aim of this research is to enhance water quality prediction by developing a new model, Neuro-Adapt Fuzzy Strategist (NAFS). The learning process’s backward pass, which deals with the normalized value and its related partial derivatives, is investigated in NAFS. ANFIS’s learning method is not always efficient when altering model parameters, especially during the backward pass. It is because ANFIS handles rule strengths and normalizes them. For a more effective and efficient update mechanism during the learning phase, NAFS suggests improvement by optimizing and refining the calculation of normalized value and its partial derivatives using the backpropagation algorithm. Thus, the model can learn from data more effectively, which speeds up convergence and improves accuracy.
The limitations of prior models, such as reliance on extensive datasets, complex computational requirements, and the lack of localized interpretability, are effectively mitigated by NAFS, making it a promising alternative for sustainable water quality management.
This study utilizes Malaysian water quality data and focuses on six critical parameters, namely pH, dissolved oxygen (DO), biological oxygen demand (BOD), chemical oxygen demand (COD), suspended solids (SS), and ammoniacal nitrogen (AN) in accordance with the national Water Quality Index (WQI) guidelines. The parameters are used to measure a water quality index that is important to determine the health of water. The article shows that the parameters are important for water quality evaluation [6]. ANFIS and other ML algorithms may improve prediction accuracy and timeliness. This study covers a wide range of geographic regions in Malaysia, showcasing the unique aquatic ecosystems found throughout the country. The developed model can provide insights that may inform targeted water management strategies and policy actions by analyzing a large dataset that spans several years.
Here, NAFS, a novel hybrid model, is proposed by integrating neural networks and fuzzy logic, enhanced with an optimized backward pass, to deliver superior predictive accuracy to forecast WQI. Leveraging an extensive dataset from six major Malaysian water bodies and validated through rigorous statistical techniques, NAFS demonstrates significantly lower error values than ANN and ANFIS, confirming its robustness and applicability for real-time environmental decision-making.
This study is structured as follows: The highlights of the study are presented in the next section. The methodology is outlined in Section 3, followed by the presentation and discussion of results. The summary, direction for future research, and challenges are discussed in the final section.
2. Highlights
The highlights of this study are as follows:
- Presenting NAFS, a novel model that combines neural networks and fuzzy logic to improve the accuracy of prediction in WQI calculation.
- Demonstrating that NAFS outperforms ANN and ANFIS with significantly lower error values, including MSE of 1.678 and RMSE of 1.295, indicating improved predictive accuracy and reliability.
- Utilizing an extensive dataset from six prominent Malaysian water bodies to enhance the reliability and practicality of water quality forecasts.
- Incorporating advanced learning mechanisms, such as an optimized backward pass, which improves the model’s adaptability and efficiency in real-time contexts.
- Confirming the robustness of the NAFS model through statistical validation techniques, supporting its suitability for environmental decision-making and water resource management.
3. Methods
3.1. Description of the Study Area
The study covers six key locations in Malaysia: the Klang River, Semenyih River, Labu River, Muar River, Malacca River, and MRANTI Lake. These sites are selected due to their proximity to industrial and residential areas, making them critical for evaluating environmental, economic, and social impacts. The Klang River, flowing through the heart of Kuala Lumpur, supports over 1.13 million residents and faces challenges from industrial discharge and urban runoff [21]. The Semenyih River, a major drinking water source for more than 3.9 million people in Selangor, is vulnerable to agricultural pollution along its course [22].
In Negeri Sembilan, the Labu River serves as a vital resource for farming and fishing, supporting approximately 45,280 people who rely on it for irrigation and domestic use [21]. Its health is directly linked to local agricultural sustainability. The Muar River in Johor provides water to over 300,000 residents and supports a significant fishing industry [21]. In Malacca, with a population of about 1.02 million, the Malacca River plays a central role in both local livelihoods and tourism activities [21]. Finally, MRANTI Lake, located within the Malaysia Research Accelerator for Technology and Innovation Park, represents a new study site. In addition to recreational use, the lake supports research and development activities, highlighting the importance of continuous water quality monitoring. The locations of the data collection sites are illustrated in Figure 1.
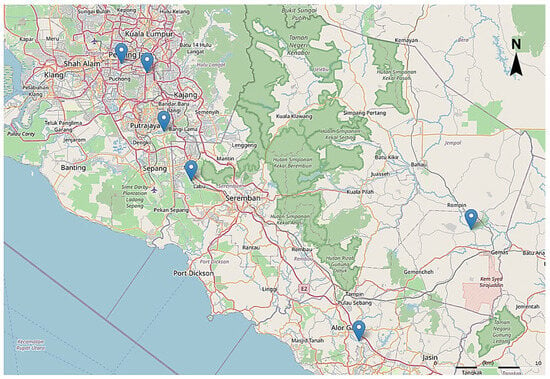
Figure 1.
Geographical distribution of the six selected water quality monitoring locations across Peninsular Malaysia. The marked points represent different river or catchment areas where data on key water quality parameters were collected for analysis and model development in this study. These sites span both urban and rural regions, ensuring a diverse environmental context for predictive assessment.
3.2. Dataset and Sample Analysis
The dataset contains 11,065 samples with the following water quality parameters: DO, BOD, COD, SS, pH, and AN, along with a date column and a sample number. These parameters are essential for assessing water quality in accordance with Malaysia’s standards [23]. The data include all selected river sampling records in 2021, in addition to the MRANTI Lake dataset. For MRANTI Lake, the data were collected from September 2023 to February 2024 at 30 min intervals. For the rivers, the sampling method is conducted by Department of Environment (DOE), Malaysia, with an average of approximately 833 data points per month.
3.3. Water Quality Index (WQI) Calculation
The water quality index (WQI) is comprehensively used to assess water quality. Equation (1), provided by DOE Malaysia [23,24], is used to calculate the WQI value.
Subindex (SI) values for water quality parameters are combined to give a single numerical value for WQI. refers to Subindex Dissolved Oxygen, and is calculated based on a cubic polynomial function for DO values; is Subindex Biochemical Oxygen Demand, a piecewise linear-logarithmic function; is Subindex Chemical Oxygen Demand, derived using a linear function for low COD and an exponential function for high COD values; is Subindex Ammoniacal Nitrogen, and incorporates piecewise equations depending on concentration thresholds; is Subindex Suspended Solid, and applies an exponential or linear function depending on the SS concentration range; and is Subindex pH, and uses a quadratic function segmented into four pH ranges for better curve fitting. These sub-indices are obtained using Equation (2) until Equation (7), which determine the best-fit connection for each water quality parameter. Each water quality parameter is weighted differently to determine WQI, indicating its relative importance to the overall water quality evaluation for certain users, such as drinking water, recreation, or aquatic life. The accuracy of WQI given water quality parameter changes depends on the weighting mechanism.
DO is a critical indicator for water quality, helping aquatic species survive. DO has the largest weight in the DOE-WQI formula, 22%. An opinion survey of water quality professionals gave pH the lowest weight (12%). The WQI helps the government and the environmental managers to identify pollution issues, set water quality goals, and evaluate pollution control measures by prioritizing parameters related to ecological and human health impacts.
3.4. Development of NAFS (Neuro-Adapt Fuzzy Strategist)
Figure 2 shows the flow chart of the steps involved in monitoring water quality using the NAFS model. The first step is collecting data, which involves measuring various water quality metrics. The next step is cleaning and handling the missing values in these data, which can involve looking for NaN (Not a Number). In order to guarantee consistency, the data are transformed into a numerical representation if NaN values are discovered. Following data cleaning and numeric separation, 70% of the data is reserved for training purposes, while 30% of the data is used for testing. The share of 70% for the training data provides a sufficiently large sample for the model to learn effectively, capturing the underlying patterns without being too small, which could lead to underfitting. The remaining 30% of the data ensures there is enough data to test and validate the model’s performance, helping to detect overfitting.
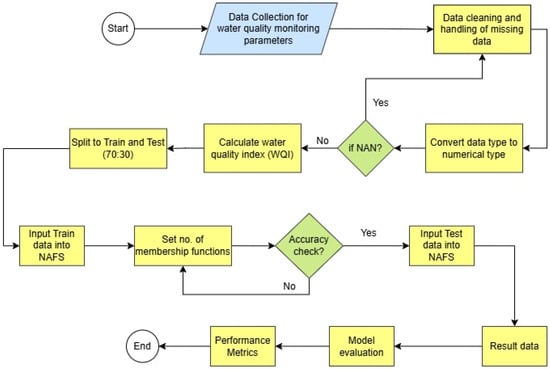
Figure 2.
Workflow of the NAFS model for water quality prediction. The process begins with the collection and preprocessing of raw water quality data, followed by stationarity checking and trend analysis. The final output consists of continuous WQI values for effective decision-making.
To account for time-dependent variations, the dataset from MRANTI Lake, originally collected at a high temporal resolution (every 30 min), was aggregated to daily averages to ensure temporal consistency with the daily river data obtained from DOE. Although the WQI formula is a static weighted average, the NAFS model inherently considers temporal dependency by preserving the sequential order of observations during the training and testing phases. The resulting ~180 daily records from MRANTI Lake were used specifically for model validation, while the larger DOE river dataset (over 10,000 samples) formed the basis for robust model training.
This allows the model to learn time-based variations and patterns in water quality parameters. Additionally, the model’s performance is evaluated across time intervals to ensure it generalizes well to unseen temporal data. An essential stage for fuzzy systems involves setting the number of membership functions by entering the training data into NAFS. These functions dictate how the input data will be categorized based on linguistic values, such as “low”, “medium”, or “high”.
Then, WQI is determined to describe the quality of water. The performance of NAFS is then evaluated with an accuracy check. If the results are unsatisfactory, the system may go through an iterative process where it tweaks the settings and starts over. NAFS is then used to forecast water quality based on the test data, providing that the models are satisfactory. Using the test data, we calculate the performance metrics to measure the model’s predictive capacity and assess its performance. Depending on the situation, these measures include things like recall, accuracy, precision, MAE, RMSE, and others. It reports the results from the test data prediction for interpretation once the model evaluation is complete and the system works as expected.
The NAFS model’s design combines neural networks with fuzzy logic concepts, as illustrated in Figure 3, where the parameters of a fuzzy system are determined by a neural network learning process. The NAFS model uses a more sophisticated set of fuzzy rules by increasing the number or complexity of rules to capture more detailed nuances in the data. The NAFS model introduces enhancement to the traditional backpropagation algorithm used in ANFIS to improve learning efficacy and adapt to more complex data patterns. The choice of error function can significantly impact the efficiency of the backpropagation algorithm. In NAFS, custom error functions are tailored to specific tasks or domains that are being used. For example, using a cross-entropy loss function instead of mean squared error for classification tasks provides better performance.
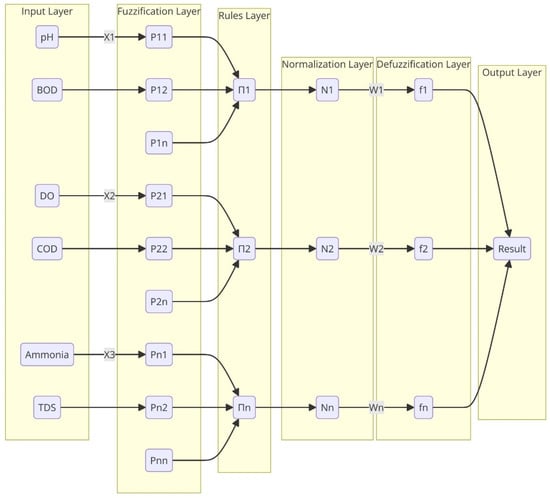
Figure 3.
The architecture of the NAFS model.
The description of the layers and the methods used in the design to forecast parameters related to water quality are shown as follows:
- First layer: In this layer, the water quality parameters include pH, DO, COD, AN, and SS, where each node stands for one of these metrics;
- The first layer, “Fuzzification,” uses membership functions to transform the clean input values into fuzzy logic. Fuzzification describes the procedure. The layer’s nodes are square and have a parameterized membership function—like a bell-shaped function—that give a membership degree between zero and one.
- Every node in the rules layer refers to a fuzzy rule. Each rule produces an output label representing a qualitative assessment of water quality, denoted as n11, n12,…, n39. These outputs are intermediate linguistic labels used in the fuzzy inference process and are later mapped to a final water quality score through defuzzification. For example, n11 to n19 correspond to combinations of pH and BOD, n21 to n29 to combinations of DO and COD, and n31 to n39 to combinations of ammonia and TDS. While the labels (n11–n39) are internal identifiers, they reflect varying degrees of water quality states—ranging from “very poor” to “excellent”—depending on the strength and nature of the fuzzy conditions.
- The list of rules is shown below:
- R1: IF pH is Low AND BOD is Low THEN water quality is n11.
- R2: IF pH is Low AND BOD is Medium THEN water quality is n12.
- R3: IF pH is Low AND BOD is High THEN water quality is n13.
- R4: IF pH is Medium AND BOD is Low THEN water quality is n14.
- R5: IF pH is Medium AND BOD is Medium THEN water quality is n15.
- R6: IF pH is Medium AND BOD is High THEN water quality is n16.
- R7: IF pH is High AND BOD is Low THEN water quality is n17.
- R8: IF pH is High AND BOD is Medium THEN water quality is n18.
- R9: IF pH is High AND BOD is High THEN water quality is n19.
- R10: IF DO is Low AND COD is Low THEN water quality is n21.
- R11: IF DO is Low AND COD is Medium THEN water quality is n22.
- R12: IF DO is Low AND COD is High THEN water quality is n23.
- R13: IF DO is Medium AND COD is Low THEN water quality is n24.
- R14: IF DO is Medium AND COD is Medium THEN water quality is n25.
- R15: IF DO is Medium AND COD is High THEN water quality is n26.
- R16: IF DO is High AND COD is Low THEN water quality is n27.
- R17: IF DO is High AND COD is Medium THEN water quality is n28.
- R18: IF DO is High AND COD is High THEN water quality is n29.
- R19: IF Ammonia is Low AND TDS is Low THEN water quality is n31.
- R20: IF Ammonia is Low AND TDS is Medium THEN water quality is n32.
- R21: IF Ammonia is Low AND TDS is High THEN water quality is n33.
- R22: IF Ammonia is Medium AND TDS is Low THEN water quality is n34.
- R23: IF Ammonia is Medium AND TDS is Medium THEN water quality is n35.
- R24: IF Ammonia is Medium AND TDS is High THEN water quality is n36.
- R25: IF Ammonia is High AND TDS is Low THEN water quality is n37.
- R26: IF Ammonia is High AND TDS is Medium THEN water quality is n38.
- R27: IF Ammonia is High AND TDS is High THEN water quality is n39.
- The membership values from the preceding layer are inputs to these nodes, and the output, which represents the rule’s strength, is the product of these values.
- The normalization layer takes the rules layer’s output and applies some standardization to it. are the nodes in this layer that determine the firing strength ratio of the rule relative to the sum of all rules. This step converts the firing intensity of the rules into a probability distribution by ensuring that the total of the output signals is equal to 1.
- To transform the fuzzy classification results into a clean output, there is a defuzzification layer. Usually, a parameterized function is used to determine the weighted average for the nodes in this layer, which are designated as . These function parameters are changed during training.
- The final layer is responsible for calculating the total output by aggregating all the incoming signals. The inputs and learned fuzzy rules would culminate in a final prediction at the “Result” node in this layer for water quality prediction.
Datasets of water quality measurement are used to train the NAFS architecture. During training, a learning algorithm like backpropagation or a hybrid algorithm combining backpropagation and least-square estimation is used to update the parameters of the membership functions and the rules from Equation (8), where A is the matrix of input values modified by the respective firing strengths, is the vector of parameters, and b is the vector of target outputs for the training data. The parameters of the membership functions are adjusted using the gradient descent method based on the overall error of the system as shown in Equation (9), where E is the error function, which is the sum of squares between the predicted and actual outputs, and is the learning rate. During training, the network is fed with the known input and output, and the system parameters are adjusted so that the expected and actual output differences are minimized. Predicting water quality using newly measured input parameters is possible after training the NAFS model.
The adaptive learning rate is used where the learning rate η(t) is adjusted dynamically on a decay parameter δ, as shown in Equation (10). This helps the model to adapt to changes in data over time and avoid overshooting during optimization. Further improvement includes integration of momentum-based gradient descent to stabilize and accelerate convergence. The momentum term, , updates as shown in Equation (11), and the parameters are updated accordingly, fostering a smoother descent process. Fuzzy rule modifications are also integrated with strategic learning components and complexity management in the NAFS model. This may need to be reframed as a multi-objective optimization problem in order to optimize not only one but several objectives, such as minimizing error while keeping the system stable. To ensure robust training of the NAFS model, a total of 100 training epochs were used, with a batch size of 64. The learning rate was initialized at 0.001 and optimized using the Adam optimizer, which balances convergence speed and stability [25]. Hyperparameter tuning was performed using a grid search strategy across membership function types, number of rules, and learning rates to determine the optimal model configuration. To assess the NAFS model’s forecasting capability, a time step of 30 days ahead was used. This time interval was selected to balance predictive depth and practical application in water quality management. A 30-day lead time aligns with monthly environmental reporting cycles and allows decision-makers to implement timely interventions. It also enables the model to capture longer-term patterns and trends rather than short-term fluctuations, making it suitable for strategic planning.
3.5. Adaptive Neuro Fuzzy Inference System (ANFIS)
Adaptive Neuro-Fuzzy Inference System (ANFIS) offers a structured approach by blending the intuitive logic of fuzzy systems with the adaptive capabilities of neural networks. ANFIS is particularly useful in predicting water quality, where the relationship between different parameters can be highly non-linear and influenced by numerous factors. The methodology follows a structured process [26]:
- Fuzzification: This initial step involves converting the crisp input variables. In the context of water quality prediction, the parameters like pH, DO, COD, BOD, AN, and SS are included in fuzzy values.
- Rule base: A set of fuzzy if–then rules, derived from expert knowledge or empirical data analysis, is established to capture the relationship between the fuzzy input variables and the target output, the water quality index (WQI).
- Defuzzification: The final step in the ANFIS model is to convert the fuzzy output sets into crisp values, providing specific prediction for the WQI. The centroid method is a common defuzzification technique, which calculates the center of gravity of the aggregated fuzzy set to produce a precise output value.
3.6. Artificial Neural Network (ANN)
Creating the architecture of the ANN consists of determining the number of input neurons to correspond to the quantity of water quality metrics, creating a hidden layer (or layers) to represent the intricacy of the interdependencies between variables, and establishing an output layer that forecasts WQI. Six neurons receive data, representing pH, DO, AN, SS, BOD, and COD. The network is fed with the normalized values of these parameters using these neurons. Hidden Layer 1, the second layer, has five nodes. In this layer, every node applies an activation function after performing a weighted sum of its inputs. This layer makes use of the non-linear Rectified Linear Unit (ReLU) activation function, which can capture more complex interactions due to its introduction of linearity [27]. To eliminate vanishing gradient problems and speed up learning in general, the ReLU function sends the input directly if it is positive and zero otherwise.
In Hidden Layer 2, which is conceptually identical to the first hidden layer, three nodes carry on processing the inputs received from the first layer. As data move up the stack, they become more theoretically representative of the patterns required for WQI prediction. A linear activation function is applied by a single node in the output layer. Since the WQI prediction and other regression tasks use continuous variables as outputs, the linear activation function works well for them. After training, the output of the node that reflects the projected WQI is a linear combination of the inputs, as the activation function is linear. The ANN is trained by feeding its training data and adjusting the model weights using a backpropagation algorithm. A loss function, such as the mean squared error in regression tasks, guides this process. By utilizing an optimizer such as Adam, one can minimize the loss function. The model’s hyperparameters, including the learning rate and the number of epochs, are tuned based on the validation set of performance to prevent overfitting and ensure good model generalization to new data [28].
3.7. Model Evaluation
Separate sets of data are used for training and testing. The model is trained on the training set and tested on the testing set to see the performance of the model. Equations for calculating the mean square error (MSE), root mean square error (RMSE), mean absolute percentage error (MAPE), mean absolute error (MAE), and correlation coefficient () are shown from Equation (12) to Equation (16). These metrics are used to evaluate the precision of the data [29].
In the equations, n refers to the overall count of data points, is the model’s predicted value at that data point, is the real data value, and refers to the average data point. Improvement in model accuracy should be accompanied by a decline in all five metrics: MAE, RMSE, MSE, MAPE, and . With an MAE of 0 signifying faultless predictions, a lower number is preferable. Compared to MAE, RMSE is more affected by extreme values. With a smaller RMSE value, we can see that the fit is better. Like RMSE, MSE is susceptible to outliers because squaring penalizes huge errors more. According to MAPE, a lower value is preferable. Higher MAPE values indicate more divergence, whereas a value of 0% is ideal [30].
The model performance was evaluated using 10-fold cross-validation, which involved dividing the dataset into 10 equal parts and iteratively training and testing the model on 9 folds while validating on the remaining fold. This process was used within the training set, which was defined by an initial 70% split of the entire dataset. The remaining 30% of the data was held out as an independent test set to evaluate final model performance. This approach ensures that the model benefits from robust training validation (via cross-validation) while also preserving an unseen dataset for assessing generalization capability. The results confirm that the NAFS model maintains predictive strength even across time-sequenced data, demonstrating its ability to manage temporal dependencies.
3.8. Statistical Analysis
The statistical analysis in this study employs two primary methods: principal component analysis (PCA) and Pearson correlation analysis. PCA is a statistical technique that reduces data dimensionality by identifying principal components that represent the highest variance within a dataset [31]. This method can identify which parameters significantly contribute to overall variability, making it easier to interpret complex datasets. Before PCA is performed, data standardization is applied to ensure equal weighting across parameters, thus preventing scale-dependent bias in the analysis [32]. Additionally, Pearson correlation analysis is used to quantify linear relationships between pairs of parameters, providing insights into how strongly variables are interconnected. The Pearson correlation coefficient ranges from −1 to 1, where values closer to ±1 indicate stronger linear relationships [33]. These statistical methods are essential for accurately interpreting complex, multi-parameter environmental data, enhancing model robustness and reliability for predictive water quality assessments. While Pearson correlation assumes normality, it is still applicable in our study due to the large sample size, which allows the correlation estimates to remain stable. Then, PCA was applied to reduce dataset dimensionality while preserving 95% of the variance, enabling the identification of key water quality parameters such as dissolved oxygen and ammoniacal nitrogen [34]. This step enhanced computational efficiency and interpretability, supporting the integration of statistical tests and machine learning models for more accurate environmental analysis.
More importantly, Pearson’s coefficient was used to detect the degree of linear association among water quality parameters rather than to assume a distribution [35]. Thus, Pearson correlation, which assumes normally distributed data, is informative in our instance for two reasons:
- Under the Central Limit Theorem, the correlation coefficient sampling distribution approximates normality due to the huge sample size [36].
- We want to find linear correlations between water quality metrics using Pearson correlation, even with considerable deviations from normality.
Assumption and diagnostic testing is a crucial role in regression analysis to validate the underlying assumptions to ensure the reliability and accuracy of the model’s predictions and inferences, as shown in Figure 4. Addressing key assumptions such as homoscedasticity and normality of residuals helped detect potential violations that could lead to biased estimation. The Breusch–Pagan test is used to diagnose heteroscedasticity, a condition where the variance of residuals is not constant across the range of fitted values [37]. The test involves computing the residuals from the regression model and regressing the squared residuals on the predicted values or explanatory variables to model variance patterns. The test includes visualization as a key component, and a residual versus fitted value plot is generated to inspect residual patterns. Randomly scattered residuals indicate homoscedasticity, while a fan-shaped or systematic pattern suggests heteroscedasticity. The test ensures that any detected heteroscedasticity is addressed through remedial actions such as data transformation or robust standard errors.
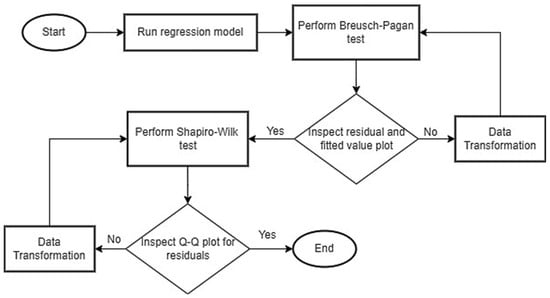
Figure 4.
Flowchart illustrating the assumption and diagnostic testing process in regression analysis. The procedure begins with residual analysis to validate key assumptions such as homoscedasticity and normality. The Breusch–Pagan test is applied to detect heteroscedasticity, followed by visualization techniques such as residual vs. fitted value plots.
The Shapiro–Wilk test assesses the normality of residuals, which is a critical assumption for many parametric methods [38]. The test assesses the correlation between the ordered residuals and their expected values under a normal distribution, producing a W-statistic. A Q-Q plot is generated to visually inspect normality. In the Q-Q plot, residuals are plotted against the theoretical quantiles of the normal distribution, where a straight diagonal line signifies normality, and deviations suggest non-normality. This test ensures that violations of normality are detected and addressed, such as by transforming the data. The Breusch–Pagan and Shapiro–Wilk tests are applied to identify and correct potential issues in the model’s assumptions, which lead to more reliable and interpretable regression results.
4. Results and Discussion
4.1. Preliminary Statistical Results Based on Data
The boxplots shown in Figure 5 provide a visual summary of the distribution for each water quality parameter across the 11,065 samples.
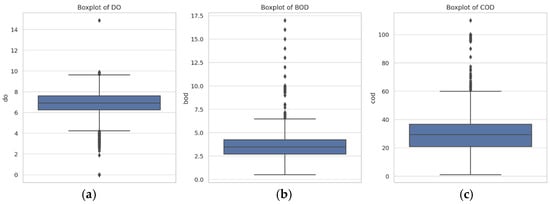
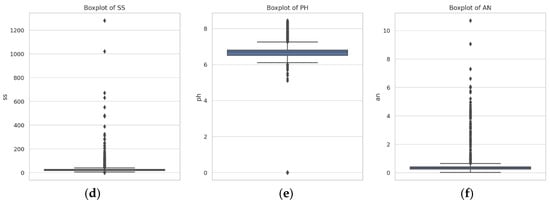
Figure 5.
Boxplots showing the distribution of each water quality parameter across 11,065 samples: (a) DO, (b) BOD, (c) COD, (d) SS, (e) pH, and (f) AN. These visualizations help identify central tendencies, variability, and outliers for each parameter.
- DO: The distribution shows a relatively tight grouping, indicating consistent DO levels across samples, with a few outliers suggesting instances of lower oxygen levels.
- BOD: BOD levels display a compact distribution, highlighting generally stable organic pollution levels, though outliers are present, indicating occasional higher pollution levels.
- COD: The COD boxplot reveals a slightly wider spread, suggesting more variability in the chemical pollutants within the water samples.
- SS: The distribution of SS shows a narrow interquartile range but with several outliers, indicating sporadic instances of a higher level of suspended solids.
- pH: The pH levels are concentrated around the neutral to slightly alkaline range, crucial for maintaining aquatic life health and water quality, with minimal outliers.
- AN: The parameter’s distribution is relatively tight, with a few outliers indicating occasional spikes in nitrogen levels, which can be from agricultural runoff or industrial waste.
Table 1 summarizes the statistical analysis of the data for different variables, including pH, COD, BOD, SS and DO. The description of each water parameters value is shown below.

Table 1.
Descriptive analysis of water quality parameters.
- DO: Higher values are generally better, with anything above 5 mg/L considered acceptable for most aquatic life.
- BOD and COD: Lower values are preferable as they indicate less organic pollution. BOD levels below 3 mg/L and COD levels below 10 mg/L are often considered clean for natural waters.
- SS: Lower levels are desired as high SS can affect aquatic life and water clarity. Acceptable levels can be below 25 mg/L.
- pH: A range of 6.5 to 9 is generally acceptable for freshwater systems to protect aquatic life.
- AN: Lower concentration of AN is preferable, with levels ideally below 0.5 mg/L for protection against eutrophication.
Coefficient of variation (CV) is a percentage that indicates relative variability. A high CV for water quality metrics means that there is a lot of variation around the mean. The very high CV for SS and AN, for instance, indicates that these parameters’ values vary substantially between samples and time intervals. Data analysis and ML, particularly ANN modeling, frequently include normalizing these values as a preprocessing step. The goal is to change the data scale so that it no longer loses information or distorts variations in the range of values. By standardizing all variables to the same scale, normalization ensures that the model’s learning process is not overshadowed by variables with bigger scales.
Figure 6 presents Q-Q probability plots for each of the six water quality parameters: DO, BOD, COD, SS, pH, and AN. The red reference line represents the theoretical quantiles under a normal distribution. Most parameters deviate from this line, particularly SS, AN, BOD, and COD, indicating substantial non-normality. The deviations confirm that these variables exhibit skewness and the presence of extreme values. The pattern supports the choice of a non-linear model like NAFS for accurate prediction.
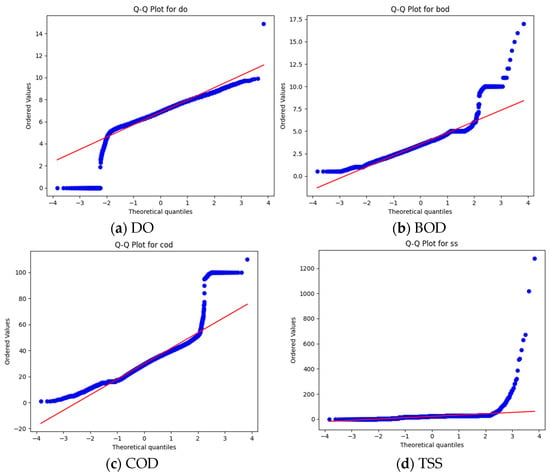
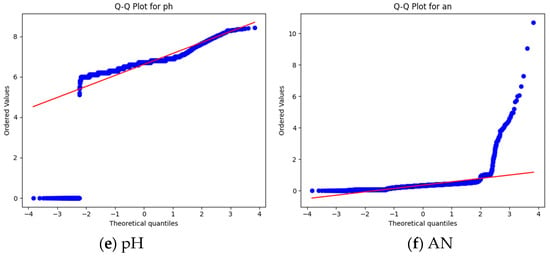
Figure 6.
Quantile–quantile (Q-Q) plots for each of the six water quality parameters: (a) DO, (b) BOD, (c) COD, (d) SS, (e) pH, and (f) AN. The plots compare the empirical quantiles of the sample data to the theoretical quantiles of a normal distribution. The red reference line represents perfect normality. Deviations from this line indicate departures from normality, with parameters such as SS, AN, BOD, and COD showing substantial skewness and heavy tails.
The Pearson correlation analysis of water quality parameters, including DO, BOD, COD, SS, pH, and AN, is shown in the heatmap in Figure 7. A neutral color indicates no association at all, while red color denotes a strong positive correlation and blue color shows a strong negative correlation. It is much easier to see the connection between variables using this representation. For instance, it is easy to see the positive connection between BOD and AN and COD, as well as the substantial negative correlation between DO and COD/BOD. The heatmap gives a clear and useful summary of the interplay between these important water quality factors. Although the normality assumption is ideal for Pearson correlation, it can still provide useful insights in large datasets, where the sampling distribution of the correlation coefficient tends toward normality due to the Central Limit Theorem. Furthermore, the Pearson coefficient remains valid for identifying linear relationships, which is the primary intent in our analysis.
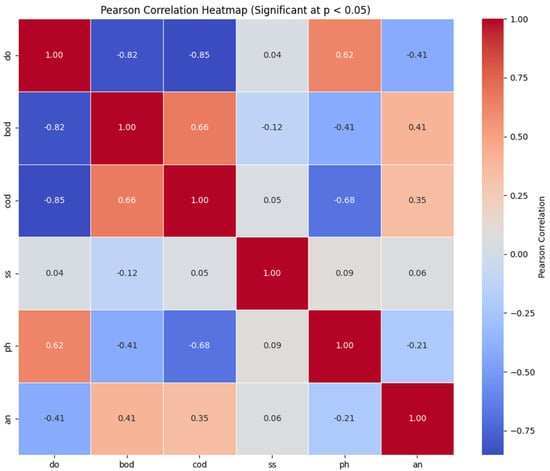
Figure 7.
Heatmap visualization of the Pearson correlation coefficients among six water quality parameters: DO, BOD, COD, SS, pH, and AN. The color intensity indicates the strength and direction of correlation, with blue representing positive correlation and red representing negative correlation.
To complement the Pearson correlation analysis and account for potential non-normal distributions in the dataset, a Spearman rank correlation is conducted among the six key water quality parameters. Spearman’s method is a non-parametric measure that evaluates monotonic relationships between variables. As shown in the Spearman correlation heatmap (Figure 8), several strong correlations are observed. DO is found to be strongly and negatively correlated with BOD (−0.76), COD (−0.78), and AN (−0.72), indicating that as organic and nutrient loading increases, oxygen availability decreases—consistent with environmental expectations. Similarly, COD shows a strong positive correlation with AN (0.85) and a moderate one with BOD (0.51), suggesting that chemical and biological oxygen demands are interconnected and influenced by nutrient presence. TSS exhibits weaker correlations with most parameters, which may reflect more localized or episodic influences on suspended solids. Notably, pH has weak to moderate negative correlations with COD (−0.43) and AN (−0.41), which can be attributed to the acidifying effect of pollutants on water chemistry. These findings affirm the use of Spearman correlation as a complementary tool to Pearson, offering better insight into non-linear dependencies among water parameters. This supports the robustness of the dataset analysis and informs the selection and interpretation of predictive models.
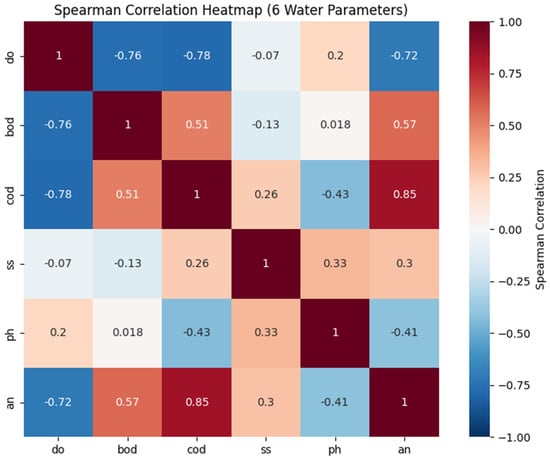
Figure 8.
Spearman correlation heatmap of six water quality parameters. The color gradient indicates the strength and direction of monotonic relationships, ranging from −1 to +1. Strong negative correlations are observed between DO and both BOD and COD (r = −0.76 and −0.78, respectively), reflecting the inverse relationship between oxygen levels and organic pollution. COD and AN show a strong positive correlation (r = 0.85), indicating potential common sources such as agricultural runoff or industrial discharges.
4.2. Water Quality Index Forecasting Analysis
The Long Short-Term Memory (LSTM) network, a type of recurrent neural network (RNN), has been widely adopted for its capability to handle long-range dependencies in time series water quality data. For instance, the effectiveness of LSTM models is shown in predicting drinking water quality parameters, including pH, DO, chemical oxygen demand (COD), and ammonia, in the Yangtze River basin [39]. Similarly, Gated Recurrent Units (GRUs), which are computationally lighter alternatives to LSTM, have shown comparable performance in forecasting water quality parameters, as evidenced by their application in predicting dissolved oxygen levels in aquaculture systems [40]. The NAFS model was tested for its ability to forecast water quality 30 days into the future. This forecasting horizon is particularly valuable for early detection of deterioration in water quality and provides a critical buffer window for authorities to take preventative or corrective action before conditions worsen.
Hybrid deep learning models, such as Convolutional Neural Network–LSTM (CNN-LSTM), combine the spatial feature extraction capabilities of CNNs with the temporal modeling strength of LSTM, making them suitable for spatial–temporal datasets collected from sensor networks. The CNN-LSTM model outperforms standalone ML models in predicting DO and chlorophyll-a levels in Small Prespa Lake, Greece [39]. More recently, Transformer-based models, which leverage self-attention mechanisms, have shown state-of-the-art performance in long-horizon time series prediction tasks, including water quality forecasting. For example, a water quality prediction framework was developed based on a Transformer model, which demonstrates improved accuracy in capturing complex time series features [41].
Table 2 provides a comparative analysis of various predictive models utilized in water forecasting, assessed across four critical dimensions: temporal capability, interpretability, training efficiency, and data needs. Conventional models such as ANN and ANFIS provide simplicity and interpretability but are inadequate in capturing temporal interdependence [26,42]. Advanced deep learning architectures, including LSTM, GRU, CNN-LSTM, and Transformer, have robust temporal modeling proficiency, rendering them appropriate for dynamic environmental systems [40,41,43]. Nonetheless, they frequently necessitate considerable training duration, substantial processing resources, and huge datasets that constrain their interpretability and real-time usability. The suggested NAFS model aims to achieve a balance by improving prediction accuracy while preserving high interpretability and computational efficiency.

Table 2.
Comparative evaluation of models for water forecasting based on key attributes.
Table 3 shows the comprehensive performance evaluation of ANN, ANFIS, and NAFS using MSE, MAE, RMSE, and MAPE from different perspectives. Each metric captures a unique aspect of prediction accuracy and robustness:

Table 3.
Evaluation metrics for ANN, ANFIS, and NAFS.
- MSE and RMSE penalize larger errors more severely, which is useful when large deviations are critical.
- MAE gives a straightforward interpretation of average error, which is less sensitive to outliers.
- MAPE expresses prediction accuracy as a percentage, making it intuitive for practical applications.
- R2 (coefficient of determination) indicates the proportion of variance explained, providing a standardized goodness-of-fit indicator.
Table 4 presents the performance comparison of five models—LSTM, GRU, CNN, CNN-LSTM, and NAFS—based on common evaluation metrics: MSE, RMSE, MAE, MAPE, and the coefficient of determination (R2). Among the models, the NAFS model demonstrates the best overall performance, with the lowest MSE (1.678), RMSE (1.295), MAE (0.257), and MAPE (0.33%), indicating superior predictive accuracy and minimal deviation from actual values. It also achieves the highest R2 value (0.943), reflecting strong model fit. In comparison, the LSTM [44] model performs relatively well, with an R2 of 0.879 and lower error metrics than GRU, CNN, and CNN-LSTM. GRU [40] and CNN [45] models show moderate performance, but their higher error values and lower R2 scores suggest reduced accuracy and weaker data representation. The CNN-LSTM [39] hybrid performs better than GRU and CNN [45] but remains less accurate than LSTM and significantly behind the NAFS model. Overall, the NAFS model clearly outperforms the others across all metrics, confirming its robustness and reliability in water quality prediction.

Table 4.
Comparison of current models with NAFS.
MSE, which evaluates the average of the square of the errors between predicted and actual values, differs significantly for ANN, ANFIS, and NAFS models. The MSE of ANN is 14.208, the MSE of ANFIS is 4.815, while the MSE of NAFS is 1.678. The large disparity suggests that NAFS fits the data better and predicts closer to the actual values. The larger MSE of ANN suggests larger prediction errors due to overfitting, underfitting, or the model’s inability to capture data patterns.
NAFS shows the best value of MAE, 0.256, followed by ANFIS, 0.405, and ANN, 1.686. MAE, which averages the absolute errors between predicted and actual values, highlights NAFS’s superiority over ANN and ANFIS. This shows that NAFS is reliable for precision applications where even minor errors can have serious implications. ANFIS also shows small value of MAE, which gives a difference of 0.149 from NAFS. Meanwhile, NAFS produces the lowest value of RMSE, 1.295, followed by ANFIS, 2.195, and ANN, 3.769. RMSE measures error by using the square root of the average of squared discrepancies between prediction and observation. Since it emphasizes greater errors, the statistic is useful. Thus, the lowest RMSE value of NAFS indicates its capacity to avoid huge prediction mistakes, ensuring excellent accuracy and suitability for forecasting and decision-making tasks.
Finally, MAPE, which is a percentage of actual data, can compare forecasting accuracy. ANN shows MAPE of 2.88% MAPE, whereas ANFIS and NAFS show MAPE of 0.51% and 0.33% respectively. All models have respectable percentage accuracy, but NAFS has a lower error rate, indicating that its predictions are more accurate, especially in circumstances when determining the proportion of mistakes to real values is crucial. The lower MSE, RMSE, and MAPE values of NAFS indicate that NAFS can predict values more accurately and consistently. It makes NAFS a good choice for many applications, such as prediction of a water quality index, especially for those applications which need precision and accuracy. While ANN has larger error rates across all metrics, it may be useful in situations when neural networks’ particular skills are needed, such as processing vast and complicated information. Based on this study, NAFS is better for tasks that need maximum precision. The 10-fold cross-validation yields consistent results, with an average RMSE of 1.295 and MSE of 1.678, reinforcing the generalization ability of the NAFS model beyond a single data split.
The actual WQI versus predicted WQI values for NAFS, ANFIS, and ANN are shown in Figure 9. The actual WQI values are shown using a green-color graph and the predicted WQI values are shown using an orange-color graph. The x-axis refers to data points from test data while y-axis refers to the WQI value. There are two types of graphs presented to clearly observe the difference between actual and predicted WQI values. The first graph is the first 300 data points from the test data, whereas the second graph is the overall test data that can be observed.
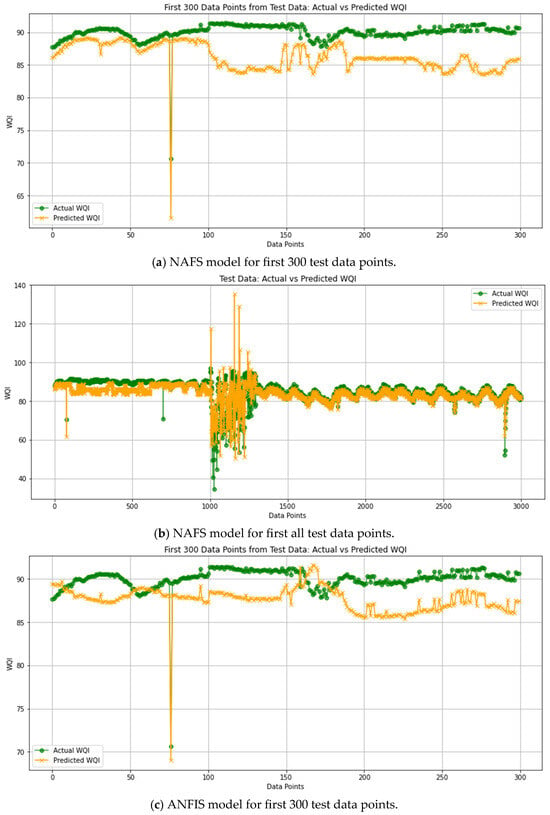
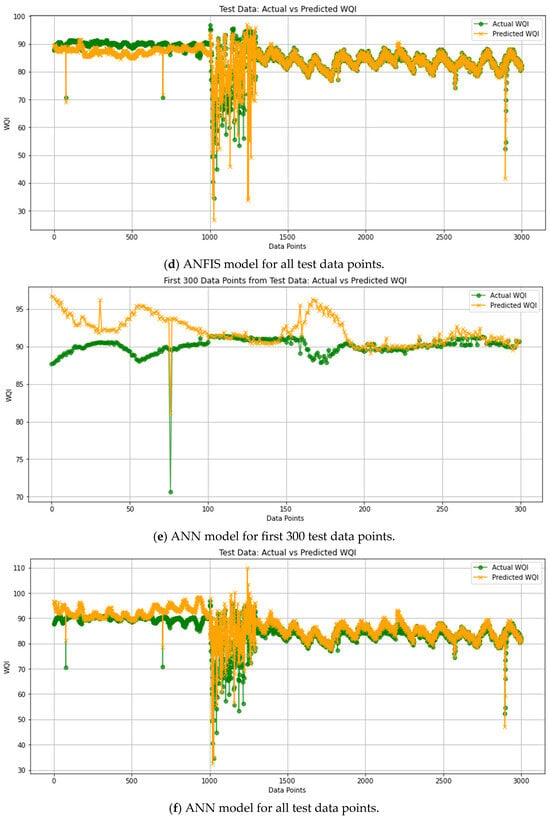
Figure 9.
Predicted and actual WQI graph for various models from (a) to (f), based on the test datasets comprising all rivers used in this study and MRANTI Lake.
By comparing performance trends of ANN, ANFIS, and NAFS (Figure 9), it is clear that NAFS has a distribution that is very close to ideal, with its projected values matching with the actual data points. Figure 9a shows a few notable prediction deviations, particularly one extreme outlier where the predicted WQI drops sharply. This discrepancy is primarily due to the presence of anomalous data, which can affect model output despite good training. Importantly, while visual inspection reveals some misalignments, the overall model performance remains strong, as confirmed by consistently low error metrics (MSE = 1.678, MAE = 0.257, R2 = 0.943) and 10-fold cross-validation. These values reflect that the model generalizes well across the full dataset, even if it may underperform in isolated data points or edge cases. This discrepancy highlights the importance of using multiple evaluation perspectives. While metrics like MSE and R2 provide an overall performance view, visual inspection helps identify localized prediction challenges. In our case, the high R2 (0.943) and low RMSE (1.295) reflect strong general model behavior but are partially influenced by the dominance of well-predicted points over rare but large errors.
Thus, the NAFS model demonstrates a deeper understanding of the dataset’s inherent complexity and achieves higher predictive accuracy. Compared to NAFS, the ANFIS model shows a decent fit but deviates slightly, indicating its ability to capture general data trends without achieving the same precision. Conversely, the ANN model underperforms, as reflected by its weaker alignment with actual data, highlighting limitations in capturing complex relationships. NAFS’s superior performance stems from its enhanced data handling and learning capabilities. Specifically, NAFS integrates fuzzy logic with adaptive neural network layers, enabling it to model non-linear, interactive effects between variables during training. This hybrid structure allows the model to dynamically adjust membership functions and minimize errors more effectively than ANFIS. As a result, NAFS yields lower MSE, MAE, and RMSE values, reflecting its improved ability to manage complex, non-linear datasets that are common in environmental systems.
Although standard correlation coefficients are used to provide a general comparison of predictive alignment, we acknowledge that these assume data normality. However, they are supplemented with error metrics that are more robust to non-normal distributions (MAE, RMSE) to ensure a more accurate assessment. Future work may consider non-parametric correlation measures to better align with data characteristics. In environmental management, even minor improvements in prediction accuracy can significantly impact decision-making. ANFIS may be useful in sensitive ecosystems where slight variations in water quality are critical. On the other hand, NAFS, with its generally reduced error metrics and stronger learning framework, is more suitable for broader applications under varying environmental conditions. Ultimately, model selection should be based on the specific needs and context of each application.
In applications that demand fast computational times, ANFIS’s simpler structure may make it preferable to NAFS, even if ANFIS has a higher MAE. Neural network excels in capturing high-dimensional interactions, which gives ANN an advantage to be applied in certain cases. Given its 30-days-ahead forecasting capability, the NAFS model offers practical value for early detection of water quality issues, allowing relevant authorities to take prompt action in areas such as pollution control and public health management.
Water quality evaluation based on Malaysia’s water parameter regulations is just one example of how NAFS prioritizes customizing the fuzzy logic component for unique applications. Achieving a better level of prediction precision, NAFS incorporates fuzzy logic that is specifically intended to understand and assess the water quality factors according to local requirements. In comparison to ANFIS’s more generic approach, NAFS can deal with the inherent uncertainties and variabilities in environmental data due to the usage of customized fuzzy sets and rules for Malaysian water standards. These significant enhancements essentially make NAFS better than ANFIS. The system improves its predicted accuracy faster due to the enhanced backward pass, which also raises its learning efficiency and helps it become more adaptive. Applying localized fuzzy logic to water standards makes it more practical and applicable in certain situations. Researchers and practitioners in the current field have a more effective tool in NAFS, which is an appealing alternative for applications that require detailed analysis and interpretation of environmental data. NAFS also introduces an optimized backpropagation mechanism that refines fuzzy rule updates for better prediction accuracy. Additionally, NAFS provides a more interpretable framework, particularly suited for handling localized water quality regulations such as Malaysia’s DOE-WQI calculation.
In addition to its technical strengths, the NAFS model carries significant social implications, especially within the Malaysian context. For example, in areas such as the Labu River, where local populations rely heavily on river systems for farming, domestic use, and small-scale fisheries, real-time and accurate forecasting tools are critical. By providing early-warning capabilities and supporting better water resource management, this model contributes to safeguarding public health and ensuring environmental sustainability. Furthermore, its interpretability makes it suitable for adoption by local authorities and stakeholders, enabling more informed decision-making and promoting environmental justice in vulnerable communities.
The significance of model adaptability in varied regulatory settings is highlighted by the disparities in model performance driven by regional water quality requirements. Thus, environmental management techniques on a global scale may need to retrain or modify models such as ANFIS and NAFS to fit local norms and circumstances. The results may have an impact on environmental policy, especially to establish criteria for evaluating water quality. Water quality rules may be revised or updated to reflect the most accurate conditions predicted by advanced modeling techniques.
4.3. Statistical Analysis Based on Principal Component Analysis (PCA) and Several Tests
Principal component analysis (PCA) reveals insightful details about the underlying structure of water quality parameters. Figure 10 shows the explained variance ratio of PCA, where the first principal component (PC1) captures approximately 54% of the total variance, and is significantly influenced by organic pollutants (COD, BOD, AN) and inversely by dissolved oxygen (DO). The second principal component (PC2), explaining around 17% of the variance, is primarily driven by soluble solids (SS) and pH. Collectively, the first two principal components explain over 72% of the dataset’s variability, confirming that fewer parameters can effectively encapsulate critical environmental dynamics influencing water quality.
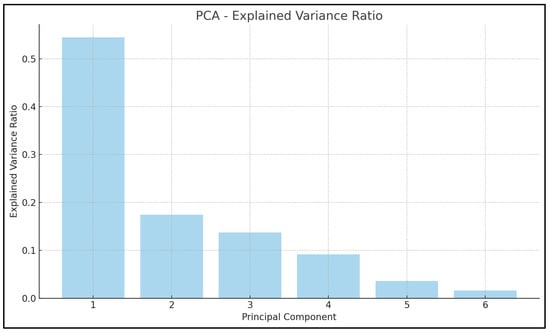
Figure 10.
Bar plot of the PCA explained variance ratio for six water quality parameters. The explained variance ratio represents the proportion of the dataset’s total variance captured by each principal component (PC). PC1 and PC2 account for the majority of the variance, indicating that most of the data’s informational content can be effectively represented in a lower-dimensional space.
Figure 11 displays the PCA feature importance heatmap, clearly illustrating the significant contributions of each water quality parameter to the principal components. The heatmap underscores the dominance of organic pollutants (COD, BOD, AN) and dissolved oxygen (DO) within PC1, reinforcing their critical role in the water quality assessment. These comprehensive statistical analyses validate the predictive strength and accuracy of the NAFS model, confirming its enhanced capability to manage complex, interdependent environmental data effectively, and reinforcing its significant improvements over conventional predictive models such as ANN and ANFIS.
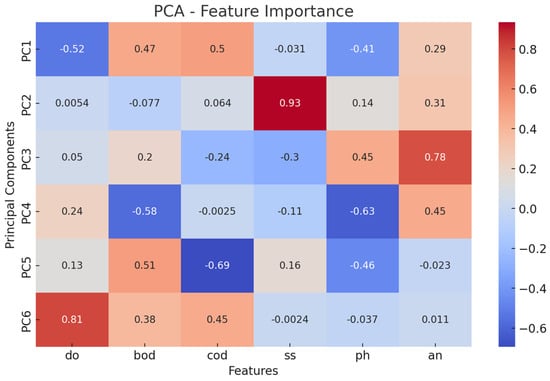
Figure 11.
Heatmap illustrating the feature importance of six water quality parameters based on PCA. The color intensity represents the loading values of each parameter across the principal components, indicating their contribution to the variance captured by each component. Parameters such as COD, AN, and BOD show high influence on the first few principal components, suggesting their dominant role in explaining the variability of the dataset.
The Breusch–Pagan test is employed to detect heteroscedasticity in the residual and fitted values, as shown in Figure 12. The result indicates that the p-value is significantly low (), and is well below the threshold of 0.05. The high value of the test statistic (0.431) indicates a significant presence of heteroscedasticity, where the variance of residuals varies across different levels of the fitted values. The plot exhibits a distinct trend in which the residuals disperse as the fitted values escalate. There are multiple data points that deviate significantly from the horizontal line at zero, suggesting the presence of outliers. The fan shape of the residuals indicates heteroscedasticity, where the variance of the residuals is not consistent across all levels of fitted values [46]. This suggests that the model may not accurately represent all the patterns in the data. Then, a modification of the target variable is necessary. The existence of outliers indicates the possible availability of data points that have significant impacts or do not conform well to the overall trend. These exceptional data points may exert an influence on the performance of the model. A Decision Tree Regressor is very suitable for modeling non-linear connections as it does not make any assumptions about linearity between the input characteristics and the target variable. The discovered patterns indicate that simpler models such as linear regression or regularized linear models (Ridge or Lasso) may face difficulties in accurately capturing these linkages.
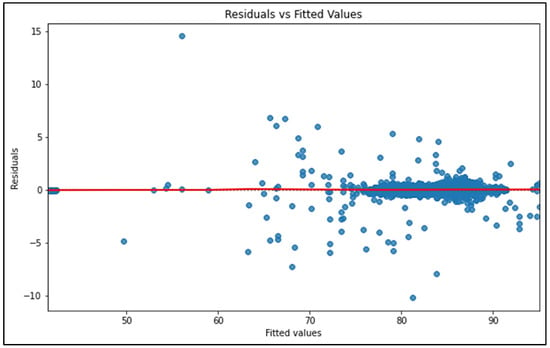
Figure 12.
Residual vs. fitted values plot for the NAFS model. This diagnostic plot evaluates the assumption of homoscedasticity in regression analysis [46]. The residuals are plotted against the predicted values to check for randomness. A random scatter of residuals along the horizontal axis suggests that the variance of the residuals is constant, indicating homoscedasticity.
The Shapiro–Wilk test employs a test statistic and a p-value indicator, while utilizing a Q-Q (quantile–quantile) plot for visualization purposes [47]. The p-value obtained from the Shapiro–Wilk test is 0.0, indicating a substantial deviation from the expected distribution at a significance level of 0.05. The test statistic (0.431) is significantly different from 1 (which represents a perfect normal distribution), further confirming this conclusion, as it suggests a substantial deviation from normalcy. The Q-Q plot (Figure 13) exhibits a conspicuous departure from the diagonal line, as the residuals have a distinct step-like pattern rather than conforming to the line. This pattern suggests that the residuals do not follow a normal distribution and exhibit a substantial deviation from normalcy. Non-normal residuals indicate that the model may not accurately represent the data or that the distribution of errors is not normal. The step pattern may suggest the presence of discrete or grouped data, or a large skew in the residuals. The Q-Q plot reveals substantial departures from normality, which can contravene the assumptions of linear regression models. The characteristic enhances their adaptability and makes them more appropriate for datasets that do not follow a normal distribution of errors, as indicated by examining the residuals. These violations of key linear regression assumptions confirm that the underlying data relationships are non-linear and complex. Consequently, this justifies the adoption of non-linear modeling techniques such as the proposed NAFS, which is capable of capturing intricate interactions between variables. Furthermore, the ability of NAFS to manage non-normal, heteroscedastic residual patterns reinforces its reliability and robustness for water quality prediction in real-world, noisy environments.
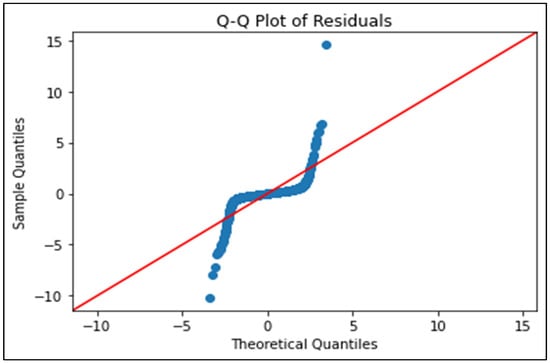
Figure 13.
Q-Q plot of residuals from the NAFS model. This plot assesses the normality assumption of residuals by comparing the observed residual quantiles with those expected from a normal distribution. If the residuals are normally distributed, the points should closely follow the red diagonal reference line. The red line in the plot represents the line of perfect agreement, showing where predicted values would exactly equal observed values.
5. Conclusions
The proposed NAFS model outperforms traditional models such as ANN and ANFIS in forecasting the water quality index (WQI), demonstrating superior predictive accuracy. Quantitative evaluation reveals that NAFS achieves the lowest mean squared error (MSE) of 1.678, root mean squared error (RMSE) of 1.295, mean absolute error (MAE) of 0.257, mean absolute percentage error (MAPE) of 0.33%, and correlation coefficient () of 0.9434. In contrast, ANN records higher error values (MSE: 14.208, RMSE: 3.769, MAE: 1.687, MAPE: 2.88%, : 0.822) while ANFIS shows moderate performance (MSE: 4.815, RMSE: 2.194, MAE: 0.405, MAPE: 0.51%, : 0.864). These results confirm that NAFS reduces MSE by 83.4% compared to ANN and by 53.4% compared to ANFIS. Furthermore, NAFS reduces MAPE by approximately 30% compared to ANN and over 66% compared to ANFIS, reinforcing its superior accuracy and consistency. NAFS also scores the highest R2 in comparison with ANFIS, ANN, and other current models. The results underscore NAFS’s strength in modeling both linear and non-linear interactions, while maintaining interpretability and computational efficiency. This makes NAFS well-suited for water quality forecasting tasks, especially in resource-constrained or real-time environments.
The NAFS model is clearly better than the ANN and ANFIS models for forecasting the water quality index. Improved accuracy and reliability in predictions are achieved by NAFS, with substantially lower MSE, MAE, RMSE, and MAPE. The performance metrics show that NAFS can model both linear and non-linear relationships in the data, and the actual versus anticipated WQI graphs reflect that. Even though ANN has more prediction mistakes, it might still be useful since the model can handle complicated datasets and the model can be fine-tuned even further. Neural network topologies are very useful for complicated datasets. Due to its adaptability, this model might be fine-tuned to include deeper network architectures, more sophisticated regularization methods, or different activation functions, all of which could lead to improvement. Making these changes can greatly enhance its predictive power and practicality. The statistical analysis also shows the reliability of NAFS to be used for forecasting water quality. Recent deep learning models have demonstrated strong performance in temporal water quality forecasting but often suffer from high complexity and limited interpretability. The proposed NAFS model offers a more interpretable and computationally efficient alternative tailored to localized water quality standards. Beyond its technical merits, the NAFS model holds significant social value. In regions like the Labu River and other Malaysian water bodies, where local populations depend on river systems for agriculture, domestic use, and fishing, an early-warning system for water quality is critical.
To overcome the shortcomings of ANN and ANFIS, researchers could look at deeper structures, regularization methods, or other activation functions to enhance the accuracy of its predictions. Further optimization of NAFS’s speed may be possible through experimentation with various kinds and quantities of membership functions. A bigger and more varied dataset would also aid both models, since it would improve their generalization skills. When working with data on the environment, which is intrinsically structured in a spatial and temporal manner, new insights may be gained by combining spatial and temporal data analysis. Finally, to improve the accuracy and dependability of WQI forecasts, it may be worth looking into hybrid models that integrate ANN and ANFIS.
Author Contributions
Conceptualization, W.Z.W.I. and A.L.; methodology, W.Z.W.I. and A.L.; software, A.L.; validation, W.Z.W.I. and N.A.A.A. formal analysis, A.L.; investigation, A.L.; resources, W.Z.W.I. and N.A.A.A.; writing—original draft preparation, A.L.; writing—review and editing, W.Z.W.I., N.A.A.A. and A.K.G.; supervision, W.Z.W.I. and N.A.A.A.; project administration, W.Z.W.I.; funding acquisition, W.Z.W.I. and N.A.A.A. All authors have read and agreed to the published version of the manuscript.
Funding
This research was funded by a grant from Ministry of Higher Education, Malaysia under Fundamental of Research Grant Scheme (FRGS/1/2024/WAS02/USIM/02/1) and Universiti Sains Islam Malaysia for USIM-MMU Matching grant (USIM/MG/MMU-PPKMT-ZDA/FKAB/SEPADAN-S/70822). The Article processing charge (APC) is funded by Multimedia University, Malaysia.
Institutional Review Board Statement
No review board statement is needed.
Informed Consent Statement
No consent is needed.
Data Availability Statement
The original contributions presented in the study are included in the article, further inquiries can be directed to the corresponding author.
Acknowledgments
We would like to acknowledge RedTone company for providing data from the MRANTI Lake and Department of Environment (DOE), Malaysia for providing data of rivers in Malaysia. We also would like to acknowledge Faculty of Engineering and Built Environment, Universiti Sains Islam Malaysia and Ministry of Higher Education, Malaysia for the funding and support.
Conflicts of Interest
The authors declare no conflicts of interest.
References
- Damseth, S.; Thakur, K.; Kumar, R.; Kumar, S.; Mahajan, D.; Kumari, H.; Sharma, D.; Sharma, A.K. Assessing the impacts of river bed mining on aquatic ecosystems: A critical review of effects on water quality and biodiversity. HydroResearch 2024, 7, 122–130. [Google Scholar] [CrossRef]
- Jan, F.; Min-Allah, N.; Düştegör, D. IoT Based Smart Water Quality Monitoring: Recent Techniques, Trends and Challenges for Domestic Applications. Water 2021, 13, 1729. [Google Scholar] [CrossRef]
- Pham, Q.B.; Mohammadpour, R.; Linh, N.T.T.; Mohajane, M.; Pourjasem, A.; Sammen, S.S.; Anh, D.T.; Nam, V.T. Application of soft computing to predict water quality in wetland. Environ. Sci. Pollut. Res. 2021, 28, 185–200. [Google Scholar] [CrossRef] [PubMed]
- Ibrahim, H.; Yaseen, Z.M.; Scholz, M.; Ali, M.; Gad, M.; Elsayed, S.; Khadr, M.; Hussein, H.; Ibrahim, H.H.; Eid, M.H.; et al. Evaluation and Prediction of Groundwater Quality for Irrigation Using an Integrated Water Quality Indices, Machine Learning Models and GIS Approaches: A Representative Case Study. Water 2023, 15, 694. [Google Scholar] [CrossRef]
- Elsabagh, M.A.; Emam, O.E.; Gafar, M.G.; Medhat, T. Handling uncertainty issue in software defect prediction utilizing a hybrid of ANFIS and turbulent flow of water optimization algorithm. Neural Comput. Appl. 2023, 36, 4583–4602. [Google Scholar] [CrossRef]
- Al-Adhaileh, M.H.; Alsaade, F.W. Modelling and Prediction of Water Quality by Using Artificial Intelligence. Sustainability 2021, 13, 4259. [Google Scholar] [CrossRef]
- Aminu, I.I. A novel approach to predict Water Quality Index using machine learning models: A review of the methods employed and future possibilities. Glob. J. Eng. Res. 2022, 13, 26–37. [Google Scholar] [CrossRef]
- Liang, J.; Liu, L. Prediction of Optimal Coagulant Dosage Based on FCM-ISSA-ANFIS Hybrid Model. Pol. J. Env. Stud. 2023, 32, 5171–5183. [Google Scholar] [CrossRef]
- Rathnayake, N.; Rathnayake, U.; Dang, T.L.; Hoshino, Y. Water level prediction using soft computing techniques: A case study in the Malwathu Oya, Sri Lanka. PLoS ONE 2023, 18, e0282847. [Google Scholar] [CrossRef]
- Shine, A.; Madhu, G. Water Quality Modelling of River Periyar Using Artificial Neural Network and Adaptive Neuro-Fuzzy Inference System. IOP Conf. Ser. Earth Environ. Sci. 2022, 1125, 012008. [Google Scholar] [CrossRef]
- Choden, Y.; Chokden, S.; Rabten, T.; Chhetri, N.; Aryan, K.R.; Abdouli, K.M.A. Performance assessment of data driven water models using water quality parameters of Wangchu river, Bhutan. SN Appl. Sci. 2022, 4, 290. [Google Scholar] [CrossRef]
- Dharani, D.L.; Jahnavi, S.; Yougender, Y.; Tanuja, M.; Yaswanth, M. Water Quality Prediction and Analysis Using Machine Learning. Int. J. Adv. Res. Sci. Commun. Technol. 2022, 45, 672–675. [Google Scholar] [CrossRef]
- Olasoji, S.O.; Oyewole, N.O.; Abiola, B.; Edokpayi, J.N. Water Quality Assessment of Surface and Groundwater Sources Using a Water Quality Index Method: A Case Study of a Peri-Urban Town in Southwest, Nigeria. Environments 2019, 6, 23. [Google Scholar] [CrossRef]
- Pappaka, R.K.; Nakkala, A.B.; Badapalli, P.K.; Gugulothu, S.; Anguluri, R.; Hasher, F.F.B.; Zhran, M. Machine Learning-Driven Groundwater Potential Zoning Using Geospatial Analytics and Random Forest in the Pandameru River Basin, South India. Sustainability 2025, 17, 3851. [Google Scholar] [CrossRef]
- Chen, J.; Wei, X.; Liu, Y.; Zhao, C.; Liu, Z.; Bao, Z. Deep Learning for Water Quality Prediction—A Case Study of the Huangyang Reservoir. Appl. Sci. 2024, 14, 8755. [Google Scholar] [CrossRef]
- Shahid, M.S.B.; Rifat, H.R.; Uddin, M.A.; Islam, M.M.; Mahmud, M.Z.; Sakib, M.K.H.; Roy, A. Hypertuning-Based Ensemble Machine Learning Approach for Real-Time Water Quality Monitoring and Prediction. Appl. Sci. 2024, 14, 8622. [Google Scholar] [CrossRef]
- Li, Q.; He, J.; Mu, D.; Liu, H.; Li, S. Dissolved Oxygen Modeling by a Bayesian-Optimized Explainable Artificial Intelligence Approach. Appl. Sci. 2025, 15, 1471. [Google Scholar] [CrossRef]
- Lokman, A.; Ismail, W.Z.W.; Aziz, N.A.A. A Review of Water Quality Forecasting and Classification Using Machine Learning Models and Statistical Analysis. Water 2025, 17, 2243. [Google Scholar] [CrossRef]
- Moeinzadeh, H.; Yong, K.T.; Withana, A. A critical analysis of parameter choices in water quality assessment. Water Res. 2024, 258, 121777. [Google Scholar] [CrossRef]
- Zhu, M.; Wang, J.; Yang, X.; Zhang, Y.; Zhang, L.; Ren, H.; Wu, B.; Ye, L. A review of the application of machine learning in water quality evaluation. Eco Environ. Health 2022, 1, 107–116. [Google Scholar] [CrossRef]
- City Population. Klang (District, Malaysia)—Population Statistics, Charts, Map and Location. Available online: https://www.citypopulation.de/en/malaysia/admin/selangor/1002__klang/ (accessed on 10 March 2024).
- Saif, M.A.M.; Hussin, N.; Husin, M.M.; Alwadain, A.; Chakraborty, A. Determinants of the Intention to Adopt Digital-Only Banks in Malaysia: The Extension of Environmental Concern. Sustainability 2022, 14, 11043. [Google Scholar] [CrossRef]
- DOE. National Water Quality Standards and Water Quality Index—Department of Environment. Available online: https://www.doe.gov.my/en/national-river-water-quality-standards-and-river-water-quality-index/ (accessed on 12 April 2024).
- Chia, S.L.; Chia, M.Y.; Koo, C.H.; Huang, Y.F. Integration of advanced optimization algorithms into least-square support vector machine (LSSVM) for water quality index prediction. Water Supply 2022, 22, 1951–1963. [Google Scholar] [CrossRef]
- Makinde, A. Optimizing Time Series Forecasting: A Comparative Study of Adam and Nesterov Accelerated Gradient on LSTM and GRU Networks Using Stock Market Data. September 2024. Available online: https://arxiv.org/pdf/2410.01843v1 (accessed on 13 May 2025).
- Meenakshi, P.; Ambiga, K. Prediction of the Water Quality Index Using ANFIS Modelling. J. Pharm. Negat. Results 2022, 13, 1289–1298. [Google Scholar] [CrossRef]
- Trach, R.; Trach, Y.; Kiersnowska, A.; Markiewicz, A.; Lendo-Siwicka, M.; Rusakov, K. A Study of Assessment and Prediction of Water Quality Index Using Fuzzy Logic and ANN Models. Sustainability 2022, 14, 5656. [Google Scholar] [CrossRef]
- Menapace, A.; Zanfei, A.; Righetti, M. Tuning ANN Hyperparameters for Forecasting Drinking Water Demand. Appl. Sci. 2021, 11, 4290. [Google Scholar] [CrossRef]
- Wu, J.; Wang, Z. A Hybrid Model for Water Quality Prediction Based on an Artificial Neural Network, Wavelet Transform, and Long Short-Term Memory. Water 2022, 14, 610. [Google Scholar] [CrossRef]
- Uddin, M.G.; Nash, S.; Diganta, M.T.M.; Rahman, A.; Olbert, A.I. Robust machine learning algorithms for predicting coastal water quality index. J. Environ. Manag. 2022, 321, 115923. [Google Scholar] [CrossRef] [PubMed]
- Patel, V.; Shukla, H.; Raval, A. Enhancing Botnet Detection With Machine Learning And Explainable AI: A Step Towards Trustworthy AI Security. Int. J. Multidiscip. Res. 2025, 7, 2. [Google Scholar] [CrossRef]
- Rajapriya, N.; Kawajiri, K. Deep Learning for GWP Prediction: A Framework Using PCA, Quantile Transformation, and Ensemble Modeling. November 2024. Available online: https://arxiv.org/pdf/2411.19124 (accessed on 15 August 2025).
- Michelucci, U. Correlation and Linear Regression. In Statistics for Scientists; Springer: Cham, Switzerland, 2025; pp. 137–144. [Google Scholar] [CrossRef]
- Lokman, A.; Ismail, W.Z.W.; Aziz, N.A.A. Water Quality Evaluation and Analysis by Integrating Statistical and Machine Learning Approaches. Algorithms 2025, 18, 494. [Google Scholar] [CrossRef]
- Kermani, M.A.M.A.; Mohammadi, N.; Ghasemi, H.; Sahebi, H.; Gilani, H. Enhancing Gas Distribution Network Resilience Utilizing a Mixed Social Network Analysis-Simulation Approach: Application of Artificial Intelligence. IEEE Access 2025, 13, 6924–6944. [Google Scholar] [CrossRef]
- Arachige, D.; Researcher, I. The Dissonance Between Statistical Theory and Practice: The Case of Central Limit Theorem and The Sample Size. Reserachgate 2025, 1, 1–14. [Google Scholar] [CrossRef]
- Mathew, S.; Idi, D.; Stephen, M. Modeling and Inference of Insurance Sector Development on Nigeria Economic Growth African Multidisciplinary Modeling and Inference of Insurance Sector Development on Nigeria Economic Growth. J. Sci. Artif. Intell. 2024, 1, 249–263. [Google Scholar] [CrossRef]
- Mikolajczyk, A.P.; Fortela, D.L.B.; Berry, J.C.; Chirdon, W.M.; Hernandez, R.A.; Gang, D.D.; Zappi, M.E. Evaluating the Suitability of Linear and Nonlinear Regression Approaches for the Langmuir Adsorption Model as Applied toward Biomass-Based Adsorbents: Testing Residuals and Assessing Model Validity. Langmuir 2024, 40, 20428–20442. [Google Scholar] [CrossRef]
- Baek, S.S.; Pyo, J.; Chun, J.A. Prediction of Water Level and Water Quality Using a CNN-LSTM Combined Deep Learning Approach. Water 2020, 12, 3399. [Google Scholar] [CrossRef]
- Rahul, G.D.; Harigovindan, V.P.; Rasheed, A.H.K.P.; Amrtha, B. Attention-driven LSTM and GRU deep learning techniques for precise water quality prediction in smart aquaculture. Aquac. Int. 2024, 32, 8455–8478. [Google Scholar] [CrossRef]
- Huang, T.; Jiang, Y.; Gan, R.; Wang, F. A novel water quality prediction model based on BiMKANsDformer. Environ. Sci. 2025, 11, 590–603. [Google Scholar] [CrossRef]
- Tejaswi, T.; Manoj, C.; Naidu, P.V.D.; Santhosh, T.; Akhil, P.V.S.; Ganesan, V. Nexus of Water Quality prediction by ANN. In Proceedings of the 2022 International Conference on Innovative Computing, Intelligent Communication and Smart Electrical Systems, Chennai, India, 15–16 July 2022. [Google Scholar] [CrossRef]
- Chen, H.; Yang, J.; Fu, X.; Zheng, Q.; Song, X.; Fu, Z.; Wang, J.; Liang, Y.; Yin, H.; Liu, Z.; et al. Water Quality Prediction Based on LSTM and Attention Mechanism: A Case Study of the Burnett River, Australia. Sustainability 2022, 14, 13231. [Google Scholar] [CrossRef]
- Fang, Z.; Wang, Y.; Peng, L.; Hong, H. Predicting flood susceptibility using LSTM neural networks. J. Hydrol. 2021, 594, 125734. [Google Scholar] [CrossRef]
- Anand, M.V.; Sohitha, C.; Saraswathi, G.N.; Lavanya, G.V. Water quality prediction using CNN. J. Phys. Conf. Ser. 2023, 2484, 012051. [Google Scholar] [CrossRef]
- Zhou, L.; Zou, H. Cross-Fitted Residual Regression for High-Dimensional Heteroscedasticity Pursuit. J. Am. Stat. Assoc. 2023, 118, 1056–1065. [Google Scholar] [CrossRef]
- de Souza, R.S.; Borges, E.M. Teaching Descriptive Statistics and Hypothesis Tests Measuring Water Density. J. Chem. Educ. 2023, 100, 4438–4448. [Google Scholar] [CrossRef]
Disclaimer/Publisher’s Note: The statements, opinions and data contained in all publications are solely those of the individual author(s) and contributor(s) and not of MDPI and/or the editor(s). MDPI and/or the editor(s) disclaim responsibility for any injury to people or property resulting from any ideas, methods, instructions or products referred to in the content. |
© 2025 by the authors. Licensee MDPI, Basel, Switzerland. This article is an open access article distributed under the terms and conditions of the Creative Commons Attribution (CC BY) license (https://creativecommons.org/licenses/by/4.0/).