Abstract
This article presents the results of single-station microtremor measurements conducted in Diyarbakır Province. To develop shear wave velocity profiles and determine dynamic soil parameters for the region, measurements were carried out at eight strong-motion accelerometer stations located within the provincial boundaries and operated by the Disaster and Emergency Management Authority (AFAD). Data were recorded in three components over a 30 min period. For analysis, the Rayleigh wave ellipticity method was employed in combination with inversion techniques, along with the Horizontal-to-Vertical (H/V) Spectral Ratio method. These analyses yielded shear wave velocity profiles for each station, from which Vs values, predominant ground frequency, and amplification factors were obtained. Based on the average shear wave velocity in the upper 30 m (Vs30), ground classifications were made. In the final stage, earthquake acceleration records were analyzed and compared with the microtremor results. The findings indicate that the predominant frequency values range from 3.64 to 16.61 Hz, while ground amplification values vary between 1.20 and 2.85. The lowest Vs30 value was 555 m/s, and the highest damage vulnerability index (Kg), calculated from the H/V analysis, was 1.90.
1. Introduction
Türkiye is an earthquake-prone country, shaped by the following three main tectonic systems: the East Anatolian Fault, the North Anatolian Fault, and the Aegean Graben systems. Although Diyarbakır Province—the study area—does not lie on an active fault line, it is affected by earthquakes originating from the East Anatolian Fault Zone. The Eastern Anatolian Fault tends to move more slowly than the Northern Anatolian Fault. For this reason, the recurrence periods of Eastern Anatolian earthquakes are quite long. For example, ref. [] determined the period of 5.7M earthquakes as 12, 6.2M earthquakes as 43 years, 6.7M earthquakes as 152 years, and 7.2M earthquakes as 533 years. The most important earthquakes affecting Diyarbakır are the 1866 Kulp (6.8M) and 1975 Lice (Mw6.8) earthquakes. Apart from this, historical and instrumental earthquakes that affected Diyarbakır, just like the 6 February 2023 earthquakes, can be listed as the 1513 Pazarcık earthquake (7.4M), the 1822 Kahramanmaraş earthquake (7.5M), the 1866 Karlıova earthquake (7.2M), the 1872 Antakya earthquake (7.2M), the 1874 Gezin earthquake (M = 7.1), the 1875 Sivrice earthquake (6.8M), the 1893 Çelikhan earthquake (7.3M), the 1905 Pötürge earthquake (6.8M), the 1971 Bingöl earthquake (6.8M), the 1977 Palu earthquake (5.2M), the 1986 Sürgü earthquakes (5.8M), and the 1998 Ceyhan earthquake (5.9M).
A recent example of this is the Kahramanmaraş earthquakes (7.7M and 7.6M) of 6 February 2023, which impacted large parts of Türkiye and also affected the northern border of Syria [,,,,,,,].
To reduce the impact of earthquakes or to prepare for potential scenarios, it is crucial to accurately determine soil conditions. In this context, determining shear wave velocity is essential for identifying layer thicknesses and local soil classifications. Moreover, understanding the earthquake–soil–structure interaction requires knowledge of the soil’s dynamic parameters.
Soil predominant frequency is a reliable indicator for estimating sediment thickness and plays a vital role in microzonation studies. Consequently, the Horizontal-to-Vertical Spectral Ratio (H/V) method is widely used. Lermo and Chavez-Garcia [] conducted microtremor measurements on soft soils and analyzed them using the Nakamura method, concluding that it is suitable for determining the soil’s predominant period. Siyahi and Selcuk [] used microtremor measurements from 220 points in Adapazarı to determine the soil’s predominant period and amplification values. Över et al. [] divided the Antakya district into five microzones based on microtremor measurements at 69 points and ReMi measurements at 15 points. Buyuksarac et al. [] conducted microtremor measurements at 114 locations in Sivas and identified four different seismic microzones using the H/V ratio method. In Bursa, Çoban [] conducted soil classification based on the dominant period using the H/V Spectral Ratio method was carried out using the H/V Spectral Ratio method, evaluating 205 acceleration records from 82 earthquakes recorded at 41 stations to assess earthquake damage risk. Karslı and Bayrak [] determined Vs30, the damage potential index, site dominant period, and amplification values through single station microtremor measurements for the Yakutiye district of Erzurum, providing insights into potential earthquake scenarios. The Eastern Anatolian Fault Zone, which affects Diyarbakır, is characterized by slower slip rates compared to the Northern Anatolian Fault. Consequently, earthquake recurrence intervals are relatively long. According to Sayıl and Çoban (2017) [], recurrence periods are approximately 12 years for M5.7 earthquakes, 43 years for M6.2, 152 years for M6.7, and 533 years for M7.2 events. Historical earthquakes that have impacted Diyarbakır include the 1866 Kulp (M6.8) and 1975 Lice (Mw6.8) earthquakes, among others []. Notable regional seismic events such as the 1513 Pazarcık earthquake (M7.4) and the 1822 Kahramanmaraş earthquake (M7.5) further underscore the seismic risk of this area. These data emphasize the urgency of assessing local site effects for seismic hazard mitigation.
One of the methods used to obtain shear wave velocity (Vs) is the microtremor method, a passive seismic technique. Although this method does not directly measure Vs, it estimates it through inversion. It is based on Nakamura’s [] Horizontal-to-Vertical Spectral Ratio (H/V) method, which utilizes the ellipticity properties of Rayleigh waves for the inversion process. Ellipticity in Rayleigh waves refers to the elliptical and retrograde particle motion observed as these waves propagate through a homogeneous, semi-infinite medium. Such waves arise from the vertical components of primary (P) and secondary (S) seismic waves []. Researchers around the world have applied this technique to various regions. For example, Shabani et al. [] used Rayleigh wave inversion to obtain Vs velocity profiles in Tehran, Iran. Rosa-Cintas et al. [] applied the Rayleigh wave ellipticity (RWE) method, based on the H/V technique, in different parts of Malaga. Similarly, Anggono et al. [] employed the RWE inversion method to determine the shear wave velocity structure at an earthquake recording station in Tangerang, Indonesia. A microzonation study was conducted in the city of Oued-Fodda, located in northern Algeria, where 102 sites were examined []. In this study, the RWE inversion method was used to derive the 1-D shear wave velocity structure of the soil. Pamuk and Özer [] obtained the S-wave velocity structure using RWE from records at three stations located in Erzurum. Additionally, Büyüksaraç et al. [] applied the RWE method in Çanakkale (Türkiye) to estimate bedrock depth.
This study investigates the soil conditions at eight strong-motion recording stations installed by the Disaster and Emergency Management Authority (AFAD) [] in the districts of Bağlar, Sur, Çermik, Ergani, Lice, Dicle, and Kulp within Diyarbakır, Türkiye. Microtremor measurements were conducted at each station site to characterize the shear wave velocity structure, predominant site frequency, and site amplification. The acquired data was processed using the Geopsy (Geopsy versions 2.4.0 and 3.4.2) software [,,,], and an inversion analysis based on the RWE was performed within the framework of the H/V method. As a result, Vs profiles were obtained for each site. Site classification was subsequently carried out based on the average shear wave velocity in the upper 30 m (Vs30), a widely used parameter in seismic site characterization. Furthermore, both unfiltered and high-pass filtered data were analyzed using the H/V method to determine the predominant frequency and site amplification. Based on the analysis results obtained using a high-pass filter at 1.0 Hz, the vulnerability index was calculated. Through this approach, the dynamic characteristics of the station sites were comprehensively evaluated. Measurements were recorded in velocity units along three components: north–south, east–west, and vertical. Data acquisition was conducted using a Guralp-CMG-6TD-0001 type seismometer, along with auxiliary components such as a battery, computer system, and connection cables. The recordings were saved in GCF (Güralp Compressed Format) using the Scream software (version 4.6). The seismometer has a sensitivity of 2 × 1000 V/m/s and an internal memory capacity of 8 GB. The duration of each measurement was set to 30 min.
Geological Conditions
The Southeastern Anatolia Region of Türkiye, together with its surrounding areas, is characterized by intense seismic activity, making it one of the most tectonically dynamic zones in the country. This seismicity arises from the complex interactions of major tectonic plates and the presence of several prominent fault systems. Among the most influential seismotectonic structures in this region are the Southeastern Anatolian Convergence (SAC) and the East Anatolian Fault Zone (EAFZ), both of which have been extensively investigated for their earthquake-generating potential []. Although the city center of Diyarbakır does not frequently experience high-magnitude earthquakes, it remains vulnerable to seismic hazards due to its proximity to active fault zones. Earthquakes originating in surrounding areas can produce far-reaching impacts, including strong ground shaking and secondary effects such as landslides and liquefaction—particularly in geologically vulnerable or poorly consolidated formations.
The city and its surrounding districts are situated on the Arabian Plate, which is moving northward under the tectonic pressure exerted by the African Plate []. This northward motion leads to the subduction of the Arabian Plate beneath the Eurasian Plate, a tectonic interaction that has driven significant orogenic (mountain-forming) and seismic activity throughout geological history [,].
The northward movement of the Arabian Plate has played a pivotal role in shaping the regional geology and seismotectonics of Southeastern Anatolia. As the plate converges with, and subducts beneath, the Eurasian Plate, stress accumulates along major fault systems, including the Bitlis–Zagros Orogenic Belt, the East Anatolian Fault Zone, and the North Anatolian Fault Zone. These tectonic structures are known to generate significant earthquakes, posing substantial hazards to the infrastructure, population, and cultural heritage of Diyarbakır and its surrounding settlements. A historical example is the 1975 Lice earthquake, which occurred along the Southeastern Anatolian Convergence. This devastating event caused considerable structural damage and loss of life in the Diyarbakır region, underscoring the persistent seismic threat [].
Geologically, Diyarbakır and its surroundings exhibit a complex and varied lithological composition, influencing seismic behavior, soil mechanics, and land-use planning. The region can be divided into four primary lithological zones oriented from north to south. In the northernmost part lies the Bitlis Massif, consisting of ancient metamorphic rock units. These rocks, formed under intense heat and pressure over millions of years, constitute the structural backbone of the orogenic belt.
Immediately to the southeast is the Overlay Zone, comprising ultramafic sections—rock types derived from the Earth’s mantle and typically associated with tectonic thrusting and obduction processes. Further south lies the Arabian Platform, dominated by extensive sedimentary rock units, including limestone, sandstone, and shale, deposited in both marine and terrestrial environments over geological time. Embedded within the platform is the Karadağ volcanic structure, a prominent basaltic shield volcano that has played a key role in the region’s geomorphological evolution [].
Geographically, the city of Diyarbakır lies between the following two major structural features: the Bitlis Suture Zone to the north and the Mardin Uplift to the south. This location creates a transitional zone encompassing multiple rock types and tectonic elements. The surrounding terrain is largely composed of carbonate rocks from the Eocene to Miocene epochs, contributing to the region’s karstic features and hydrogeological behavior.
Diyarbakır’s districts also display distinct geological characteristics. The northern districts—Hazro, Lice, and Hani—are dominated by Mesozoic-aged units, representing older geological formations predating the main Alpine orogeny. These formations include limestones, dolomites, and other sedimentary rocks formed in ancient marine environments. In contrast, the southern parts of the region, particularly along the Bitlis Suture Zone, consist of autochthonous units—rock formations that have remained largely undisturbed in their original positions.
Additionally, areas such as Çermik, Dicle, Ergani, Lice, and Kulp feature allochthonous masses—rock bodies transported from their original locations by tectonic forces, often through thrust faulting or nappe formation. These displaced units, which may comprise complex mélanges or ophiolitic sequences, are significant from both geotechnical and seismic risk perspectives []. Such geological heterogeneity necessitates careful consideration in urban planning, engineering design, and disaster preparedness strategies in Diyarbakır and its environs.
Overall, the complex interplay of tectonic activity, plate convergence, and diverse geological formations makes Diyarbakır a region of significant scientific interest and critical importance for seismic risk management. Continued research and seismic monitoring are essential for enhancing resilience against future earthquakes and for advancing the understanding of the region’s evolving geodynamic framework (Figure 1).
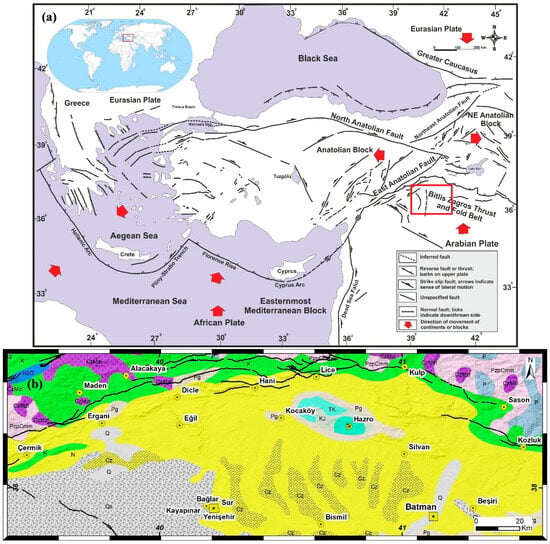
Figure 1.
(a) Fault map of Turkey; (b) Geological map of Diyarbakir Province []. Explanation of the legend in (b): Pg: Paleogene, N: Neogene, Cz: Undivided Cenozoic, CzMzi: Cenozoic–Mesozoic intrusive rocks, K: Cretaceous, PzpCmm: Palaeozoic rocks, Kj: Cretaceous–Jurassic, TK: Tertiary–Cretaceous, P: Permian.
2. Materials and Methods
2.1. Strong Ground Motion Stations
Strong ground motion stations play a vital role in monitoring seismic activity throughout Türkiye. These stations are operated and maintained by the Disaster and Emergency Management Authority (AFAD), the official government agency responsible for coordinating disaster response and preparedness, including earthquake monitoring. Upon occurrence of an earthquake, seismic data—specifically ground acceleration measurements—are automatically recorded by these stations and transmitted in real time to AFAD’s central database. This information is publicly accessible via AFAD’s official website, https://www.geopsy.org/ (accessed on 9 August 2025) allowing users to view recent seismic events and related data.
The establishment of earthquake acceleration recording stations in Türkiye dates back to 1973. Since then, the network has expanded significantly in terms of both coverage and technological capacity. Currently, more than 950 acceleration recording stations are strategically distributed across the country. These stations are essential for accurately measuring the intensity and characteristics of ground shaking during seismic events, facilitating the assessment of earthquake hazards, the updating of building codes, and the guidance of emergency response strategies.
Despite the extensive national network, the distribution of strong ground motion stations is not uniform across all regions. Within the provincial boundaries of Diyarbakır, for instance, only seven districts are currently equipped with acceleration recording stations. This limited coverage may pose challenges in capturing detailed seismic data for the entire province, particularly in rural or less-developed areas. Figure 2 illustrates the geographic distribution of these stations within Diyarbakır, highlighting areas with monitoring coverage and those that may require additional instrumentation to improve seismic risk assessment and mitigation efforts.
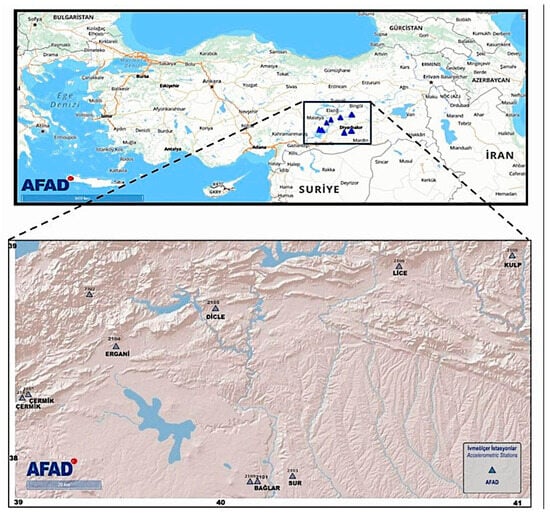
Figure 2.
Distribution of accelerometer stations in Diyarbakir [].
Historical records and seismic studies indicate that earthquakes affecting the Diyarbakır region predominantly originate from the Southeastern Anatolian Convergence (SAC) Zone. This tectonically active area is characterized by the interaction between the Arabian and Anatolian plates, resulting in significant crustal deformation and seismicity. Understanding the dynamics of this convergence zone is crucial for evaluating regional earthquake risk and implementing effective mitigation strategies.
The stations have been strategically located considering this tectonic context. Specifically, the Çermik (stations 2102 and 2107), Ergani (2104), Dicle (2105), Lice (2106), and Kulp (2108) strong ground motion stations are positioned along or near the boundaries of the SAC Zone. This deliberate placement enhances the capacity to monitor seismic events associated with active fault systems in the region and provides valuable data for both real-time analysis and long-term seismic hazard assessment.
Notably, there are two stations in the Çermik district. The location of the first station was changed due to urban noise interference. Consequently, this study considers data from both locations to incorporate comprehensive seismic information from the district.
2.2. Determination of Horizontal-to-Vertical (H/V) Spectral Ratio (Nakamura Method)
The Nakamura method, proposed by Nakamura [], is based on seismometer recordings transformed from the time domain to the frequency domain. This method assumes that microtremor waves primarily consist of Rayleigh waves generated solely by surface sources. It further posits that the horizontal components of these waves are influenced by ground layers and responsible for ground amplification, whereas the vertical components are largely unaffected by subsurface structures []. The Horizontal-to-Vertical (H/V) spectral analysis involves calculating the ratio of horizontal to vertical components of seismic noise, providing the ground’s transfer function and several dynamic parameters essential for understanding site response characteristics.
In this study, microtremor measurements at each station were first transformed from the time domain to the frequency domain using Geopsy software (versions 2.4.0 and 3.4.2), an open-source tool developed under the EU-supported SESAME project (Project Number EVG1-CT-2000-00026, FP5 program). Using two versions enabled cross-validation of inversion results to ensure robustness.
Initially, no filters were applied during the first stage of analysis. A window length of 100 s with 5% overlap and a cosine window function was employed following trend corrections. This window length defines the minimum observable frequency (1/T) in the spectral curve. To reduce spectral noise and improve clarity, the Konno–Ohmachi frequency-dependent smoothing function with a smoothing factor (b) of 40 was applied, with the analysis frequency range set between 0.1 and 20 Hz.
However, significant spectral spreading at low frequencies was observed in eight measurement points, undermining result reliability. To address this, a second analysis stage employed a high-pass filter. In Diyarbakır, loose soil layers are thin and rapidly transition to bedrock (Figure 1b), limiting surface wave propagation—corroborated by Vs values. Therefore, data were high-pass filtered at 1.0 Hz to eliminate low-frequency environmental and site-specific effects. This filtering did not cause significant data loss and prevented misinterpretations, such as those in İmamoğlu’s [] study, where dominant low-frequency vibrations led to erroneous conclusions about thick, soft layers in the study area.
The high-pass filter also enhanced the accuracy of soil classification and site resonance frequency identification [,,,] by minimizing low-frequency scattering. In this stage, frequencies above 1.0 Hz were primarily examined, with particular attention to 0.6, 0.7, and 0.8 Hz. Additionally, the STA/LTA algorithm with an anti-trigger option [] was used to detect sudden changes in recordings. STA and LTA window lengths were set to 1.00 and 30 s, respectively. This phase utilized a 50 s window length, a smoothing factor (b) of 20, and a frequency range from 1.0 to 20 Hz.
Two different versions of Geopsy software were employed: version 3.4.2 was used for initial data processing steps such as filtering and detrending, while version 2.4.0 was preferred for the inversion process involving ellipticity analysis with the Dinver plugin. This choice was based on module compatibility and software stability. Cross-validation ensured consistency and comparability between results from both versions.
2.3. Inversion Using H/V and Rayleigh Wave Ellipticity Analysis
Ambient seismic vibrations arise from natural and anthropogenic sources, typically occurring within a period range of 0.1 to over 5 s. This range also encompasses longer periods observed in microtremor measurements, especially at sites with thick soil deposits. Such vibrations are widely used in geophysical investigations to assess subsurface conditions by analyzing ambient seismic noise [].
One of the most commonly applied analytical techniques for microtremor data is the Horizontal-to-Vertical Spectral Ratio (H/V) method. For calculating H/V Spectral Ratios, stationary windows dominated by surface waves—mainly Rayleigh waves—are selected from ambient noise records. Following trend removal, a 100 s window length with 5% overlap and a cosine taper function was applied, in accordance with SESAME project guidelines (2004). This method generates H/V curves that provide insights into key site characteristics, including the dominant ground frequency and amplification factor. The peak amplitude on H/V curves corresponds to the ellipticity of Rayleigh waves—an important parameter linked to their elliptical particle motion [].
The shear wave velocity (Vs) structure of the subsurface varies with depth due to distinct geological layers such as sedimentary deposits and bedrock. As Rayleigh waves propagate through these layers, their ellipticity is influenced by the average seismic velocity of each layer []. Consequently, several studies have combined Rayleigh wave ellipticity with inversion methods to estimate shear wave velocity profiles [,,].
Rayleigh waves are a type of surface wave formed by the combination of vertical P-wave and horizontal S-wave motions. In a homogeneous, semi-infinite medium, these waves propagate in elliptical orbits opposite to the direction of travel. Their ellipticity varies in layered media, shifting between the surface and bedrock due to the dispersive nature of wave propagation in such environments [,]. The H/V ratio varies with frequency, reaching its maximum at the dominant frequency and decreasing at higher frequencies. This characteristic makes the H/V method an effective tool for determining a site’s vs. structure [,,].
Accurate estimation of shear wave velocity profiles based on Rayleigh wave ellipticity and frequency-dependent behavior is particularly valuable in seismic microzonation and shallow geotechnical studies. This approach enables assessment of deeper soil layers and provides more reliable results compared to traditional methods [,,,]. Key parameters derived from this method include Vs30—the average shear wave velocity of the upper 30 m—and the site’s dominant frequency. These parameters form the foundation for earthquake-resistant design and other geotechnical applications [].
Two different versions of the Geopsy software were used sequentially during data processing. Version 3.4.2 was employed for basic data processing tasks such as filtering and detrending of microtremor data. Version 2.4.0 was necessary for performing inversion via ellipticity analysis. Geopsy software evolves with user requirements, which explains the use of different versions for distinct processing steps.
Initially, microtremor records were loaded into Geopsy version 3.4.2. After trend corrections, filtering was applied using a band-pass filter ranging from 0.50 to 20.00 Hz with a Butterworth filter to refine the data across frequency bands. Subsequently, the filtered data were processed in Geopsy version 2.4.0 using the Max2Curve tool and Dinver plugin. Within Dinver, the ellipticity curve option was selected, and by inputting appropriate model parameters, shear wave velocity profiles of the subsurface were generated.
For Rayleigh waves to exhibit dispersion, propagation must occur in a layered medium. Ellipticity thus varies between ground surface and bedrock levels [,]. This analysis strategy, combining two software versions and the Dinver plugin, allowed robust shear wave velocity estimation.
2.4. Vulnerability Index (Kg) and Elasticity Behavior
The weight factor is calculated to assess the seismic risk level within the work areas prior to an earthquake. Based on Nakamura’s studies [,], an equation was proposed (Equation (1)) that incorporates the soil amplification factor and the dominant frequency. This equation has since been applied as a method of evaluation in various study areas [,,,,].
In this equation, A0 represents the soil amplification factor, while fo denotes the dominant frequency of the soil. Kg value is used to classify seismic risk levels:
- 0–5: Low risk
- 6–10: Medium risk
- 11–20: High risk
- Above 20: Very high damage potential [].
Shear deformation is also evaluated as part of seismic hazard assessments. It is calculated based on the maximum acceleration and the damage potential index occurring on the bedrock [,,]. Nakamura [] proposed the following equation for shear deformation (Table 1):
In this equation:
- γe is the shear deformation;
- Kg is the damage potential index;
- amax is the maximum acceleration generated by the earthquake at the station;
- Vb represents the shear wave velocity;
- e is a constant coefficient, typically taken as 0.6 [].
amax values were taken from surface acceleration records during the Kahramanmaraş earthquakes (Table 2). In Equation (2), Vb represents the average shear wave velocity for near-surface layers, as provided in Table 3. This is not the seismic bedrock velocity due to a lack of borehole or deep downhole data.The resulting strain estimation reflects shallow site conditions and should be interpreted accordingly.
If the shear wave velocity value in Equation (2) is accepted as the average seismic foundation value of 600 m/s, 1/(π2vb) = 1.69 × 10⁻⁶ (s/cm) is obtained and if e = 0.6 is put, Kg(e) ≅ Ag2/Fg and the effective strain can be estimated by multiplying the Kg(e) value with the maximum acceleration of the basement ground in cm/s2 []. For the Vb value, the average shear wave velocity presented in was used for amax, the maximum acceleration values recorded at stations during the Kahramanmaraş earthquakes were considered.
As the shear stress increases, the soil behavior changes, which, in turn, affects the degree of damage. Ishihara [] investigated the elastic and plastic responses of soil based on the shear deformation value. When shear deformation increases, the elastic characteristics of the soil diminish, leading to a higher likelihood of structural or geotechnical damage [,]. In this study, shear deformation values were calculated using the maximum acceleration values recorded at ground motion stations during the Pazarcık and Elbistan earthquakes. The results are presented in Table 1, where the dynamic behavior of the soil is interpreted according to predefined limit states.

Table 1.
Soil condition is based on shear deformation value [,].
Table 1.
Soil condition is based on shear deformation value [,].
| Size of Strain | 10−6 | 10−5 | 10−4 | 10−3 | 10−2 | 10−1 |
|---|---|---|---|---|---|---|
| Phenomena | Vibration | Crack, Settlement | Landslide, Soil compaction, Liquefaction | |||
| Dynamic properties | Elasticity | Elasto-plasticity | Collapse | |||

Table 2.
The impact of the Kahramanmaraş earthquakes on the province of Diyarbakır (the 6 February 2023 Kahramanmaraş earthquakes).
Table 2.
The impact of the Kahramanmaraş earthquakes on the province of Diyarbakır (the 6 February 2023 Kahramanmaraş earthquakes).
| Station Number | District Location | Pazarcık Earthquake | Elbistan Earthquake | Damage Status | ||||||
|---|---|---|---|---|---|---|---|---|---|---|
| Distance to Fault (Repi) | PGA (cm/s2) | Distance to Fault (Repi) | PGA (cm/s2) | Destroyed | To be Demolished Immediately | Badly Damaged | Moderately Damaged | Slightly Damaged | ||
| 2101 | Baglar | 287.3533 | 77.08 | 260.2429 | 21.59 | 7 | 13 | 571 | 810 | 8201 |
| 2102 | Çermik | The station was removed in 2017 | ||||||||
| 2103 | Sur | 297.0747 | 53.74 | 269.7384 | 23.82 | 1 | - | 599 | 345 | 4980 |
| 2104 | Ergani | 262.2236 | 116.46 | 221.1311 | 21.22 | 2 | - | 416 | 175 | 5071 |
| 2105 | Dicle | No earthquake record is available. | - | - | 205 | 152 | 2516 | |||
| 2106 | Lice | 342.159 | 72.30 | 300.347 | 8.27 | 11 | 1 | 444 | 276 | 2485 |
| 2107 | Çermik | 234.9221 | 112.26 | 196.4765 | 47.61 | 17 | 18 | 433 | 264 | 2506 |
| 2108 | Kulp | 372.13 | 20.66 | 331.38 | 7.95 | 1 | - | 623 | 145 | 3129 |

Table 3.
Vs30 velocity values and soil classification.
Table 3.
Vs30 velocity values and soil classification.
| Station Code | Vs30 (m/s) | TBDY (2018) | EUROCODE 8 | NEHRP (2003) | Geological Status |
|---|---|---|---|---|---|
| 2101 | 600 | ZC | B | C | Terrestrial Clastics |
| 2102 | 765 | ZB | B | B | Yellowish clayey marl |
| 2103 | 635 | ZC | B | C | Unsorted Terrestrial Clastic Rocks |
| 2104 | 750 | ZC | B | C | Clastics and Carbonates |
| 2105 | 675 | ZC | B | C | Clastics and Carbonates |
| 2106 | 730 | ZC | B | C | Clastics and Carbonates |
| 2107 | 555 | ZC | B | C | Yellowish clayey marl |
| 2108 | 610 | ZC | B | C | Yellowish clayey marl |
3. Impact of the Kahramanmaras Earthquakes on Diyarbakır
On 6 February 2023, at 04:17 local time, an earthquake of Mw = 7.7 magnitude occurred, centered in Pazarcık, Kahramanmaras. Nine hours later, at 13:24, a second earthquake of Mw = 7.6 magnitude struck with its epicenter in Elbistan, within the same province. These earthquakes, which occurred on the East Anatolian Fault System, had a significant impact on 11 provinces, including Diyarbakir. According to statements by the Disaster and Emergency Management Authority [], over 50,000 fatalities and more than 500,000 structural damages were reported. The Kahramanmaras earthquakes were recorded by over a hundred seismic stations, including those located in Diyarbakir. The largest ground motions recorded in Diyarbakir due to these earthquakes [], and the resulting damage [] are detailed in Table 2. Diyarbakır was among the cities severely affected by the earthquake, recording extensive structural damage. According to data from the Ministry of Environment and Urbanization (2023) [], the city reported 49 completely collapsed buildings, 62 buildings requiring immediate demolition, 6105 severely damaged buildings, 3747 moderately damaged buildings, and 54,721 slightly damaged buildings. The damage distribution at the locations of the seismic stations is illustrated in Figure 3. The significant levels of structural damage observed correlate with the acceleration recorded at these stations, highlighting the intensity of ground motion experienced during the event.
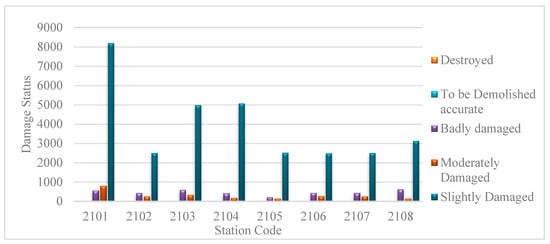
Figure 3.
Damage status in Diyarbakir.
Figure 4 and Figure 5 present the images of structures that collapsed or sustained severe damage during the Kahramanmaraş earthquakes. In Figure 4a–c, Galeria Business Center in Yenişehir district, Serin2 Apartment and Yoldaş Apartment in Bağlar district are examples of buildings that collapsed as a result of earthquakes, respectively. The images in Figure 5 belong to a heavily damaged building in the Prison district of the Bağlar district.
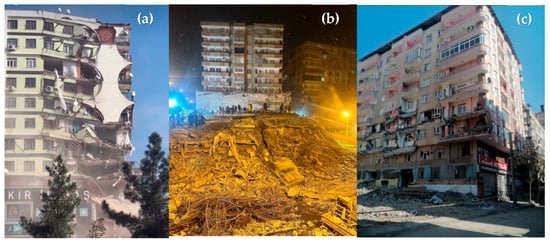
Figure 4.
Structures that collapsed during the mainshock on 6 February 2023: (a) Galeria Business Center (Yenişehir district), (b) Serin-2 Apartment (Bağlar district), and (c) Yoldaş Apartment (Bağlar district).
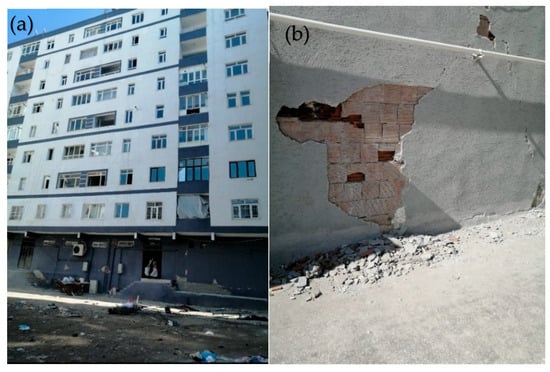
Figure 5.
A building that sustained severe structural damage as a result of seismic activity: Photographs (a,b) show the Güçlü Apartment in the Bağlar district.
4. Evaluation of Earthquake Acceleration Station Records
Seismic records from 10 earthquakes with moment magnitudes greater than 4.0 (M ≥ 4.0) were analyzed to assess ground response and local site effects. The raw acceleration data from these events were processed using Geopsy software, a widely utilized tool for ambient vibration and seismic data analysis.
During the initial phase of analysis, no filters were applied to preserve the integrity and original characteristics of the seismic signals. A window length of 100 s was initially selected for computing the Horizontal-to-Vertical (H/V) Spectral Ratio; however, this configuration did not produce reliable H/V graphs, likely due to signal instability or noise interference over the extended window duration. To improve the clarity and reliability of the spectral results, the window length was reduced to 50 s, and a cosine window function was applied. The frequency analysis range was refined and limited to 1–20 Hz to focus on dominant frequency content most relevant to soil response and resonance behavior in the region.
For each of the eight acceleration recording stations within Diyarbakır Province, seismic data from all 10 selected earthquake events were individually analyzed, resulting in a comprehensive evaluation of 80 earthquake records in total. By assessing the variation in the H/V Spectral Ratio across different events and locations, valuable insights were gained into the dynamic soil behavior and potential amplification effects at each station.
The results contribute to understanding how different parts of the city respond to seismic waves and provide a foundation for future microzonation, earthquake hazard assessment, and structural design considerations. The spatial distribution and spectral characteristics of the earthquake-induced acceleration records are illustrated in Figure 6, which visually represents the seismic behavior and associated ground motion across the study area. Each curve corresponds to earthquakes with M ≥ 4.0 recorded by the respective station up to the present day.
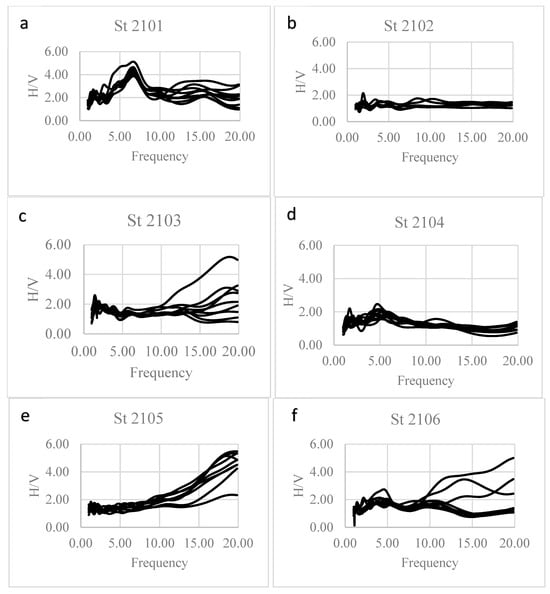
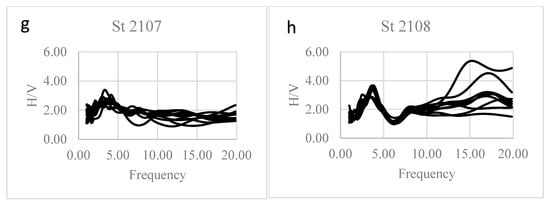
Figure 6.
Earthquake records (Mw ≥ 4.0) in the study area and H/V analyses. (a) H/V analysis of earthquake recordings from Station 2101, (b) H/V analysis of earthquake recordings from Station 2102, (c) H/V analysis of earthquake recordings from Station 2103, (d) H/V analysis of earthquake recordings from Station 2104, (e) H/V analysis of earthquake recordings from Station 2105, (f) H/V analysis of earthquake recordings from Station 2106, (g) H/V analysis of earthquake recordings from Station 2107, (h) H/V analysis of earthquake recordings from Station 2108.
It is important to note that this assumption was made only in the absence of direct earthquake data. Additionally, the spatial separation between stations 2104 and 2105 exceeds the ideal tolerance for direct comparison, and this limitation is acknowledged accordingly.
5. Results
The ellipticity property of Rayleigh waves was utilized to determine shear wave velocity through an inverse solution method implemented in the Geopsy software (see Section 2.3 for details). Microtremor measurements were conducted at eight locations across seven districts. For each station, phase velocities were converted into one-dimensional shear wave velocity profiles, which are presented in Figure 7.
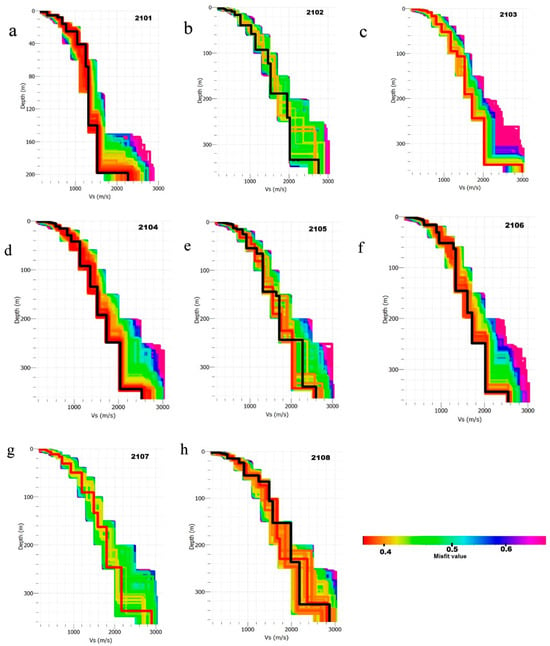
Figure 7.
Shear-wave velocity (Vs) depth profile derived from microtremor data using Rayleigh wave ellipticity inversion (a) St 2101, (b) St 2102, (c) St 2103, (d) St 2104, (e) St 2105, (f) St 2106, (g) St 2107, (h) St 2108. The black and red lines present the shear wave velocity variation with the misfit value rate obtained from the analysis. It is a misfit value that shows how well the measurement results match the observed data. The optimal model is the one with the lowest misfit value.
Site-specific parameters such as Vs30 and the fundamental frequency (f0) are critical for seismic site classification and hazard assessment. These parameters provide essential information about potential soil amplification effects, which are vital for designing earthquake-resistant structures. Although recent earthquake damages in Diyarbakır have been largely attributed to building quality, incorporating local soil conditions remains fundamental for future seismic risk mitigation and resilient infrastructure planning, especially given the proximity to the active East Anatolian Fault Zone.
Shear wave velocity, which varies with soil properties and depth, plays a key role in determining bedrock depth and soil classification. The one-dimensional velocity profiles shown in Figure 7 illustrate the variation in shear wave velocity within the soil layers, enabling the calculation of the average shear wave velocity in the upper 30 m. The Vs30 values, a principal parameter in soil classification, along with the corresponding soil classifications based on these values, are presented in Table 3. These classifications follow three different standards: the Turkish Building Earthquake Code (TBEC) [], the European Union Standard (Eurocode-8) [], and the National Earthquake Hazard Reduction Program (NEHRP) [].
The coefficient e = 0.6 used in Equation (2) is an empirical factor relating seismic ground motion parameters to effective strain in the foundation soil layer. Assuming an average shear wave velocity Vb = 600 m/s, the term 1/(π2 × Vb) is approximately 1.69 × 10⁻⁶ s/cm. With e = 0.6, the seismic strain parameter Kg(e) can be approximated as Ag2/Fg, where Ag and Fg represent acceleration and frequency terms, respectively. Effective strain values are calculated by multiplying Kg(e) with the maximum basement acceleration amax (cm/s2) recorded during the Kahramanmaraş earthquakes. The average shear wave velocity values used for Vb are listed in Table 3.
H/V Spectral Ratio analysis was performed for each station site based on the measurements obtained. As a result, H/V graphs were generated for each location, with two representative examples presented in Figure 8.
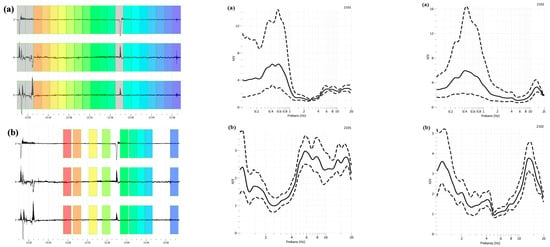
Figure 8.
(a) Unfiltered window view and H/V analysis results for two stations and (b) Filtered window view, high-pass filtered (1.0 Hz) application, H/V graphs. Dashed lines represent the standard deviation, while the solid black line represents the average H/V ratio across all windows.
In the initial unfiltered analysis, inconsistent results were observed. As illustrated in Figure 8a, significant scattering appears at low frequencies, likely due to external noise sources such as traffic, environmental disturbances, and wind. To mitigate these effects, a high-pass filter was applied.
As an improved approach, a high-pass filter combined with an anti-trigger application was implemented across various frequency ranges. The resulting H/V graphs from this method are shown in Figure 8b.
The dominant frequency and amplification values derived from all analyses are summarized in Table 4. A review of Table 4 indicates that the high-pass filter with a cutoff frequency of 1.0 Hz provides the most reliable and reasonable results.

Table 4.
Fundamental frequency (F0), amplitude (A0), and site classification results.
Based on the results of the H/V analysis, the vulnerability index was calculated using the ground-dominant frequency and amplification factor obtained in the high-pass filter range (1.0 Hz). Calculations for each station’s location are presented in Figure 9. The shear strain value, calculated based on the vulnerability index, was computed for each station under two different seismic scenarios, and the results are provided in Table 5.
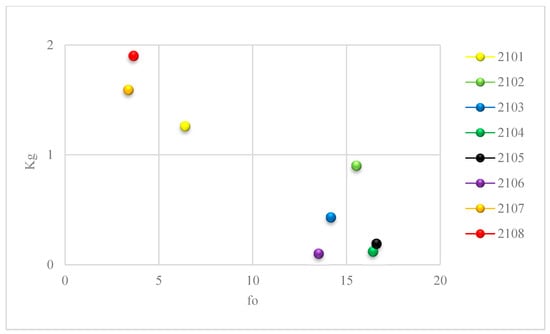
Figure 9.
Change in vulnerability index and dominant frequency (high-pass filter: 1.0 Hz).

Table 5.
Strain dependence results.
Soil classification is based on the average velocity (Vs30) within the upper 30 m. A high average shear wave velocity indicates that the soil is hard and solid. Two groups of different ground conditions have been identified. Accordingly, relatively low Vs30 and low frequency values were observed at stations 2101, 2107, and 2108, while high frequency and Vs30 values were obtained at other stations (Figure 10). In this case, positive results have been obtained for the station soil. As a result of various dynamic parameters, the soils related to the station were identified.
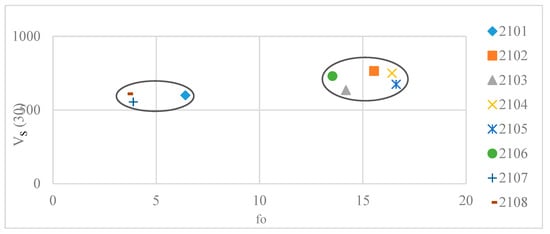
Figure 10.
Distribution of fundamental frequency (F0) and average shear wave velocity Vs(30) across the study area.
6. Conclusions
This study evaluates ground behavior at eight accelerometer stations located in Diyarbakır, Southeastern Türkiye, aiming to investigate the relationship between recorded ground motions and subsurface conditions. The microtremor method was selected due to its ease of application, cost-effectiveness, and ability to provide rapid measurements compared to other seismic site characterization techniques. A notable advantage of this method is the flexibility of the processing software (Geopsy), which allows data analysis across various time intervals, thereby enhancing the reliability of comparative assessments.
At each station, 30 min ambient vibration recordings were collected and analyzed. Using Geopsy, shear wave velocity (Vs) profiles, Vs30 values, predominant frequencies, and amplification factors were derived. Additionally, H/V Spectral Ratio analyses were performed using 10 earthquake records with moment magnitudes (Mw ≥ 4). These results were then compared with microtremor measurements to evaluate consistency. The effects of the 6 February 2023 Kahramanmaraş earthquakes were also assessed by examining observed structural damage in the areas surrounding the stations.
Shear wave velocity results indicate that Vs values generally exceed 550 m/s, reflecting competent ground conditions. At station 2102, where the lowest Vs was observed, shear wave velocity increased from approximately 500 m/s at 10 m depth to over 1000 m/s at 40 m, suggesting a transition to engineering bedrock (Vs > 760 m/s) between 20 and 40 m depth. The highest Vs30 value was recorded at station 2107, measuring 555 m/s. Based on these findings, the sites were generally classified as medium-dense to dense soils or rock, indicating high geotechnical capacity. Despite these favorable soil conditions, significant structural damage occurred during the earthquakes, emphasizing that poor building quality rather than site amplification was the primary cause of damage.
Although initial analyses covered a broad frequency range (0.1–20 Hz), a high-pass filter at 1 Hz was later applied to mitigate low-frequency urban noise. This approach improved curve clarity but may limit interpretation of deeper structures with fundamental frequencies below 1 Hz and is acknowledged as a limitation of the study.
To more accurately assess site response, six different H/V analysis methods were applied. The initial unfiltered analysis revealed predominant frequencies ranging from 0.24 Hz to 1.14 Hz, though results were affected by environmental noise, particularly at low frequencies. To reduce such noise—typically caused by traffic or wind—a 1.0 Hz high-pass filter was applied. This adjustment significantly enhanced the clarity of dynamic parameters, making the filtered analysis more reliable. Using this filter, the highest predominant frequency (16.61 Hz) was observed at station 2105, while the lowest (3.64 Hz) was at station 2108. The highest amplification factor (3.74) was recorded at station 2102.
Comparison between microtremor-derived parameters and earthquake recordings revealed strong consistency, indicating that local site conditions did not contribute to additional seismic amplification. This supports the conclusion that observed damage was not related to ground motion but rather to structural vulnerabilities.
The damage susceptibility index, evaluated according to Nakamura’s method [], ranged between 0 and 5 for all stations, corresponding to a low-risk class. Elastic behavior assessments based on this index also confirmed that the recording sites were situated in elastic, non-amplifying environments. These conditions are inferred to extend to the surrounding neighborhoods.
Despite the epicentral distances of the Kahramanmaraş earthquakes exceeding 300 km, the unexpectedly high level of damage in Diyarbakır further highlights issues related to structural integrity and urban planning rather than seismic ground motion intensity. In fact, Peak Ground Acceleration (PGA) values were relatively low, yet considerable structural damage occurred, reinforcing the conclusion that vulnerability stemmed from construction deficiencies rather than geotechnical factors.
Author Contributions
Conceptualization, M.H.A.; Methodology, M.H.A. and A.B.; Software, M.H.A.; Validation, M.H.A. and A.B.; Formal analysis, A.B.; Investigation, M.H.A.; Resources, K.A. and M.H.A.; Data curation, M.H.A.; Writing—original draft, K.A., M.H.A. and A.B.; Writing—review and editing, M.H.A.; Visualization, M.H.A.; Supervision, M.H.A.; Project administration, M.H.A. All authors have read and agreed to the published version of the manuscript.
Funding
This study has been supported by Dicle University Natural and Applied Sciences (Project code: ENGINEERING 23.004).
Institutional Review Board Statement
Not applicable.
Informed Consent Statement
Not applicable.
Data Availability Statement
The original contributions presented in this study are included in the article. Further inquiries can be directed to the corresponding author.
Acknowledgments
This study was produced from Kübra ADAR’s ongoing Ph.D. thesis and was partially supported by the Dicle University Natural and Applied Sciences (Project code: ENGINEERING 23.004).
Conflicts of Interest
The authors declare that they have no conflicts of interest.
References
- Çoban, K.H.; Sayıl, N. Investigation of the seismicity of East Anatolian fault zone (EAFZ) according to Poisson and Exponential distribution models. Düzce Univ. J. Sci. Technol. 2017, 6, 491–500. [Google Scholar]
- Işık, E.; Avcil, F.; Arkan, E.; Büyüksaraç, A.; İzol, R.; Topalan, M. Structural damage evaluation of mosques and minarets in Adıyaman due to the 06 February 2023 Kahramanmaraş earthquakes. Eng. Fail. Anal. 2023, 151, 107345. [Google Scholar] [CrossRef]
- Işık, E.; Avcil, F.; Büyüksaraç, A.; İzol, R.; Arslan, M.H.; Aksoylu, C.; Harirchian, E.; Eyisüren, O.; Arkan, E.; Güngür, M.Ş.; et al. Structural damages in masonry buildings in Adıyaman during the Kahramanmaraş (Turkiye) earthquakes (Mw 7.7 and Mw 7.6) on 06 February 2023. Eng. Fail. Anal. 2023, 151, 107405. [Google Scholar] [CrossRef]
- Alkan, H.; Büyüksaraç, A.; Bektaş, Ö. Investigation of earthquake sequence and stress transfer in the Eastern Anatolia Fault Zone by Coulomb stress analysis. Turk. J. Earth Sci. 2024, 33, 56–68. [Google Scholar] [CrossRef]
- Büyüksaraç, A.; Bektaş, Ö.; Alkan, H. Fault modeling around southern Anatolia using the aftershock sequence of the Kahramanmaraş earthquakes (Mw= 7.7 and Mw= 7.6) and an interpretation of potential field data. Acta Geophys. 2024, 72, 2985–2996. [Google Scholar] [CrossRef]
- Akar, F.; Işık, E.; Avcil, F.; Büyüksaraç, A.; Arkan, E.; İzol, R. Geotechnical and structural damages caused by the 2023 Kahramanmaraş Earthquakes in Gölbaşı (Adıyaman). Appl. Sci. 2024, 14, 2165. [Google Scholar] [CrossRef]
- Işık, E.; Avcil, F.; İzol, R.; Büyüksaraç, A.; Bilgin, H.; Harirchian, E.; Arkan, E. Field reconnaissance and earthquake vulnerability of the RC buildings in Adıyaman during 2023 Türkiye earthquakes. Appl. Sci. 2024, 14, 2860. [Google Scholar] [CrossRef]
- Isik, E.; Avcil, F.; Buyuksarac, A.; Arkan, E.; Harirchian, E. Impact of Local Soil Conditions on the Seismic Performance of Reinforced Concrete Structures: In the Context of the 2023 Kahramanmaras Earthquakes. Appl. Sci. Basel 2025, 15, 2389. [Google Scholar] [CrossRef]
- Işık, E.; Avcil, F.; Büyüksaraç, A.; Arkan, E. Comparative analysis of target displacements in RC Buildings for 2023 Türkiye earthquakes. Appl. Sci. 2025, 15, 4014. [Google Scholar] [CrossRef]
- Lermo, J.; Chávez-García, F.J. Are microtremors useful in site response evaluation? Bull. Seismol. Soc. Am. 1994, 84, 1350–1364. [Google Scholar]
- Siyahi, B.; Selcuk, M.E. Use of Microtremor Measurements in Determining Local Soil Conditions: Adapazarı Example. In Proceedings of the Kocaeli 2005 Earthquake Symposium, Kocaeli, Turkey, 23–25 March 2005; pp. 1167–1177. [Google Scholar]
- Over, S.; Buyuksarac, A.; Bektas, O.; Filazi, A. Assessment of potential seismic hazard and site effect in Antakya (Hatay Province), SE Turkey. Environ. Earth Sci. 2011, 62, 313–326. [Google Scholar] [CrossRef]
- Buyuksarac, A.; Bektas, O.; Yılmaz, H.; Arısoy, M. Preliminary seismic microzonation of Sivas city (Turkey) using microtremor and refraction microtremor (ReMi) measurements. J. Seismol. 2013, 17, 425–435. [Google Scholar] [CrossRef]
- Coban, K.H. Seismic site classifcation based on H/V spectral ratio from strong ground motion records: The urban areas of Bursa province. J. Seismol. 2024, 28, 321–344. [Google Scholar] [CrossRef]
- Karsli, F.; Bayrak, E. Single-station microtremor surveys for site characterization: A case study in Erzurum city, eastern Turkey. Earthq. Eng. Eng. Vib. 2024, 23, 563–576. [Google Scholar] [CrossRef]
- Nakamura, Y. A method for dynamic characteristics estimation of subsurface using microtremor on the ground surface. Railw. Tech. Res. Inst. Q. Rep. 1989, 30, 25–33. [Google Scholar]
- Aki, K. A note on the use of microseisms in determining the shallow structures of the Earth’s crust. Geophysics 1965, 30, 665–666. [Google Scholar] [CrossRef]
- Shabani, E.; Cornou, C.; Haghshenas, E.; Wathelet, M.; Bard, P.Y.; Mirzaei, N.; Eskandari-Ghadi, M. Estimating shear-waves velocity structure by using array methods (FK and SPAC) and inversion of ellipticity curves at a site in south of Tehran. In Proceedings of the 14th World Conference on Earthquake Engineering, Beijing, China, 12–17 October 2008. [Google Scholar]
- Rosa-Cintas, S.; Clavero, D.; Delgado, J.; López-Casado, C.; Galiana-Merino, J.J.; Garrido, J. Characterization of the shear wave velocity in the metropolitan area of Málaga (S Spain) using the H/V technique. Soil Dyn. Earthq. Eng. 2017, 92, 433–442. [Google Scholar] [CrossRef]
- Anggono, T.; Febriani, F.; Amran, A. Inversion of shallow subsurface structure from Rayleigh ellipticity beneath a station in Tangerang. In donesia. In Journal of Physics Conference Series; IOP Publishing: Bristol, UK, 2019; p. 012013. [Google Scholar] [CrossRef]
- Issaadi, A.; Semmane, F.; Yelles-Chaouche, A.; Galiana-Merino, J.J.; Layadi, K. A Shear-Wave Velocity Model in the City of Oued-Fodda (Northern Algeria) from Rayleigh Wave Ellipticity Inversion. Appl. Sci. 2020, 10, 1717. [Google Scholar] [CrossRef]
- Pamuk, E.; Ozer, C. Obtaining S-Wave Velocity Structure Using Rayleigh Wave Ellipticity: Erzurum Example. Earth Sci. 2020, 41, 147–168. [Google Scholar] [CrossRef]
- Büyüksaraç, A.; Eyisüren, O.; Bektaş, Ö.; Karaca, Ö. Bedrock depth calculation of Çanakkale (Turkey) basin using Rayleigh ellipticity and microgravity survey. Geofísica Int. 2023, 62, 387–401. [Google Scholar] [CrossRef]
- T.C. Prime Ministry Disaster and Emergency Management Authority, AFAD. Available online: https://deprem.afad.gov.tr/last-earthquakes.html (accessed on 9 January 2025).
- Wathelet, M.; Chatelain, J.L.; Cornou, C.; Giulio, G.D.; Guillier, B.; Ohrnberger, M.; Savvaidis, A. Geopsy: A user-friendly open-source tool set for ambient vibration processing. Seismol. Res. Lett. 2020, 91, 1878–1889. [Google Scholar] [CrossRef]
- Geopsy. Available online: https://www.geopsy.org/ (accessed on 9 August 2025).
- Anadolu, N.C.; Kalyoncuoglu, U.Y. Seismicity and Earthquake Hazard Analysis of Southeastern Anatolia Region. Suleyman Demirel Univ. J. Sci. Inst. 2010, 14, 84–94. [Google Scholar]
- Danıs, H. Characteristics of Rocks Used as Aggregate in Diyarbakir and Its Surroundings. Master’s Thesis, Dicle University, Institute of Science, Diyarbakır, Turkey, 2019. 227p. [Google Scholar]
- Imamoglu, M. Seismicity and Ground Properties of Diyarbakir and Its Surroundings. DUMF Eng. J. 2019, 10, 697–707. [Google Scholar] [CrossRef]
- Imamoglu, M.; Cetin, E. Seismicity of Southeastern Anatolia Region and Its Vicinity. D.U. Ziya Gökalp Fac. Educ. J. 2007, 9, 93–103. [Google Scholar]
- Genc, S. Investigating the Origin of Gneiss and Amphibolite in the Bitlis Massif Lice-Kulp (Diyarbakir) and Cökekyazı-Gökay (Hizan, Bitlis) Regions. Geol. Eng. 1985, 23, 31–38. [Google Scholar]
- Pawlewicz, M.J.; Williams, A.J.; Walden, S.M.; Steinshouer, D.W. Generalized Geology of Europe including Turkey (geo4_2l); U.S. Geological Survey Data Release; U.S. Geological Survey: Reston, VA, USA, 2003. [CrossRef]
- Muñoz, G.; Mora, P. Noise Suppression in Microtremor Measurements for Site Characterization. Geophys. Prospect. 2003, 51, 607–621. [Google Scholar]
- Liu, H.; Zhang, L.; Wang, J. Extraction of dynamic soil parameters from microtremor data using high-pass filtering techniques. J. Geotech. Geoenviron. Eng. 2021, 147, 04021033. [Google Scholar] [CrossRef]
- Choi, Y.; Kim, J.; Lee, D. Application of high-pass filters for seismic noise removal in microtremor data. J. Earthq. Eng. 2021, 25, 121–134. [Google Scholar]
- Rodriguez, J.; Lee, M.; Park, S. Microtremor data processing for seismic activity monitoring and early warning systems. J. Seismol. Earthq. Eng. 2022, 27, 533–548. [Google Scholar]
- Lee, S.; Cho, W.; Kim, H. STA/LTA ratio analysis for microtremor data and its application in noise reduction. J. Seismol. Earthq. Eng. 2022, 28, 110–124. [Google Scholar]
- Buyuksarac, A.; Sayıl, A.; Bektas, O.; Akın, O. Earthquake Science; Gazi Kitapevi: Ankara, Turkey, 2018. [Google Scholar]
- Zor, E.; Ozalaybey, S.; Karaslan, A.; Tapırdamaz, M.C.; Cetin, S.; Tarancıoglu, A.; Erkan, B. Determination of S-Wave Velocity Structure and Site Classification Using Active and Passive Source Methods. In Proceedings of the 1st Turkish Earthquake Engineering and Seismology Conference, Ankara, Turkey, 11–14 October 2011. [Google Scholar]
- Arai, H.; Tokimatsu, K. Estimation of S-wave velocity profile using microtremor measurements: Application to site response analysis. Soil Dyn. Earthq. Eng. 2021, 141, 105506. [Google Scholar]
- Parolai, S.; Picozzi, M.; Richwalski, S.M.; Milkereit, C. Joint Inversion of Phase Velocity Dispersion and H/V Ratio Curves from Seismic Noise Recordings Using a Genetic Algorithm, Considering Higher Modes. Geophys. Res. Lett. 2005, 32, L01303. [Google Scholar] [CrossRef]
- Picozzi, M.; Parolai, S.; Richwalski, S. Joint Inversion H/V Ratios and Dispersion Curves from Seismic Noise: Estimating the S-wave Velocity of Bedrock. Geophys. Res. Lett. 2005, 32, L11308. [Google Scholar] [CrossRef]
- Konno, K.; Ohmachi, T. Ground-motion characteristics estimated from spectral ratio between horizontal and vertical components of microtremor. Bull. Seismol. Soc. Am. 1998, 88, 228–241. [Google Scholar] [CrossRef]
- Ullah, I. Near-Surface Characterization from the H/V Spectral Curves Along with the Joint Inversion of the Ellipticity and Dispersion Curves. Ph.D. Thesis, University of São Paulo, São Paulo, Brazil, 2017. 195p. [Google Scholar]
- Fäh, D.; Kind, F.; Giardini, D. A theoretical investigation of average H/V ratios. Geophys. J. Int. 2001, 145, 535–549. [Google Scholar] [CrossRef]
- Götz, T.; Kraft, T. Microtremor measurements for seismic site characterization in urban environments. J. Appl. Geophys. 2020, 177, 104003. [Google Scholar] [CrossRef]
- Borghini, M.; Stabile, T. Rayleigh wave ellipticity in microtremor analysis for shallow soil characterization. Eng. Geol. 2023, 300, 106587. [Google Scholar]
- Khazanah, I.; Massinai, M.F.I.; Kailem, Z.E.S.; Sofian, S.; Leopatty, H. Determination of the shear wave velocity (vs) profile and subsurface density by measuring microtremor using Rayleigh wave ellipticity inversion in Palu city. AIP Conf. Proc. 2024, 2774, 050006. [Google Scholar] [CrossRef]
- Bayrak, E.; Ozer, Ç.; Cakıcı, H.; Kocadagistan, M.E. January 24 2020 Sivrice (Turkey) Earthquake (Mw 6.8): Evaluation of Ground Motion Prediction Equations and Microtremor Studies. Turk. J. Earthq. Res. 2021, 3, 125–148. [Google Scholar] [CrossRef]
- Aydın, U.; Pamuk, E.; Ozer, C. Investigation of soil dynamic characteristics at seismic stations using H/V spectral ratio method in Marmara Region, Turkey. Nat. Hazards 2022, 110, 587–606. [Google Scholar] [CrossRef]
- Akbayram, K.; Bayrak, E.; Pamuk, E.; Ozer, C.; Kıransan, K.; Varolgunes, S. Dynamic sub-surface characteristic and the active faults of the Genç District locating over the Bingöl Seismic Gap of the East Anatolian Fault Zone, Eastern Turkey. Nat. Hazards 2022, 114, 825–847. [Google Scholar] [CrossRef]
- Bayrak, E. Investigation of soil dynamic properties using horizontal-to-vertical spectral ratio for Eastern Pontides, Northeast Turkey. Environ. Earth Sci. 2022, 81, 514. [Google Scholar] [CrossRef]
- Nakamura, Y. Real-time information systems for seismic hazards mitigation UrEDAS, HERAS and PIC. Q. Rep. Rtri 1996, 37, 112–127. [Google Scholar]
- Nakamura, Y. Seismic Vulnerability Indices for Ground and Structures Using Microtremor; World Congress on Railway Research: Firenze, Italy, 1997; pp. 1–7. [Google Scholar]
- Nakamura, Y. Clear identification of fundamental idea of Nakamura’s technique and its applications. In Proceedings of the 12th World Conference on Earthquake Engineering, Auckland, New Zealand, 30 January–4 February 2000; p. 2656. [Google Scholar]
- Ishihara, K. Soil Behavior in Earthquake Geotechnics; Oxford University Press: Oxford, UK, 1996. [Google Scholar]
- T.C. Ministry of Environment, Urbanization and Climate Change. Available online: https://csb.gov.tr/en (accessed on 9 August 2025).
- TBEC. Turkish Building Earthquake Code; T.C. Resmi Gazete: Ankara, Türkiye, 2018.
- EN 1998-3; Eurocode-8: Design of Structures for Earthquake Resistance-Part 3: Assessment and Retrofitting of Buildings. European Committee for Standardization: Bruxelles, Belgium, 2005.
- NHERP (National Earthquake Hazards Reduction Program) Building Seismic Safety Council. Recommended Provisions for Seismic Regulations for New Buildings and Other Structures and Accompanying Commentary and Maps; Building Seismic Safety Council: Washington, DC, USA, 2003; FEMA 450, Chapter 3; pp. 17–49.
- Picotti, S.; Francese, R.; Giorgi, M.; Pettenati, F.; Carcione, J.M. Estimation of glacier thicknesses and basal properties using the horizontal-to-vertical component spectral ratio (HVSR) technique from passive seismic data. J. Glaciol. 2017, 63, 229–248. [Google Scholar] [CrossRef]
Disclaimer/Publisher’s Note: The statements, opinions and data contained in all publications are solely those of the individual author(s) and contributor(s) and not of MDPI and/or the editor(s). MDPI and/or the editor(s) disclaim responsibility for any injury to people or property resulting from any ideas, methods, instructions or products referred to in the content. |
© 2025 by the authors. Licensee MDPI, Basel, Switzerland. This article is an open access article distributed under the terms and conditions of the Creative Commons Attribution (CC BY) license (https://creativecommons.org/licenses/by/4.0/).