Article

A DEM Study on the Macro- and Micro-Mechanical Characteristics of an Irregularly Shaped Soil–Rock Mixture Based on the Analysis of the Contact Force Skeleton

1
School of Civil Engineering, Zhejiang University of Technology, Hangzhou 310023, China
2
China Construction Fifth Engineering Bureau, Changsha 410021, China
*
Author to whom correspondence should be addressed.
Appl. Sci. 2025, 15(14), 7978; https://doi.org/10.3390/app15147978
Submission received: 10 June 2025 / Revised: 11 July 2025 / Accepted: 14 July 2025 / Published: 17 July 2025
(This article belongs to the Section Civil Engineering)

Abstract

The mechanical characteristics of soil–rock mixtures (S-RMs) are essential for ensuring geotechnical engineering stability and are significantly influenced by the microstructure’s contact network configuration. Due to the irregularity of particle shapes and the variability in particle grading with S-RMs, their macro-mechanical characteristics and mesoscopic contact skeleton distribution exhibit increased complexity. To further elucidate the macro-mesoscopic mechanical behavior of S-RMs, this study employed the DEM to develop a model incorporating irregular specimens representing various states, based on CT scan outlines, and applied flexible boundary conditions. A main skeleton system of contact force chains is an effective methodology for characterizing the dominant structural features that govern the mechanical behavior of soil–rock mixture specimens. The results demonstrate that the strength of S-RMs was significantly influenced by gravel content and consolidation state; however, the relationship is not merely linear but rather intricately associated with the strength and distinctiveness of the contact force chain skeleton. In the critical state, the mechanical behavior of S-RMs was predominantly governed by the characteristics of the principal contact force skeleton: the contact force skeleton formed by gravel–gravel, despite having fewer contact forces, exhibits strong contact characteristics and an exceptionally high-density distribution of weak contacts, conferring the highest shear strength to the specimens. Conversely, the principal skeleton formed through gravel–sand exhibits contact characteristics that are less distinct compared to those associated with strong contacts. Simultaneously, the probability density distribution of weak contacts diminishes, resulting in reduced shear strength. The contact skeleton dominated by sand–sand contact forces displays similar micro-mechanical characteristics yet possesses the weakest macroscopic behavior strength. Consequently, the concept of the main skeleton of contact force chains utilized in this study presents a novel research approach for elucidating the macro- and micro-mechanical characteristics of multiphase media.

1. Introduction

A soil–rock mixture (S-RM) consists of fine-grained soils, irregular gravels, and voids that exhibit variations in both size and spatial distribution, forming a granular medium characterized by extremely heterogeneous and nonlinear structural features [1,2]. The presence of gravels endows S-RMs with distinctive mesoscopic structural characteristics, resulting in complex mechanical properties that are closely related to the shape, particle size distribution, and spatial arrangement of these blocks [3,4,5]. As a product of geological processes, S-RMs are widely distributed in natural environments [6], and their occurrence is frequently associated with catastrophic landslides [7]. The mechanical properties of S-RMs play a crucial role in determining the stability of geotechnical engineering structures. Consequently, the investigation of these properties constitutes a fundamental research focus with significant implications for enhancing engineering safety and reliability.
A significant body of research has established a comprehensive framework for the mechanical properties of S-RMs, revealing that gravel content is the primary factor influencing their mechanical properties [8,9]. Lindquist et al. [10,11] conducted triaxial tests on a physical model that incorporated multiple variables, including varying gravel contents and particle shape distributions. Their results indicated that cohesion decreases as the gravel content increases, while the internal friction angle and deformation modulus increase. Additionally, the distribution of gravels significantly affects the strength of S-RMs, particularly in terms of cohesion and the deformation modulus. Moreover, gravel content influences Poisson’s ratio [12], compression strength [13], and the ultimate bearing capacity of pile ends [14]. Notably, even S-RMs with identical gravel contents can exhibit diverse mechanical behaviors [15]. Numerous researchers have investigated the impact of gravel size, shape, distribution, and other microstructural characteristics on the mechanical properties and mechanical behavior of S-RMs through extensive direct shear tests [1,16,17], in situ shear tests [18], laboratory large-scale triaxial tests [10,19,20], and numerical simulations [21,22]. However, purely experimental methodologies prove insufficient for thoroughly elucidating the fundamental mechanical mechanisms governing S-RMs.
S-RMs are heterogeneous and discontinuous granular materials [2] composed of irregular gravel and fine sand, which complicates the elucidation of their deformation patterns and failure mechanism when experimental research or traditional continuous-medium analysis methods are used. Moreover, it is nearly impossible to observe microstructural evolution in laboratory experiments. The discrete element method (DEM) offers a practical solution to these challenges. Numerous studies have demonstrated that the DEM is a practical approach for addressing discontinuity issues in granular materials [23], overcoming the limitation of assuming macro-level continuity in continuous-medium models. Starting from the contact forces between particles, the DEM identifies the constitutive relations at the contact points and constructs physical as well as mechanical models of these interactions. By establishing correlations between contact force, displacement, and velocity based on Newton’s second law, the DEM enables numerical simulations of discontinuous particle behavior.
The DEM provides a more reasonable approach to investigate the mechanical properties and micro-contact characteristics of S-RMs from the microscopic perspective and has been widely applied by researchers to simulate large-scale triaxial tests of S-RMs [24,25]. Using a three-dimensional discrete element model, Xu et al. [26,27] conducted numerical simulations of large-scale direct shear tests on S-RMs with varying gravel content and shear strength. However, their model simplifies boulders as single spheres—an assumption that reveals a notable inconsistency between the idealized geometric representation and the actual morphological characteristics of gravel granules. Ding et al. [28,29] performed two-dimensional discrete element numerical simulations of triaxial and direct shear tests on an S-RM model obtained through digital image processing, comparing the mechanical properties and deformation characteristics of sand and S-RMs. This study models irregular particle morphologies numerically. However, its application remains limited to two-dimensional frameworks. Jiao et al. [30,31] developed a two-dimensional discrete element model for the random microstructure of S-RMs by simplifying gravels into circles, triangles, and quadrilaterals, conducting numerical research on biaxial tests. Nevertheless, these models are still constrained by the limitations of two-dimensional simulation conditions. Xu et al. [32] proposed a new random convex polygonal gravel model, which they used to establish a two-dimensional numerical model of S-RMs. This model was then used to study the influence of boundary conditions and consolidation state on the mechanical properties and deformation failure mechanism of biaxial specimens. Based on a two-dimensional discrete element model of S-RMs, A. Raziani et al. [30] analyzed the effect of factors such as gravel content, gravel shape, and stone coarseness on the shear strength and deformation characteristics of S-RMs. Nevertheless, the discrepancy in irregular shape characteristics between two-dimensional polygons and actual three-dimensional particles remains insufficiently addressed in current research. Jin et al. [33] developed a three-dimensional discrete element model of triaxial tests of S-RMs, incorporating both irregularly shaped granules and sand mixtures containing spherical particles. The research successfully established an irregular particle configuration and performed comprehensive numerical analyses based on the proposed model.
In summary, the aforementioned scholars have made notable contributions to mesoscopic-scale research on S-RMs through the application of the discrete element method. However, several limitations remain across various aspects of this field. Due to the relatively low complexity in constructing two-dimensional irregular-outline models, most existing studies focus on their numerical simulations [32,34,35]. However, these models are limited in accurately capturing the actual mesoscopic mechanical characteristics. Currently, systematic investigations into the stress states of S-RMs under three-dimensional conditions remain limited. Most existing studies [36,37,38,39,40,41] employ rigid boundary conditions, which differ significantly from the rubber membrane boundaries commonly used in laboratory experiments. Moreover, although some studies [42] have incorporated the effects of particle breakage, the specimens employed are composed exclusively of gravel. As a result, these investigations do not adequately represent the unique mechanical behavior of S-RMs, which are inherently heterogeneous, multi-component geomaterials. Currently, the majority of research efforts focus on analyzing macroscopic mechanical properties. However, comprehensive investigations into the stress states of S-RMs under three-dimensional conditions remain limited, particularly at the microscale level. From a microscopic perspective, particles within S-RMs are interconnected through various types of contact forces, and the concept of complex systems is employed to describe the statistical characteristics of granular materials [43]. Microscale research aids in elucidating the origins of macroscopic responses [44], especially concerning factors such as the direction of contact forces [45], contact force transmission [46], and particle breakage [47]. It is particularly noteworthy that the contact force chain network constitutes a pervasive heterogeneous structure in the study of granular materials. This structure elucidates the mechanical properties of granular systems by quantifying loading transfer among particles and the distribution of contact forces within the systems. Analogous to the concept of the fabric tensor, the contact force chain network serves as a critical tool for quantitatively evaluating the intensity and orientation of contact force anisotropy [48]. The DEM facilitates the acquisition of contact force information for granular media under complex loading conditions, and corresponding laboratory experiments [49] provide robust validation for numerical simulations. Consequently, the DEM offers significant advantages in multiscale mechanical characteristic analysis and has emerged as an essential tool for studying granular materials.
This study aims to investigate the influence of gravel content and the initial consolidation state on the macroscopic mechanical characteristics and deformation failure mechanisms of S-RMs, with a particular emphasis on the evolution of the microstructure and contact force chain skeletons. By quantifying the inter-particle contact forces that form the force chain network, the distribution characteristics of interactions between different particle types were clearly elucidated. Moreover, based on these distinct contact force distributions, the principal skeleton of the specimen’s contact force chain network was systematically identified and characterized. To achieve this objective, S-RM specimens with varying gravel contents, consolidation states, and irregular particle shapes were established using CT scanning technology and stochastic modeling techniques. Furthermore, triaxial drained shear tests under flexible membrane boundary conditions were conducted via DEM simulations. The numerical simulation results provided a comprehensive analysis of the shear strength and deformation characteristics of S-RMs from a macroscopic perspective. Concurrently, they examined the distribution of contact forces, the development of the force chain skeleton, and the evolution of microstructural features from a microscopic viewpoint. These findings provide valuable insights into the macro- and micro-mechanical characteristics of mixed materials with a substantial particle size discrepancy.
This paper presents a systematic description of the methodology for constructing an irregular particle element model and the procedure for establishing S-RM specimens with varying gravel contents in Section 2. Furthermore, it provides a detailed explanation of the rationale for selecting the contact model and the corresponding parameter settings for the simulated specimens. In Section 3.1, a thorough analysis is conducted on the macroscopic mechanical behaviors of S-RMs under diverse working conditions. From a microscopic perspective, an in-depth examination is conducted to investigate the mechanical behavior of these specimens in Section 3.2. Specifically, by incorporating the concepts of contact force distribution, force chain networks, and strong contacts, the concept of the primary force chain skeleton of the whole sample is established. Based on this, the macroscopic–microscopic coupling mechanical behavior characteristics of S-RMs are systematically elucidated. Finally, Section 4 summarizes the key research findings and proposes potential directions for future research.

2. Model Development and Numerical Computation

2.1. Establishment of Irregular Gravel Specimens in the DEM

Due to the highly intricate distribution and geometrical shapes of the gravels in S-RMs, as well as their extraordinary randomness, constructing a realistic three-dimensional microstructure for these materials presents considerable challenges. In numerical simulation, researchers typically develop stochastic microstructure models that adhere to statistical significance [50,51]. For sand particles, spherical particles with minimal variation in diameter are commonly selected for numerical simulation [52]. Nevertheless, S-RMs are heterogeneous materials characterized by distinct gradation, and the particle size distribution and shape significantly influence their mechanical properties [2,3]. Therefore, when constructing a three-dimensional discrete element model of S-RMs, it is crucial to accurately reflect the differences between sand particles and gravel granules. It is essential to clarify that throughout the subsequent sections of this research, “S-RM” is consistently utilized to denote the complete specimen. “Gravel clump” is specifically adopted to represent gravel granule clusters within the numerical model, while “sand particle” is systematically used to refer to individual sand particles.
To date, the commonly employed technique for establishing the microstructure of gravels includes the random generation technique [32] and the computer scanning method [53]. The random generation technique involves stochastically generating irregular granules by using mathematical functions. The computer scanning method utilizes CT scanning technology to scan the gravels in specimens and reconstruct their three-dimensional geometric patterns. To accurately model gravel granules with realistic shapes, this study integrates 3D scanning technology and pebble filling algorithms to establish a three-dimensional microstructure model of S-RMs.
With the assistance of the irregular gravel model database provided by the MEGGS team at Tsinghua University, 50 three-dimensional models of ‘artificial gravel granules’ were generated, as illustrated in Figure 1. By leveraging the contour profiles from this database and incorporating realistic grading and grain size distributions of S-RMs, appropriate scaling of the gravel granules was conducted to generate a set of gravels with varying gravel contents. Subsequently, these scaled gravels were stochastically distributed within the constructed model domain to establish a three-dimensional random microstructure model of S-RMs.
In large-scale triaxial tests, a grain size of 5 mm is commonly used as the demarcation point between sand and gravel [25]. The gravel clumps were sized between 2.5 mm and 5 mm, while the sand particles had an approximate diameter of 0.5 mm. Based on these established parameters, microstructural models of S-RMs with distinct structural characteristics were developed.
PFC3d 6.0 is numerical software with considerable reliability for investigating the micro-mechanical behavior between granules. The model dimensions were set to 60 mm in height and 30 mm in diameter. To examine the influence of gravel content on the micro-mechanical behaviors of the specimen, the microstructural models were developed under three consolidation states ( σ 3 = 300   k P a ,   500   k P a ,   a n d   1000   k P a ) and seven categories of gravel content (GC = 10%, 20%, 30%, 45%, 55%, 70%, and 80%), as illustrated in Figure 2. The specific composition of the specimen, as detailed in Table 1, guarantees that the overall void ratio is maintained within an optimal range, thereby guaranteeing the accuracy and reliability of the simulation results. The gravel content is rigorously defined as the volumetric ratio of gravel to the total volume of the S-RMs. During the entire loading process, neither boulder particle clusters nor soil particles undergo any loss.

2.2. Development of Irregular Gravel Clump Units in the DEM

In three-dimensional discrete element numerical simulations, spherical unit pebbles are typically selected for sand particles, while irregularly shaped gravel pebbles are often simulated as particle clumps [2]. A particle clump comprises several, dozens, or even hundreds of spherical granules. Generally, when using gravel clumps to simulate complex gravel patterns, the more spherical pebbles included, the more accurately the gravel clumps can represent the intricate surface morphology of the gravel. However, a significant increase in the number of particles also substantially reduces computational efficiency. Consequently, when the gravel content is extremely high, numerical calculation efficiency is significantly diminished due to the large number of pebbles. To balance computational efficiency and the accuracy of representing irregular gravel shapes, some precision in the morphology of gravels is sacrificed during the establishment of gravel granule clump units. This approach ensures that particle clumps adequately characterize the irregular morphology of the gravel while maintaining a manageable number of filler pebbles, thereby improving the efficiency of numerical simulations.
In this study, the authors selected approximately 20 types of CT scanning patterns for gravel clumps. The inclusion criteria for pattern contours aimed to select granules with fewer tips and an elliptical shape, which simplifies the surface mesh. This modeling method allows spherical pebbles to fill the template and develop an irregular gravel clump that approximates the contour of the gravel. Eventually, using the built-in function of PFC3d, gravels are generated at arbitrary points within the template according to specified dimensional and quantity ratios. The control parameters for the clump template include distance, ratio, and radfactor (the radfactor is typically set to a default value of 1.05). By adjusting these parameters, gravel clumps with varying pebble-filling quantities can be generated, as shown in Figure 3. Through comparing the computational efficiency of gravel clump patterns filled with different pebble quantities, the control parameters for numerical simulation were determined to be distance = 150.0, radfactor = 1.05, and ratio = 0.15. Clumps generated by filling 293 spherical pebbles were chosen to simulate irregularly shaped gravels (The blue box in the Figure 3), ensuring both efficient numerical calculations and the accurate representation of the irregular surface morphology.

2.3. Establishment of S-RM Models in the DEM

To establish a discrete element model for the stochastic microstructure, the complex morphology of gravel granule clumps must be carefully considered. The system described below was employed to develop the discrete element model for S-RMs. Single spherical granules and particle clumps were used to simulate sand particles, gravel granules, and S-RMs in numerical simulation, as illustrated in Figure 4.
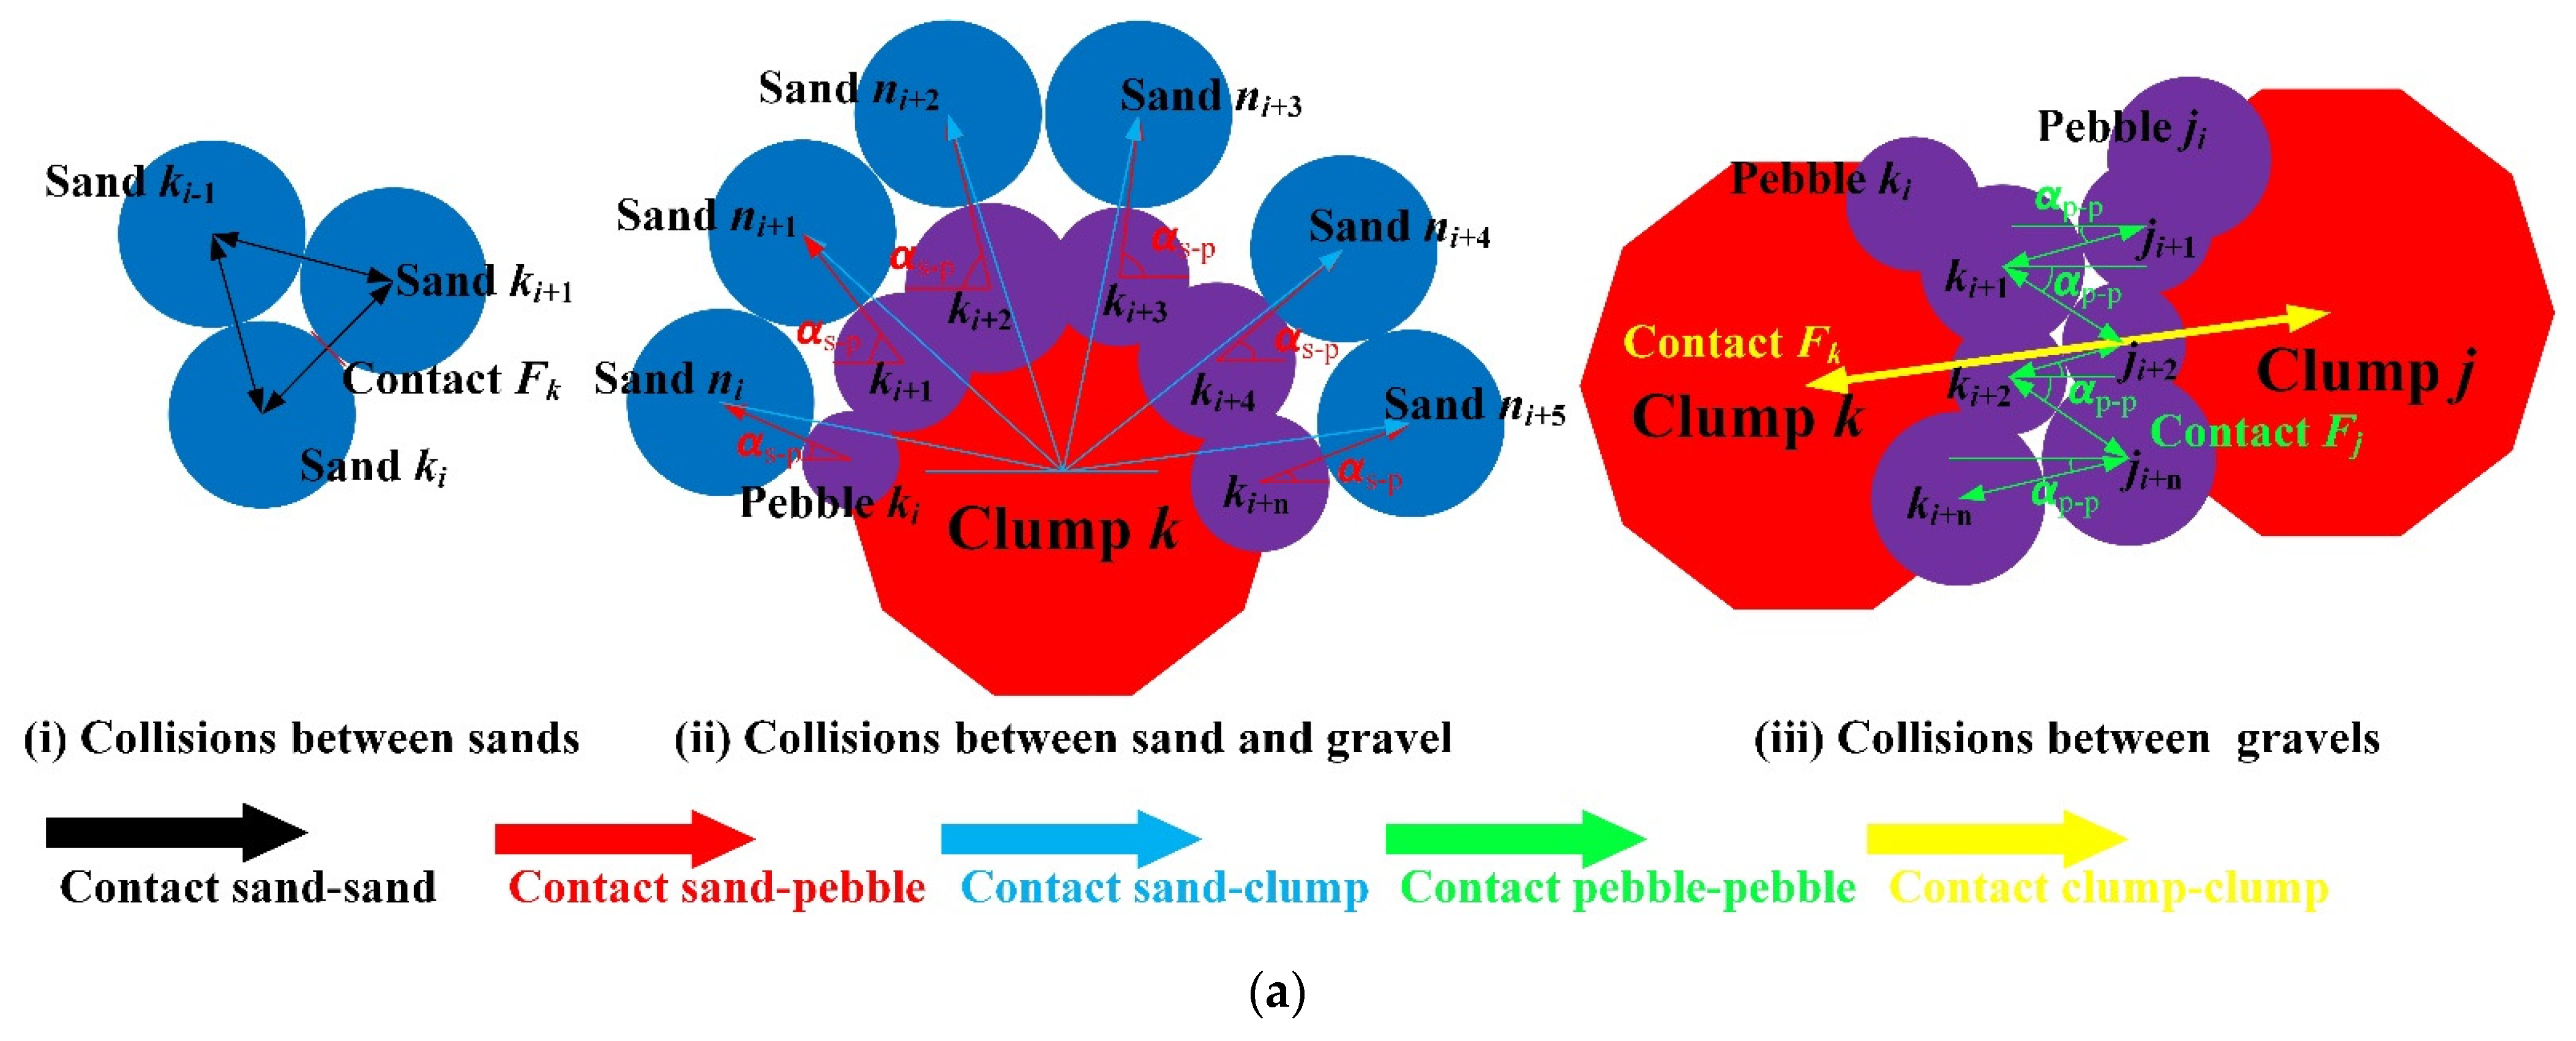
  • The CT-scanned gravel microstructure model was imported into the PFC3d program. Subsequently, leveraging the parameters established in Section 2.2, the PFC particle clump template system was utilized to generate all gravel granule clumps within the microscale mold, as illustrated in Figure 4a.
  • Based on the determined scales of the microscopic pattern, a test piece model comprising simple sand particles of uniform dimensions was established. Notably, the radius of the sand particles should be less than one-fifth of the gravel granule size, as shown in Figure 4b.
  • Irregular clumps of gravel granules were arbitrarily generated within the specimen of simple sand particles. Sand particles overlapping with these gravel clumps were eliminated, and the S-RM model was subsequently established. To ensure close contact between gravel clumps and sand particles, and to prevent any particles from entering a floating state, the radius of all sand particles was initially scaled to 1‰ of their original size after the gravel particle clumps were clustered into the simple sand pattern. Next, sand particles in active contact with the gravel clumps were removed. The radii of the remaining sand particles were then gradually increased back to their original dimensions, with cycle operations performed after each adjustment to ensure continuous compaction and intimate contact between gravel and sand particles. Figure 4c illustrates the final three-dimensional discrete element model of the S-RM.
The discrete element model of S-RMs with varying gravel content, established using the aforementioned approach, exhibits higher relative density and an optimal particle quantity. This enhances the efficiency of numerical computations and ensures the reliability of calculation results.

2.4. Contact Model and Material Parameters

The results of the discrete element method (DEM) simulations were significantly influenced by the choice of model boundary conditions [53,54]. By transitioning from conventional rigid boundaries to a flexible boundary construction method [55,56], we developed a three-dimensional discrete element model that integrates a particle membrane flexible boundary for triaxial testing. In DEM simulations, the contact model dictates the mechanical interactions between particles, thereby playing a pivotal role in accurately predicting the macroscopic mechanical behavior of S-RMs.
By analyzing the contact characteristics of gravel clumps and sand particles, along with a review of previous scholars’ research [2,57,58], this study developed a linear contact bond model for the contact force between sand particles that accurately captures the cohesion between them. For the contact constitutive models between gravel clumps and sand particles, a linear contact model was adopted to optimize computational efficiency. The contact model between flexible boundary particles was set as a linear parallel bond model [59]. Given the scarcity of large-scale laboratory triaxial test data for S-RMs, this study utilized a comprehensive set of parameters derived from discrete element numerical simulations of S-RMs to inform the selection of stiffness parameters, friction coefficients, and damping coefficients for the contact model (see Table 2). Simultaneously, to prevent fracture failure at particle boundaries due to concentrated stresses, the tensile strength and shear strength were set to extremely high values. Detailed parameter values are provided in Table 3.

2.5. Simulation Process for a Conventional Triaxial Drained Shear Test

Based on the aforementioned calculation principles and modeling approaches, a discrete element method (DEM) triaxial test numerical simulation was conducted under flexible membrane boundary conditions. The triaxial test is divided into three principal stages: (1) conventional consolidation to ensure that these S-RMs achieve the desired consolidated state; (2) application of flexible boundary conditions, replacing the traditional rigid boundary; and (3) shear loading, during which shear stresses are incrementally applied for testing.
  • Conventional Consolidation: Employing the inherent servo control mechanism in conventional triaxial testing, the entire specimen undergoes initial servo-controlled consolidation to attain a fully consolidated state consistent with the required conditions.
  • Flexible Consolidation: Prior to loading, a multi-particle wall servo was employed using a model with flexible membrane boundary conditions. Initially, the rigid wall was replaced by a particle membrane boundary. Alterations in boundary conditions may introduce potential disturbance to the specimens. To mitigate this, constant peripheral pressure was incrementally applied through iterative fine-tuning of the servo mechanism, thereby facilitating the specimen’s gradual transition to its initial consolidation state. For detailed information on the establishment of particle membrane boundaries, refer to Jiang et al. [60].
  • Loading Stage: The particles in contact with the upper and lower loading plates at the flexible boundary interface are arranged in an adhesive contact configuration. To ensure these particles achieve the same velocity as the loading plates, synchronous velocity control is essential. To maintain the entire model in a quasi-static state [61], the inertial number I must be less than 10−3 [62]. The formula for calculating the inertial number I is presented below:
I = ε ˙ d ¯ ρ g ¯ / p
where ρ g ¯ and d ¯ denote the bulk density of the specimen and the average diameter, respectively; ε ˙ is the strain rate; and p is the mean effective stress.
Based on the foregoing, all simulations in this study were conducted at a strain rate of 0.04 m/s. This loading speed was sufficiently slow in the vertical direction of the specimen to ensure that these models remained in a quasi-static condition. During the shearing phase, detailed information on particle rotation, sample shear resistance, and the types, distributions, and magnitudes of contact forces were systematically recorded at axial strains of 0.5%, 1.0%, 2.0%, 4.0%, 5.0%, 6.0%, 8.0%, 10.0%, 12.0%, 14.0%, 16.0%, 18.0%, and 20.0%.
The ultimate failure modes obtained from discrete element numerical simulations of triaxial shear tests under flexible boundary conditions are presented in Figure 5, alongside the failure modes observed in laboratory tests. The figure demonstrates that the simulated specimens exhibit lateral non-uniform swelling after failure, which is fundamentally consistent with the failure modes observed in laboratory testing under similar conditions.

3. Results and Analyses

Discrete element method (DEM) simulations of triaxial tests were conducted for soil–rock mixtures with varying gravel contents, according to microscopic parameters selected through artificial means and in conjunction with flexible membrane boundary conditions. The simulations were performed under three consolidation confining pressures: 300 kPa, 500 kPa, and 1000 kPa. Subsequently, a comprehensive analysis of the simulation results was carried out from multiple perspectives and considering various factors.

3.1. Macroscale Behaviors

3.1.1. Analysis of Macroscopic Mechanical Behaviors

The triaxial test simulations of S-RM specimens with varying gravel contents and consolidation states, from which stress–strain relationship curves ( q = σ 1 σ 3 = σ 1 σ 3 ) were derived, are illustrated in Figure 6. The results presented in Figure 6 indicate that, for S-RMs with identical gravel contents, the peak stress progressively increases as the confining pressure rises. This observation aligns with typical laboratory findings [2,63], as depicted in Figure 6d,e. A detailed comparison of Figure 6a–c reveals that, under the same consolidation pressure, when the gravel content exceeds 20% (GC > 20%), the peak stress of the specimen gradually increases with increasing gravel content; conversely, when the gravel content is below 20% (GC < 20%), the peak stress decreases with increasing gravel content. These observations suggest that there is a threshold value for the influence of gravel content on the shear strength of S-RMs: beyond this threshold, an increase in gravel content enhances the shear strength. Large-scale triaxial tests conducted by researchers [64,65] further support these findings, as illustrated in Figure 6f,g. Tao’s experimental results [64] show minimal differences in shear strength between specimens containing 50% and 30% gravel, while a significant discrepancy is observed for specimens with 70% gravel content. Wang’s triaxial test results [65] also corroborate this finding: the shear strength of the pure sand specimens is only slightly higher than that of S-RMs with 30% gravel, although the difference is not noticeable. It should be noted that these conclusions are qualitative rather than quantitative due to the inherent limitations of numerical simulations.

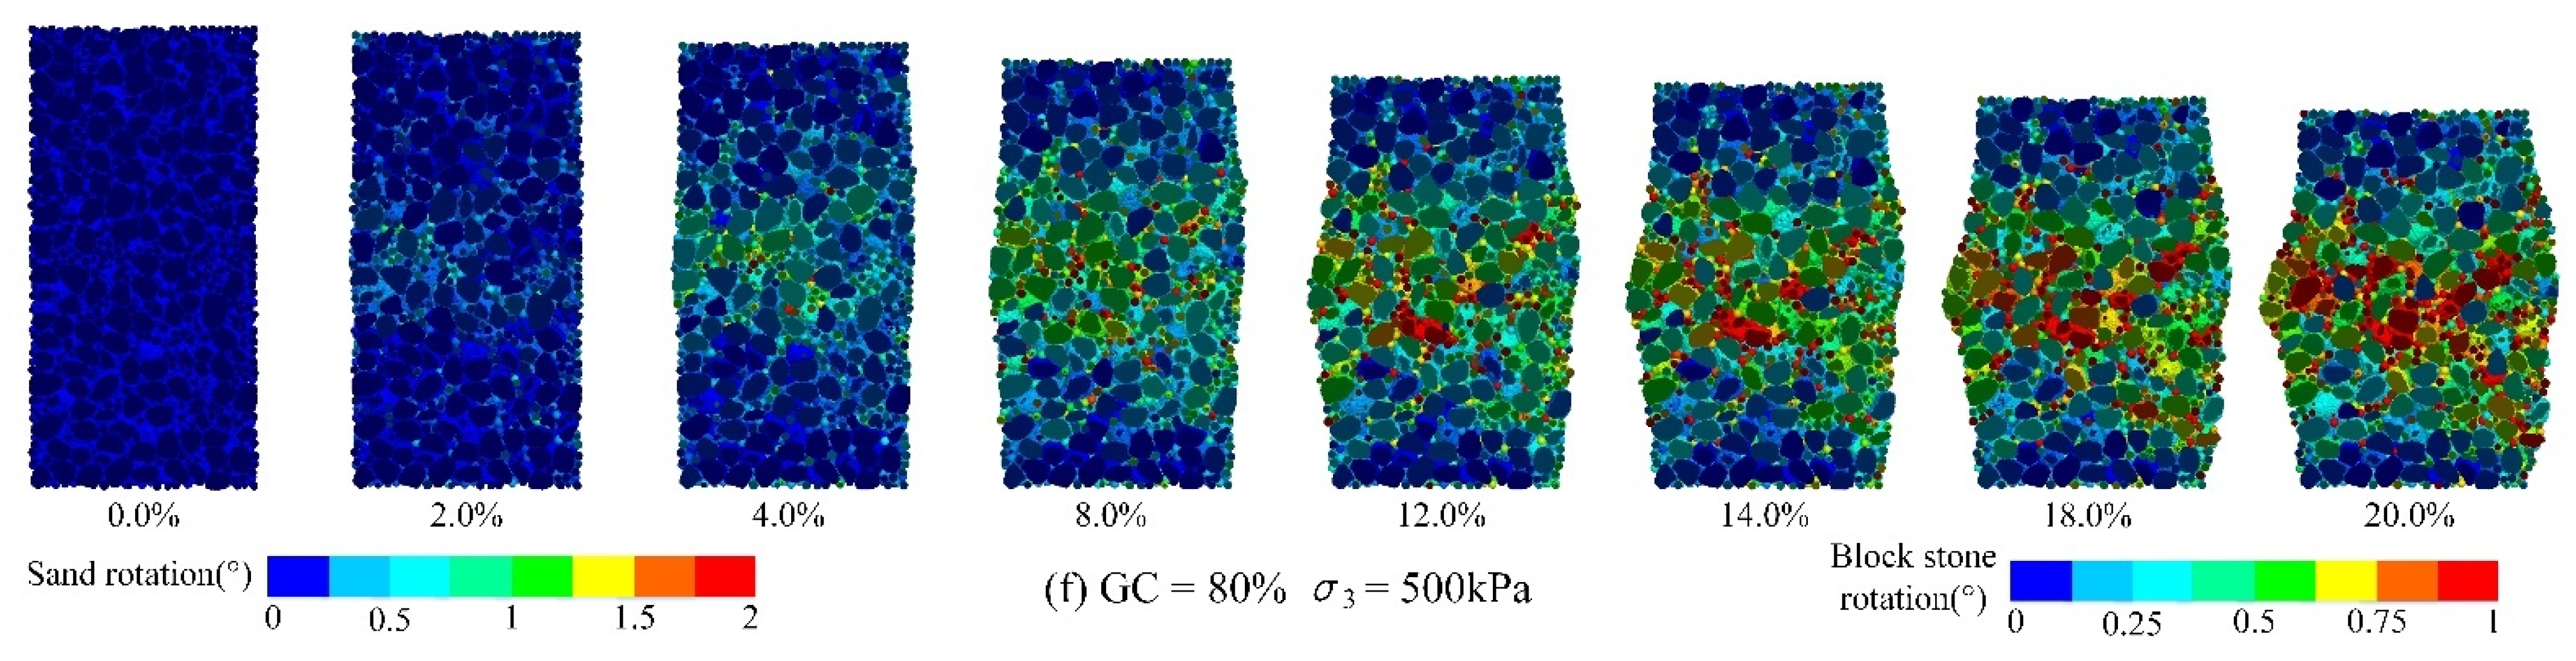
3.1.2. Evolutionary Analysis of Shear Band Development

S-RM specimens with gravel contents of 10%, 45%, and 80% were selected for the analysis of internal sectional views during deformation development. Additionally, the evolution of shear bands within the samples during the shear failure process was investigated, as depicted in Figure 7. A comparison of the observed deformations in S-RMs under varying axial strains revealed several noteworthy phenomena. In contrast to the findings in Figure 6 and Figure 7, the total deformation of the specimens gradually became evident throughout the loading process; however, significant bulging deformation was not evident until peak stress levels were reached. Once this threshold was exceeded, the bulging rapidly intensified, particularly with notable particle movement at the mid-edge region of the specimens.
As a discontinuous granular medium incorporating irregular stones, the S-RM further enhances the heterogeneity of the specimens. Observations from the particle rotation cloud diagram in Figure 7 reveal that the shear band does not exhibit a uniform structure but instead follows a winding pattern, extending outward in an asymmetrical “X” shape from the center of the sample. This phenomenon is more pronounced with increasing gravel content; specifically, as the gravel content increases, the shear band becomes less distinct. Notably, the rotational intensity of particles within the shear band is significantly higher than that of external particles. This behavior is attributed to localized granule rotation during axial loading, which leads to the formation of shear regions within the specimens. As a result of the relatively local density, particle translation becomes increasingly complex, and momentum transfer and dissipation primarily occur through particle rotation. As the axial load increases, the number of rotating particles gradually rises. At peak stress, these rotating particles penetrate local regions more effectively, forming a well-defined shear band. Continued loading until the specimen fails results in non-uniform expansion deformation at the center of the specimen, further promoting local particle rotation and altering the distribution, size, and shape of the shear band.
The rotation cloud diagrams of gravel clumps and sand particles in Figure 7a,c,e demonstrate that, under identical consolidation conditions, the rotational momentum of gravel clumps is significantly lower than that of sand particles. This observation provides further evidence for the heterogeneous characteristic of S-RMs. The discrepancy can be attributed to the higher moment of inertia exhibited by gravel clumps, which required more energy to achieve equivalent rotational momentum compared to sand particles. Despite their heterogeneity, S-RMs are considered a unified entity from a macroscopic perspective, with continuous energy transfer occurring between components. Therefore, when analyzing specimens consisting of identical granular systems holistically, it can be concluded that gravel clumps exhibit reduced rotational behavior compared to sand particles.
Meanwhile, comparisons of specimens with varying gravel contents (Figure 7b,d,f) reveal that the overall rotational momentum of the particles increased as the gravel content decreased (GC = 10%). Conversely, specimens with high gravel content (GC = 80%) exhibit lower global rotational momentum due to increased local compactness differences between gravels. This results in larger voids between them, enhancing the translational trend in the sand particles. Consequently, there is a decrease in overall granular rotation while the degree of aggregation among gravel clumps increases.

3.2. Microscale Behaviors

The interaction between adjacent granules is characterized by considering both the contact normal and contact force [66]. The contact force can be decomposed into the normal contact force, which is perpendicular to the contact surface, and the tangential contact force, which is parallel to it. Numerous scholars have proposed various methodologies for identifying and analyzing force chains [66,67]. At the microscale, the discrete element method (DEM) provides a comprehensive and intuitive visualization of the distribution of normal and tangential contact forces within a particle assembly. This visualization encompasses the distribution of branch vector orientations, the probability distribution of contact forces, the distribution of force chains, and the fabric tensor characteristics in contact forces, thereby elucidating the mechanical behavior at the macroscopic scale from a microscopic perspective.

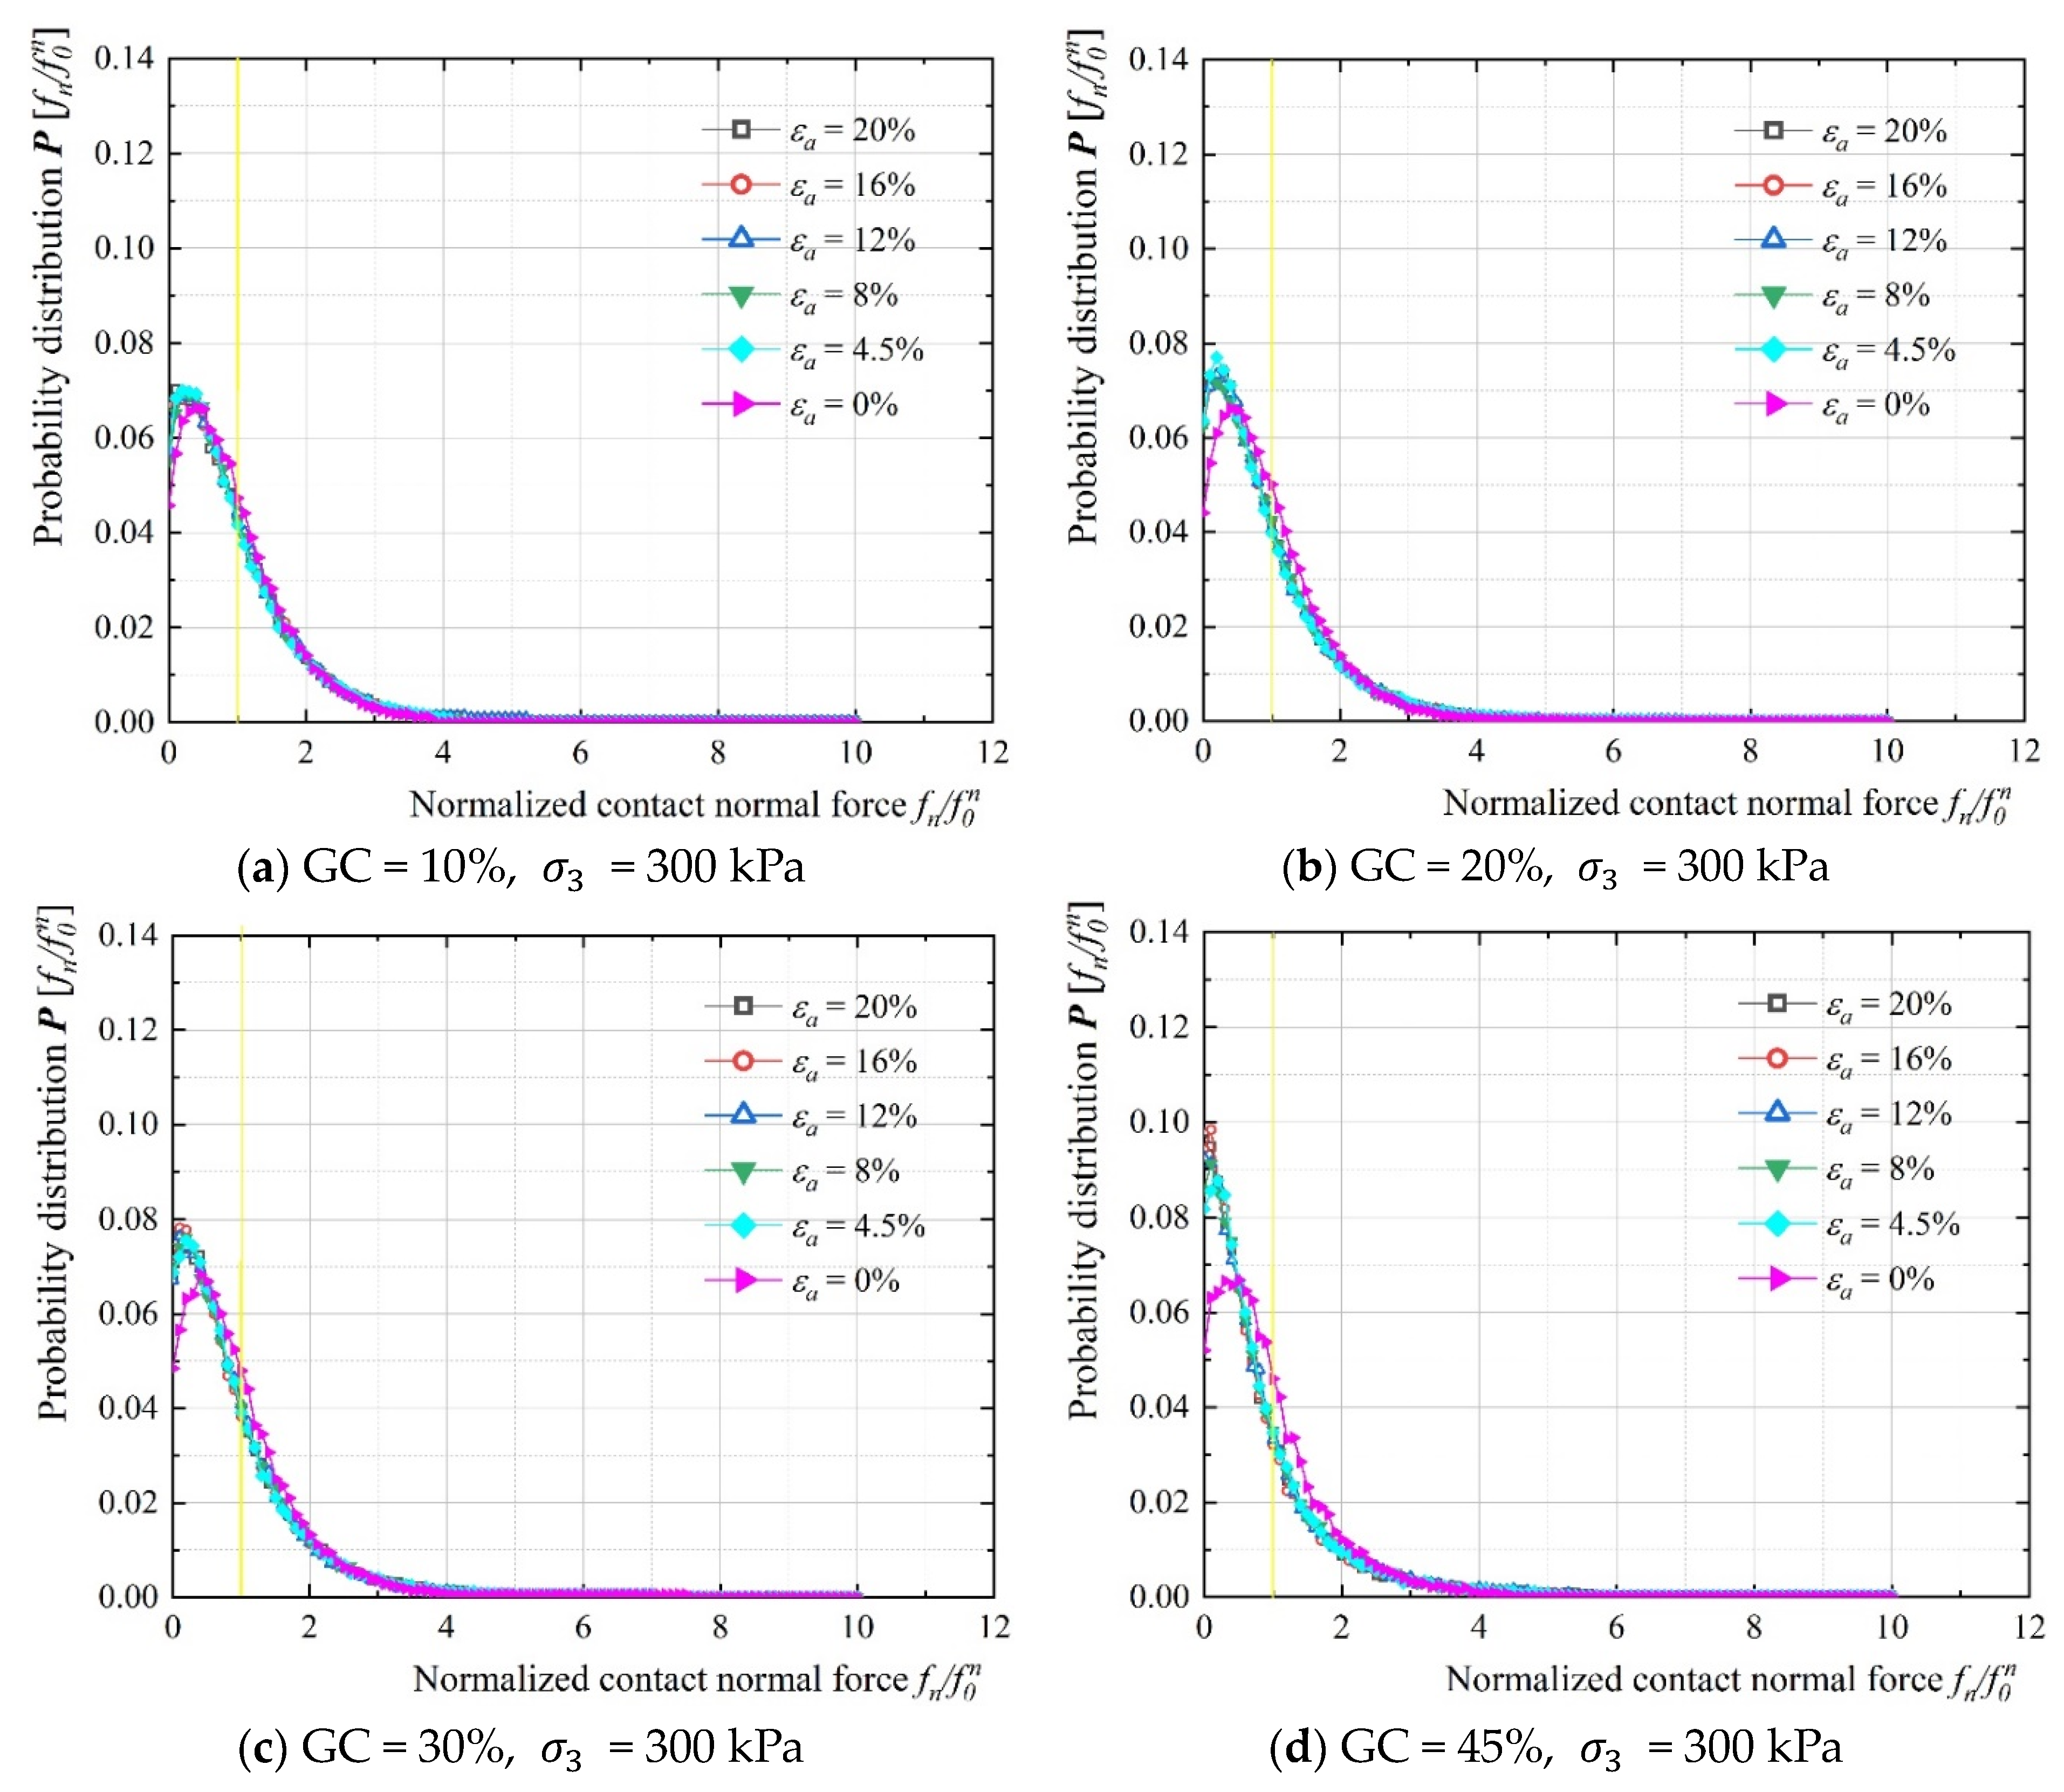
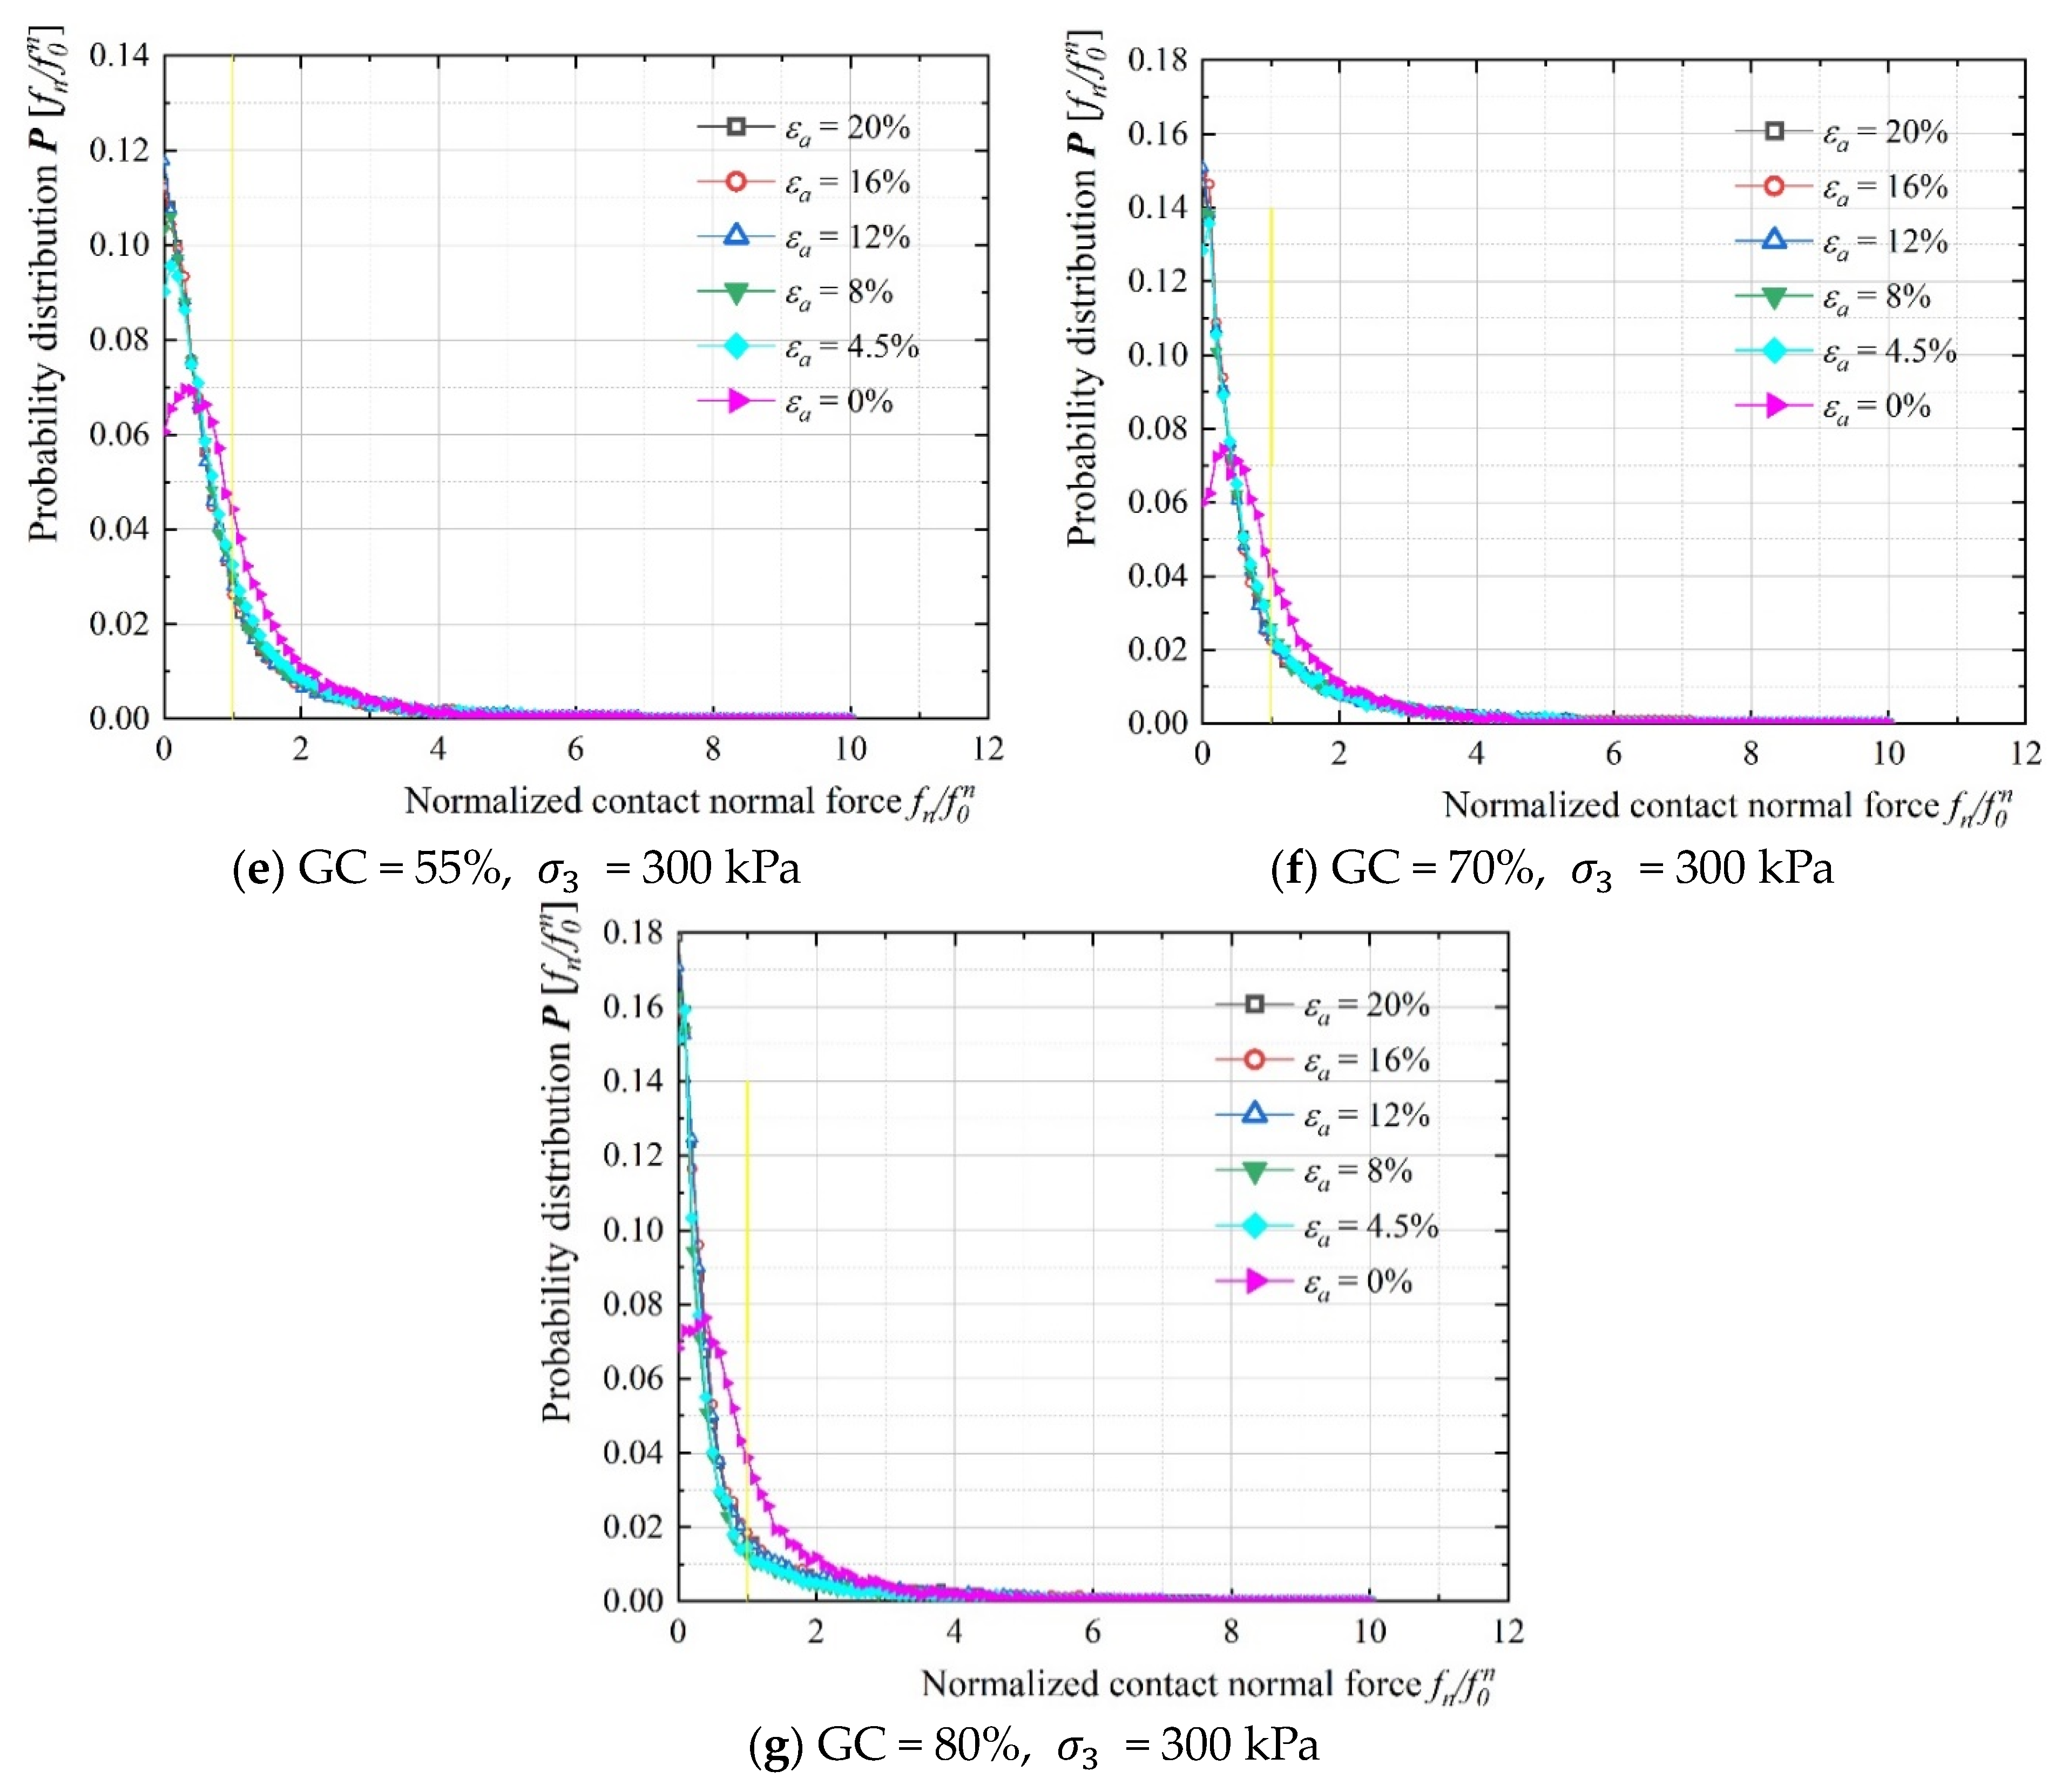
3.2.1. Probability Distributions of Contact Force

In this study, the distribution of contact forces under varying gravel contents is compared using a normalized approach. Specifically, the average contact force, f 0 n , within the specimen particles is determined using Equation (2). Subsequently, the contact forces between all granules in the specimen are normalized relative to this mean intuitive assessment. Radjai et al. [46] classified contact forces into two categories: strong and weak contact forces [68], based on the average contact force, f 0 n , within the granule system. By analyzing the distribution of strong and weak contact forces in S-RM samples with different gravel contents, this research aims to investigate the skeleton force chain system from a microscopic perspective.
f 0 n = f n s s + f n g s + f n g g N s s + N g s + N g g
where f n s s , f n g s , and f n g g denote the magnitudes of three distinct contact forces, while N s s , N g s , and N g g represent their corresponding frequencies.
The evolution of the contact force distribution in an S-RM specimen during the loading process is illustrated in Figure 8 under a consolidation pressure of σ 3 = 300 kPa. Upon isotropic consolidation, the normal contact forces within the system exhibit a Gaussian distribution, which remains unaffected by variations in gravel content. The distribution of the normal contact forces is primarily concentrated around the average contact force, f 0 n , with the highest density observed near this value. The yellow line in the figure represents the average contact force, f 0 n . During the loading phase, a significant alteration in the distribution of contact force density is observed: when the gravel content is less than 30%, the density of weak force chains is relatively low. According to Figure 9a, it is observed that the current state of the force chain skeleton in S-RMs is primarily constituted by the contact forces between sand particles. Due to the relatively low stiffness of these contact forces, the overall distribution of force chains remains relatively uniform. When sand particles predominate as the main component of the force chain skeleton, there are fewer weak force chains and a higher proportion of strong force chains (Figure 8a, P = 0.044; Figure 8b, P = 0.043; and Figure 8c, P = 0.042). As the gravel content increases, the integrity of the contact force chain begins to change significantly. Compared with the consolidated state, the number of strong chains decreases markedly (Figure 8d, P 0 = 0.05, P = 0.034; Figure 8e, P 0 = 0.045, P = 0.030). Specifically, when the gravel content exceeds 70%, the number of weak force chains increases sharply (Figure 8f, P = 0.020; Figure 8g, P = 0.010). In contrast to Figure 10a, in this scenario, gravel clumps form the dominant force chain skeleton through contact forces, resulting in high stiffness but limited quantity, leading to a significant increase in weak contact density. When comparing S-RM specimens with different gravel contents, the distribution probability of contact forces between sand and gravel exhibits similar patterns during the loading process and isotropic consolidation. Although the distribution pattern of strong chains shows a consistent trend, the distribution probability of weak chains varies. Therefore, by calculating the interval of the probability density function values of weak force chains, the primary components of the force chains in samples with different gravel contents can be distinguished.

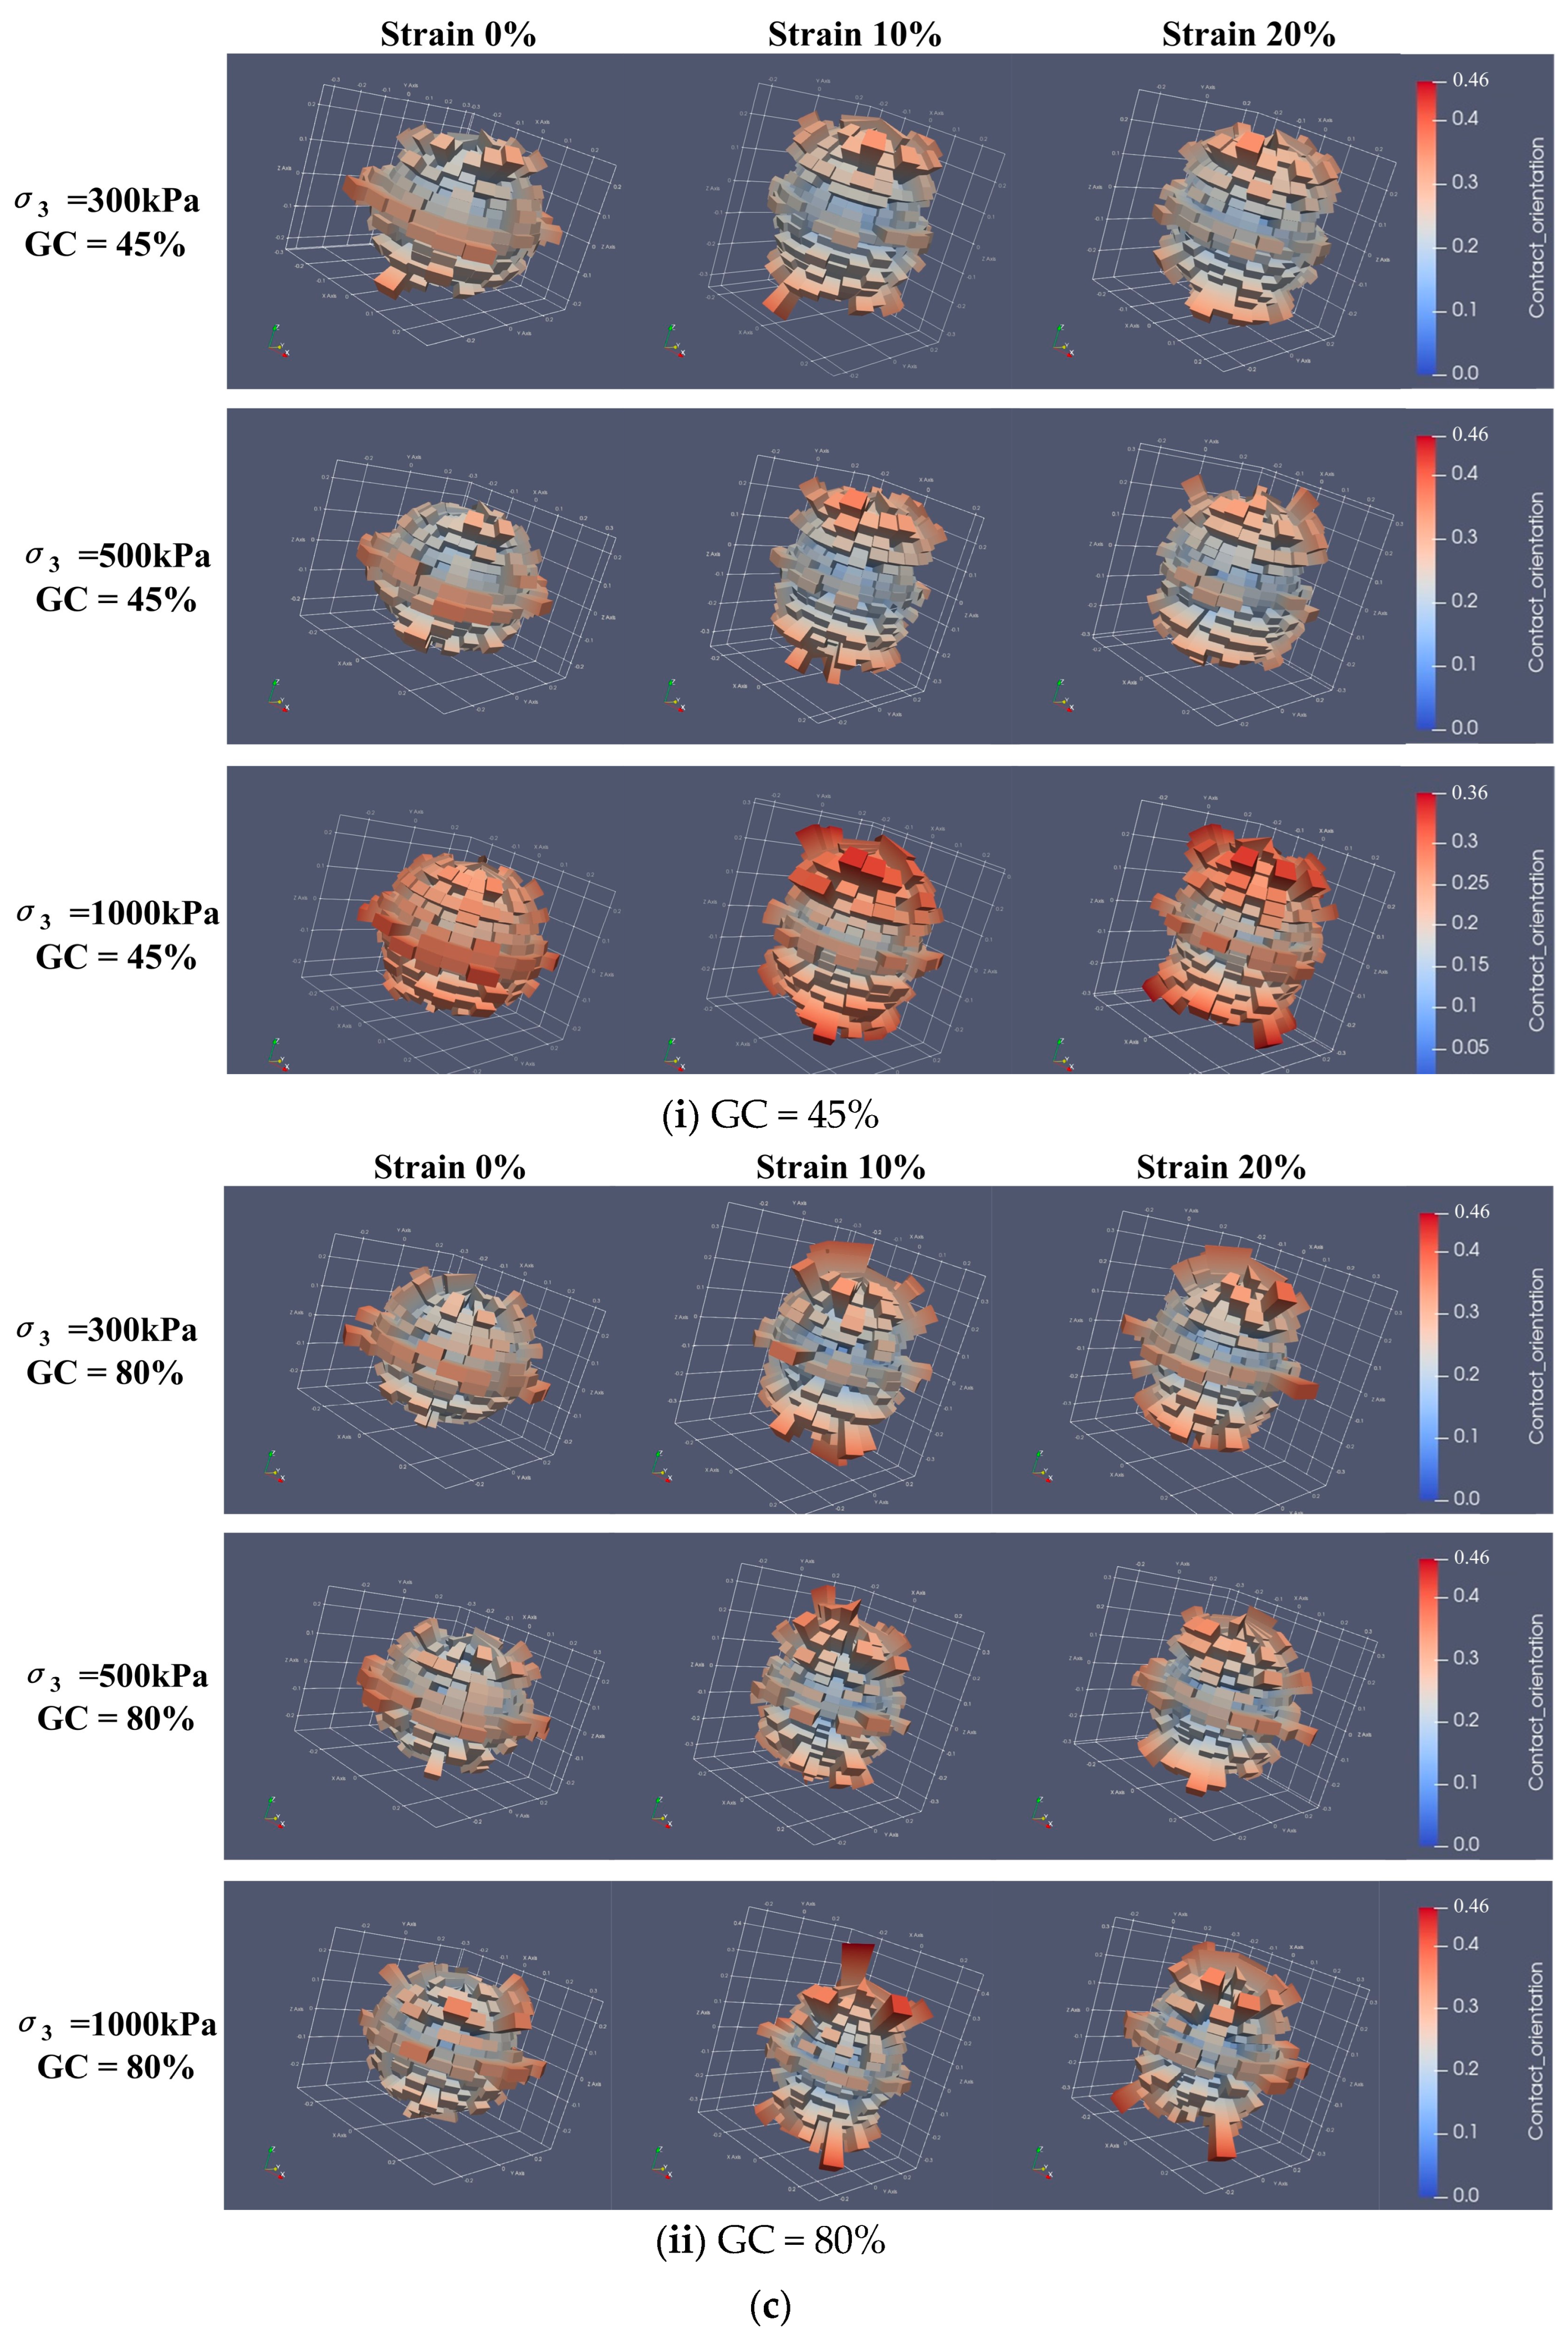
3.2.2. Three-Dimensional Polar Distributions of the Branch Vector Orientations

Figure 9 illustrates the three-dimensional polar distribution of branch vector orientations for various types of contact forces derived from numerical simulation results. The branch vector is used to identify and characterize contact forces between colliding particles [68], even when multiple contact points exist between them. In DEM simulations, statistical methods can systematically analyze the magnitude, direction, and type of contact forces between particles. Some researchers [69] have to adjust the contact force origins in gravel to accurately capture the contact forces from aggregates rather than pebbles, thereby enhancing the credibility of numerical results by repositioning the source of the contact forces to the center of the aggregates. However, in this study, due to the diverse characteristics of contact forces generated by binary-medium materials—including variations in contact type and stiffness—the contact forces from filling particles (pebbles) are treated as those originating from gravel clumps, with the sources of these contact forces being the centers of the filling pebbles rather than the gravel clumps, as illustrated in the simplified schematic diagram (Figure 9a).
Figure 9b illustrates the three-dimensional polar coordinate distribution of branch vector orientations under identical consolidation conditions ( σ 3 = 1000   k P a ) for various gravel contents, with color intensity indicating the proportion. After isotropic consolidation, the branch vectors exhibit isotropy and are uniformly distributed throughout the material. As the loading process progresses, the distribution pattern of the branch vectors gradually transitions from an isotropic state to a concentration along the vertical direction, consistent with the predefined test loading path, as observed by Wu et al. [57]. When the contact force chain skeleton is predominantly formed between sand particles (S–S), the predominance of sand particles (GC = 10%, 20%, and 30%) results in an increased number of contact forces within the specimen, leading to a top-to-bottom force chain skeleton. At this stage, the distribution frequency in the horizontal direction decreases significantly, while that in the vertical direction increases markedly. As the gravel content increases (GC = 45%, 55%), when the contact force chain skeleton is mainly composed of interactions between gravel clumps and sand particles (G–S), although the distribution remains predominantly vertical, the frequency of horizontal distribution slightly increases. When the contact force chain skeleton is primarily constituted by the contact forces between gravel clumps (G–G) (GC = 70%, 80%), the disparity in the distribution frequency of the vectors in the vertical and horizontal directions is notably reduced. The primary reasons for this phenomenon are twofold. First, in S-RMs with similar void ratios, as the gravel content increases, the sand particle content significantly decreases, leading to a substantial reduction in the number of contact forces generated by particle collisions. This results in decreased overall homogeneity and increased singularity of the mixture. Second, the distribution of the branch vectors of the contact forces between gravel and sand, as well as between gravel clumps, undergoes a slight shift towards the horizontal direction. As the gravel content increases, this shift is attributed to changes in the main body of the contact force chain skeleton, thereby causing variations in the distribution of the contact force branch vectors. Figure 9c presents the distribution of the contact force branch vectors under different consolidation pressures ( σ 3 = 300 ,   500 ,   a n d   1000   k P a ) for the duplicate gravel content. The results indicate that varying consolidation pressures have a minimal effect on the three-dimensional distribution pattern of the contact force branch vectors, primarily influencing the total number of contact forces. This phenomenon can be attributed to the increased specimen density resulting from higher consolidation states.

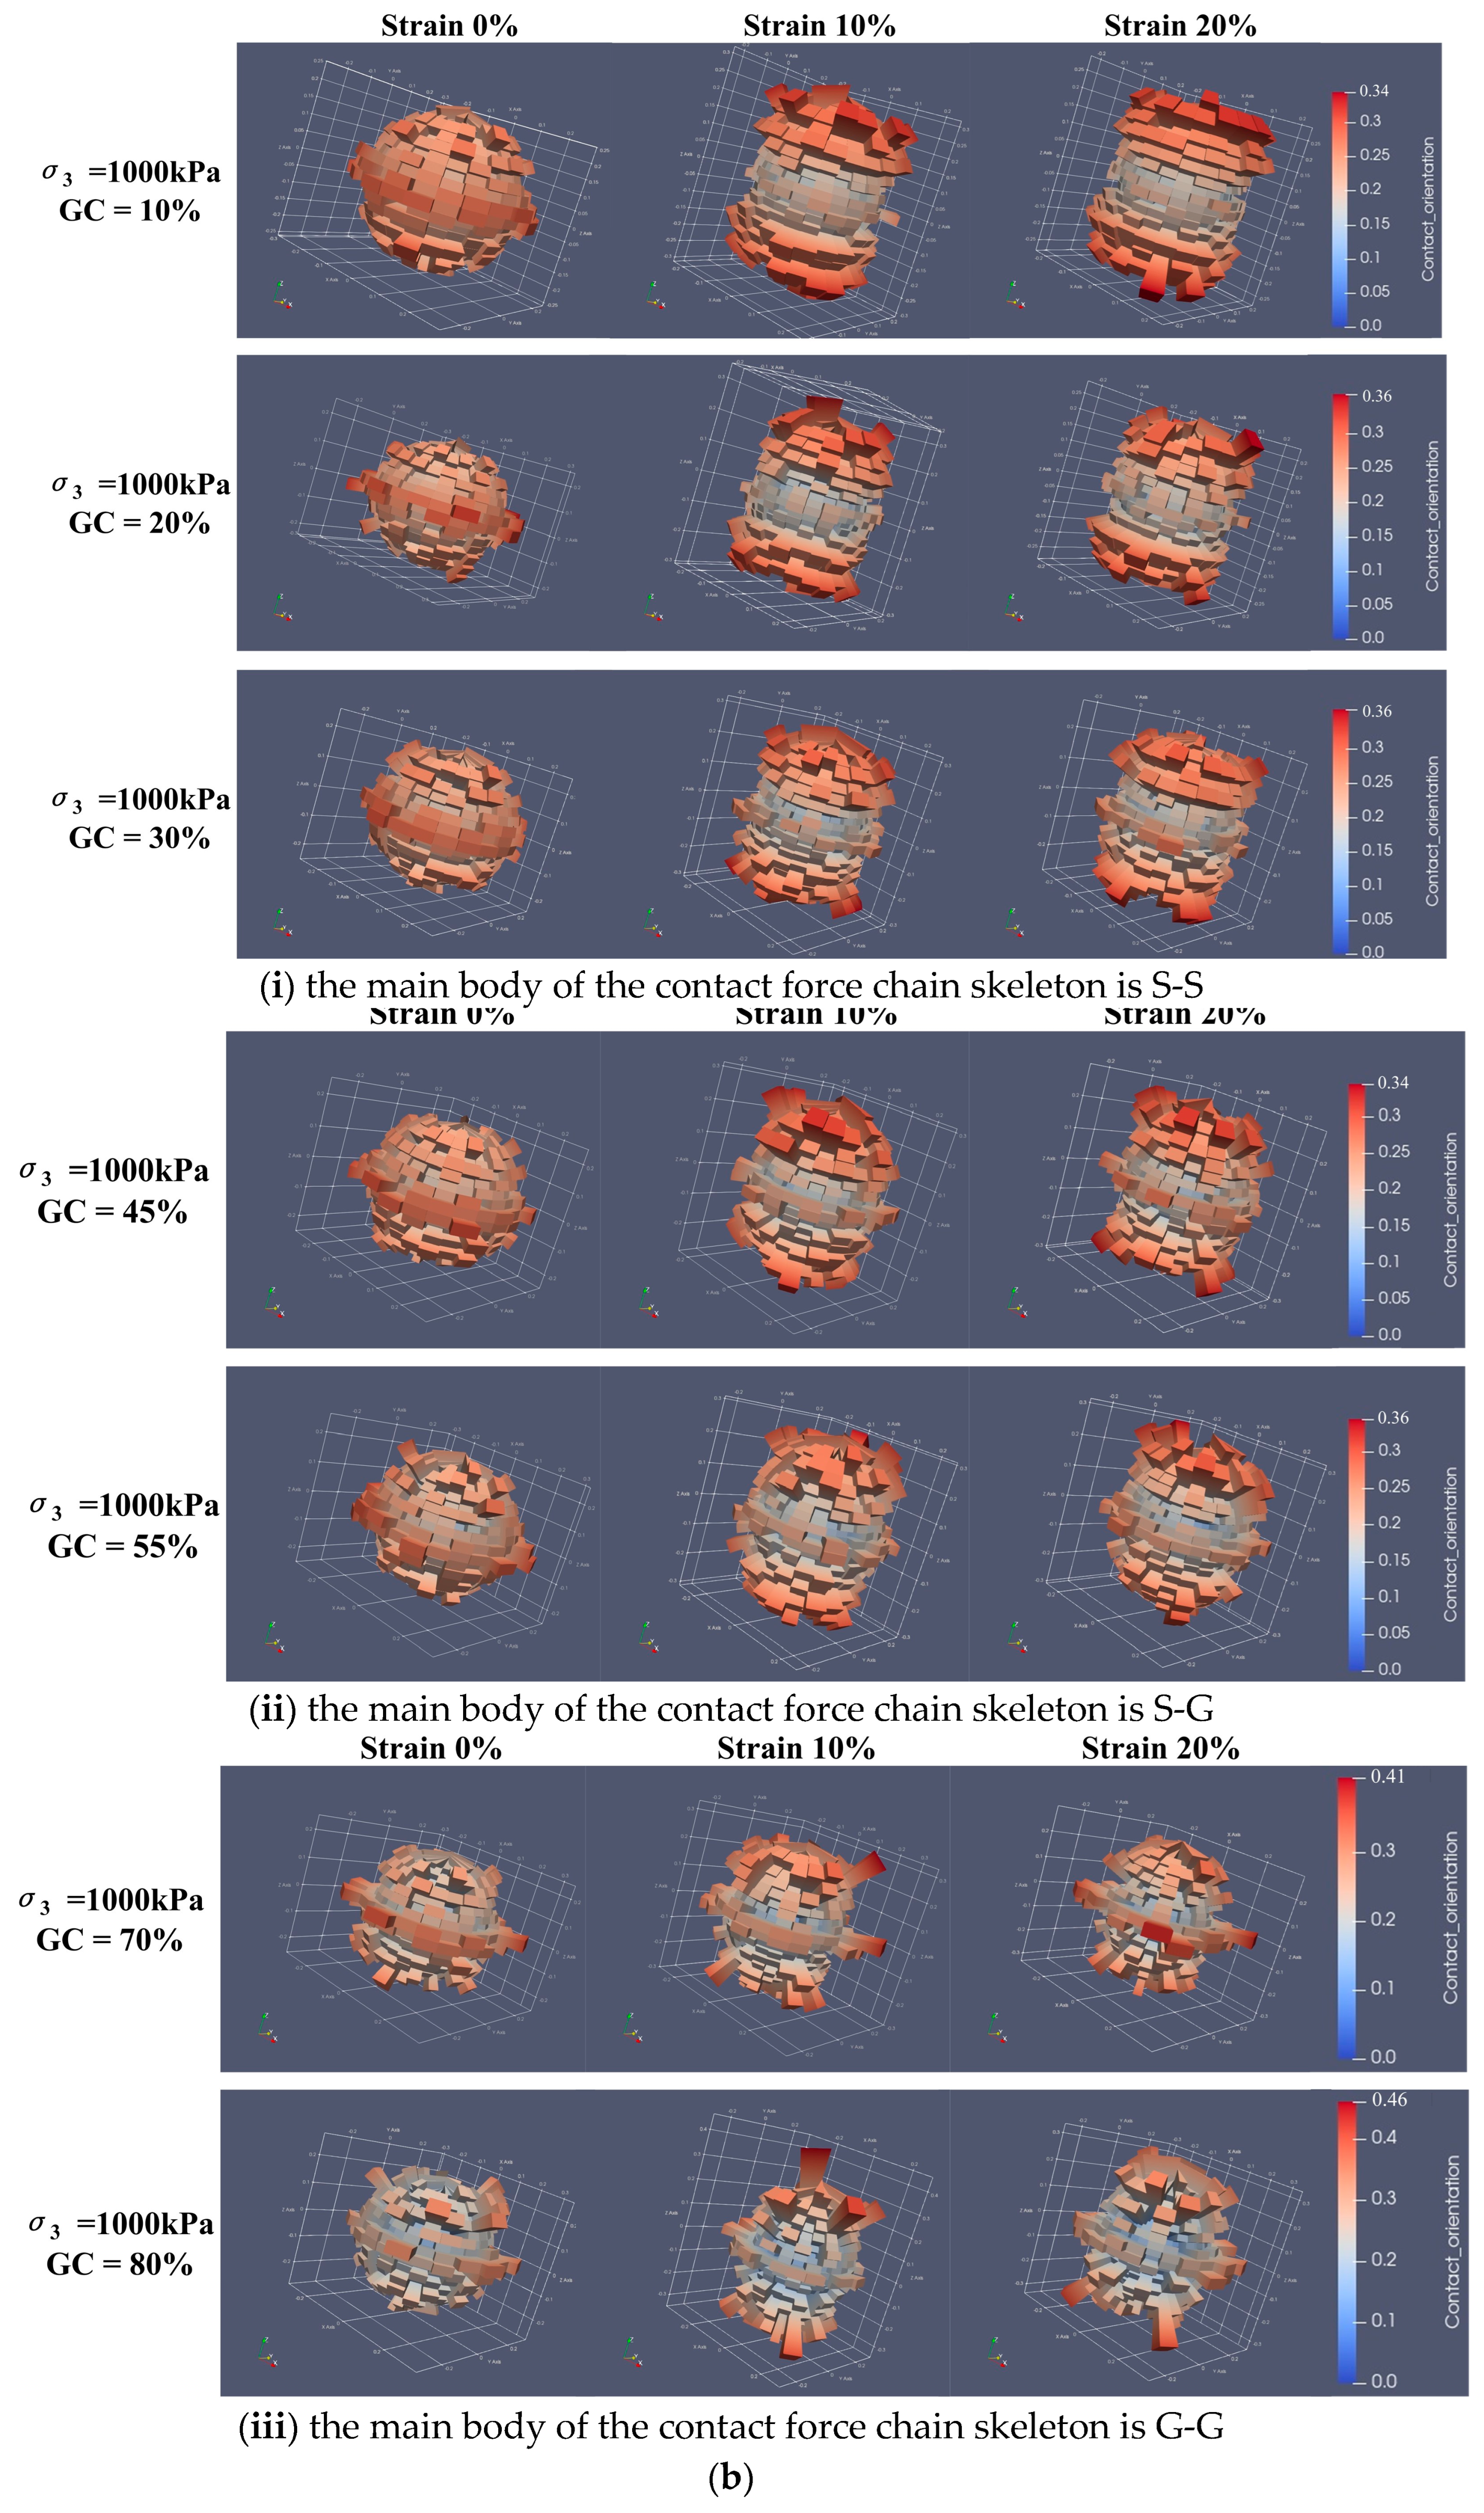
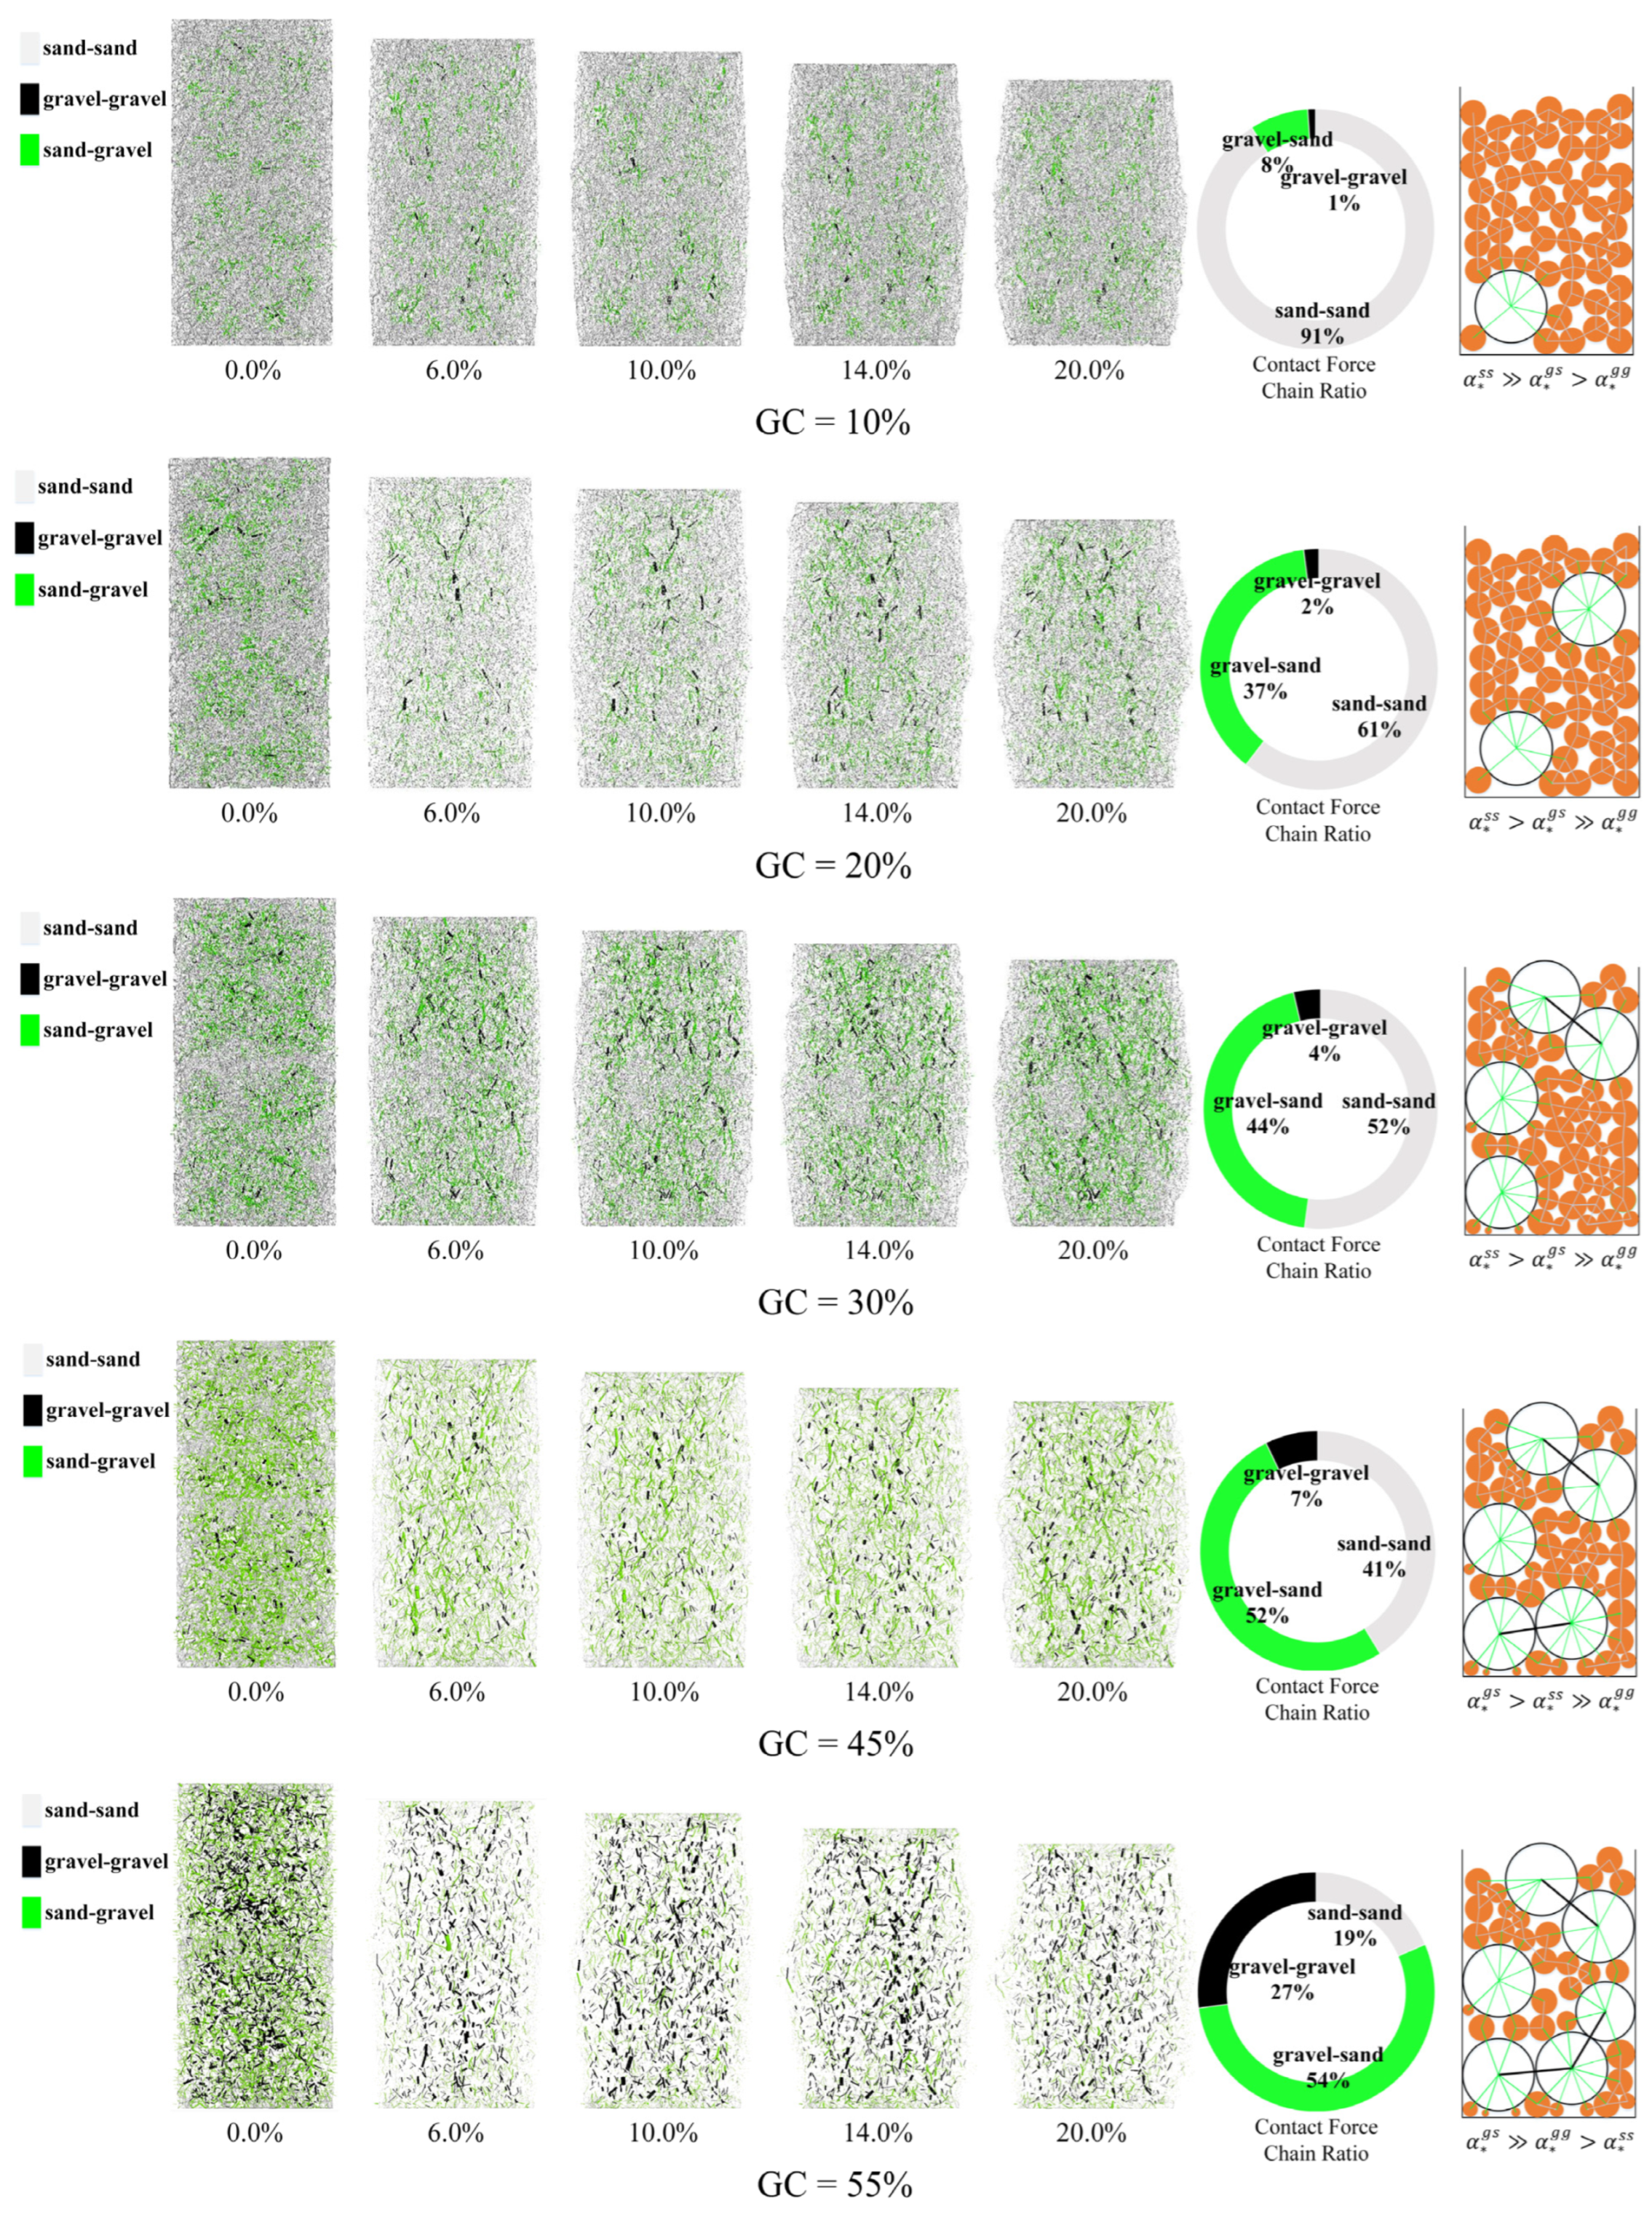
3.2.3. Contact Chain Skeleton Distributions of Contact Forces

Leveraging the advantages of visualizing granular contacts through the DEM, Figure 10a illustrates the evolution of contact force chains during shearing processes in specimens with varying gravel proportions consolidated at a pressure level of 300 kPa—notably, the simulation results at consolidation pressures of 500 kPa and 1000 kPa exhibit consistent patterns. To provide a more comprehensive understanding of the role played by gravel in particle interaction, Equation (3), as detailed by Zhu [70], was employed to calculate the stress distribution within the contact network. The resulting percentage contributions are visually depicted in Figure 10b. In this figure, distinct colors represent specific types of contact forces: black indicates inter-clump contact forces between gravel clumps, green signifies contact forces between gravel and sand, and white denotes inter-sand particle contact forces. The thickness of the contact force chains reflects their relative magnitude after homogenization: robust contact forces are represented by thicker chains, whereas thinner chains indicate minor contact forces. The force chain distribution method [2] has become a widely adopted microscopic approach for elucidating the shear behavior of S-RMs.
q p = ξ g g α * g g + ξ g s α * g s + ξ s s α * s s
where q is the deviatoric stress; p is the effective mean stress; ξ g g , ξ g s , and ξ s s represent the weight parameters associated with three contact forces; and α * g g , α * g s , and α * s s are the anisotropy coefficients of the three classifications of contact force.
Upon a meticulous examination of Figure 10a, it is evident that the specimen has undergone complete consolidation, and the size and distribution of contact force chains between particles exhibit a relatively homogeneous nature, indicative of an isotropic state of consolidation. As axial strain increases, contact force chains in the specimen gradually accumulate from the loading direction (top-down) to form a predominant top-down contact force chain skeleton, aligning with the macroscopic loading path. When the gravel content in the S-RM is low (GC = 10%, 20%, and 30%), sand particles dominate the primary force chain subnetwork within the specimen, resulting in the mechanical properties of the S-RM being predominantly governed by these sand–sand (S–S) interactions. With an increase in gravel content (GC = 45% and 55%), the primary loading–bearing force chain shifts to being supported by contact forces between gravel clumps and sand particles (G–S). Consequently, the mechanical characteristics of S-RMs are significantly influenced by these G–S interactions. When the gravel content is high (GC = 70% and 80%), the dominant force chain skeleton is primarily provided by the interlocking forces between gravel clumps (G–G). Therefore, the mechanical properties of gravel become pivotal factors in determining the overall mechanical behavior of S-RMs.
Based on the data presented in Figure 6, it is observed that when the gravel content is 20% (GC = 20%), the strength of the specimen is comparatively lower than that of S-RMs with GC = 10% and 30%. This discrepancy arises from variations in the composition of force chains within the main body skeleton owing to changes in gravel content. Specifically, at a gravel content of 10%, sand particles primarily bear the load and maintain a clear and well-defined main body skeleton structure. However, as the gravel content increases, alterations in force chain distribution lead to a less distinct main body skeleton, resulting in reduced shear strength. The contact stiffness, k g s n , between gravel clumps and sand particles is greater than the contact stiffness, k s s n , among sand particles. Consequently, while specimens containing 30% gravel exhibit an unclear primary force chain structure, those formed by gravel–sand interactions demonstrate superior strength compared to those formed by sand–sand interactions. Therefore, their shear strength slightly exceeds that of S-RM specimens with 20% gravel content. As the gravel content increases, the contact force chain comprising gravel clumps and sand particles assumes a dominant role as the primary structural framework of the specimen, thereby augmenting its shear strength. Once the gravel content surpasses 70%, an extensively developed backbone force chain emerges via gravel-to-gravel contact forces, leading to a substantial enhancement in strength.
The macroscopic mechanical behavior of S-RMs can be better understood through the analysis of their microscale force chain skeleton system. Specifically, a more pronounced and well-defined main body within this skeletal force chain enhances the overall macroscopic mechanical properties of the mixtures. Furthermore, an increase in the strength of this primary structure results in corresponding improvements in their macro-behavior performance.

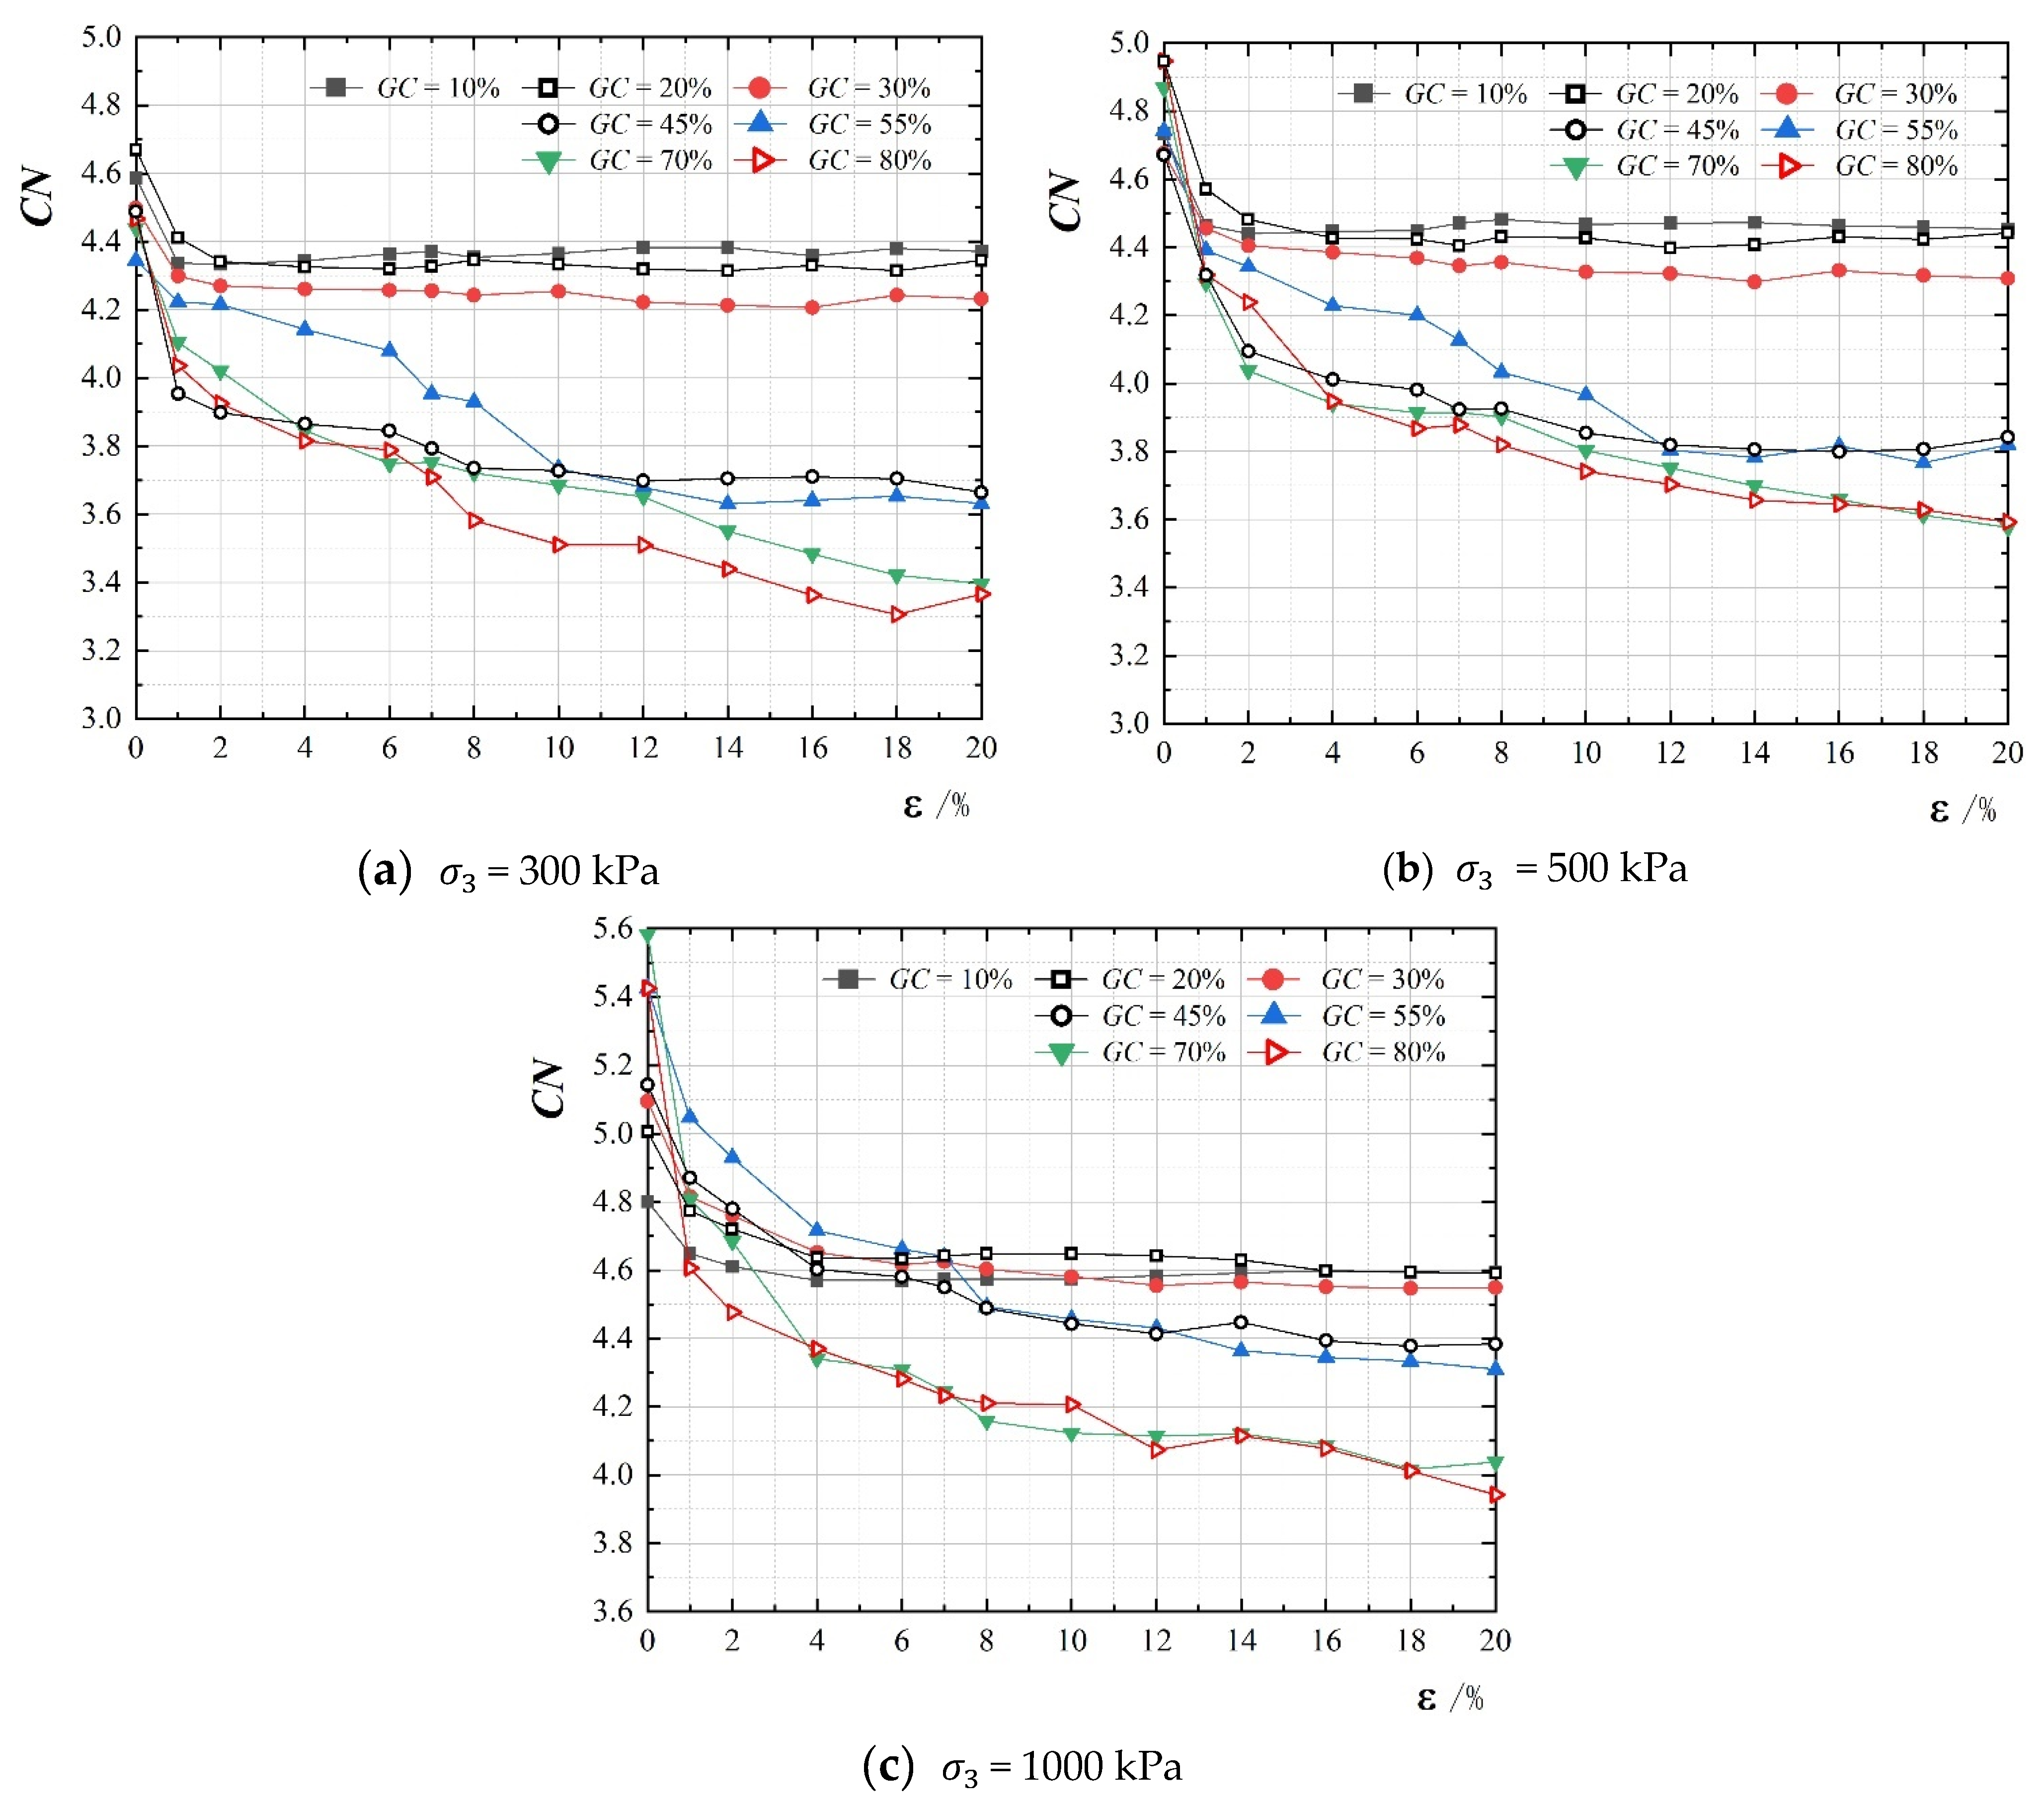
3.2.4. Analysis of Fabric Tensor in Contact Force Chain Skeletons

Under the influence of a continuous load, particles within the particulate-medium material system undergo translational or rotational adjustments to achieve overall stabilization of the specimen. During this process, the granule arrangement within the specimen exhibits various configurations in response to loading effects, resulting in diverse microstructures.
Laboratory test data from numerous scholars have indicated that granular soil exhibits significant anisotropy in its mechanical behavior upon reaching the critical state [67,68]. Additionally, studies by other researchers [69] have shown that granular materials display distinct anisotropic structures when in the same consolidation state during the critical state. Given the multiphase nature of S-RMs and their substantial research significance, this study selects the average coordination number (CN) and the anisotropy coefficient ( a r ) to investigate the intrinsic relationship between the fabric characteristics and the main contact force chain skeleton of S-RM specimens at the critical state.
  • The average coordination number, CN:
The variation in the average coordination number (CN) of S-RM specimens under different gravel contents and confining conditions ( σ 3 = 300 kPa, 500 kPa, and 1000 kPa) during shearing is illustrated in Figure 11. This study identifies three local contact modes between gravel clumps and sand particles: the contact between gravel clumps ( f g g ), the contact between gravel clumps and sand particles ( f g s ), and the contact between sand particles ( f s s ). The average coordination numbers, C N g g , C N g s , and C N s s , for these partial contact forces can be calculated using Formula (4), provided by Zhu [70]:
C N = C N g g + C N g s + C N s s
C N g g = 2 N g g / N g
C N g s = 2 N g s / N g + N s
C N s s = 2 N s s / N s
where N g and N s are the numbers of gravel clumps and sand particles, respectively. The average coordination number remains relatively constant under similar consolidation pressures during compaction. However, varying states of consolidation pressure result in distinct differences in the particle structure of S-RMs, indicating a more tightly packed arrangement under higher confining pressure. During the shear process, the average coordination number of the S-RM samples rapidly decreases within a small strain range before stabilizing. This trend is closely associated with an increase in gravel content and is independent of the initial consolidation state.
Moreover, the increase in gravel content is associated with a decrease in the stable average coordination number of the specimen. This can be attributed to the agglomeration of larger particle clumps, leading to a reduction in fine particles (such as sand particles) within the void structure and subsequently diminishing the number of inter-particle contacts formed in localized areas inside the specimen. Detailed observations from Figure 11a–c show that the S-RMs with sand as the primary particle framework (GC = 10%, 20%, 30%) rapidly achieve mechanical stability within a limited strain range ( ε   2%), demonstrating consistent stability values. As gravel content increases, the primary load-bearing framework shifts to contact forces generated within the gravel clumps and sand particles (GC = 45%, 55%). Consequently, the time required for the average coordination number to stabilize increases ( ε   12%), while characteristic CN values remain consistent in this stabilized condition. When the primary load-bearing force within the skeletal force chain is sustained by contact forces between gravel clumps (GC = 70%, 80%), the average coordination number reaches its equilibrium state last and exhibits minimal stability. This phenomenon remains unaffected by consolidation pressure. The observed behavior can be attributed to an inverse relationship between the gravel clump and sand particle content within a constant-density S-RM, resulting in pronounced specimen heterogeneity. Additionally, irregularities in gravel shapes contribute to unstable internal contact forces. These findings underscore that skeletal structure significantly influences the stability characterization value of the average coordination number (CN), whereas consolidation pressure exerts a comparatively minor impact. Consequently, these observations unequivocally demonstrate that the average coordination number serves as a reliable indicator of the critical state within the particle material and delineates the primary composition of the force chain skeleton.
  • The fabric anisotropic coefficient, a n :
The microscopic examination of fabric and its evolution plays a pivotal role in analyzing the mechanical response of granular materials—this analysis is an indispensable element for establishing constitutive relationships and elucidating fabric anisotropy. The quantification of fabric is typically achieved through the utilization of the average fabric tensor, F, which must be defined and linked to the statistical distribution of unit vectors along the principal axis of elongated particles, contact normal directions, void vectors, scan line directions, or other micro-mechanically oriented entities. In the numerical model, granule materials consist exclusively of rigid particles or clumps, facilitating inter-particle interaction via contact forces within confined contact areas, resulting in three distinct types of contacts ( f n s s f n g g , and f n g s ). At the microscale, the interaction between particles or clumps involves significant characteristic quantities such as contact force and relative displacement. For multiple agglomerates of rigid clumps and particles in contact (refer to Figure 12), the vector connecting the centers of the collision particles is denoted as l i c , and the unit normal vector corresponding to the contact is represented by n i c . Due to irregular shapes of gravel clumps, the contact normal vector is orthogonal to the contact surface, and the orientation of the contact force c in the direction α i c is defined as the angle between the contact normal and the XY plane.
The distribution of contacts can be characterized using symmetric second- or fourth-order tensors [71]. In this study, second-order tensors are preferred due to their simplicity and sufficient precision in capturing the principal characteristics of anisotropy. The structure tensor, F i j , is defined as follows:
F i j = 2 N g + N s c C n i c n j c
where N g + N s denotes the total number of sand particles and gravel clumps in the specimen; the contact set, C, is the aggregate of the contact force, c. n i c is the cth unit contact normal vector. F i j is a symmetric tensor with the first trace, t r ( F i j ) = 1 . On the other hand, the second-order tensor, F i j , can also be expressed in integral form through probability density, f ( n ) , as presented in Equation (6):
F i j = n f ( n ) n i n j d n
In three dimensions, the probability density function of the entity distribution can be expressed as Equation (7), which is derived from a truncated second-order Fourier expansion [72]:
f ( n ) = 1 4 π 1 + G i j n i n j
where G i j is deviatoric and symmetric, referred to as the deviatoric fabric tensor. The tensor, G i j , can be calculated based on the second-order structure tensor, F i j :
G i j = 15 2 F i j 1 3 δ i j
Consequently, the structure tensor, F i j , represents the average orientation vector, n c , associated with three modalities of intermolecular contact force chains. The dimensionless fabric anisotropy tensor, G i j , widely utilized in the literature [73], is directly proportional to a partial component of the fabric tensor, F i j . Notably, G i j scales with a specific volume, as suggested by Dafalias [74]. The norm a n (scalar), which quantifies fabric anisotropy, and the direction tensor n G of fabric tensor G i j are defined as follows:
a n = G i j : G i j
G i j = a n n G
where the direction tensor n G satisfies n G : n G = 1 and tr ( n G ) = 0.
Figure 13 illustrates the evolution of the contact normal anisotropy coefficient ( a n ) for S-RM specimens during shear loading under varying gravel contents and consolidation pressures. The anisotropy coefficient, a n , of all S-RMs exhibits a pronounced initial upward trend induced by loading, particularly evident at a gravel content of 20%. This behavior remains consistent across different consolidation states. Upon reaching a specific axial strain ( ε > 16%), the characteristic values of contact normal anisotropy, a n , stabilize significantly, with substantial differences observed among these stable values. This indicates that the specimens have entered a critical state, although the characteristics of this critical state vary considerably depending on the gravel content.
Upon a meticulous examination of Figure 13, it is evident that the contact normal anisotropy characteristics of the specimens tend to exhibit uniformity as the gravel content in the S-RM varies at 10%, 20%, and 30%. This observation is further supported by the skeleton distribution of the contact force chain depicted in Figure 10a, reaffirming that the primary structure of the soil–rock sample’s skeleton predominantly comprises contact forces between sand particles ( f n s s ) at these gravel contents. Furthermore, there is a discernible trend toward consistent evolution of contact normal anisotropy characteristics when gravel–sand contact forces ( f n g s ) become predominant (GC = 45%, 55%) or when gravel–gravel contact forces ( f n g g ) take precedence (GC = 70%, 80%). These findings highlight the importance of understanding how variations in gravel content affect both the structural composition and mechanical behavior of S-RMs. Simultaneously, it has been determined that the sand particles, serving as the primary constituent of the contact force chain skeleton, exhibit the highest and most stable anisotropic characteristic values. Additionally, the contact forces generated between gravel clumps and sand particles form the structural framework of the contact force chain skeleton. Conversely, specimens with gravels as their main skeletal component demonstrate lower and more stable anisotropic characteristic values.
This observation indicates that the stability of anisotropic characteristics in S-RM specimens exhibits a weak correlation with gravel content and consolidation pressure but a strong correlation with the composition of the primary contact force chain. Consequently, it can be inferred that the micro-mechanical characteristics of S-RMs are predominantly influenced by the structure and distribution of the contact force chain skeletons within the specimens.

4. Conclusions

Utilizing flexible boundary loading conditions, this study conducted discrete element numerical simulations of triaxial drainage shear tests on irregularly shaped S-RMs with varying gravel contents and consolidation confining pressures. The irregularly shaped gravels were generated by CT scanning technology and pebble filling algorithms, aiming to more accurately replicate the geometric characteristics of natural geological materials. The study primarily focused on the comparative analysis of macroscopic mechanical behaviors of S-RM specimens during the loading process, particularly the macroscopic failure patterns, shear band evolution, and shear resistance capacity, as well as the microscopic contact force distribution, composition of the contact force chain skeleton, and evolution of fabric tensor characteristic quantities. The findings indicate that this integrated approach has made significant advancements in understanding the mechanical behavior of binary granular materials, extending beyond S-RMs:
(1)
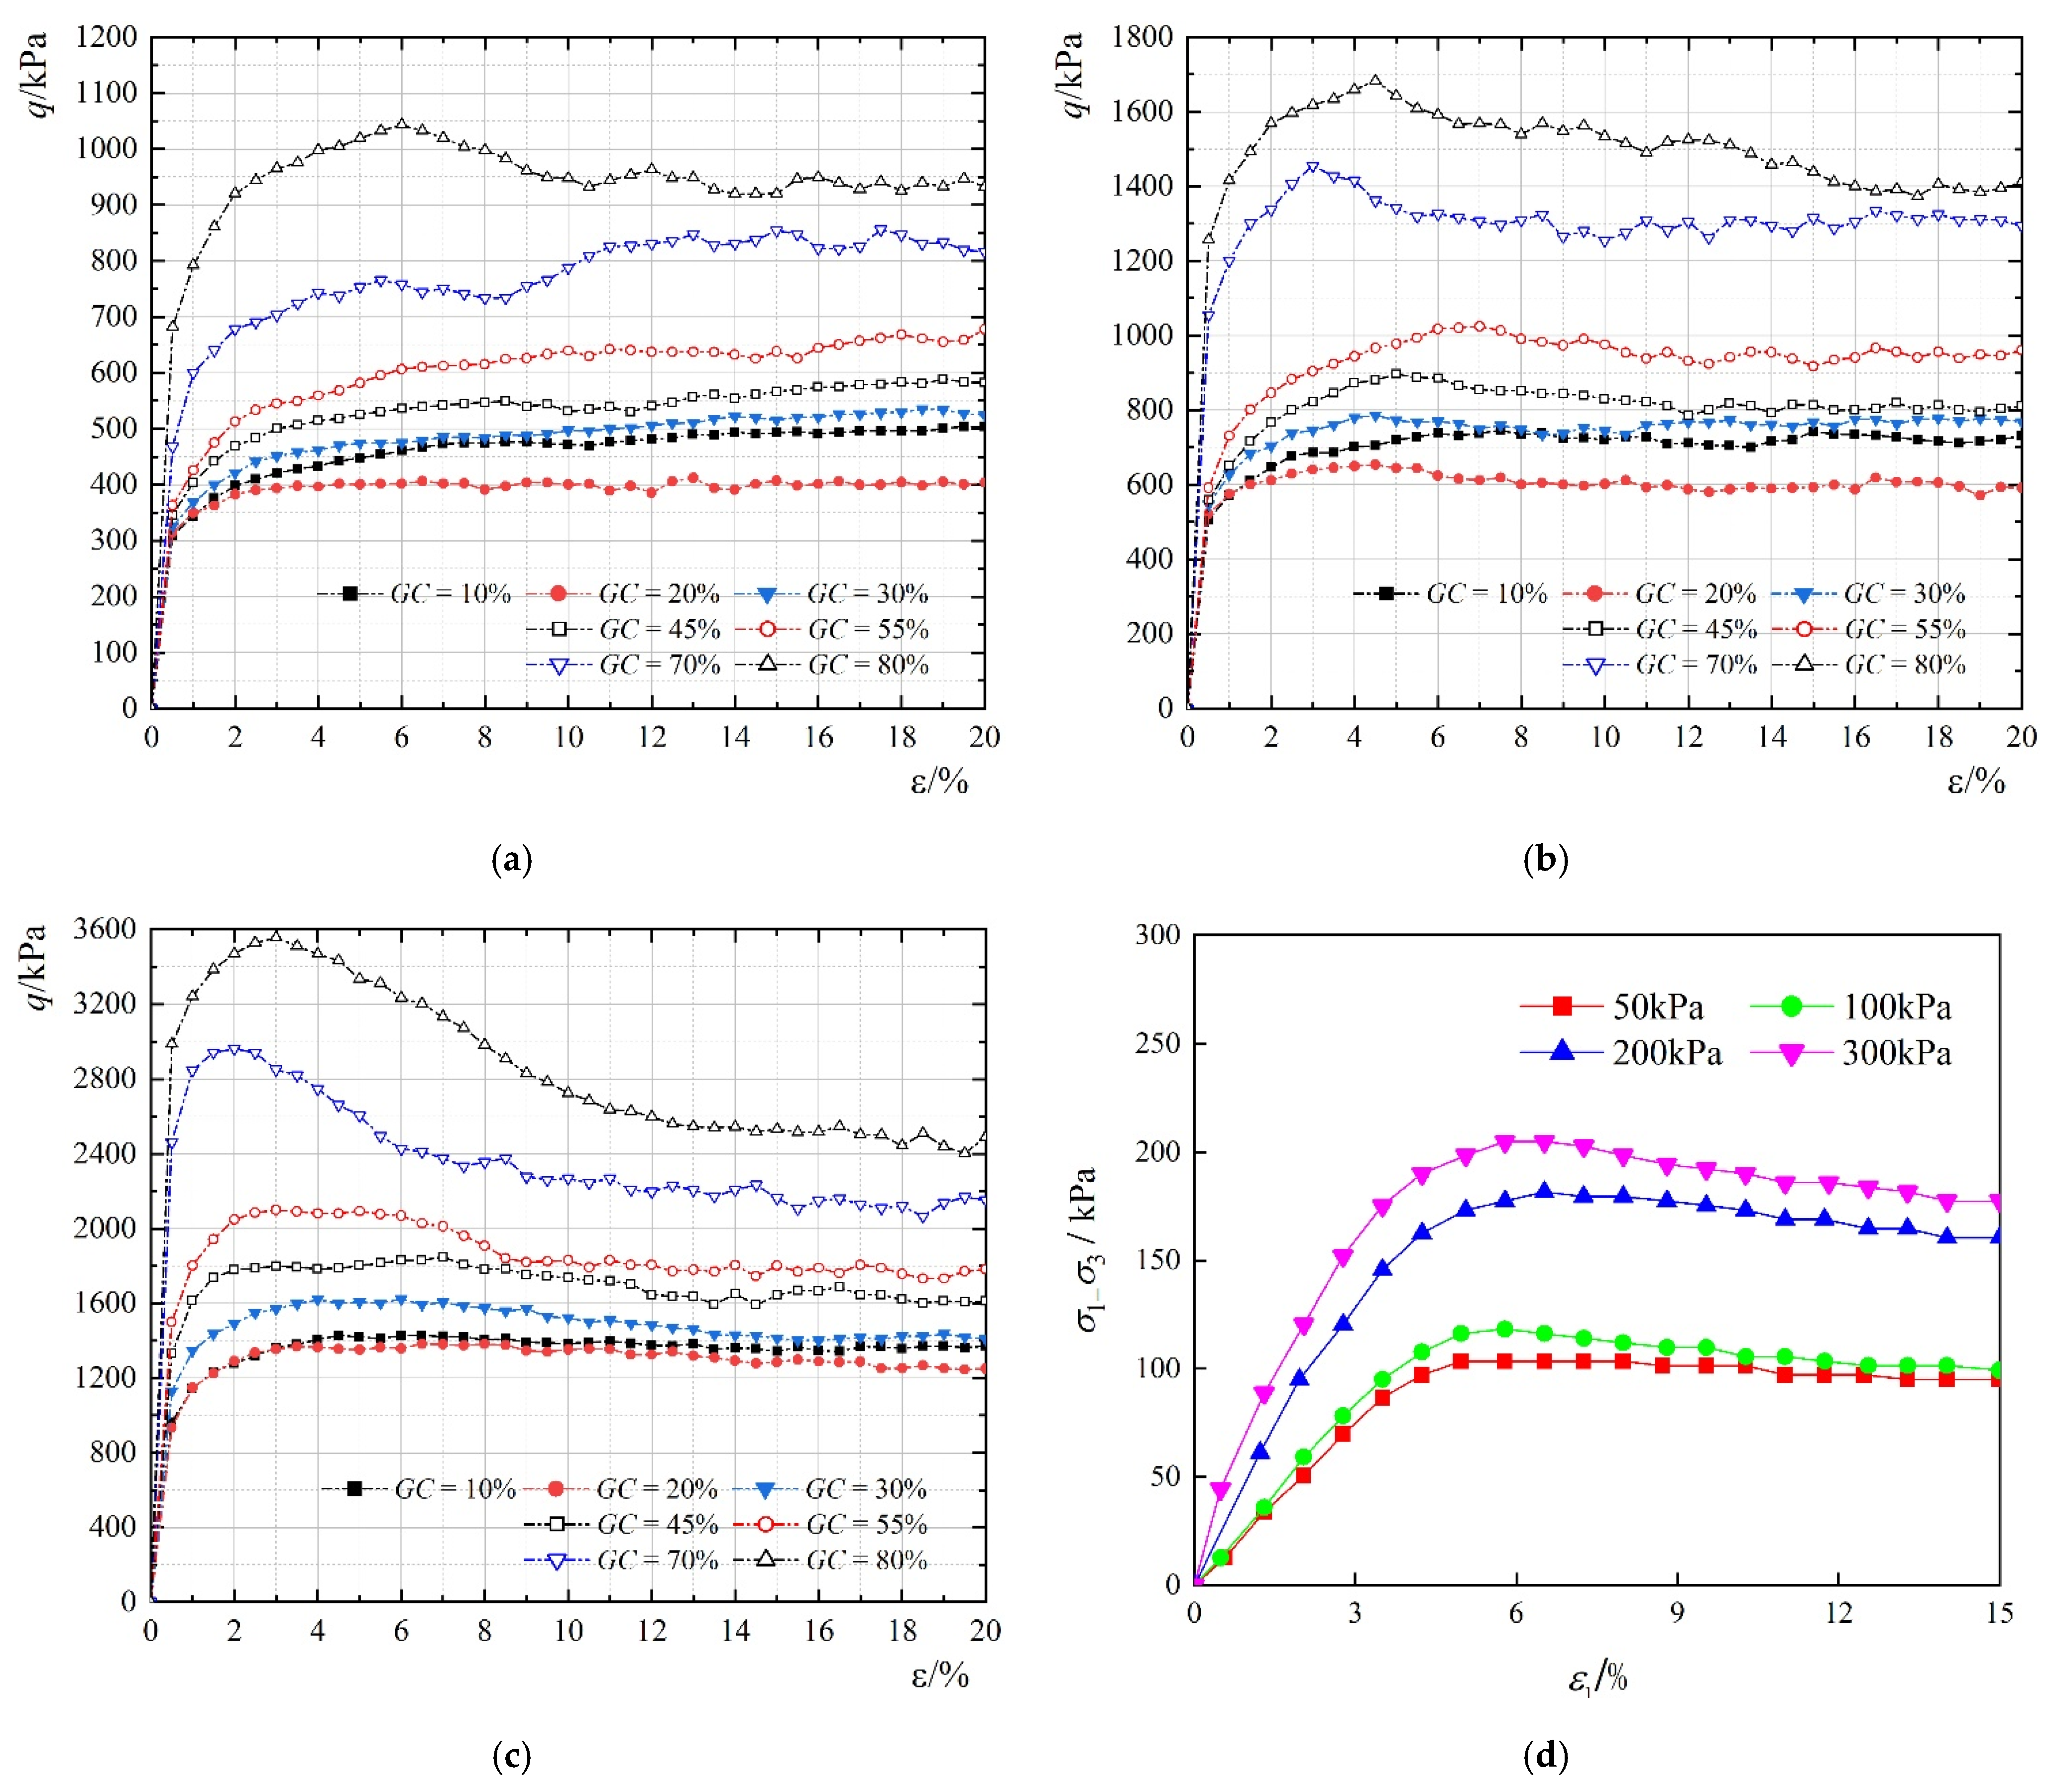
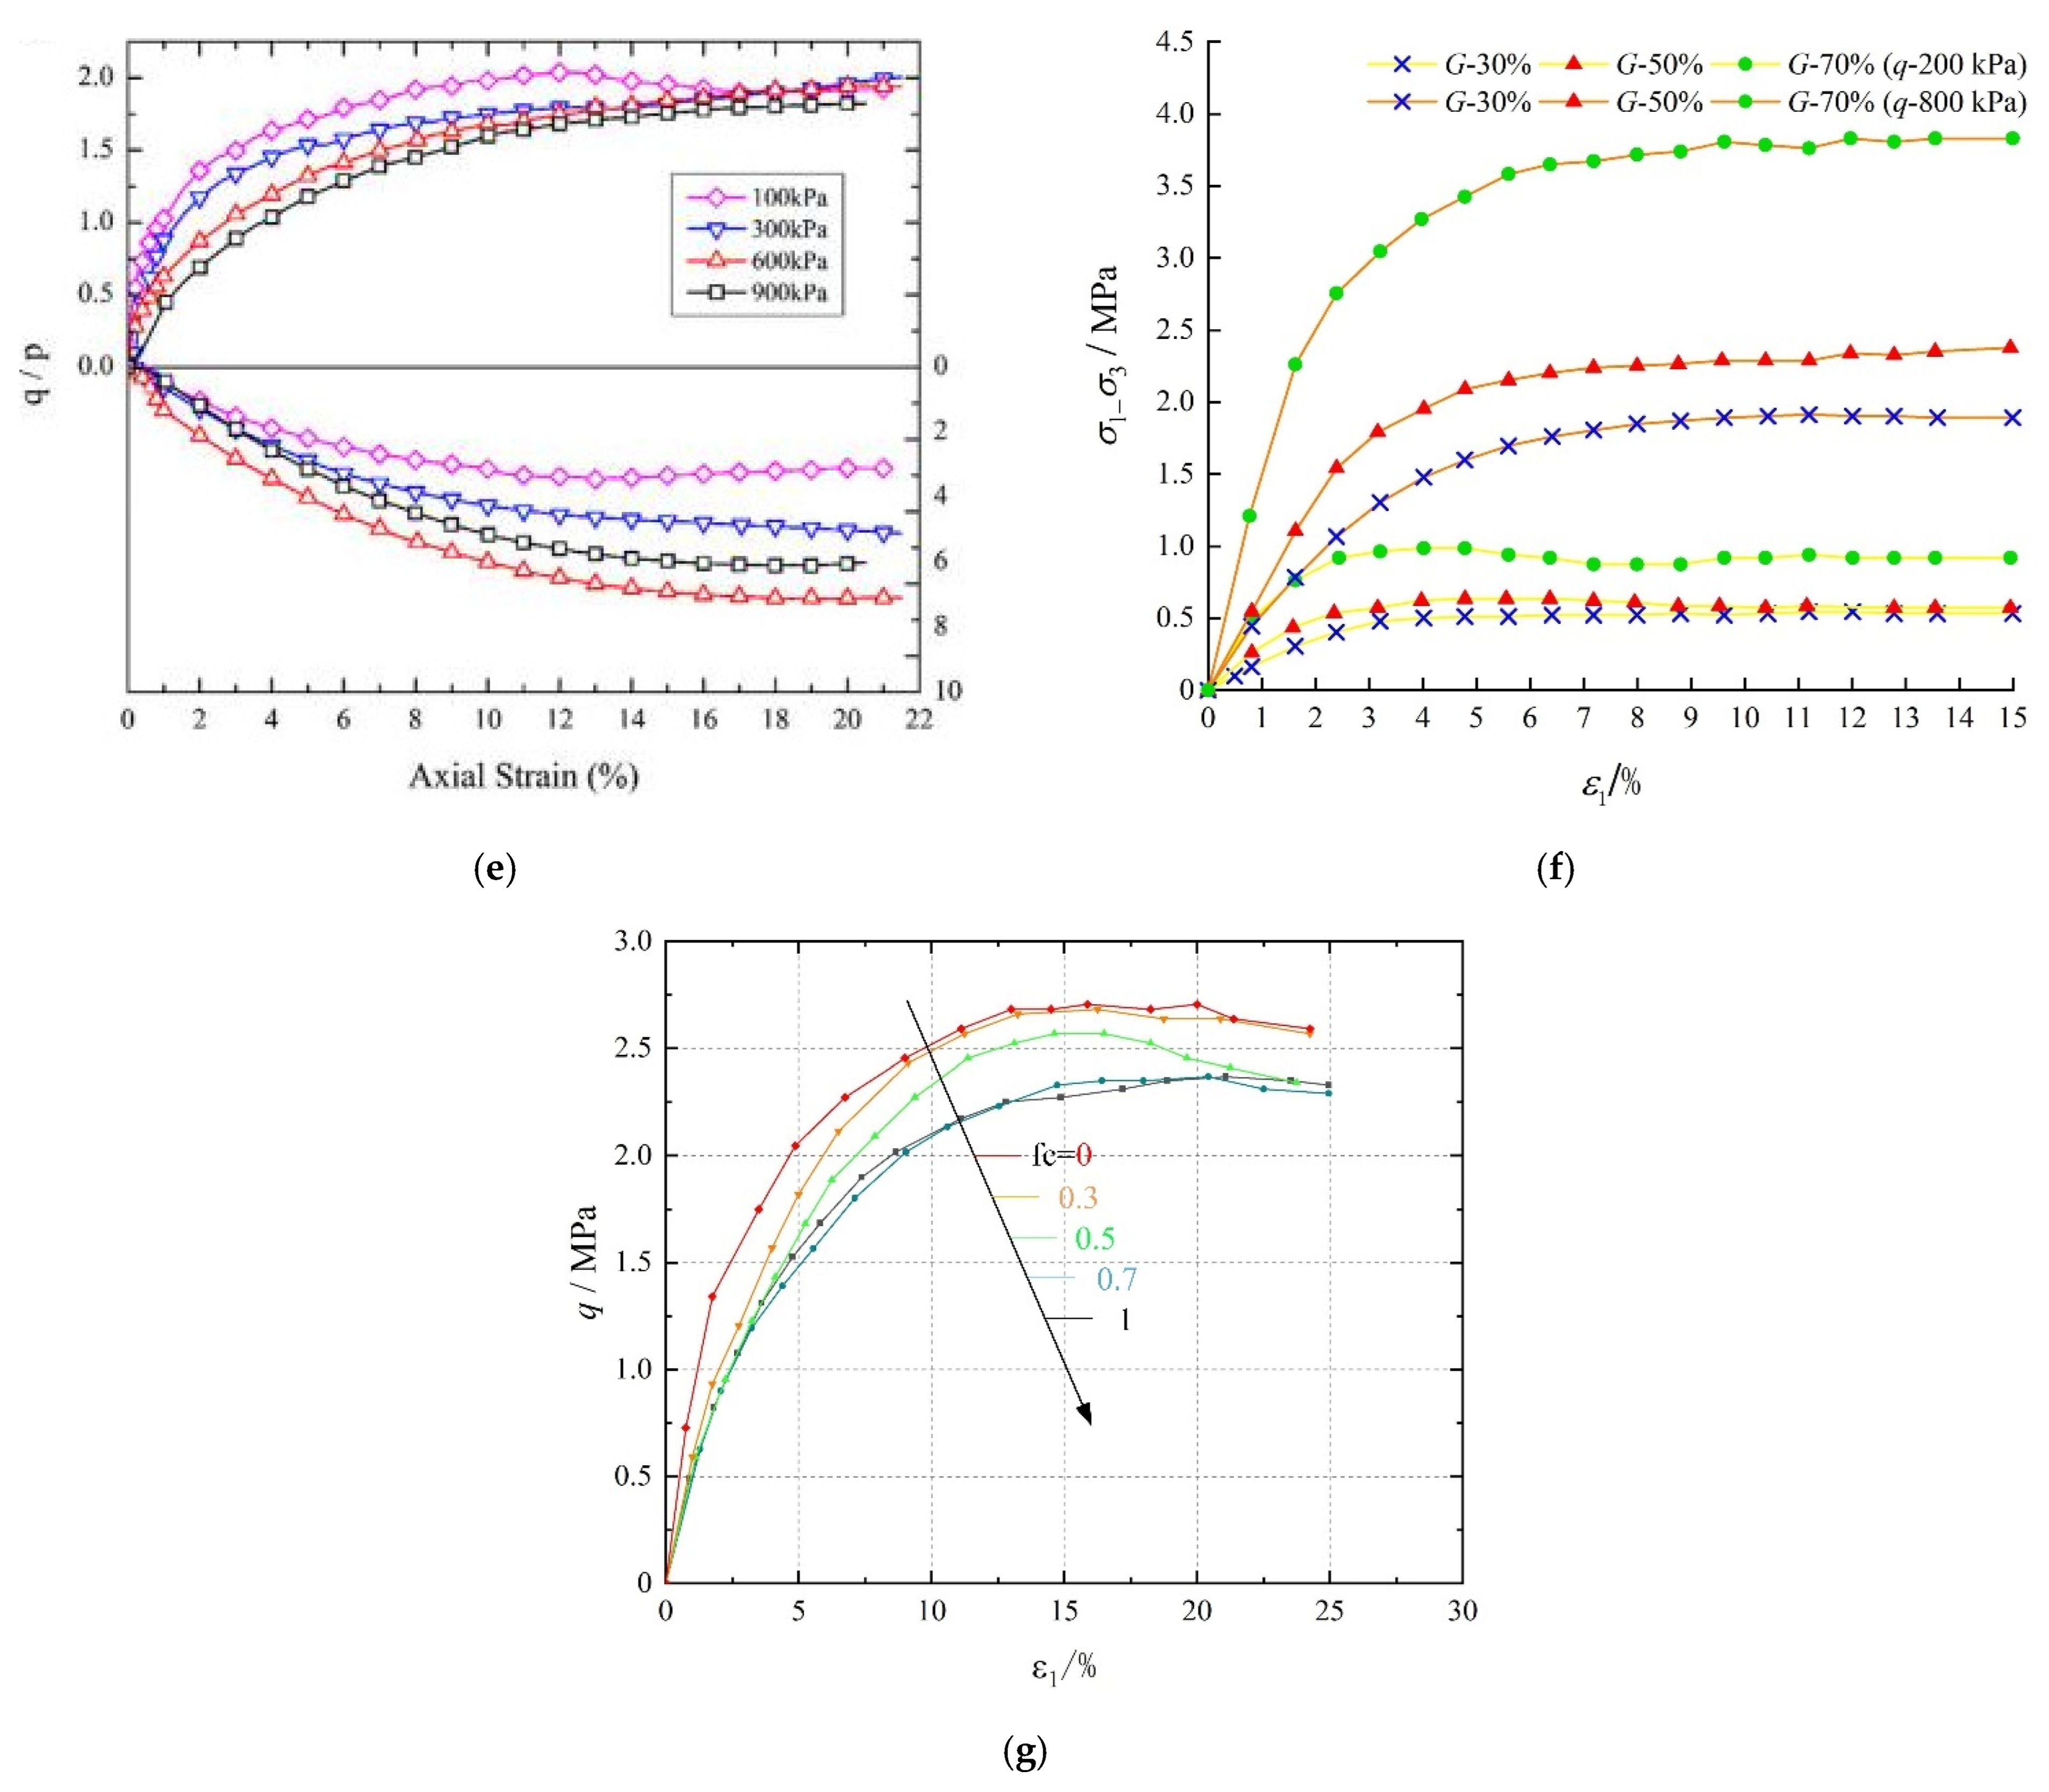
The strength of S-RMs is intricately correlated with the gravel content and consolidation state. The relationship between the shear strength of S-RMs and gravel content is nonlinear, with a qualitative threshold identified in this study as 20% gravel content (this threshold may vary depending on parameter changes): when the gravel content reaches this threshold, the shear bearing capacity of the S-RM specimen decreases to its minimum value. Beyond this threshold, the shear strength of the specimens gradually increases; conversely, when the gravel content is below this threshold, the shear strength decreases. This indicates that insufficient addition of gravels to the sand does not significantly enhance the overall shear strength of the specimens. This conclusion not only applies to S-RMs but can also be extended to other binary granular materials. Additionally, the shear strength of S-RMs increases with increasing confining pressure, consistent with traditional understanding.
(2)
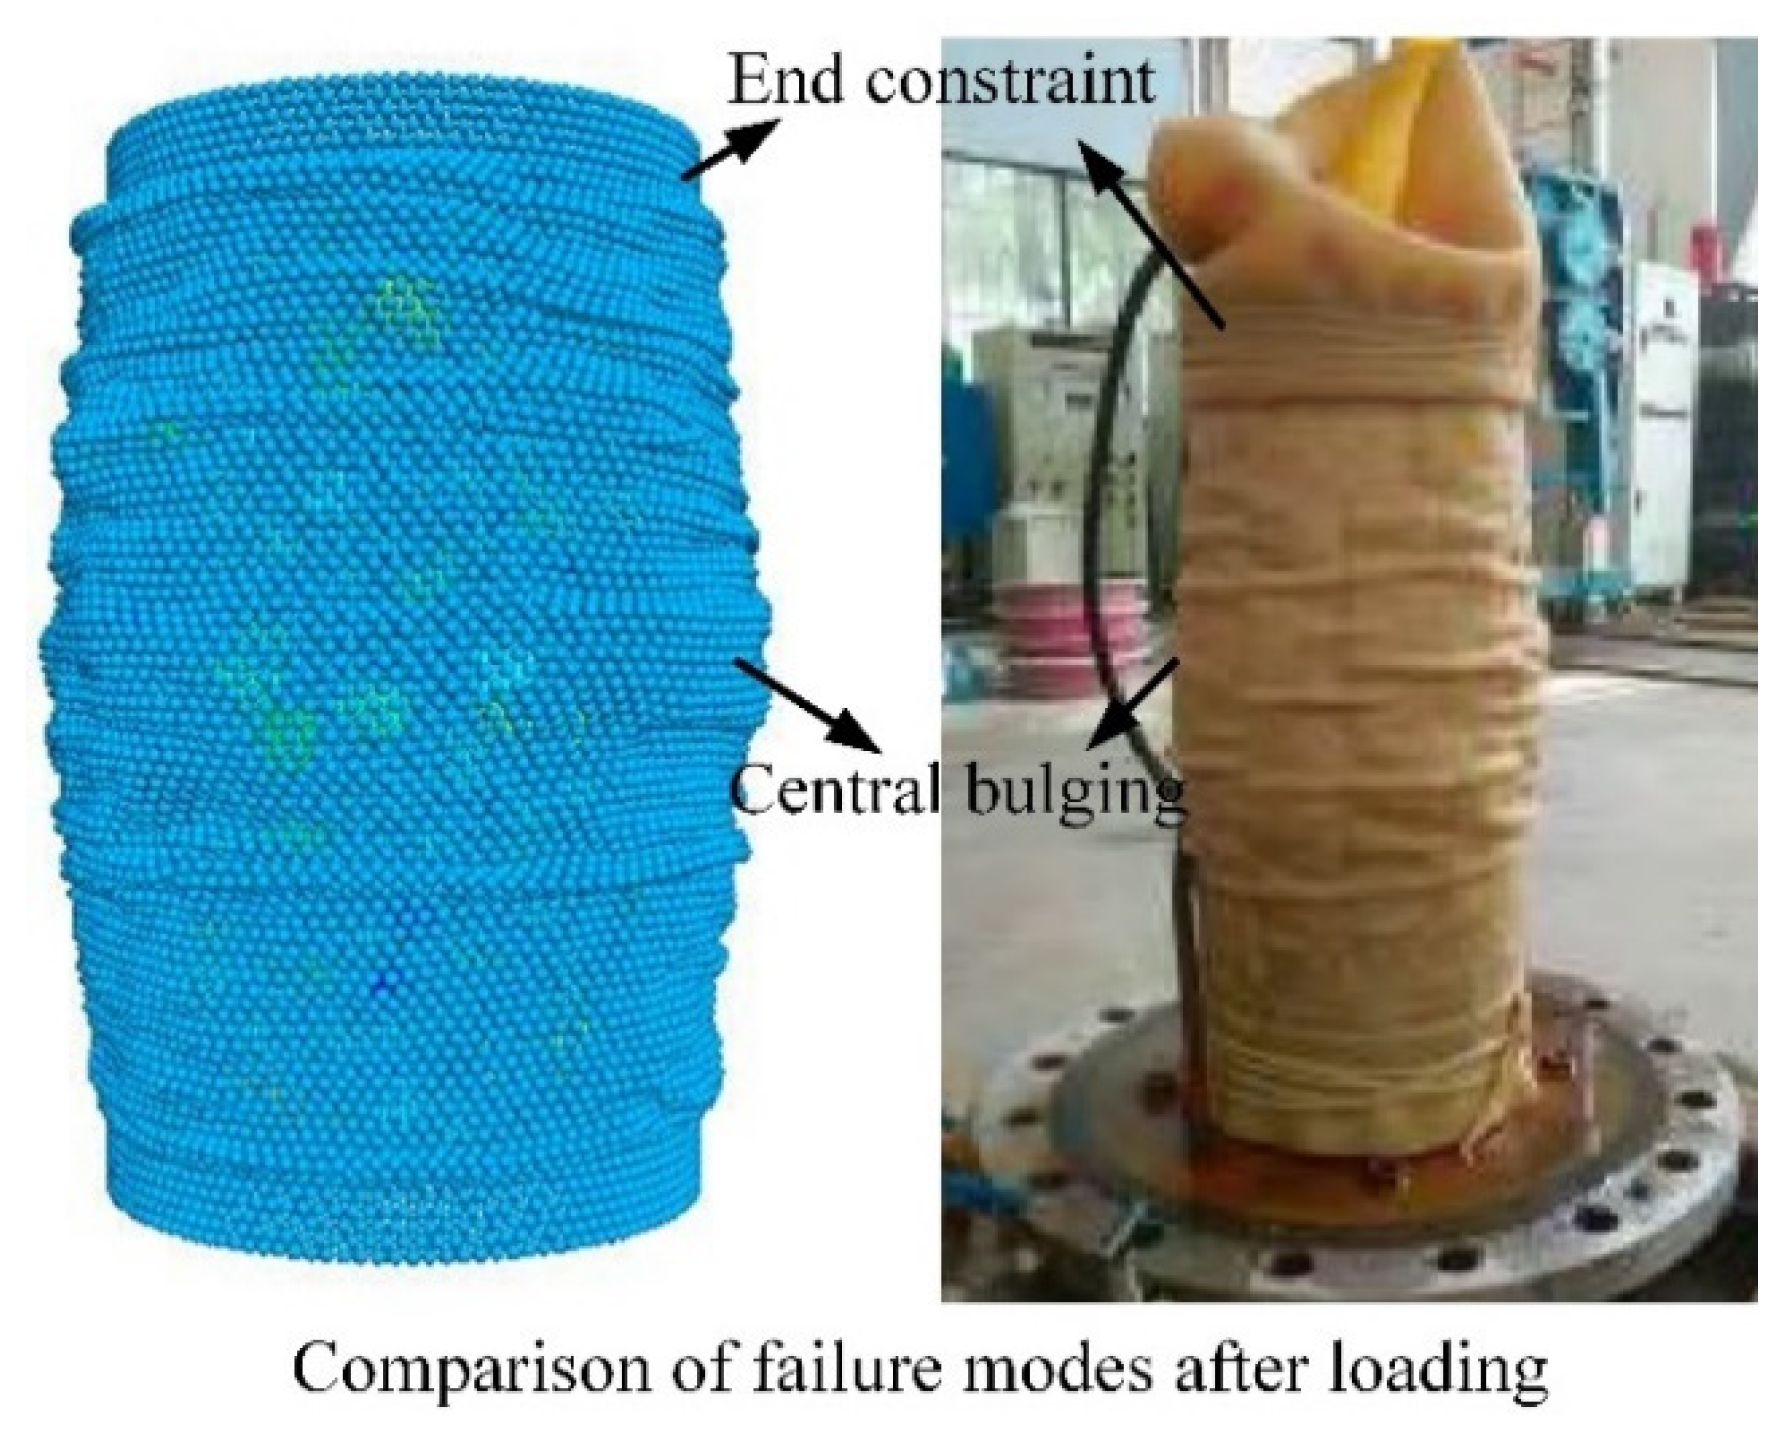
In discrete element numerical simulation, the selection of boundary conditions for triaxial experiments is of critical importance. When a flexible boundary composed of particles is employed, the S-RM specimens exhibit lateral expansion failure, forming asymmetric ‘X’-shaped shear bands consistent with laboratory observations. Moreover, it is noteworthy that the failure pattern, size, and distribution of the shear bands are influenced not only by the gravel content but also significantly depend on the consolidation confining pressure. This observation intuitively underscores the unique characteristics of S-RMs as heterogeneous granular materials.
(3)
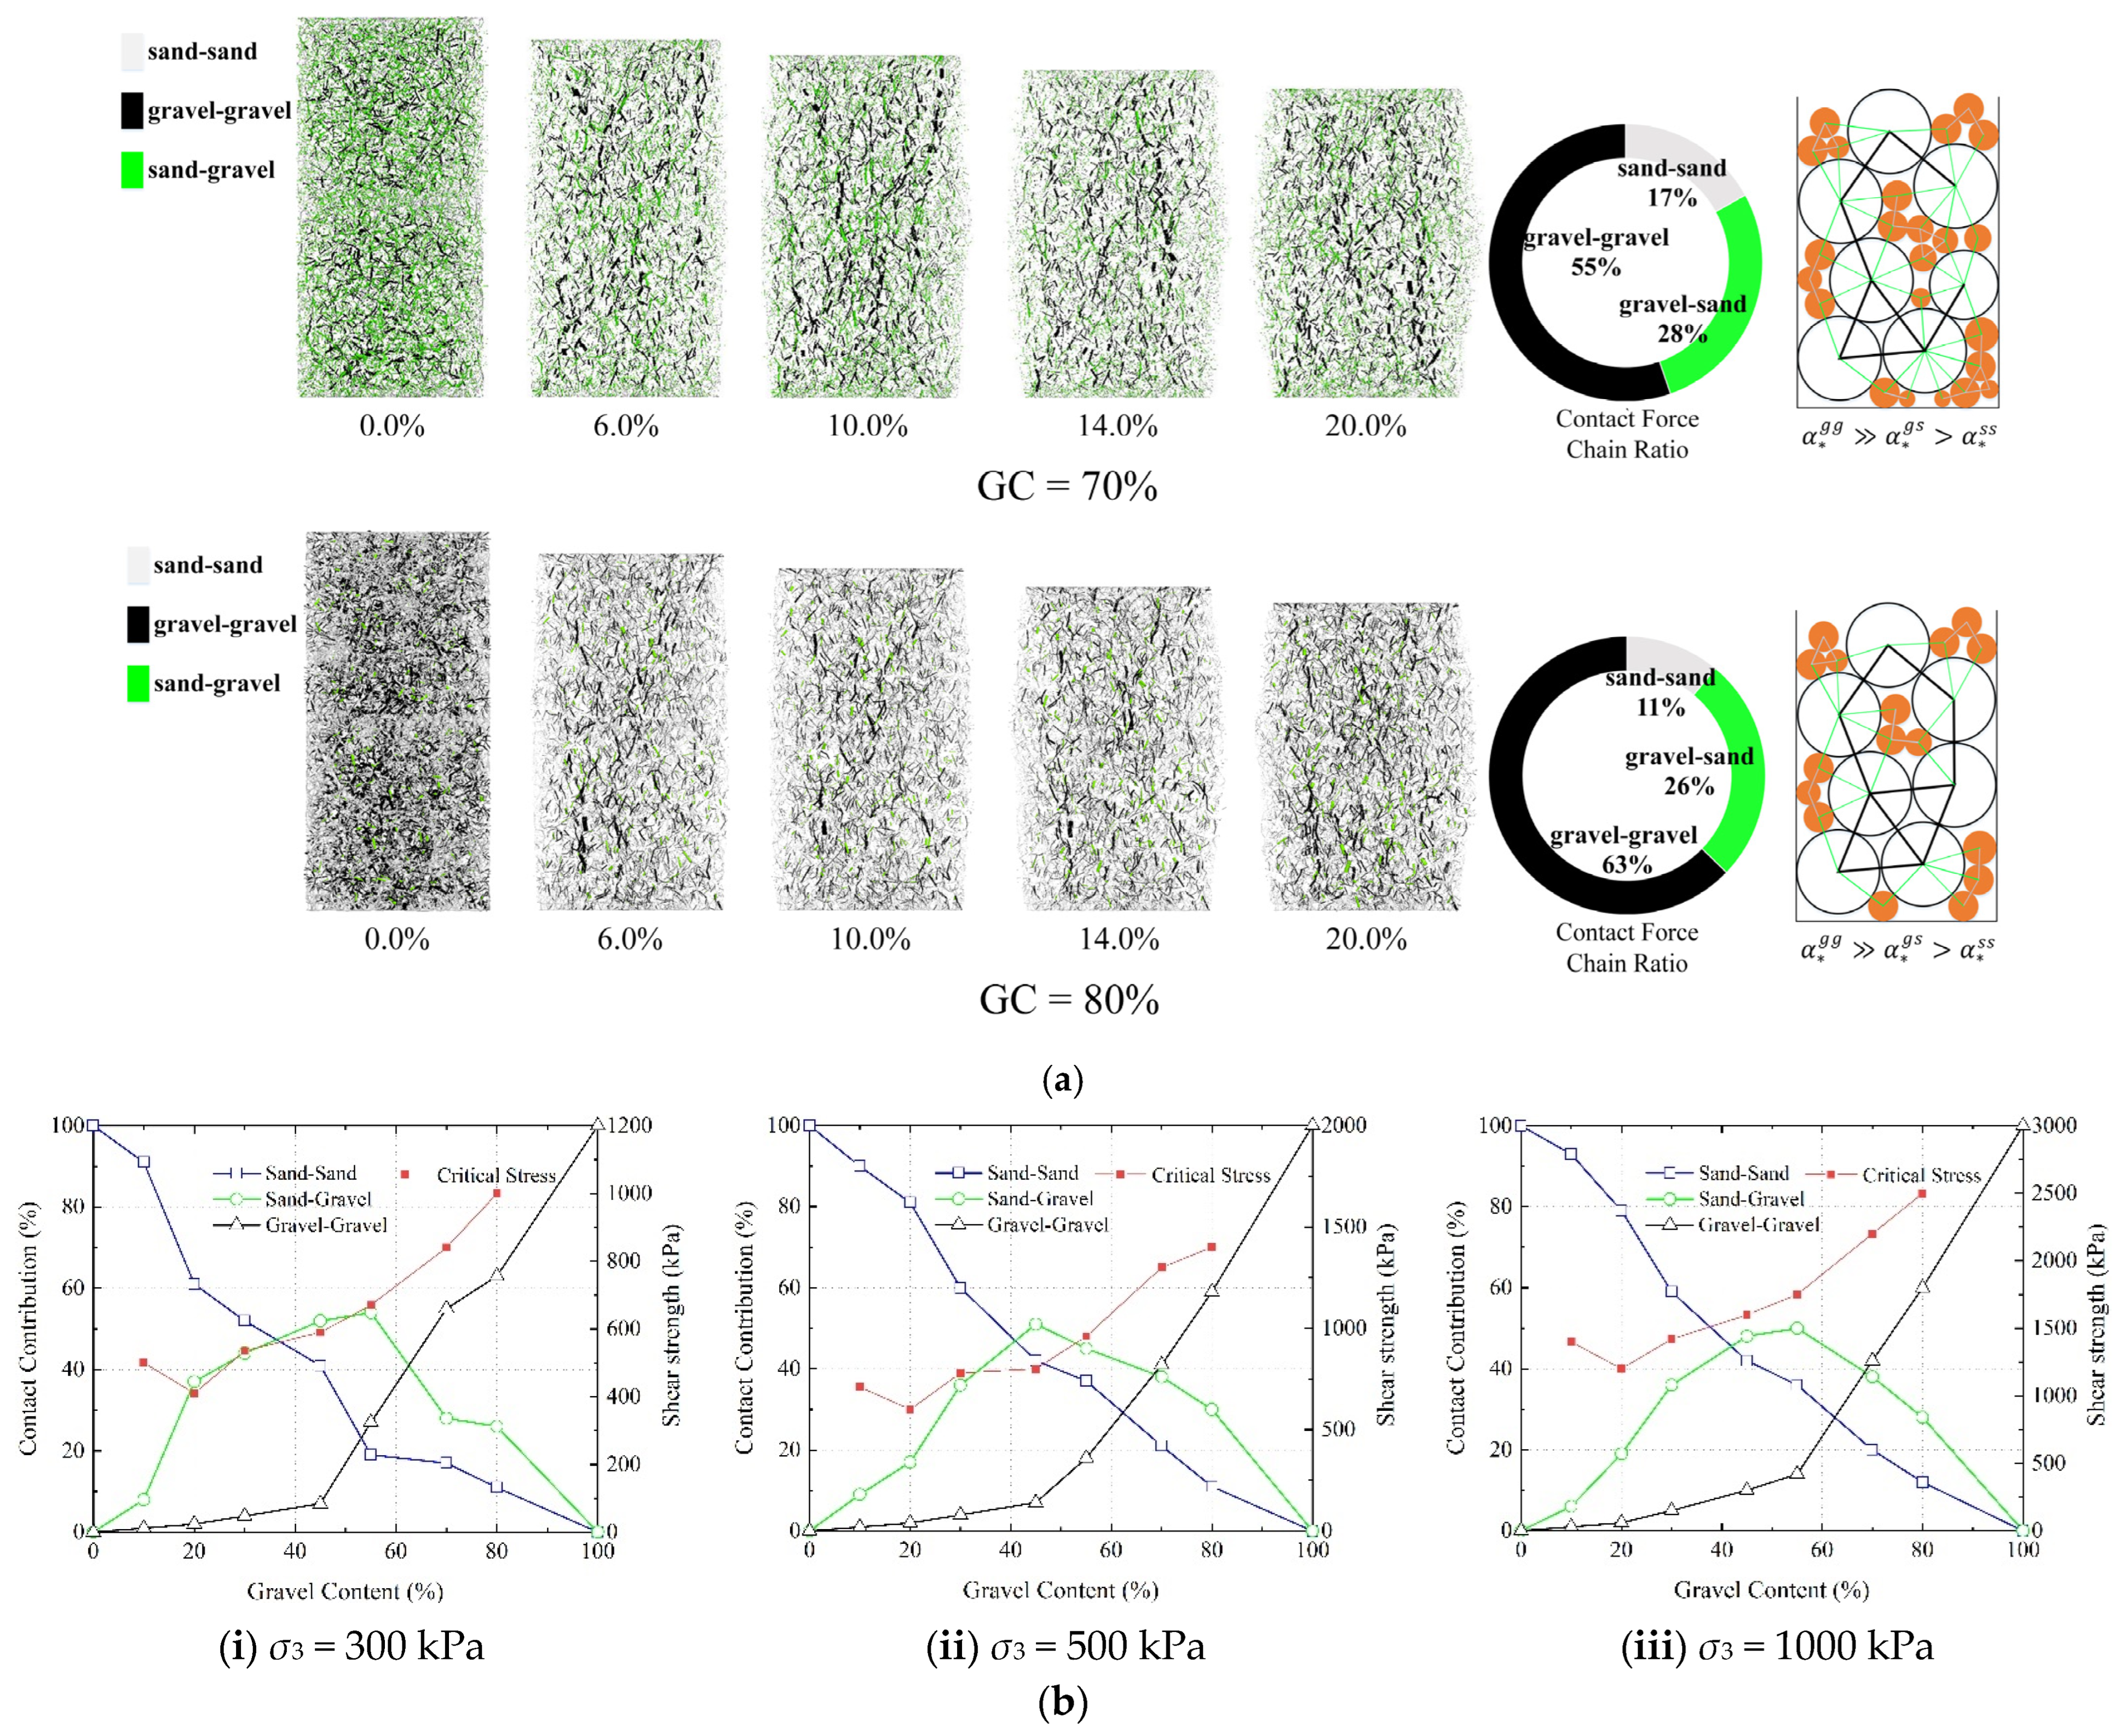
The macroscopic mechanical behavior of S-RMs has been investigated from the microscopic perspective of the contact force network. The contributions of three types of contact forces ( f s s , f g s , and f g g ) to the critical shear strength were quantified at the microscale, and the evolution of strong and weak contacts within the contact force chain system was analyzed. This study integrated the analysis of the microscopic contact force chain distribution to reveal the mechanisms governing the transformation of the main skeleton of the contact force chain during the transitions between ‘single-phase’ and ‘mixed-phase’ states. Furthermore, the prominence of the main skeleton of the contact force chain significantly enhanced the shear resistance capacity of the specimens, and the higher shear strength further amplified these effects. In addition, observations in S-RMs with varying gravel contents revealed that the probability distribution of contact forces and the three-dimensional polar coordinate distribution of branch vectors indicated an increasing trend in the distribution of weak force chains and contact forces in non-loading directions as gravel content increased, thereby accentuating the primary structure of the contact force chain skeleton.
(4)
The fabric tensor characteristics of the S-RM in the critical state are intricately linked to the force chain skeleton of the specimen’s primary structure, with minimal influence from the gravel content and consolidation state. Specimens with sand particles as the primary structure exhibit the most rapid transition to the critical state, characterized by the highest average coordination number (CN) and the most pronounced fabric anisotropic coefficient ( a n ). Conversely, when gravel–sand contacts predominantly support the contact force chain, it takes a longer time for the average coordination number to stabilize, leading to a lower stability value and a more gradual evolution of anisotropic characteristics. In contrast, specimens with gravel as the main structure exhibit a slower transition to a stable state, displaying the lowest stability value and the least degree of evolution in contact normal anisotropy. Under identical force chain conditions, the anisotropy value of the S-RMs is independent of gravel content and consolidation state but depends solely on the composition of the specimen’s skeleton.
This study holds significant importance as it elucidates the mechanical behavior of irregularly shaped granular materials from a macroscopic perspective and the distribution of contact forces from a microscopic perspective within a complex DEM based on thin-film boundaries. It provides a comparative analysis of the mechanical characteristics of S-RMs, binary granular materials composed of soil and gravel. The study introduces the novel concept of the main skeleton of the contact force chain, offering a new approach for analyzing the mechanical properties of multi-component granular materials in future studies. To further enhance the accuracy of the analysis, more realistic granular contact models and constitutive models for granular fracture could be incorporated, thereby providing a more accurate reflection of the constitutive behavior of granular materials.

Shortcomings of the Article

  • This study did not account for the effects of particle breakage, which are crucial to the analysis of the mechanical behavior of S-RMs.
  • Given the emphasis on computational efficiency, the particle model for S-RM units in this study employed ellipsoids with reduced angularity, thus failing to represent the actual angular features of gravels fully. Future research will concentrate on examining the influence of multi-angular characteristics on the mechanical behaviors of S-RMs.

Author Contributions

Conceptualization, C.J.; Methodology, C.J. and Y.L.; Software, C.J. and W.D.; Validation, C.J., L.Z. and Y.M.; Formal analysis, C.J.; Investigation, Y.L.; Data curation, C.J. and W.D.; Writing—original draft, L.Z.; Writing—review & editing, C.J., Y.L. and Y.M.; Visualization, L.Z.; Supervision, C.J.; Funding acquisition, L.Z. and Y.L. All authors have read and agreed to the published version of the manuscript.

Funding

This study was supported by the National Natural Science Foundation of China (general program) (grant No. 52178361, 42407214) and the National Science Fund for Distinguished Young Scholars of China (grant No. 52225807).

Data Availability Statement

The original contributions presented in this study are included in the article. Further inquiries can be directed to the corresponding author.

Conflicts of Interest

Author Yu Mu was employed by the company China Construction Fifth Engineering Bureau. The remaining authors declare that the research was conducted in the absence of any commercial or financial relationships that could be construed as a potential conflict of interest.

References

  1. Sun, S.; Zhu, F.; Wei, J.; Wang, W.; Le, H. Experimental Study on Shear Failure Mechanism and the Identification of Strength Characteristics of the Soil-Rock Mixture. Shock Vib. 2019, 2019, 7450509. [Google Scholar] [CrossRef]
  2. Yao, Y.; Li, J.; Ni, J.; Zhang, A. Effects of gravel content and shape on shear behaviour of soil-rock mixture: Experiment and DEM modelling. Comput. Geotech. 2022, 141, 104476. [Google Scholar] [CrossRef]
  3. Zhang, Z.; Sheng, Q.; Fu, X.; Zhou, Y.; Huang, J.; Du, Y. An approach to predicting the shear strength of soil-rock mixture based on rock block proportion. Bull. Eng. Geol. Environ. 2019, 79, 2423–2437. [Google Scholar] [CrossRef]
  4. Zhao, Y.; Liu, Z. Study of Material Composition Effects on the Mechanical Properties of Soil-Rock Mixtures. Adv. Civ. Eng. 2018, 9, 3854727. [Google Scholar] [CrossRef]
  5. Zhao, N.; Wang, Y.; Meng, B.; Luo, N. Numerical Simulation on the Seepage Properties of Soil-Rock Mixture. Adv. Mater. Sci. Eng. 2018, 2018, 1859319. [Google Scholar] [CrossRef]
  6. Xu, W.; Hu, R. Conception classification and significations of soil-rock mixture. Hydrogeol. Eng. Geol. 2009, 36, 50–56+70. [Google Scholar]
  7. Geertsema, M.; Clague, J.J.; Schwab, J.W.; Evans, S.G. An overview of recent large catastrophic landslides in northern British Columbia. Canada Eng. Geol. 2006, 83, 120–143. [Google Scholar] [CrossRef]
  8. Vallejo, L.E.; Mawby, R. Porosity influence on the shear strength of granular arterial-clay mixtures. Eng. Geol. 2000, 58, 125–136. [Google Scholar] [CrossRef]
  9. Afifipour, M.; Moarefvand, P. Experimental study of post-peak behavior of bimrocks with high rock block proportions. J. Cent. South. Univ. 2014, 21, 761–767. [Google Scholar] [CrossRef]
  10. Li, B. Study on Shear Properties of the Soil-rock Mixture. E3S Web Conf. 2020, 165, 04079. [Google Scholar] [CrossRef]
  11. Xu, W.J.; Zhang, H.Y. Research on the effect of rock content and sample size on the strength behavior of soil-rock mixture. Bull. Eng. Geol. Environ. 2021, 80, 2715–2726. [Google Scholar] [CrossRef]
  12. Zhang, X.M.; Lv, Y.Z.; Zhao, Y.M.; Liao, Z. Study on Poisson ratio of soil-rock mixture in low strain. Appl. Mech. Mater. 2011, 90–93, 1921–1925. [Google Scholar] [CrossRef]
  13. Pincus, H.J.; Donaghe, R.T.; Torrey, V.H. A compaction test method for soil-rock mixtures in which equipment size effects are minimized. Geotech. Test. J. 1994, 17, 363–370. [Google Scholar] [CrossRef]
  14. Li, W.S.; Liu, J.Z. Study on bearing capacity of debris foundation in new Fengjie city. J. Yangtze River Sci. Res. Inst. 2003, 20, 61–64. [Google Scholar]
  15. Terzaghi, K.; Pech, R.B.; Mesri, G. Soil Mechanics in Engineering Practice; Wiley Interscience: London, UK, 1967. [Google Scholar]
  16. Ding, X.H.; Zhou, W.; Lu, X.; Gao, Y. Physical simulation test of soil-rock mixture from synthetic transparent soil. J. Cent. South. Univ. 2018, 25, 3085–3097. [Google Scholar] [CrossRef]
  17. Vallejo, L.E.; Asce, M.; Lobo-Guerrero, S.; Seminsky, L.F. The shear strength of sand-gravel mixtures: Laboratory and theoretical analysis. In Geo-Congress 2014: Geo-Characterization and Modeling for Sustainability; ASCE: Reston, VA, USA, 2014; pp. 74–83. [Google Scholar] [CrossRef]
  18. Coli, N.; Berry, P.; Boldini, D. In situ non-conventional shear tests for the mechanical characterization of a bimrock (Bim Test). Int. J. Rock. Mech. Min. Sci. 2011, 48, 95–102. [Google Scholar] [CrossRef]
  19. Jaroslav, F. Notes on the effect of grain crushing on the granular soil behavior. Eng. Geol. 2002, 63, 93–98. [Google Scholar]
  20. Jie, Y.; Xin, C.; Pang, Q.; Guo, X.W.; Wu, Y.L.; Zhao, J.L. Experimental Study on the Shear Strength of Cement-Sand-Gravel Material. Adv. Mater. Sci. Eng. 2018, 2018, 2531642. [Google Scholar] [CrossRef]
  21. Xu, W.; Yue, Z.; Hu, R. Study on the mesostructure and mesomechanical characteristics of the soil-rock mixture using digital image processing based finite element method. Int. J. Rock. Mech. Min. Sci. 2008, 45, 749–762. [Google Scholar] [CrossRef]
  22. Ding, X.L.; Zhang, H.M.; Huang, H.L.; Lu, B.; Zhang, Q. Research on mechanical properties of unsaturated soil-rock mixture based on numerical experiments of mesostructured. Chin. J. Rock. Mech. Eng. 2012, 31, 1553–1566. [Google Scholar]
  23. Gong, J.; Nie, Z.; Zhu, Y.; Liang, Z.; Wang, X. Exploring the effects of particle shape and content of fines on the shear behavior of sand-fines mixtures via the DEM. Comput. Geotech. 2019, 106, 161–176. [Google Scholar] [CrossRef]
  24. Zhang, P.; Dong, Y.; Galindo-Torres, S.A.; Scheuermann, A.; Li, L. Metaball based discrete element method for general shaped particles with round features. Comput. Mech. 2021, 67, 1243–1254. [Google Scholar] [CrossRef]
  25. Chandratilleke, G.R.; Jin, X.; Shen, Y.S. DEM study of effects of particle size and density on mixing behaviour in a ribbon mixer. Powder Technol. 2021, 392, 93–107. [Google Scholar] [CrossRef]
  26. Jia, X.M.; Chai, H.J.; Zheng, Y.R. Mesomechanics research of large direct shear test on soil and rock aggregate mixture with particle flow code simulation. Rock. Soil. Mech. 2010, 31, 2695–2703. (In Chinese) [Google Scholar]
  27. Xu, W.J.; Zhang, H.Y.; Xu, Q.; Yu, Y.Z. Numerical simulations of direct shear test with soil-rock mixture using discrete element method. Chin. J. Comput. Mech. 2014, 31, 228–234. (In Chinese) [Google Scholar] [CrossRef]
  28. Ding, X.L.; Li, Y.X.; Wang, X. Particle flow modeling mechanical properties of soil and rock mixtures based on digital image. Chin. J. Rock. Mech. Eng. 2010, 29, 477–484. (In Chinese) [Google Scholar]
  29. Zhou, J.; Zhang, L.Q.; Dai, F.C.; Ran, H. Numerical simulation of direct shear tests for rock and soil mixture in a landslide based on bonded-particle model. Chin. J. Rock. Mech. Eng. 2013, 31, 2650–2659. [Google Scholar] [CrossRef]
  30. Graziani, A.; Rossini, C.; Rotonda, T. Characterization and DEM modeling of shear zones at a large dam foundation. Int. J. Geomech. 2012, 12, 648–664. [Google Scholar] [CrossRef]
  31. Jing, X.; Xie, W.L.; Shan, S. Discrete element simulation study on micromechanical characteristics of undisturbed and remolded loess in biaxial test. Bull. Geol. Sci. Technol. 2021, 40, 184–193. [Google Scholar] [CrossRef]
  32. Xu, W.J.; Hu, L.M.; Gao, W. Random generation of the meso-structure of a soil-rock mixture and its application in the study of the mechanical behavior in a landslide dam. Int. J. Rock. Mech. Min. Sci. 2016, 86, 166–178. [Google Scholar] [CrossRef]
  33. Jin, L.; Zeng, Y.W.; Li, H.; Li, L.L. Numerical simulation of large-scale triaxial tests on soil-rock mixture based on DEM of irregularly shaped particles. Chin. J. Geotech. Eng. 2015, 37, 829–838. (In Chinese) [Google Scholar]
  34. Evans, T.M.; Frost, J.D. Multiscale investigation of shear bands in sand: Physical and numerical experiments. Int. J. Numerical Anal. Methods Geomech. 2010, 34, 1634–1650. [Google Scholar] [CrossRef]
  35. Zhang, H.Y.; Xu, W.J.; Yu, Y.Z. Numerical analysis of soil-rock mixture’s meso-mechanics based on biaxial test. J. Cent. South. Univ. 2016, 23, 685–700. [Google Scholar] [CrossRef]
  36. Coetzee, C.J. Calibration of the discrete element method and the effect of particle shape. Powder Technol. 2016, 297, 57–70. [Google Scholar] [CrossRef]
  37. Zhu, Y.G.; Nie, Z.H.; Gong, J. Influence of the rolling-resistance-based shape of coarse particles on the shear responses of granular mixtures. Particuology 2020, 52, 67–82. [Google Scholar] [CrossRef]
  38. Patino-Ramirez, F.; O’Sullivan, C.; Dini, D. Percolating contacts network and force chains during interface shear in granular media. Granul. Matter 2023, 25, 31. [Google Scholar] [CrossRef]
  39. Wu, M.; Wang, J.; Russell, A.; Cheng, Z. Dem modelling of mini-triaxial test based on one-to-one mapping of sand particles. Géotechnique 2021, 71, 714–727. [Google Scholar] [CrossRef]
  40. Yu, J.; Zhang, Q.; Jia, W.C. Investigation on stability of soil-rock mixture slope with discrete element method. Environ. Earth Sci. 2023, 82, 449.1–449.17. [Google Scholar] [CrossRef]
  41. Lu, Y.; Tan, Y.; Li, X.; Liu, C. Methodology for simulation of irregularly shaped gravel grains and its application to DEM modeling. J. Comput. Civ. Eng. 2017, 31, 04017023. [Google Scholar] [CrossRef]
  42. Fang, C.F.; Gong, J.; Nie, Z.H.; Li, B.; Li, X. DEM study on the microscale and macroscale shear behaviours of granular materials with breakable and irregularly shaped particles. Comput. Geotech. 2021, 137, 104271. [Google Scholar] [CrossRef]
  43. Papadopoulos, L.; Porter, M.A.; Daniels, K.E.; Bassett, D.S. Network analysis of particles and grains. J. Complex. Netw. 2018, 6, 485–565. [Google Scholar] [CrossRef]
  44. Andrade, J.E.; Avila, C.F.; Hall, S.A.; Lenoir, N.; Viggiani, G. Multiscale modeling and characterization of granular matter: From grain kinematics to continuum mechanics. J. Mech. Phys. Solids 2011, 59, 237–250. [Google Scholar] [CrossRef]
  45. Zhou, W.; Liu, J.; Ma, G.; Yuan, W.; Chang, X. Macroscopic and microscopic behaviors of granular materials under proportional strain path: A dem study. Int. J. Numer. Anal. Methods Geomech. 2016, 40, 2450–2467. [Google Scholar] [CrossRef]
  46. Radjai, F.; Jean, M.; Moreau, J.; Roux, S. Force distributions in dense two-dimensional granular systems. Phys. Rev. Lett. 1996, 77, 274–277. [Google Scholar] [CrossRef] [PubMed]
  47. Ma, G.; Regueiro, R.A.; Zhou, W.; Wang, Q.; Liu, J. Role of particle crushing on particle kinematics and shear banding in granular materials. Acta Geotech. 2018, 13, 601–618. [Google Scholar] [CrossRef]
  48. Guo, N.; Zhao, J. The signature of shear-induced anisotropy in granular media. Comput. Geotech. 2013, 47, 1–15. [Google Scholar] [CrossRef]
  49. Zhai, L.; Gao, Y.; Yuan, Q.; Shi, H. Deformation characterizations of granular material in 2d dense assembly subjected to shearing. Constr. Build. Mater. 2018, 158, 1065–1072. [Google Scholar] [CrossRef]
  50. Elrahmani, A.; Al-Raoush, R.I.; Abugazia, H.; Seers, T. Pore-scale simulation of fine particles migration in porous media using coupled CFD-DEM. Powder Technol. 2022, 398, 117130. [Google Scholar] [CrossRef]
  51. Reddy, N.S.C.; He, H.; Senetakis, K. Dem multi-scale insights on the pre-failure behavior of mature structured sands: Influence of bond type, amount, breakage pattern and heterogeneity. Int. J. Numer. Anal. Methods Geomech. 2023, 14, 2587–2617. [Google Scholar] [CrossRef]
  52. Kozicki, J.; Tejchman, J.; Mühlhaus, H.-B. Discrete simulations of a triaxial compression test for sand by DEM. Int. J. Numer. Anal. Methods Geomech. 2015, 38, 1923–1952. [Google Scholar] [CrossRef]
  53. Xu, W.J.; Wang, S. Meso-mechanics of soil-rock mixture with real shape of rock blocks based on 3D numerical direct shear test. Chin. J. Rock. Mech. Eng. 2016, 35, 2152–2160. (In Chinese) [Google Scholar] [CrossRef]
  54. O’Sullivan, C.; Cui, L. Micromechanics of granular material response during load reversals: Combined DEM and experimental study. Powder Technol. 2009, 193, 289–302. [Google Scholar] [CrossRef]
  55. Lu, Y.; Li, X.; Wang, Y. Application of a flexible membrane to DEM modelling of axisymmetric triaxial compression tests on sands. Eur. J. Environ. Civil Eng. 2018, 2018, 1425157. [Google Scholar] [CrossRef]
  56. Qu, T.M.; Feng, Y.T.; Wang, Y.; Wang, M. Discrete element modelling of flexible membrane boundaries for triaxial tests. Comput. Geotech. 2019, 115, 103154. [Google Scholar] [CrossRef]
  57. Zhao, X.; Evans, T.M. Numerical analysis of critical state behaviors of granular soils under different loading conditions. Granul. Matter 2011, 13, 751–764. [Google Scholar] [CrossRef]
  58. Xu, R.; Liu, E.; Xing, H. Analysis on mechanical properties and evolution of mesostructure of soil–rock mixture samples from contact network perspective. Comptes Rendus Mec. 2021, 349, 83–102. [Google Scholar] [CrossRef]
  59. Itasca Consulting Group Inc. PFC3D-Particle Flow Code in Three-Dimension; Version 5.0; Itasca Consulting Group Inc.: Minneapolis, MN, USA, 2014. [Google Scholar]
  60. Jiang, C.L.; Liu, Y.J.; Zeng, L.L.; Xu, C.S.; Cao, P. Critical state uniqueness of dense granular materials using discrete element method in conjunction with flexible membrane boundary. Particuology 2024, 95, 124–144. [Google Scholar] [CrossRef]
  61. Radjai, F.; Roux, S. Turbulent like fluctuations in quasistatic flow of granular media. Phys. Rev. Lett. 2002, 89, 064302. [Google Scholar] [CrossRef] [PubMed]
  62. Lopera Perez, J.C.; Kwok, C.Y.; O’Sullivan, C.; Huang, X.; Hanley, K.J. Assessing the quasi-static conditions for shearing in granular media within the critical state soil mechanics framework. Soils Found. 2016, 56, 152–159. [Google Scholar] [CrossRef]
  63. Zhang, H.Y.; Xu, W.J.; Yu, Y.Z. Triaxial tests of soil-rock mixtures with different rock block distributions. Soils Found. 2016, 56, 44–56. [Google Scholar] [CrossRef]
  64. Tao, Q.D.; He, Z.Y.; Jia, Y. Strength characteristics and influencing factors of soil-rock mixture based on large triaxial test. Sci. Technol. Eng. 2019, 19, 310–318. (In Chinese) [Google Scholar]
  65. Wang, T.; Liu, S.H.; Song, Y.J.; Kong, W.M. Strength and deformation characteristics of soil-rock mixtures using skeleton void ratio. Rock. Soil. Mech. 2020, 41, 2973–2983. (In Chinese) [Google Scholar] [CrossRef]
  66. Peters, J.F.; Muthuswamy, M.; Wibowo, J.; Tordesillas, A. Characterization of force chains in granular material. Phys. Rev. E 2005, 72, 041307. [Google Scholar] [CrossRef] [PubMed]
  67. Sun, Q.C.; Xin, H.L.; Liu, J.G.; Feng, J. Skeleton and force chain network in static granular material. Rock. Soil. Mech. 2009, 30, 83–87. [Google Scholar]
  68. Liu, J.; Zhou, W.; Ma, G.; Yang, S.; Chang, X. Strong contacts, connectivity and fabric anisotropy in granular materials: A 3D perspective. Powder Technol. Int. J. Sci. Technol. Wet. Dry Part. Syst. 2020, 366, 747–760. [Google Scholar] [CrossRef]
  69. Cheng, Z.; Wang, J. Experimental investigation of inter-particle contact evolution of sheared granular materials using X-ray micro-tomography. Soils Found. 2018, 58, 1492–1510. [Google Scholar] [CrossRef]
  70. Zhu, Y.G.; Nie, H.H.N.; Gong, J.; Zou, J.F.; Zhao, L.H.; Li, L. An analysis of the effects of the size ratio and fines content on the shear behaviors of binary mixtures using DEM. Comput. Geotech. 2020, 118, 103353. [Google Scholar] [CrossRef]
  71. Petalas, A.L.; Dafalias, Y.F.; Papadimitriou, A.G. SANISAND-F: Sand Constitutive Model with Evolving Fabric Anisotropy. Int. J. Solids Struct. 2019, 188–189, 12–31. [Google Scholar] [CrossRef]
  72. Kanatani, K. Distribution of directional data and fabric tensors. Int. J. Eng. Sci. 1984, 22, 149–164. [Google Scholar] [CrossRef]
  73. Yang, Z.X.; Xu, T.T.; Chen, Y.N. Unified modeling of the influence of consolidation conditions on monotonic soil response considering fabric evolution. J. Eng. Mech. 2018, 144, 04018073. [Google Scholar] [CrossRef]
  74. Li, X.S.; Dafalias, Y.F. Dissipation consistent fabric tensor definition from DEM to continuum for granular media. J. Mech. Phys. Solids 2015, 78, 141–153. [Google Scholar] [CrossRef]
Figure 1. Three-dimensional CT scanning model of artificial gravel granules.
Applsci 15 07978 g001
Figure 2. Stochastic microstructure model of S-RMs in DEM with different structural characteristics. Different gravel content (GC = 10%, 20%, 30%, 45%, 55%, 70%, 80%).
Applsci 15 07978 g002
Figure 3. The optimization of the combination of two parameters: clump creation with different parameters.
Applsci 15 07978 g003
Figure 4. Discrete element models of gravel clumps, sand balls, and S-RMs.
Applsci 15 07978 g004
Figure 5. Comparison of results from laboratory large-scale triaxial tests and numerical simulations for S-RM.
Applsci 15 07978 g005
Figure 6. Stress–strain curves of S-RM specimens with distinct gravel content and consolidation pressure. (a) σ3 = 300 kPa. (b) σ3 = 500 kPa. (c) σ3 = 1000 kPa. (d) Triaxial test outcomes of the S-RM in the work of Yao [62]. (e) Triaxial test outcomes of the S-RM in the work of Zhang [63]. (f) Triaxial test results of the S-RM in the work of Tao [64]. (g) Triaxial test results of the S-RM in the work of Wang [65].
Applsci 15 07978 g006aApplsci 15 07978 g006b
Figure 7. Particle rotation cloud diagrams of S-RMs with varying gravel contents under different axial strains.
Applsci 15 07978 g007aApplsci 15 07978 g007b
Figure 8. Evolution process of contact normal force with axial strain of specimens with varying gravel contents (the yellow line in the figure represents the average contact force, f 0 n .
Applsci 15 07978 g008aApplsci 15 07978 g008b
Figure 9. (a) Contact geometry schematic (S-S, G-S, G-G). (b) Three-dimensional polar distribution of the branch vector orientations at different strain rates. (c) Three-dimensional polar distribution of the branch vector orientations for varying consolidation conditions.
Applsci 15 07978 g009aApplsci 15 07978 g009bApplsci 15 07978 g009c
Figure 10. (a) Evolution of contact force chain in a soil–rock mixture specimen under 300 kPa consolidation condition. (b) Influence of gravel features on shearing behavior evaluated by contact behavior.
Applsci 15 07978 g010aApplsci 15 07978 g010b
Figure 11. The evolutionary trend of the average coordination number CN in soil–rock mixture samples.
Applsci 15 07978 g011
Figure 12. Contact geometry: contact normal, n i c , and contact orientation, α i c .
Applsci 15 07978 g012aApplsci 15 07978 g012b
Figure 13. The evolutionary trend of the anisotropic coefficient, a n , in S-RMs.
Applsci 15 07978 g013
Table 1. Parameters of the three-dimensional model of S-RM.
No.Gravel Content
(%)
Consolidation Pressure (kPa)Numbers of ParticlesInitial Void Ratio e0Consolidation-Induced Void Ratio e
Gravel Clumps
VG * (%)
Sand Particles
VG * (%)
110300139
(10.7)
32,275
(89.3)
0.470.476
25000.471
310000.463
420300224
(19.9)
22,213
(80.1)
0.480.501
55000.492
610000.488
730300339
(29.7)
19,636
(70.3)
0.480.489
85000.482
910000.478
1045300537
(46.3)
15,458
(53.7)
0.450.458
115000.458
1210000.443
1355300656
(55.8)
12,397
(44.2)
0.470.486
145000.480
1510000.474
1670300926
(70.9)
10,474
(29.1)
0.490.491
175000.504
1810000.468
19803001083
(81.0)
6557
(19.0)
0.460.461
205000.450
2110000.438
* Precisely controlling the void ratio and gravel content of specimens remains challenging.
Table 2. The values of contact stiffness in the literature.
Referencekn (N/m)ktFrictionDamping Factor
Fang et al. [42]7.5 × 10⁷~4.6 × 10⁸kt = (4/3) kn0.50.7
Coetzee [34]5 × 10⁷~1.08 × 10⁸kt = kn0.70.8
Zhu et al. [37]1.0 × 10⁸kt = (4/3) kn0.50.7
O’Sullivan [38]29 GP-0.01, 0.1, 0.25-
Wu et al. [39]28 GPkt = 0.25 kn0.30.7
Yu et al. [40]3 × 10⁸kt = 0.8 kn0.7-
Lu et al. [41]2.5 × 10⁸kt = kn1.0-
Table 3. Contact parameters of soil–rock mixture particles.
ParticleDensity
(kg/m3)
Contact Stiffness (N/m)Bond Strength (N)Friction Coefficient
NormalTangentNormalTangent
Gravel clump26501.0 × 1081.0 × 108--0.80
Sand ball19002.0 × 1061.0 × 1061.0 × 1021.0 × 1020.40
Gravel–sand-3.9 × 1062.0 × 106--0.40
Membrane particle10001.0 × 1051.0 × 1051.0 × 103001.0 × 103000.0
Disclaimer/Publisher’s Note: The statements, opinions and data contained in all publications are solely those of the individual author(s) and contributor(s) and not of MDPI and/or the editor(s). MDPI and/or the editor(s) disclaim responsibility for any injury to people or property resulting from any ideas, methods, instructions or products referred to in the content.

