Abstract
Although wind turbine installation vessels (WTIVs) are increasingly operating in deepwater complex geological areas with larger scales, systematic research on and experimental validation of platform jack-up stability remain insufficient. This study aimed to establish a comprehensive evaluation framework encompassing penetration depth, anti-overturning/sliding stability, and punch-through risk, thereby filling the gap in holistic platform stability analysis. An entire four-legged centrifuge test at 150× g was integrated with coupled Eulerian–Lagrangian (CEL) numerical simulations and theoretical methods to systematically investigate spudcan penetration mechanisms and global sliding/overturning evolution in clay/sand. The key findings reveal that soil properties critically influence penetration resistance and platform stability: Sand exhibited a six-times-higher ultimate bearing capacity than clay, yet its failure zone was 42% smaller. The sliding resistance in sand was 2–5 times greater than in clay, while the overturning behavior diverged significantly. Although the horizontal loads in clay were only 50% of those in sand, the tilt angles at equivalent sliding distances reached 8–10 times higher. Field validation at Guangdong Lemen Wind Farm confirmed the method’s reliability: penetration prediction errors of <5% and soil backflow/plugging effects were identified as critical control factors for punch-through risk assessment. Notably, the overturning safety factors for crane operation at 90° outreach and storm survival were equivalent, indicating operational load combinations dominate overturning risks. These results provide a theoretical and decision-making basis for the safe operation of large WTIVs, particularly applicable to engineering practices in complex stratified seabed areas.
1. Introduction
WTIVs function as critical infrastructure for offshore wind turbine generator (WTG) installations, integrating WTGs’ transportation, heavy-lifting operations, and accommodation services, and play an irreplaceable role in the construction of offshore wind farms. Compared with traditional jack-up drilling units, WTIVs operate in a wider range of sea areas and have a significantly increased leg installation/extraction frequency due to the dense distribution of WTG sites. Recent trends toward increased individual WTG capacities, expanded wind farm scales, and offshore distances have resulted in the significant escalation of variable loads (e.g., leg-encircling crane operations) and environmental loads during elevated operational phases. In this context, the leg–spudcan system is the only load-bearing structure during jack-up operations. It is necessary to make the load of each leg gradually approach the design target value via a diagonally opposite leg preload, finally enabling the whole platform to reach the stable state of static equilibrium [1]. This process is critical for ensuring the global stability of the platform under complex geological conditions and extreme loading scenarios.
Spudcan penetration resistance and depth analysis (i.e., foundation bearing capacity prediction based on soil strength profiles) constitute the fundamental basis for assessing global jack-up platform stability. This involves complex geomechanical challenges, including large-deformation failure mechanisms, soil flow patterns, and backfill evolution. Recent systematic studies on spudcan penetration resistance and bearing capacity prediction in stratified seabeds have faced two primary challenges:
(i) Theoretical limitations—Conventional SNAME/ISO standards employ shallow foundation bearing capacity formulas based on the “projected area method” and “punch-through shear method,” relying on oversimplified assumptions (e.g., linear interpolation of the transition layer bearing capacity). These approaches fail to capture critical mechanisms such as progressive soil failure (e.g., sand dilatancy effects and clay strain softening) and post-punch-through soil plug retention [2], leading to significant prediction errors in peak resistance and punch-through depth [3].
(ii) Physical mechanism complexity—Simplified models cannot adequately account for coupled factors, including cavity formation mechanisms during penetration by varying spudcan geometries [4], the spatial variability of soil properties [5], interlayer interactions in stratified soils [6], and partial drainage effects in intermediate soils (e.g., silty sand and sandy silt [7]).
Building upon this foundation, recent research on spudcan punch-through incidents has primarily focused on sand-over-clay seabeds prevalent in the North Sea and South China Sea. When a spudcan penetrates the sand layer, soil arching effects develop, achieving peak bearing capacity (qpeak). Upon penetrating the underlying soft clay, the bearing capacity drops abruptly, triggering rapid platform subsidence [8,9]. The severity of this phenomenon is predominantly influenced by three factors: (i) sand layer thickness, where thicker sand layers enhance soil arching effects, elevating qpeak [3]; (ii) clay undrained shear strength (su), where lower su values correlate with greater reductions in post-peak resistance (qpost-peak) [10]; and (iii) the spatial heterogeneity of clay strength, where localized weak zones exacerbate punch-through risks [11]. Numerical prediction accuracy depends critically on the appropriate selection of soil constitutive models and the spatial distribution of sand relative density and clay su [12]. For stiff-over-soft clay seabeds in Southeast Asian waters (e.g., the Malay Basin and Java Sea) and the Gulf of Mexico, Lee et al. [13] proposed spudcan design optimizations with peripheral skirts and perforations to mitigate punch-through risks. However, research on multi-layered seabed punch-through mechanisms remains unexplored.
Existing studies on the global anti-sliding stability of jack-up platforms have primarily focused on pre-existing seabed footprints and seabed slope effects. Jun et al. [14] demonstrated via CEL large-deformation analysis that spudcan reinstallation near seabed footprints induces significant horizontal loads and overturning moments, peaking at 15% of vertical loads. Additionally, Hu et al. [15] developed parametric design tables using finite element limit analysis (FELA), incorporating the cone angle, embedment ratio, and strength gradient, providing quantitative criteria for anti-sliding design. Regarding seabed slope impacts, Zhang et al. [16] revealed via centrifuge tests that the anti-sliding capacity of mat foundations significantly decays with increasing seabed slope. When slope angles exceed 5°, the anti-sliding capacity decreases by over 20%, though increasing the leg penetration depth can enhance platform stability. For individual spudcan foundations, Lei et al. [17] employed a coupled material point–finite element method (MPM-FEM) model, demonstrating that inclined seabeds alter soil bearing mechanisms and failure modes, transforming symmetrical shear failure into asymmetrical flow, thereby compromising foundation stability. These studies confirm that seabed slope parameters must be incorporated into anti-sliding stability assessments, though existing research has not comprehensively integrated operational loads or anti-overturning stability considerations.
Although scholars have achieved significant results in the fields of single-spudcan penetration resistance and punch-through analysis, providing theoretical support and engineering references for penetration prediction and risk assessment, systematic research and experimental validation on the jack-up stability of self-elevating platforms remain insufficient, with notable gaps particularly in the analysis of global anti-overturning and anti-sliding stability.
To address this shortcoming, an entire four-legged centrifuge test at 150× g was conducted to investigate spudcan penetration mechanisms in typical clay and sand strata, along with the evolution of global sliding and overturning behavior. Building on this, CEL numerical simulations (via ABAQUS 2022/Explicit) and traditional theoretical methods were integrated to establish a comprehensive framework for predicting spudcan penetration depth, evaluating global anti-overturning/sliding stability, and assessing punch-through risk in complex layered seabeds. Finally, the reliability of this framework was validated through a full-scale case study of vessel installations at the Guangdong Lemen Wind Farm. The findings and the proposed “mechanism interpretation–numerical reconstruction–engineering validation” framework provide a theoretical basis and decision-making support for the safe operation of large WTIVs, and is particularly applicable to engineering practices in complex stratified seabeds.
2. Methodology
The structure during jack-up operations of WTIVs is not only affected by wind, waves, current environmental loads, and the crane operation load, but also by the dynamic inertia load (DAF) and P-Δ effect load. The gravity load of the integrated platform forms the overall horizontal load and overturning moment of the platform and is distributed to each leg through the jacking system. Consequently, the vertical and horizontal loads of the sliding of the spudcan are obtained. Therefore, the jack-up stability analysis of WTIVs mainly includes the penetration depth, anti-sliding and overturning stability, and punch-through analysis, as delineated in Figure 1. The core of the whole process analysis is soil–spudcan interaction. Given the high cost of offshore in situ tests and the lack of field measurement data on spudcan penetration, this research mainly relied on three methods: the scale model test, finite element numerical simulation, and theoretical specification calculation (SNAME/ISO).
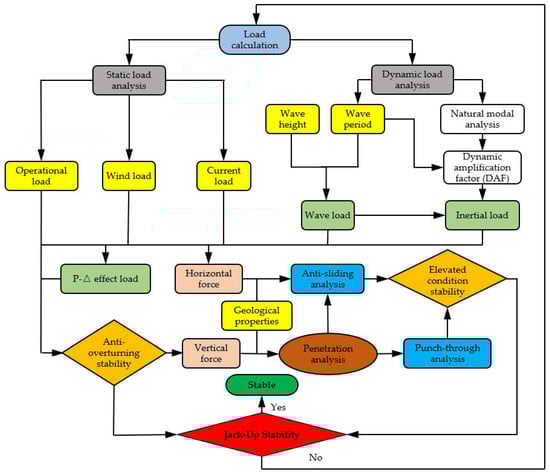
Figure 1.
Analytical workflow for jack-up stability assessment of WTIVs.
2.1. Geotechnical Model Test
The geotechnical model test primarily includes a conventional scaled model at 1× g and a geotechnical centrifuge model at Ng [18]. The scaled model at 1× g: The interaction between the reduced-scale spudcan and the soil is simulated in the constant gravity field, and the soil deformation, stress distribution, and bearing capacity–depth relationship curve around the spudcan are obtained. However, it fails to replicate soil backfill phenomena due to the lack of stress similitude principles. The centrifuge model test Ng: Based on the similarity principle, the centrifugal acceleration (Ng) is used to make the scale model (ratio 1/N) and the in situ soil reach the equivalent stress state to accurately simulate the mechanism of spudcan penetration and intuitively capture the soil failure mechanism. Although proficient in reproducing in situ soil mechanical behavior with diminished experimental expenditures, it is inherently constrained by scale effects and boundary effects [19], thereby necessitating complementary validation via numerical simulations.
In this study, the evolution of the penetration depth and vertical bearing capacity of clay and sand were systematically studied using the 150× g centrifugal model test, which provided a verification basis for numerical simulation and theoretical calculation. A complete model test of four legs was carried out on this basis, focusing on the platform’s overall anti-overturning and anti-sliding characteristics.
2.1.1. Centrifuge Apparatus and Scaled Model
Tests were conducted in a TK-C500 geotechnical centrifuge (Figure 2a,b), with the following technical specifications: a maximum acceleration of 250× g; a payload capacity of 500 g-ton; swing basket dimensions of 1.4 m (length) × 1.5 m (width) × 1.5 m (height); and a rotor configuration comprising a single asymmetric swing basket with a dynamic balancing system to ensure stability under high-g conditions.
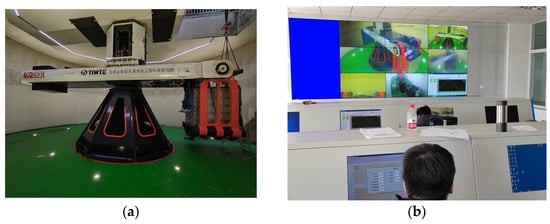
Figure 2.
(a) TK-C500 centrifuge. (b) Control system.
A 1:150 scaled entire four-legged platform model (Figure 3) was fabricated using additive manufacturing (3D printing) to replicate the prototype’s mass distribution and superstructure stiffness. The key dimensions of the prototype vessel and scaled model, based on the relevant scaling laws for Ng centrifugal model testing obtained from Table A1 in Appendix A, are summarized in Table 1.
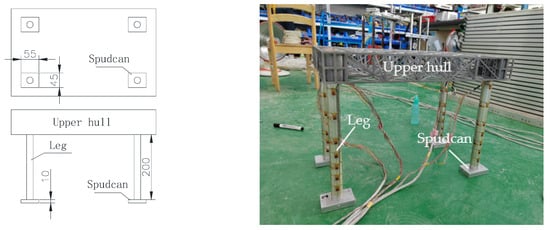
Figure 3.
Geometrical parameters and physical specimen of WTIV model.

Table 1.
Ship particular represented by ship model.
The prototype spudcan’s geometry is illustrated in Figure 4a. The strain-monitoring system comprised full-bridge strain gauges for measuring the bending moments at leg cross-sections; half-bridge strain gauges for monitoring axial loads; and a soil pressure sensor and a pore pressure sensor to record the soil pressure and pore water pressure evolution, respectively. The sensor installation configurations are detailed in Figure 4b. The calibration coefficients of the pressure sensors and strain gauges are given in Table A2 and Table A3 in Appendix A, respectively.
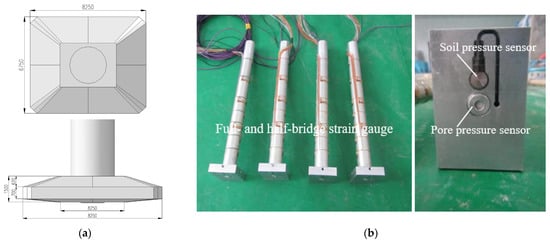
Figure 4.
(a) Full-scale dimensions of spudcan. (b) Installation of full- and half-bridge strain gauges, soil pressure sensor, and pore pressure sensor.
2.1.2. Soil Sample of Clay
Malaysian kaolin clay was used in this test, and its physical properties are shown in Table 2. The preparation of the clay foundation was first pre-consolidated to the initial strength at 1× g; then, centrifugal consolidation was carried out at 150× g, and LVDT (Linear Variable Differential Transformer) was used to monitor the settlement until the degree of consolidation reached ≥90%, resulting in a final clay thickness of 53 cm (freeboard: 57 cm). Finally, the strength profiling involved measuring the su via four single-field vane shear tests (VSTs) at 1× g and one cone penetration test (CPT) at five different points via in situ soil testing. The aggregated data analysis of the undrained shear strength su is given in Table A4 in Appendix A, yielding a linear strength profile (Figure 5):
where su is the undrained shear strength (kPa), and z denotes the prototype depth (m).
Table 2.
Geotechnical properties of Malaysian kaolin clay.
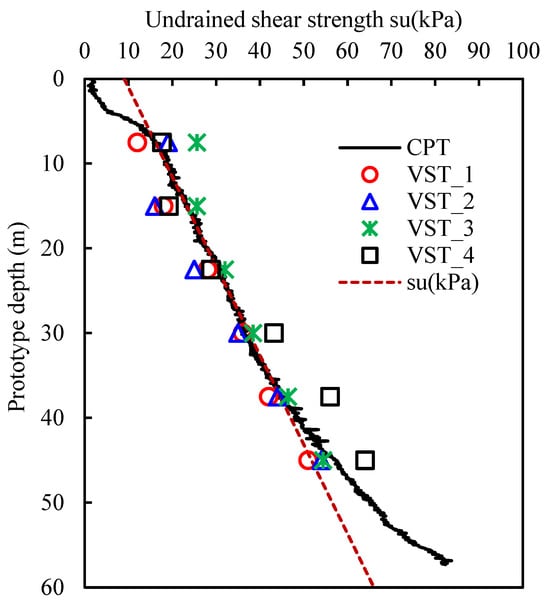
Figure 5.
Undrained shear strength profile of model clay obtained from CPT and VST (1× g) tests with linear su–z gradient fitting.
2.1.3. Soil Sample of Sand
Fujian standard silica sand (properties detailed in Table 3) was prepared using the sand-raining method with controlled parameters: The sand was sprayed into the soil box with a drop distance of 50 cm to achieve the appropriate thickness. Subsequently, the soil box was hoisted into the basket of the centrifuge, and the vertical loading equipment and CPT were installed. After accelerating the centrifuge to 150× g, the in situ test was carried out. The curve of the internal friction angle of the sand with depth is shown in Figure 6. The overall depth profile of strength did not change much, except for a surface effect on the sand surface, and it was close to the internal friction angle obtained via the indoor direct shear test.
Table 3.
Fujian standard sand properties.
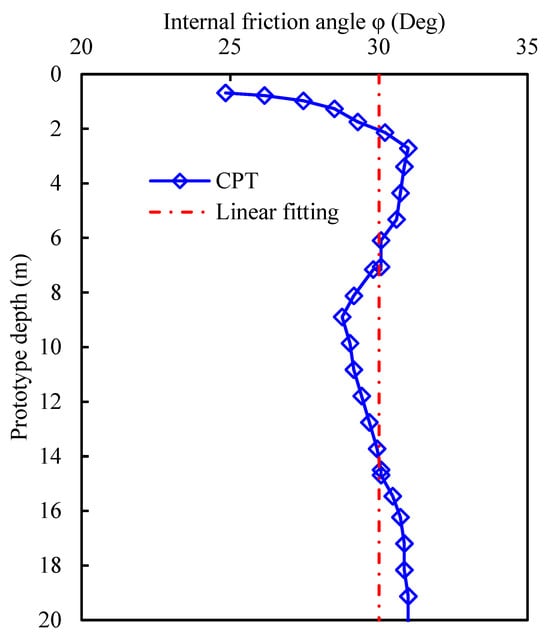
Figure 6.
Internal friction angle of sand.
2.1.4. Penetration Test Loading
The penetration test employed a displacement-controlled loading protocol (test apparatus shown in Figure 7). The centrifuge acceleration was gradually increased to achieve a target gravitational field of 150× g within 15 min and 30 s, ensuring a stabilized in situ stress field. Following stress equilibration, the hydraulic servo-actuation system drove the spudcan at a constant penetration rate of 1 mm/s to the target depth. The following dimensionless criterion was satisfied to guarantee undrained conditions during penetration:
where v is the penetration rate (mm/s), D represents the equivalent spudcan diameter (mm), and cv stands for the coefficient of consolidation (mm2/s).
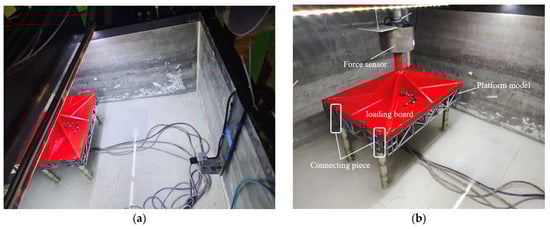
Figure 7.
Centrifugal model test for penetration: (a) complete test setup inside centrifuge; (b) overall loading arrangement and sensor layout diagram.
2.1.5. Anti-Overturning and Sliding Test Loading
Following the penetration test, anti-overturning and sliding tests were conducted. Considering the significantly higher bearing capacity of sand compared with clay and the actual strength of the scaled model legs, tests were performed for clay soil at penetration depths of 1 L and 2 L (L = spudcan length) and sand soil at penetration depths of 0 L and 0.15 L.
The general layout scheme and sensor layout of the horizontal loading design of the platform are shown in Figure 8. The whole test process and loading method were as follows: A crane was used to remove the vertical loading hydraulic cylinder, which was replaced with the horizontal loading hydraulic cylinder. The horizontal force sensor and the horizontal loading push rod were installed. The horizontal loading hydraulic cylinder was adjusted to make the horizontal loading push rod face the midpoint of the platform. According to the position of the platform, the laser displacement sensor was installed on the top and around the platform to monitor the platform’s horizontal displacement and tilt angle. A camera was installed on the inner wall of the soil box to capture the platform penetration process. The sensor was connected to the data acquisition instrument, and all kinds of cables were fixed onto the guide rail with cable ties to avoid the influence of cable swing during the centrifugal test. The soil box was weighed with the crane scale, and the counterweight required by the centrifuge was calculated and hoisted. The stress field in the soil box was increased to 150× g by linearly increasing the rotation speed of the centrifuge. After the soil was stable, the platform horizontal loading test was started. The hydraulic cylinder was controlled, and the horizontal load was applied at a speed of 1 mm/s until the platform became unstable and the test stopped.
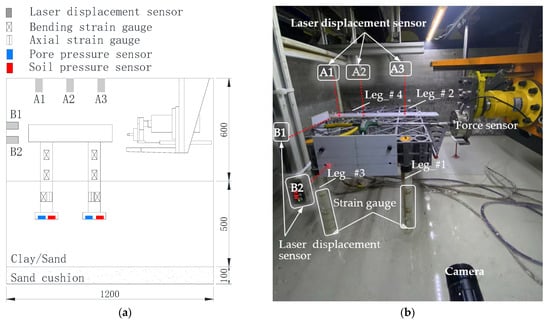
Figure 8.
Anti-overturning and sliding centrifuge model test: (a) general layout scheme; (b) overall loading arrangement and sensor layout diagram.
2.2. Numerical Simulation Methods
The numerical simulation method, as a prevalent approach for analyzing spudcan–soil interactions, facilitates the high-fidelity simulation of soil flow dynamics and backflowing mechanisms during spudcan penetration. The size of the spudcan of new-generation WTIVs is large, and its penetration stage is often accompanied by a large range of extrusion and heave of the surrounding soil, representing a classical geotechnical large-deformation problem. The large deformation finite element (LDFE) method can simulate the process of unloading and backfilling of the restored soil more realistically by establishing an axisymmetric or three-dimensional finite element model. Its predictions exhibit strong concordance with empirical observations and centrifuge test data. At present, the CEL nonlinear material large deformation finite element method, which combines the advantages of the Lagrange method and the Euler method, effectively resolves challenges associated with continuous penetration-induced soil failure and mesh distortion [20]. This method can be implemented using the explicit calculation module of the general software Abaqus (Explicit), in which the soil is modeled using the Euler element, and the position is fixed without distortion. The mesh element can be occupied by one or more materials, and the flow trajectory of the soil material is described via element volume fraction (EVF) tracking. Compared with the implicit calculation, the explicit calculation does not need to be iterated, but its stability still needs to be guaranteed via the critical stability time increment. The estimation formula of () is as follows [21]:
where is the minimum mesh size (m), ρ represents the material density (kg/m3), and E denotes the elastic modulus (Pa). Parametric sensitivity analyses of the mesh size and penetration rate are essential for computational optimization.
Based on the data of the 150× g centrifugal model test, a prototype-scale numerical model of the spudcan–soil interactions of WTIV was developed. A quarter-symmetry soil domain was implemented to enhance computational efficiency (Figure 9), with the soil discretized using Eulerian elements (EC3D8R). The model depth was set to 50 m, and a 10 m thick cavity layer was set on the surface to accommodate the soil heave induced by penetration and prevent the material boundary from overflowing. Based on the geometric parameters of the actual ship, the Lagrange element (C3D10M) was used to simulate the rigid characteristics (the elastic modulus of steel is significantly higher than that of soil, and the deformation can be ignored).
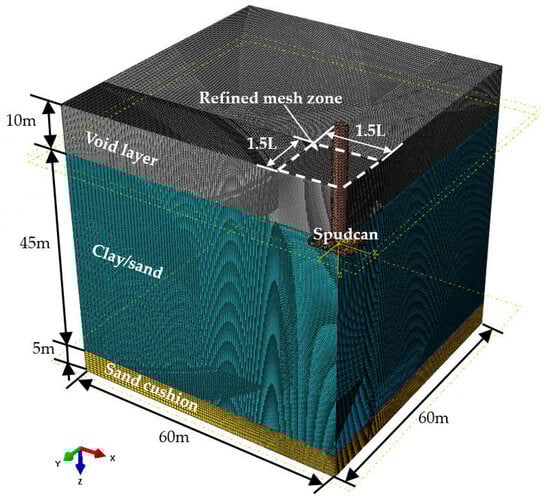
Figure 9.
CEL model mesh and size for Centrifugal model test.
The values of the parameters used in the numerical simulations are given in Table 4, and the detailed settings are described as follows:
Table 4.
Values of parameters used in numerical simulations.
- (1)
- The grid division strategy of the computational domain: The core area of 1.5 L × 1.5 L around the spudcan adopted a dense grid, and the unit size was determined to be 0.03 L (≈0.25 m) using grid convergence analysis.
- (2)
- The boundary conditions and contact settings: The normal velocity constraint (vn = 0) was applied to the lateral surfaces, and the bottom boundary was fixed in all degrees of freedom (a 5 m thick sand cushion was placed at the bottom of the clay model). The general contact algorithm was used to define the spudcan–soil interaction. The normal behavior adopted penalty function contact, and the tangential behavior was set as a frictionless model (based on the assumption of clay’s low-permeability characteristics).
- (3)
- The loading method: Considering the sensitivity of the clay penetration rate (vp = 0.1~0.8 m/s), covering the common range of full scaled installation (1~10 mm/s), the initial stress state was realized by applying the gravity load step by step, and the artificial boundary effect was eliminated.
2.3. Theoretical Calculation Methodology
2.3.1. Penetration Depth Prediction
Given the time and cost constraints associated with model testing and numerical simulation, ultimate bearing capacity theory is widely adopted for the rapid estimation of spudcan penetration resistance in engineering practice. The theoretical models governing spudcan mechanical responses during penetration through heterogeneous strata, based on soil stratification characteristics and distinct failure mechanisms, are illustrated in Figure 10. For a square spudcan, the ultimate bearing capacity qu (kPa) in three geotechnical scenarios is calculated as follows [22,23,24]:
Here,
where denotes the ultimate bearing capacity at the spudcan base (kPa). represents the undrained shear strength of clay (kPa), calculated as the depth-averaged value within B/2 below the spudcan–soil interface [20]. stands for the bearing capacity factor for clay. indicate the shape and depth correction factors for clay, respectively. B and L correspond to the spudcan width and length (m). signifies the soil internal friction angle (°). D is the penetration depth from the seabed to the spudcan base (m). denotes the effective overburden pressure at the spudcan base (kN). represents the effective unit weight of the soil above the spudcan (kN/m3). stands for the bearing capacity factor for sand. indicate the shape and depth correction factors for the overlying soil, respectively. correspond to the shape and depth correction factors for sand, respectively. , , and signify the inclination factors (default = 1 for vertical loading).
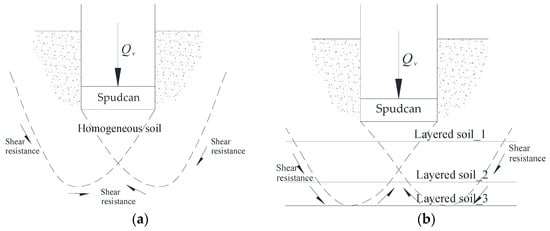
Figure 10.
Schematic diagram of spudcan penetration resistance analysis: (a) homogeneous soil; (b) layered soils.
2.3.2. Anti-Sliding Resistance Calculation Method
Sliding arises from insufficient horizontal bearing capacity under external loading, where asymmetric soil confinement—caused by seabed inclination or proximity to pre-existing footprints—further diminishes anti-sliding resistance. Both failure mechanisms involve large-deformation soil behavior, including shear localization, strain softening, and stress redistribution due to soil flow. The total anti-sliding resistance of the spudcan embedded in the seabed is mainly composed of the base sliding resistance and the lateral soil resistance from the embedded sidewall area:
where is governed by the differential between passive and active earth pressures:
where is the passive earth pressure, denotes the active earth pressure (neglected when negative), and represents the incremental area of the spudcan–soil interface.
For clay soil, the formulas for earth pressures are as follows:
Base resistance:
where represents the buoyant unit weight of soil; denotes the undrained shear strength at depth z; is the spudcan base contact area; and is the undrained shear strength at the contact interface. In the above formula, when is negative, it is not considered.
For sand, the difference between the active earth pressure and passive earth pressure is
where and are the coefficients of passive and active earth pressure, respectively, calculated using the following formulas:
The calculation formula for the base resistance is
where φ′ is the effective internal friction angle, and α is the friction reduction coefficient, with a typical range of 0.6–0.8.
2.3.3. Anti-Overturning Stability Calculation Method
In elevated conditions, a WTIV is subjected to combined environmental loads, inertial loads, P-Δ effects, and functional loads (predominantly crane operations). These loads collectively generate an overturning moment Mo, which must be counterbalanced by the stabilizing moment Ms derived from gravitational forces. The design verification requires analysis of the most critical load combination, typically assuming concurrent environmental and functional load directions. The overturning safety criterion is expressed as
where γ is the safety factor against overturning, with γ = 1.1 being the minimum requirement for jack-up units according to ISO 19905-1 [25]; Δ represents the total hull sway (lateral displacement) primarily induced by environmental loads; P denotes the average axial leg load attributable solely to functional loads, where hull-level analysis typically suffices; n indicates the number of legs; Mwc corresponds to the moment generated by combined wave and current loads; Mw stands for the wind-induced moment; MDAF characterizes the inertia moment incorporating stochastic dynamic amplification factors (DAFs); and Mcrane quantifies the operational moment from crane operations.
2.3.4. Theoretical Methods for Punch-Through Assessment
Punch-through predominantly occurs in stiff-over-soft stratified sediments when spudcan penetration destabilizes the overlying stratum, inducing uncontrolled penetration into weaker underlying layers. Such failure is directly related to abrupt reductions in the bearing capacity factor Nc. This study addressed punch-through evaluation for two typical seabed soil profiles.
For stiff-over-weak clay conditions (Figure 11a), the punch-through capacity at the top of the stiff layer was calculated based on the punching shear failure criterion [21]:
where denotes the ultimate vertical bearing capacity at the top of the stiff clay layer (kPa); represents the bearing capacity of the underlying weak clay (kPa); and signify the undrained shear strength of the stiff clay and weak clay layers, respectively (kPa); D corresponds to the penetration depth from the seabed to the spudcan base (m); and H indicates the vertical distance from the spudcan base to the weak clay layer (m). The punch-through criterion is defined as .
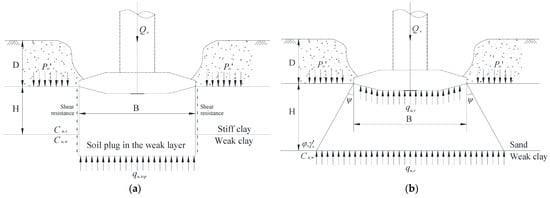
Figure 11.
Punch-through modes: (a) stiff-over-weak clay; (b) sand-over-weak clay.
For sand-over-weak clay conditions (Figure 11b), the load-spreading method was employed to evaluate the punch-through potential. This approach assumes that the spudcan load applied to the upper (stiff) layer spreads downward, generating an “equivalent bearing pressure” at the top of the underlying weak clay layer. Punch-through occurs if this pressure exceeds the bearing capacity of the weak clay. The equivalent bearing pressure is calculated as [26]
where stands for the equivalent bearing pressure at the weak clay layer (kPa); represents the ultimate bearing capacity of the sand layer beneath the spudcan (kPa); and denotes the undrained shear strength of the weak clay layer (kPa). Punch-through occurs if .
3. Results and Discussion
3.1. Penetration Resistance Analysis
3.1.1. Penetration Resistance of Clay
The clay stratum was simulated using an ideal elastoplastic Tresca constitutive model to represent undrained conditions. The elastic modulus E was specified as 500–1000 times the undrained shear strength su [27], with Poisson’s ratio μ = 0.49. The material parameters are fully documented in Table 3.
Mesh convergence analysis (Figure 12a) confirmed numerical solution convergence when the element size in the spudcan-adjacent refined zone (1.5 L × 1.5 L) was ≤0.03 L. Penetration rate sensitivity analysis (Figure 12b) indicated the minimal sensitivity of the CEL simulations to penetration rate variations. The numerical results demonstrated stronger agreement with the centrifuge test data than theoretical methods, with theoretical errors exceeding 10% at a 12 m penetration depth.
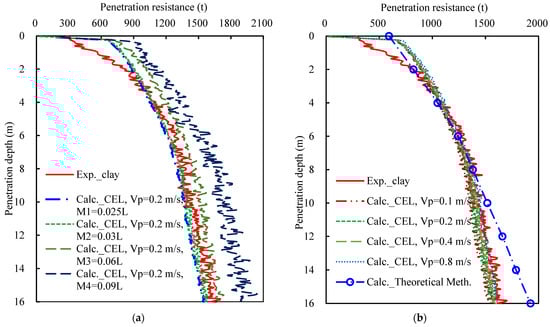
Figure 12.
Variation curves of spudcan penetration resistance with depth in clay: (a) grid size convergence analysis; (b) penetration rate convergence analysis.
The plastic deformation and stress distribution of the soil at different penetration depths are shown in Figure 13. The plastic zone of the soil was mainly distributed near the bottom of the spudcan and the area around the spudcan hole wall. The corresponding displacement vector diagram of the surrounding soil is shown in Figure 14. Failure mechanism evolution analysis indicated the following: shallow penetration (4 m) induced global shear failure with lateral soil extrusion and vertical cavity formation; intermediate depth (8 m) triggered localized shear and backfill, increasing surface heave by 38%; and deep penetration (12 m+) exhibited a stabilized bearing capacity governed by remolded strength. Backfilling emerged as the dominant mechanism. No further heaving occurred at the soil surface, as it was no longer affected by localized shear failure around the spudcan. This observation was in full accordance with the localized plastic flow failure assumption proposed by Hossain et al. [28]. This process clearly demonstrates the coupled effects between progressive clay softening and cavity development.
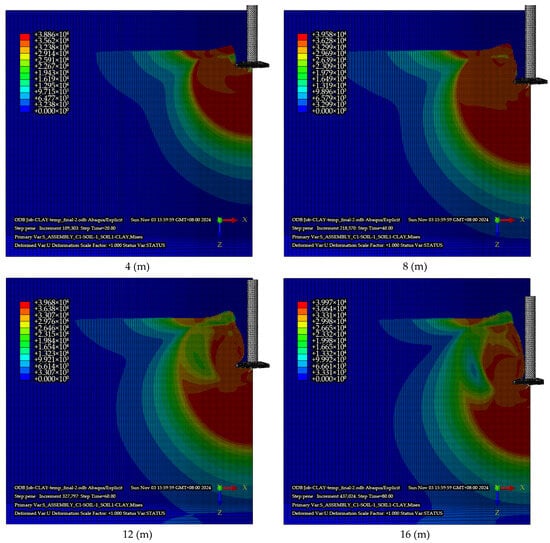
Figure 13.
The cloud diagram of Mises stress for clay at typical penetration depths (Pa).
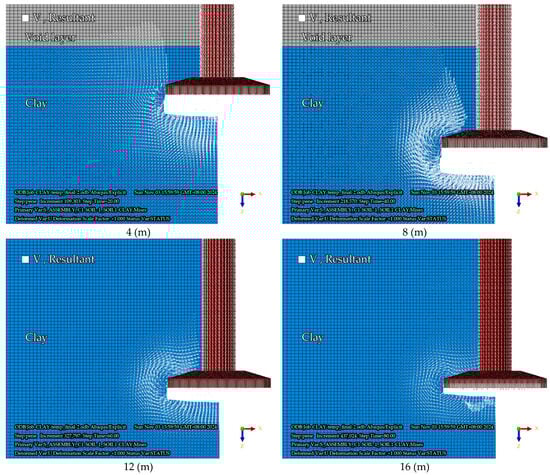
Figure 14.
Surrounding soil displacement vector diagram of clay at typical penetration depths.
3.1.2. Penetration Resistance of Sand
The sand stratum was simulated using the Mohr–Coulomb constitutive law to represent drained conditions, with elastic modulus E = 25 MPa (within the typical 10–50 MPa range for dense sand), Poisson’s ratio μ = 0.3, and interface friction coefficient α∙tanφ (α = 0.5) [29].
The convergence analysis of the grid size (Figure 15a) and penetration speed (Figure 15b) confirmed that the CEL numerical solutions achieved convergence at a refined zone size of 0.03 L and a penetration speed of 0.2 m/s. These results correspond well to the centrifuge test data. Theoretical calculations incorporating soil backfill exhibited a moderate correlation with the experimental results at penetration depths of <2 m, while discrepancies progressively increased beyond a 2.5 m depth.
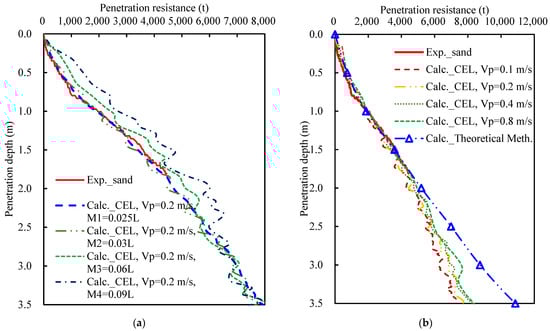
Figure 15.
Variation curves of spudcan penetration resistance with depth in sand: (a) grid size convergence analysis; (b) penetration speed convergence analysis.
Based on the stress distribution cloud diagram of typical calculation insertion depth shown in Figure 16, the stress distribution range of sand is much smaller than that of clay. The displacement vector diagram (Figure 17) revealed distinctive dilatant behavior in sand. Shallow penetration (0.6 m): Rapid backfill occurred, with the collapsed cavity diameter limited to 1.2 L. Intermediate-to-deep penetration (≥1.3 m): Nonlinear growth in penetration resistance was observed, accompanied by minimal surface heave (<5% L).
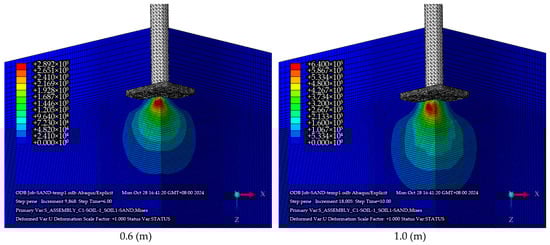
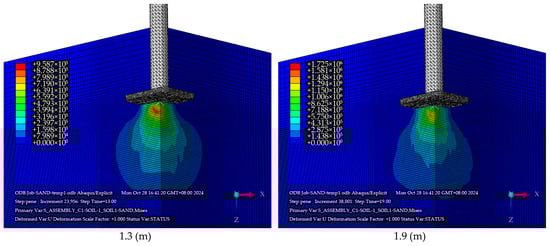
Figure 16.
Cloud diagrams of Mises stress for sand at typical penetration depths (Pa).
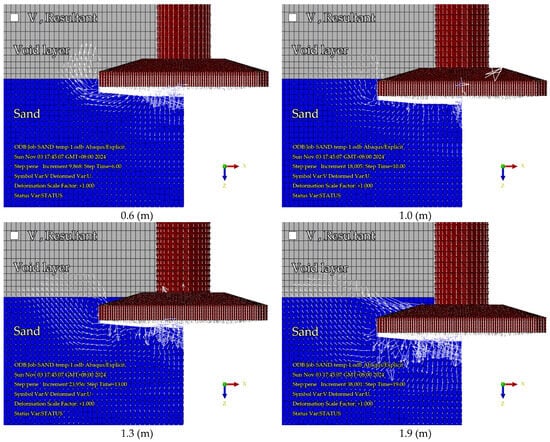
Figure 17.
Surrounding soil displacement vector diagrams of sand at typical penetration depths.
Comparative analysis demonstrated that penetration resistance in sand substantially exceeded that in clay, exhibiting the following distinctive characteristics:
- (1)
- Compared with clay, the shear failure zone in sand was 42% smaller, indicating that energy dissipation via particle rearrangement governed bearing capacity development.
- (2)
- Sand demonstrated nonlinear resistance increases with depth, particularly beyond the critical 0.8 m threshold, reaching the design ultimate bearing capacity of 4400 t at a 1.8 m depth. This response was controlled primarily by interparticle friction and dilatancy effects. Conversely, clay soil exhibited resistance deceleration beyond a 6 m depth, accumulating only 1600 t at a 16 m depth due to bearing capacity plateau effects induced by remolded softening.
- (3)
- The soil disturbance zone surrounding the spudcan was significantly more extensive in clay than in sand. In contrast, sand displayed markedly earlier backfill initiation during penetration. These differential responses necessitate distinct analytical approaches for accurate geomechanical modeling, requiring comprehensive incorporation of backfill effects to ensure the accuracy in theoretical calculations.
3.2. Test Results of Overturning and Sliding Resistance
Anti-overturning and sliding tests were conducted for the scenarios, and the key experimental results are summarized in Table 5. The horizontal forces acting on the platform model post-penetration were measured and scaled to the prototype dimensions based on the model scale ratios for both clay and sand. Figure 18 illustrates the overall horizontal sliding resistance and inclination angle versus sliding displacement, while Figure 19 and Figure 20 give the horizontal sliding resistance and bending moments relative to vertical forces for spudcan legs in clay and sand, respectively. The following experimental phenomena were obtained via comparative analysis:
Table 5.
Comparative analysis of anti-overturning and sliding test results.
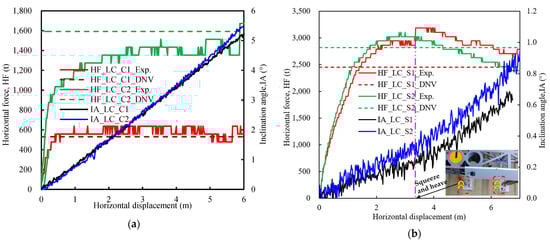
Figure 18.
Overall horizontal sliding resistance and inclination angle versus sliding displacement: (a) overturning and sliding resistance of LC_C1 and C2 in clay; (b) overturning and sliding resistance of LC_S1 and S2 in sand.
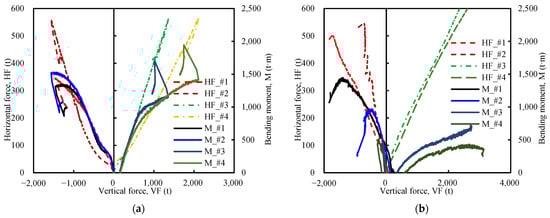
Figure 19.
Variation curves of horizontal force and bending moment distribution on legs with axial force: (a) sliding resistance of LC_C1 in clay; (b) sliding resistance of LC_C2 in sand.
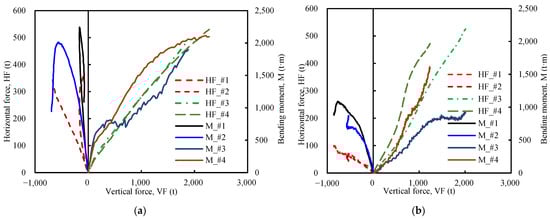
Figure 20.
Variation curves of horizontal force and bending moment distribution on legs with axial force: (a) sliding resistance of LC_S1 in clay; (b) sliding resistance of LC_S2 in sand.
- (1)
- In clay, spudcan penetration depth variation exerted a limited influence on the vertical bearing capacity but significantly enhanced the sliding resistance, aligning with the horizontal bearing characteristics of mat foundations on inclined clay seabeds reported by Zhang et al. [16] via centrifuge testing. However, sand exhibited a 2–5 times greater peak sliding resistance despite shallower penetration. This peak occurred later in sand than in clay, followed by subsequent resistance reduction. Clay maintained near-constant resistance after peak attainment.
- (2)
- Comparison with theoretical methods (Equations (5)–(9)) indicated general agreement between the experimental sliding resistance values and computational results for both soil types, excepting minor deviations (<15%) in the LC_S1 sand case.
- (3)
- Under increasing horizontal loading, all platforms exhibited combined sliding and tilting regardless of the soil type or penetration depth. Clay soils demonstrated near-linear tilt angle progression, with tilt magnitudes at equivalent sliding distances being 8–10 times greater than in sand.
- (4)
- During integrated overturning–sliding resistance states, the compressed spudcans (#3 and #4) consistently sustained higher horizontal sliding resistance and vertical axial forces than the tensioned spudcans (#1 and #2). For the LC_S1 sand case, the shallow embedment of the #1 and #2 spudcans resulted in frictional resistance predominantly developing at the spudcan base, supplemented by limited horizontal resistance from compacted soil mounds (Figure 18b).
The substantially lower horizontal sliding resistance yet greater tilt angles and penetration depths in clay versus sand were attributed to clay’s lower bearing capacity (as shown in the Penetration Resistance Analysis Section). This led to the more pronounced settlement of the compressed spudcans (#3 and #4), resulting in significant tilting despite smaller overall horizontal loads.
3.3. Case Study in Multi-Layered Soils
When WTIVs perform preloading penetration operations in multi-layered soils, the penetration depth depends on the ultimate bearing capacity of the bearing layer and the pressure of the spudcan on the ground when the platform is being installed. Based on the verified CEL numerical simulation and theoretical method, this study took the operation of ‘Haidian Yunwei 801’ in a specific site of the Lemen Wind Farm in Guangdong, China, as an engineering case and carried out the risk assessment of penetration depth, anti-overturning/sliding stability, and punch-through potential of multi-layered soils.
3.3.1. Geological Parameters and Numerical Model Construction
The stratigraphic profile and geotechnical properties of the target site are presented in Figure 21, revealing alternating layers of sand (LM-1/3/4/6/8) and clay (LM-2/5/7). The CEL numerical model (Figure 21) was configured with the following parameters: a refined mesh zone (1.5 L × 1.5 L) surrounding the spudcan with an element size of 0.03 L; radial mesh gradient expansion (0.03 L~0.15 L) in peripheral regions; penetration rate = 0.2 m/s; and a penalty-based friction model for spudcan–soil interface interactions.
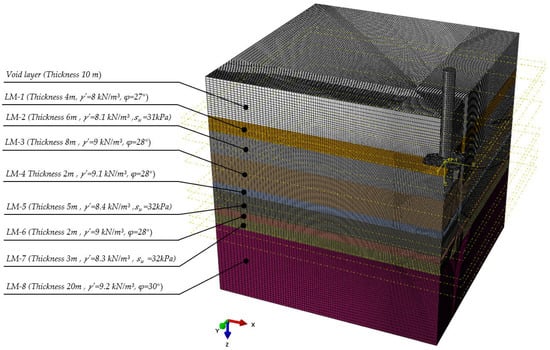
Figure 21.
Stratigraphic profile and geotechnical properties of target site in CEL numerical model.
3.3.2. Penetration Depth and Anti-Overturning and Sliding Analysis
Considering combined platform gravity loads, environmental loads (including dynamic inertial loads), crane operational loads, and associated P-Δ effects, the calculated preloading load was Qpre = 4707.5 t. The field measurements recorded an actual penetration depth of 8.0 m at the target location. CEL displacement vector analysis revealed stratified soil responses (Figure 22):
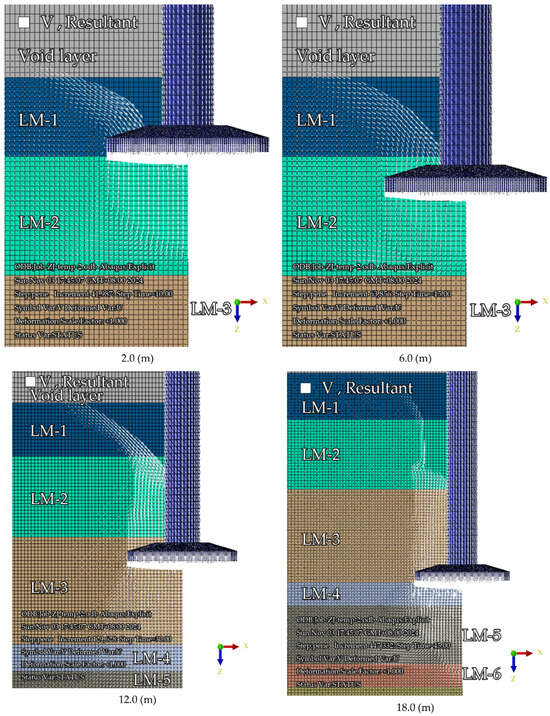
Figure 22.
Surrounding soil vector diagram of typical penetration depths to reflect soil deformation, backflow, and soil-plugging effects around spudcan.
- (1)
- At a 2–4 m penetration (LM-1 sand layer), vertical sand migration formed soil plugs beneath the spudcan, with the lateral extrusion of adjacent LM-2 clay.
- (2)
- At a 6 m penetration, complete clay displacement enabled direct contact between the LM-1 and LM-3 sand layers, triggering an abrupt resistance increase.
- (3)
- Peak resistance Qpeak = 8400 t occurred at a 12 m penetration, corresponding to bearing capacity failure in the LM-5 clay layer, and post-peak resistance Qpost-peak = 7300 t occurred at an 18 m penetration.
Following the WTIV stability analysis framework (Figure 1), all operational scenarios (crane operation, standby, and storm survival) were evaluated:
- (1)
- Anti-sliding stability: At a penetration depth of 8 m, with the spudcan embedded in the LM-2 clay layer, the platform’s sliding resistance was calculated as = 2407 t (Equation (5)). This exceeded the maximum horizontal environmental load of 843 t occurring during storm survival conditions.
- (2)
- Anti-overturning stability: Based on the calculation of relevant parameters in Equation (11), the most critical anti-overturning conditions for this platform occurred during the crane’s operation at 90° outreach (γ = 2.437) and the storm survival condition (γ = 2.441).
The platform satisfied overturning and sliding stability requirements at this site. Critical anti-overturning conditions occurred during storm survival and crane operations with significant overturning moments, necessitating a comprehensive scenario evaluation.
The comparative penetration depth predictions using various computational methods are presented in Table 6 and Figure 23.
Table 6.
Penetration depth prediction accuracy at Lemen Offshore Wind Farm.
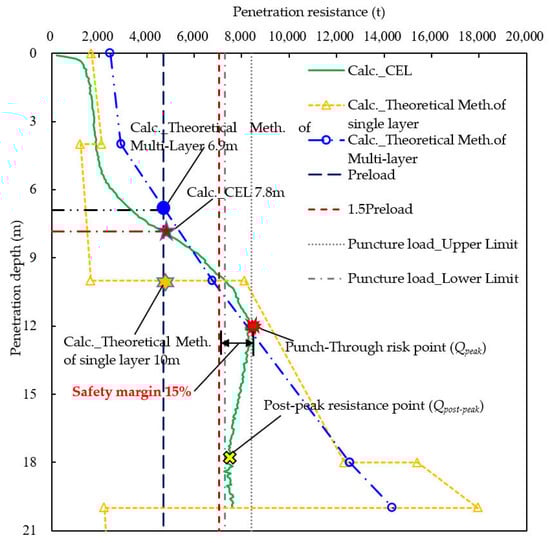
Figure 23.
Results of penetration depth calculation and punch-through analysis for multi-layered soils.
3.3.3. Punch-Through Risk Assessment and Verification
Integrated analysis of the actual penetration depth (8 m) and stratigraphic configuration indicated a potential punch-through risk at the LM-4/5 interface, representing a typical sand-over-weak clay stratigraphy. Equation (13) was consequently applied for punch-through assessment. The calculated ultimate bearing capacity of the LM-5 clay layer, qu,w = 412 kPa, exceeded the equivalent bearing pressure transmitted through the sand layer, qu,e = 365 kPa < qu,w.
The CEL-derived bearing capacity curve (Figure 23) exhibited peak resistance, Qpeak = 8400 t, at a 12 m penetration, followed by reduction to a minimum value, Qpost-peak =7300 t, with further penetration. The preloading load Qpre = 4707.5 t demonstrated non-inclusion within the (Qpost-peak, Qpeak) range; compliance with 1.5Qpre < Qpeak; and a depth differential of >0.5B between the intersection points of Qpre and the peak bearing capacity segment.
Therefore, both theoretical and numerical analyses indicated a negligible punch-through probability at this site. Field operational data confirmed this prediction, validating the methodological reliability for multi-layered soil assessment.
4. Conclusions
This study systematically revealed the penetration mechanisms and stability laws of spudcans for WTIVs in complex seabeds through CEL numerical simulations, entire four-legged platform centrifuge model tests at 150× g, and full-scale case validations. A comprehensive methodology for the evaluation of jack-up stability was proposed. The key findings are as follows:
- (1)
- The penetration behavior of the spudcan exhibited fundamental differences between clay and sand. In clay, penetration evolved through three distinct phases: shallow penetration (≤4 m) triggered general shear failure, forming near-vertical cavities; intermediate depths (≈8 m) transitioned to localized shear, with a 38% increase in surface heave; and deep penetration (≥12 m) shifted to plastic flow dominated by soil backfilling, stabilizing at the remolded strength. Conversely, sand displayed nonlinear resistance growth, surging sharply beyond a critical depth (0.8 m) to reach the design limit (4400 t) at 1.9 m. Sand’s failure zone was 42% smaller than that of clay, and early cavity collapse (diameter ≈ 1.2 L) confirmed particle rearrangement as the primary energy dissipation mechanism.
- (2)
- Platform stability was critically influenced by soil type. For sliding resistance, clay showed linear improvement with penetration depth, with early peak resistance that remained stable, while sand delivered 2–5 times higher peak resistance but exhibited delayed attenuation. Overturning analysis revealed that although the horizontal loads in clay were 50% of those in sand, the tilt angles at equal sliding distances were 8–10 times greater due to the significant settlement of compression legs in low-strength clay, triggering chain-overturning effects. This highlights the necessity of an integrated assessment combining horizontal loads and seabed bearing capacity.
- (3)
- A comprehensive framework for WTIVs’ operational stability integrates sea conditions, geological parameter inputs, and penetration analysis as the basis for anti-overturning/sliding and punch-through assessments. Loads must encompass platform gravity, environmental forces (including DAF), crane operational load, and P-Δ effects. For multi-layered soils, CEL simulations outperformed traditional methods in accuracy (with an error of <5% at a mesh size of ≤0.03 L and a penetration rate of 0.2 m/s), capturing soil plug dynamics and interlayer interactions. The case validation using the ‘Haidian Yunwei 801’ platform at Guangdong Lemen Wind Farm confirmed a controllable punch-through risk (365 kPa equivalent pressure < 412 kPa ultimate bearing capacity), with the preload (4707.5 t) outside the critical zone (7300–8400 t) and the sliding resistance (2407 t) exceeding the environmental loads by 185%. Crane operation during installation (safety factor γ = 2.437) posed a higher overturning risk than storm scenarios (γ =2.441), underscoring the dominance of operational load combinations.
Despite analyzing the global anti-overturning and anti-sliding stability through scaled full-model tests, this study encountered two primary limitations: (i) The entire four-legged platform centrifuge test at 150× g failed to capture microscopic images of soil deformation evolution during spudcan penetration and sliding, due to funding and equipment limitations. (ii) The synchronous implementation of CEL numerical analysis was precluded by insufficient computational resources.
Furthermore, as WTIVs continue expanding into new operational waters, the following areas require further investigation: the penetration mechanisms of spudcans in heterogeneous complex strata; anti-overturning/sliding behaviors under multi-layer geological conditions; and punch-through risk assessment methodologies for non-uniform seabeds.
Author Contributions
M.X.: conceptualization, data curation, formal analysis, investigation, methodology, validation, writing—original draft, and writing—review and editing. Z.W.: project administration, supervision, and writing—review and editing. Y.W.: data curation, methodology, and resources. D.Y.: data curation, methodology, validation, and writing—review and editing. J.C.: data curation, validation, and editing. S.L.: methodology and writing—review and editing. All authors have read and agreed to the published version of the manuscript.
Funding
This research received no external funding.
Institutional Review Board Statement
Not applicable.
Informed Consent Statement
Not applicable.
Data Availability Statement
The data presented in this study are available upon request from the corresponding author.
Acknowledgments
The authors would like to gratefully acknowledge the Offshore Engineering Department for supplying the information and data; Weijie Cheng and Weixia Kang for providing the detailed information on the WTIV series; Baohe Yang and Sha Li for supplying valuable opinions and guidance on this research; and Zhijiang Shi for their participation in the installation, performance, and evaluation of the centrifuge model test.
Conflicts of Interest
The authors declare that they have no known competing financial interests or personal relationships that could have appeared to influence the work reported in this paper.
Appendix A
The determination of the corresponding model dimensions primarily followed the relevant scaling laws for Ng centrifugal model testing obtained from the formula below, where N represents the ratio of centrifugal acceleration to gravity.
Table A1.
Scaling laws for the centrifuge modeling technique.
Table A1.
Scaling laws for the centrifuge modeling technique.
| Parameter | Unit | Scaling Factor |
|---|---|---|
| Linear dimension | m | 1:N |
| Time | s | 1:N2 |
| Mass | kg | 1:N3 |
| Density | kg/m3 | 1:1 |
| Strain | — | 1:1 |
| Stress | kPa | 1:1 |
| Force | N | 1:N2 |
| Displacement | m | 1:N |
| Flexural rigidity | Nm2 | 1:N4 |
| Bending moment | N m | 1:N3 |
Table A2.
Calibration coefficients of soil pressure and hole pressure sensor.
Table A2.
Calibration coefficients of soil pressure and hole pressure sensor.
| Name | Pressure (kPa) | |||||
|---|---|---|---|---|---|---|
| 0 | 100 | 200 | 300 | 400 | 500 | |
| Electrical Signal of Data Acquisition Instrument (mv) | ||||||
| TYC2300520 | 161.2 | 123.0 | 83.0 | 43.2 | 3.5 | −35.8 |
| TYC2300510 | 231.2 | 192.1 | 151.4 | 110.6 | 70.0 | 30.0 |
| TYC2300519 | 255.5 | 214.6 | 172.0 | 129.5 | 86.8 | 44.6 |
| TYC2300512 | 188.5 | 144.4 | 98.4 | 52.3 | 6.0 | −40.0 |
| TYC2300501 | 156.6 | 114.8 | 71.0 | 27.4 | −16.5 | −60.0 |
| TYC2300515 | 64.5 | 18.5 | −29.4 | −77.5 | −125.4 | −172.8 |
| TYC2300513 | 111.0 | 69.5 | 26.3 | −17.0 | −60.0 | −103.0 |
| TYC2300504 | 58.1 | 18.0 | −24.0 | −65.6 | −107.6 | −149.0 |
| TYC2300509 | 142.5 | 92.4 | 40.5 | −11.0 | −62.0 | −112.0 |
| TYC2300505 | 72.0 | 27.5 | −19.2 | −66.0 | −112.6 | −159.0 |
| TYC2300506 | 130.0 | 90.7 | 49.8 | 9.0 | −32.0 | −72.5 |
| TYC2300502 | 184.9 | 123.0 | 72.0 | 23.0 | −25.7 | −74.8 |
| TYC2300503 | −40.0 | −80.0 | −120.0 | −160.0 | −200.0 | −240.0 |
| TYC2300516 | 267.0 | 221.8 | 177.0 | 132.0 | 86.5 | 41.7 |
| TYC2300508 | 104.6 | 62.0 | 19.4 | −23.0 | −66.0 | −108.4 |
| TYC230105 | 177.1 | 154.5 | 134.5 | 111.5 | 84.0 | 60.0 |
| TYC230103 | 62.0 | 37.6 | 13.2 | −11.0 | −35.8 | −60.2 |
| TYC230109 | −681.3 | −712.0 | −732.5 | −757.2 | −780.6 | −804.7 |
| TYC230106 | −141.8 | −169.5 | −197.2 | −224.6 | −252.7 | −280.2 |
| TYC230102 | −130.0 | −151.0 | −173.2 | −195.5 | −218.6 | −241.2 |
| TYC230110 | −221.5 | −245.7 | −270.0 | −294.2 | −318.6 | −342.8 |
| TYC230104 | −118.2 | −142.4 | −167.0 | −191.2 | −216.0 | −240.4 |
| TYC2300518 | 127.8 | 83.6 | 40.0 | −4.0 | −49.0 | −93.4 |
| TYC2300511 | 129.6 | 82.4 | 35.3 | −11.7 | −59.4 | −106.1 |
| TYC2300517 | 108.8 | 57.5 | 5.8 | −45.0 | −96.8 | −147.7 |
| TYC2300507 | −36.0 | −90.0 | −143.8 | −197.5 | −252.5 | −307.0 |
| TYC230101 | −83.4 | −106.5 | −129.8 | −153.2 | −176.4 | −199.8 |
| TYC230108 | 35.2 | 12.2 | −11.3 | −34.5 | −58.0 | −81.5 |
| TYC230107 | −30.4 | −53.5 | −76.8 | −100.0 | −123.4 | −146.7 |
| TYC2300514 | 280.0 | 237.4 | 194.4 | 151.4 | 108.0 | 64.6 |
Table A3.
Calibration coefficients of strain gauge.
Table A3.
Calibration coefficients of strain gauge.
| Name | Calibration Coefficient | Name | Calibration Coefficient | Name | Calibration Coefficient | Name | Calibration Coefficient |
|---|---|---|---|---|---|---|---|
| Ch0 | −31,518.837 | Ch10 | −31,612.620 | Ch20 | −31,643.480 | Ch30 | −31,506.380 |
| Ch1 | −40,973.948 | Ch11 | −40,304.570 | Ch21 | −40,188.370 | Ch31 | −40,610.530 |
| Ch2 | −41,537.559 | Ch12 | −41,182.170 | Ch22 | −41,252.640 | Ch32 | −41,291.710 |
| Ch3 | −41,356.269 | Ch13 | −40,819.820 | Ch23 | −40,970.880 | Ch33 | −40,863.640 |
| Ch4 | −50,978.062 | Ch14 | −50,299.990 | Ch24 | −48,827.090 | Ch34 | −49,286.350 |
| Ch5 | −42,669.339 | Ch15 | −42,458.440 | Ch25 | −42,601.580 | Ch35 | −43,098.310 |
| Ch6 | −37,240.630 | Ch16 | −36,670.250 | Ch26 | −37,180.110 | Ch36 | −37,757.640 |
| Ch7 | −5,424,741.116 | Ch17 | −2,497,743.003 | Ch27 | −5,182,251.047 | Ch37 | −5,249,343.832 |
| Ch8 | −5,092,163.111 | Ch18 | −5,140,379.851 | Ch28 | −5,133,157.146 | Ch38 | −5,101,884.009 |
| Ch9 | −5,346,348.074 | Ch19 | −5,097,914.769 | Ch29 | −5,333,474.151 | Ch39 | −5,098,488.882 |
Table A4.
Data analysis aggregation of undrained shear strength of clay.
Table A4.
Data analysis aggregation of undrained shear strength of clay.
| Depth (m) | VST1 (kPa) | VST2 (kPa) | VST3 (kPa) | VST4 (kPa) | CPT (kPa) | Average (kPa) | Standard Deviation | Linear Fit R2 |
|---|---|---|---|---|---|---|---|---|
| 7.5 | 12 | 19 | 17.6 | 25.6 | 16.3325 | 18.11 | 4.94 | 0.891 |
| 15 | 18 | 16 | 19.2 | 25.6 | 23.643 | 20.49 | 4.0 | |
| 22.5 | 28 | 25 | 28.8 | 32 | 31.501 | 29.06 | 2.84 | |
| 30 | 36 | 35 | 43.2 | 38.4 | 36.404 | 37.8 | 3.26 | |
| 37.5 | 42 | 44 | 56 | 46.4 | 44.397 | 46.56 | 5.5 | |
| 45 | 51 | 54 | 64 | 54.4 | 57.226 | 56.13 | 4.92 |
References
- Versteele, H.; Cathie, D.N.; Kuo, M.Y.K. Planning the preloading procedure to account for rate-effects in clays. In Proceedings of the International Conference: The Jack-Up Platform, London, UK, 12–14 September 2017. [Google Scholar]
- Hu, P.; Haghighi, A.; Coronado, J.; Leo, C.; Liyanapathirana, S.; Li, Z. A comparison of jack-up spudcan penetration predictions and recorded field data. Appl. Ocean Res. 2021, 112, 102713. [Google Scholar] [CrossRef]
- Zhao, J.; Jang, B.S.; Duan, M.; Liang, C. A finite element approach for predicting the full resistance profile of a spudcan deeply penetrating in dense sand overlying clay. Appl. Ocean Res. 2018, 87, 155–164. [Google Scholar] [CrossRef]
- Fan, L.; Gao, P.; Wang, F.; Duan, M. Experimental and numerical investigation on cavity formation from large rectangular spudcan penetration in clay. Appl. Ocean Res. 2020, 108, 102515. [Google Scholar] [CrossRef]
- Luo, W.; Li, J. Effects of installation on combined bearing capacity of a spudcan foundation in spatially variable clay. Appl. Ocean Res. 2021, 117, 102948. [Google Scholar] [CrossRef]
- Choi, J.; Jang, B.S.; Ju, H.; Han, S. Undrained bearing capacity of spudcan in soft-over-stiff clay after penetration. Ocean Eng. 2021, 235, 109369. [Google Scholar] [CrossRef]
- Liu, K.; Wang, D.; Zheng, J. Numerical investigation of spudcan penetration under partially drained conditions. Ocean Eng. 2022, 244, 110425. [Google Scholar] [CrossRef]
- Zhao, J.; Jang, B.S.; Duan, M.L.; Song, L.S. Simplified numerical prediction of the penetration resistance profile of spudcan foundation on sediments with interbedded medium-loose sand layer. Appl. Ocean Res. 2015, 59, 366–378. [Google Scholar] [CrossRef]
- Lee, J.M.; Kim, Y.H.; Hossain, M.S.; Cassidy, M.J.; Hu, Y.; Park, S.G. Mitigating punch-through on sand-over-clay using skirted foundations. Ocean Eng. 2020, 201, 107133. [Google Scholar] [CrossRef]
- Hu, P.; Cassidy, M.J.; Randolph, M.F. Bearing capacity on sand overlying clay: An analytical model for predicting post peak behaviour. Mar. Struct. 2018, 59, 94–104. [Google Scholar] [CrossRef]
- Yi, J.T.; Xu, S.J.; Li, X.B.; Yang, Q.S.; Li, S.Y. Investigation of the peak punch-through capacity of spudcan on sand overlying spatially variable clay. Ocean Eng. 2023, 281, 114948. [Google Scholar] [CrossRef]
- Hossain, M.S.; Hu, P.; Cassidy, M.J.; Menzies, D.; Wingate, A. Measured and Calculated Spudcan Penetration Profiles for Case Histories in Sand-Over-Clay. Appl. Ocean Res. 2018, 82, 447–457. [Google Scholar] [CrossRef]
- Lee, J.M.; Hossain, M.S.; Kim, Y.H.; Cassidy, M.J.; Hu, Y. Mitigation of punch-through in stiff-over-soft clay by changing spudcan shape. Ocean Eng. 2022, 266, 112657. [Google Scholar] [CrossRef]
- Jun, M.J.; Kim, Y.H.; Hossain, M.S.; Cassidy, M.J.; Hu, Y.; Park, S.G. Optimising spudcan shape for mitigating horizontal and moment loads induced on a spudcan penetrating near a conical footprint. Appl. Ocean Res. 2018, 75, 247–259. [Google Scholar] [CrossRef]
- Hu, P.; Leo, C.; Liyanapathirana, S. Horizontal bearing capacity factors for conical footings on clay. Appl. Ocean Res. 2022, 127, 103308. [Google Scholar] [CrossRef]
- Zhang, Q.; Zhu, W.; Ye, G.; Tian, Y.; Yan, Y. Centrifuge tests and numerical simulations on vertical bearing capacity of mat foundation on marine clay seabed. Appl. Ocean Res. 2023, 135, 103534. [Google Scholar] [CrossRef]
- Lei, Z.; Zeng, G.; Ren, H.; Wu, B.; Jie, Y. Effect of the sloping seabed on 3D soil-spudcan interaction using a material point-finite element (MPM-FEM) model. J. Rock Mech. Geotech. Eng. 2024, 16, 1436–1454. [Google Scholar] [CrossRef]
- Craig, W.H.; Chua, K. Deep Penetration of Spudcan Penetrations on Sand and Clay. Geotechnique 1990, 40, 541–556. [Google Scholar] [CrossRef]
- Gaudin, C.; Cassidy, M.J.; Bienen, B.; Hossain, M.S. Recent contributions of geotechnical centrifuge modelling to the understanding of jack-up spudcan behaviour. Ocean Eng. 2011, 38, 900–914. [Google Scholar] [CrossRef]
- Skempton, A.W. The Bearing Capacity of Clays. In Proceedings of the Building Research Congress; Thomas Telford Publishing: London, UK, 1951; pp. 180–189. [Google Scholar]
- Hossain, M.S.; Randolph, M.F. Deep-penetrating Spudcan Foundations on Layered Clays: Centrifuge Tests. Geotechnique 2010, 60, 157–170. [Google Scholar] [CrossRef]
- Terzaghi, K. Theoretical Soil Mechanics; Wiley: New York, NY, USA, 1943. [Google Scholar]
- Meyerhof, G.G. Some recent research on the bearing capacity of foundations. Can. Geotech. J. 1963, 1, 16–26. [Google Scholar] [CrossRef]
- Vesic, A.S. Bearing capacity of shallow foundations. In Foundation Engineering Handbook; Van Nostrand Reinhold: Hoboken, NJ, USA, 1975; pp. 121–147. [Google Scholar]
- ISO 19905-1:2023; Petroleum and natural gas industries including lower carbon energy—Site-specific assessment of mobile offshore units—Part 1: Jack-ups: Elevated at a site. International Organization for Standardization (ISO): Geneva, Switzerland, 2023.
- Hanna, A.M.; Meyerhof, G.G. Design Charts for Ultimate Bearing Capacity of Foundations on Sand Overlying Soft Clay. Can. Geotech. J. 1980, 17, 300–303. [Google Scholar] [CrossRef]
- Qiu, G. Controlled installation of spudcan foundations on loose sand overlying weak clay. Mar. Struct. 2011, 24, 528–550. [Google Scholar] [CrossRef]
- Hossain M S, Randolph M F, Hu, Y. Cavity stability and bearing capacity of spudcan foundations on clay. In Proceedings of the Offshore Technology Conference, Houston, TX, USA, 1–4 May 2006. OTC-17770.
- Kim, Y.H.; Hossain, M.S.; Edwards, D.; Wong, P.C. Penetration response of spudcans in layered sands. Appl. Ocean Res. 2019, 82, 236–244. [Google Scholar] [CrossRef]
Disclaimer/Publisher’s Note: The statements, opinions and data contained in all publications are solely those of the individual author(s) and contributor(s) and not of MDPI and/or the editor(s). MDPI and/or the editor(s) disclaim responsibility for any injury to people or property resulting from any ideas, methods, instructions or products referred to in the content. |
© 2025 by the authors. Licensee MDPI, Basel, Switzerland. This article is an open access article distributed under the terms and conditions of the Creative Commons Attribution (CC BY) license (https://creativecommons.org/licenses/by/4.0/).