Article

Interpretable Ensemble Learning with Lévy Flight-Enhanced Heuristic Technique for Strength Prediction of MICP-Treated Sands

1
School of Resources and Safety Engineering, Central South University, Changsha 410083, China
2
Institute of Innovation, Science and Sustainability, Federation University Australia, Ballarat, VIC 3350, Australia
*
Authors to whom correspondence should be addressed.
Appl. Sci. 2025, 15(14), 7972; https://doi.org/10.3390/app15147972
Submission received: 7 June 2025 / Revised: 11 July 2025 / Accepted: 11 July 2025 / Published: 17 July 2025
(This article belongs to the Special Issue Applications of Machine Learning in Geotechnical Engineering)

Abstract

Microbially-induced calcite precipitation (MICP) has emerged as a promising bio-geotechnical technique for sustainable soil improvement, yet accurate prediction of treatment effectiveness remains challenging due to complex multi-factor interactions. This study develops an ensemble learning framework (LARO-EnML) for predicting the unconfined compressive strength (UCS) of MICP-treated sand. A comprehensive database containing 402 experimental datasets was utilised in the study, consisting of unconfined compression test results from bio-cemented sands with eight key input parameters considered. The performance evaluation demonstrates that LARO-EnML achieves superior predictive accuracy, with RMSE of 0.5449, MAE of 0.2853, R2 of 0.9570, and OI of 0.9597 on the test data, significantly outperforming other models. Model interpretability analysis reveals that calcite content serves as the most influential factor, with a strong positive correlation to strength enhancement, while urease activity exhibits complex, staged influence characteristics. This research contributes to advancing the practical implementation of MICP technology in geotechnical engineering by offering both accurate predictive capability and enhanced process understanding through interpretable ML approaches.

1. Introduction

The geotechnical engineering field confronts significant challenges as traditional soil improvement techniques face increasingly stringent environmental requirements and urban development constraints [1,2]. Conventional soil improvement methods primarily fall into two categories: physical reinforcement and chemical treatment [3,4]. While physical reinforcement techniques (e.g., compaction, grouting, installation of inclusions) demonstrate notable effectiveness, they frequently entail high energy consumption, construction noise, and disturbance to surrounding ground structures [5], which limit their applicability in densely built environments. On the other hand, chemical treatment methods, though relatively mature, often involve the use of synthetic additives such as cement or lime, which pose concerns regarding carbon emissions and potential environmental contamination [6,7]. Against this backdrop, there is a growing demand for sustainable, low-impact, and in situ soil improvement technologies, particularly in the context of large-scale infrastructure expansion and urban redevelopment. Weak granular soils, especially poorly to moderately graded sands, are commonly encountered in various geotechnical applications such as foundation support, embankments, road subgrades, retaining structures, and coastal land reclamation. These soils often suffer from insufficient shear strength and low bearing capacity, making them unsuitable for direct engineering use without reinforcement [4]. Therefore, the development of advanced soil treatment techniques that can enhance the mechanical performance of these problematic sands in an environmentally compatible manner is of critical importance for modern geotechnical practice [8,9].
Against this backdrop, microbially induced carbonate precipitation (MICP) technology has emerged as an innovative soil improvement method based on biomineralisation processes. With its distinctive advantages of environmental friendliness, in situ treatment capability, sustainability, and cost-effectiveness, MICP is gradually becoming a research focus and technological frontier in the geotechnical engineering field [4,10]. MICP technology utilises the enzymatic catalysis of specific microorganisms (primarily urease-producing bacteria) to induce in situ generation of calcium carbonate crystals within soil pores, forming natural cementation materials that improve soil mechanical properties [11,12]. Compared to traditional chemical reinforcement methods, MICP technology offers significant technical advantages. First, this technology utilises urease-producing microbial strains such as Sporosarcina pasteurii, cultivated under controlled laboratory conditions, along with inorganic salt solutions as treatment materials, reducing the use of toxic synthetic chemicals and demonstrating superior environmental compatibility compared to conventional methods. Second, the generated calcium carbonate cement exhibits compositional consistency with natural carbonate rock minerals, enabling MICP-treated geotechnical materials to demonstrate excellent stability and durability [13,14].
However, MICP faces substantial challenges in practical engineering applications, particularly the difficulty in accurately evaluating treatment effectiveness [6]. This technology involves multi-phase coupling processes encompassing biological, chemical, and physical interactions, with treatment outcomes influenced by multiple factors including soil particle characteristics, microbial activity, and site environmental conditions [15,16]. These influencing factors typically demonstrate nonlinear and coupled relationships, making traditional empirical formulas and simplified theoretical models inadequate for accurately describing the variation patterns of MICP-treated sand strength characteristics [6]. Unconfined compressive strength (UCS) serves as a critical indicator for evaluating MICP treatment effectiveness, with research and determination primarily conducted through laboratory-based experimental methods [17]. UCS not only reflects the reinforcement effectiveness of bio-cemented sand, but its accurate prediction is crucial for engineering design, construction control, and quality assessment. Therefore, establishing a multi-factor model capable of accurately predicting the UCS of MICP-treated sand holds significant reference value for promoting the engineering application of MICP technology.
In recent years, machine learning (ML) technology has demonstrated tremendous potential in geotechnical engineering predictive modelling, providing new technological approaches for addressing complex engineering problems [18,19,20]. Compared to other traditional methods, ML models can automatically learn complex patterns and nonlinear relationships within data without requiring predetermined mathematical forms, making them particularly suitable for handling complex engineering problems involving multi-factor coupling [18]. For instance, Wang and Yin [6] proposed a predictive strategy integrating multi-expression programming (MEP) with Monte Carlo methods for modelling the complex relationships between bio-cemented sand UCS and multiple influencing factors. Talamkhani [21] employed gradient boosting algorithms to model the UCS of MICP-treated sand samples, with results demonstrating superior predictive accuracy compared to various common ML models. The research also identified key factors affecting strength and proposed relevant recommendations regarding environmental factor mechanisms. Although individual ML models perform well in specific problems, they often suffer from algorithmic bias and insufficient generalisation capability, making it difficult to comprehensively capture multi-dimensional features in complex systems such as MICP [22]. To enhance the robustness and predictive performance of engineering models, ensemble learning techniques have gained widespread attention [22,23]. By integrating multiple diverse learners, ensemble methods can effectively synthesise the advantages of individual models, thereby significantly improving overall prediction accuracy and stability.
To enhance the accuracy and practicality of predicting unconfined compressive strength in MICP-treated sand, this study constructs a multi-model ensemble prediction framework, EnML, based on the LARO algorithm. Additionally, the SHAP (SHapley Additive exPlanations) interpretability analysis method is introduced to systematically analyse the influence mechanisms and relative importance of various variables on prediction results, providing theoretical support and decision-making guidance for understanding the dominant factors in MICP processes, optimising treatment process parameters, and guiding practical engineering applications.

2. Research Methodology

2.1. Ensemble Learning Architecture

In the context of predicting strength characteristics of MICP-treated sand, the heterogeneous nature of material properties, variability in experimental conditions, and nonlinear coupling relationships among various input parameters present significant challenges for traditional single-model learning approaches in comprehensively capturing complex patterns. To enhance prediction accuracy and generalisation capability, this study introduces ensemble learning principles to fully exploit the complementary advantages of different models in feature representation and pattern recognition. Ensemble learning technology effectively improves model generalisation performance and prediction stability by integrating the predictive capabilities of multiple heterogeneous learners, establishing itself as an important technical approach for addressing complex engineering prediction problems [22,24,25].
The ensemble model constructed in this research employs a hierarchical stacking strategy, with the core concept of building a layered learning structure that enables organic integration of prediction information from different models and facilitates high-level feature learning [26]. Specifically, this study selects two representative base learners: extreme gradient boosting (XGBoost), based on gradient boosting mechanisms, and support vector machine (SVM), based on kernel function mapping. These two methods exhibit fundamental differences in mathematical principles, learning paradigms, and feature processing approaches, providing complementary predictive information for the ensemble framework. Building upon this foundation, a multi-layer perceptron (MLP) is further introduced as a meta-learner, leveraging its powerful nonlinear modelling capabilities to perform deep learning on complex patterns among base learner outputs, thereby generating final unconfined compressive strength predictions.
Regarding the training process, the MICP dataset is initially divided into multiple subsets through K-fold cross-validation to prevent information leakage during the ensemble process. Subsequently, the prediction results output by base learners within these subsets are organised to form a new feature space [27]. Through this approach, a prediction matrix of identical size to the original data can be obtained as training data for the meta-learner. This adaptive fusion method fully utilises the advantages of individual models, effectively enhancing the reliability and applicability of MICP-treated sand strength prediction. Through this structured model combination strategy, the evaluation framework developed in this study can more accurately quantify complex association patterns in MICP-treated sand strength characteristics, providing reliable prediction tools for engineering applications of bio-geotechnical technologies.

2.2. Improved Artificial Rabbits Optimisation Method

The artificial rabbits optimisation (ARO) algorithm serves as the fundamental optimisation method for this study, drawing its design inspiration from the foraging behaviours and survival strategies of rabbit colonies in natural environments [28]. As herbivorous animals, rabbits have developed a series of unique survival strategies through natural evolution. For instance, to avoid predator tracking of their nests, rabbit colonies tend to forage in areas distant from their habitats, a behaviour termed the exploration phase in the algorithm. Another critical strategy involves random hiding behaviour, where rabbits randomly construct temporary burrows around their habitat for rapid concealment and threat avoidance [28,29]. Additionally, rabbits possess powerful hind limbs and flexible locomotion capabilities, enabling rapid acceleration, sudden stops, and nonlinear running trajectories to enhance escape probability. This behavioural pattern constitutes the exploitation phase in the algorithm.
The ARO algorithm encompasses two primary phases: detour foraging (exploration) and random hiding (exploitation). During the detour foraging phase, rabbit colonies typically forage at considerable distances while ignoring nearby grasslands. This behaviour is modelled in ARO as each rabbit possessing its own grassland and burrow areas, with random visits to each other’s territories for foraging. Rabbits update their positions based on the locations of other rabbits in the colony while adding perturbations, mathematically described as
v i ( t + 1 ) = x j ( t ) + R · ( x i ( t ) x j ( t ) ) + r o u n d ( 0.5 · ( 0.05 + r 1 ) ) · n 1
where R = L · c represents the running operator for simulating rabbit running behaviour, L = ( e e ( ( t 1 ) / T ) 2 )   sin ( 2 π r 2 ) denotes the jumping length, T represents the maximum number of iterations, r1 and r2 represent random variables within the range [0, 1], and c(k) serves as a mapping vector facilitating random selection of foraging individuals for mutation. This mechanism assists the algorithm in avoiding local optima and executing global search through random perturbations, while the jumping length L generates longer steps during initial iterations and shorter steps in later stages, effectively balancing exploration and exploitation capabilities [29].
During the random hiding phase, each rabbit generates d burrows around its nest in each dimension of the search space and randomly selects one for hiding to reduce predation risk. The position of the j-th burrow for the i-th rabbit is generated through the following equation:
b i , j ( t ) = x i ( t ) + H · g · x i ( t )
where H   = ( T t + 1 T )   ·   r 4 represents the hiding parameter, which decreases linearly with iteration count while introducing random perturbations. This causes burrows to be distributed within larger neighbourhoods initially and gradually narrow their range as iterations progress. The position update strategy for rabbit burrow selection is
v i ( t + 1 ) = x i ( t ) + R · ( r 4 · b i , r ( t ) x i ( t ) )
where bi,r(t) represents a randomly selected burrow position for the i-th rabbit, and r4 represents a random number within the [0, 1] interval. Notably, the transition between detour foraging and random hiding in rabbit colonies is based on energy levels, with the energy factor A ( t )   = 4   ·     ( 1 t T )   ·   ln 1 r representing the conversion mechanism from exploration to exploitation.
To address potential issues of local convergence and insufficient search efficiency when ARO handles complex multimodal optimisation problems, this study introduces Lévy flight mechanisms and selective opposition learning strategies, constructing an improved ARO method (LARO) to enhance optimisation performance [30].
(1)
The Lévy flight method introduces dynamic characteristics to the ARO algorithm updates through heavy-tailed distribution random walk patterns, with step lengths following a Lévy distribution:
L e v y ( l ) u = l 1 γ , 0 < γ 2 l = u | v | 1 / γ
where l represents step length, u N ( 0 , σ u 2 ) , v N ( 0 , σ v 2 ) , σv = 1, σ u = Γ ( 1 + β ) · sin ( π · β / 2 ) Γ ( ( 1 + β ) / 2 ) · β · 2 ( β 1 ) / 2 1 / β . During the random hiding phase, Lévy flight replaces the r4 random number (with parameter β typically set to 1.5 and α set to 0.1) to prevent the algorithm from falling into local optima:
v i ( t + 1 ) = x i ( t ) + R · ( α · levy ( β ) · b i , r ( t ) x i ( t ) )
(2)
Selective opposition (SO) learning enhances algorithm performance by modifying opposition-based learning states when rabbit colonies are distant from optimal solutions. This strategy influences rabbit colony deployment through linearly decreasing thresholds. When colonies are far from optimal positions, it calculates near and far rabbit positions and updates the corresponding difference distances. The SO core lies in determining search direction effectiveness through correlation analysis, triggering update strategies to help rabbits escape local optima when correlation is poor, calculated through the following formula:
d d i = | x i b e s t , j x i , j | R s r c = 1 6 · j = 1 d d i 2 d d i · ( d d i 2 1 )
where ddi represents the difference distance between each rabbit and the optimal rabbit position across various dimensions, and Rsrc measures the correlation between current and optimal positions.
By combining Lévy flight’s dynamic search mechanism with selective opposition learning’s intelligent guidance strategy, LARO maintains ARO’s simple and efficient characteristics while enhancing global search capability and convergence accuracy, providing robust technical support for this study’s model optimisation. For specific implementation details of the algorithm, readers may refer to the relevant original literature [28] for more comprehensive technical background and theoretical foundations.

2.3. Model Evaluation Metrics

In assessing the practical application value of predictive models, single indicators often fail to comprehensively reflect their strengths and weaknesses. Therefore, this study introduces four typical regression performance evaluation metrics [31,32]: mean absolute error (MAE), root mean square error (RMSE), coefficient of determination (R2), and overall index (OI). Each of these metrics possesses distinct characteristics and can measure model accuracy and stability in unconfined compressive strength prediction tasks from different dimensions.
Among them, MAE quantifies the average deviation degree of prediction results and demonstrates lower sensitivity to extreme outliers. RMSE places greater emphasis on the impact of larger errors on overall model performance, making it suitable for tasks requiring high precision. R2 serves as a standard for measuring the variance explanation capability of predicted values relative to actual observed values, with values closer to 1 indicating better fitting performance. OI introduces error normalisation and efficiency correction terms based on traditional error evaluation, providing an overall assessment of model generalisation capability and stability. The calculation expressions for these four metrics are presented as follows:
MAE = 1 n i = 1 n | y i y ^ i |
RMSE = 1 n i = 1 n ( y i y i ^ ) 2
R 2 = 1 i = 1 n ( y i y ^ i ) 2 i = 1 n ( y i y ¯ ) 2
OI = 1 2 [ 1 RMSE y max y min + EC ]
where yi represents the actual sand strength value, ȳ represents the average of actual strength values, ŷi represents the model-predicted sand strength value, EC denotes the efficiency coefficient, and n represents the corresponding sample size. Through the combined application of these metrics, a more comprehensive and objective evaluation of model performance in addressing MICP-modified soil strength prediction problems can be achieved, providing reliable foundations for model optimisation and selection. While R2 is commonly used to evaluate regression model performance, its interpretation can be less intuitive for nonlinear models. In this study, R2 is used solely as a performance indicator to quantify the proportion of output variance explained by the model relative to the mean baseline. It is interpreted in conjunction with RMSE, MAE, and OI to provide a more comprehensive and model-agnostic assessment of prediction accuracy.

3. Database Construction

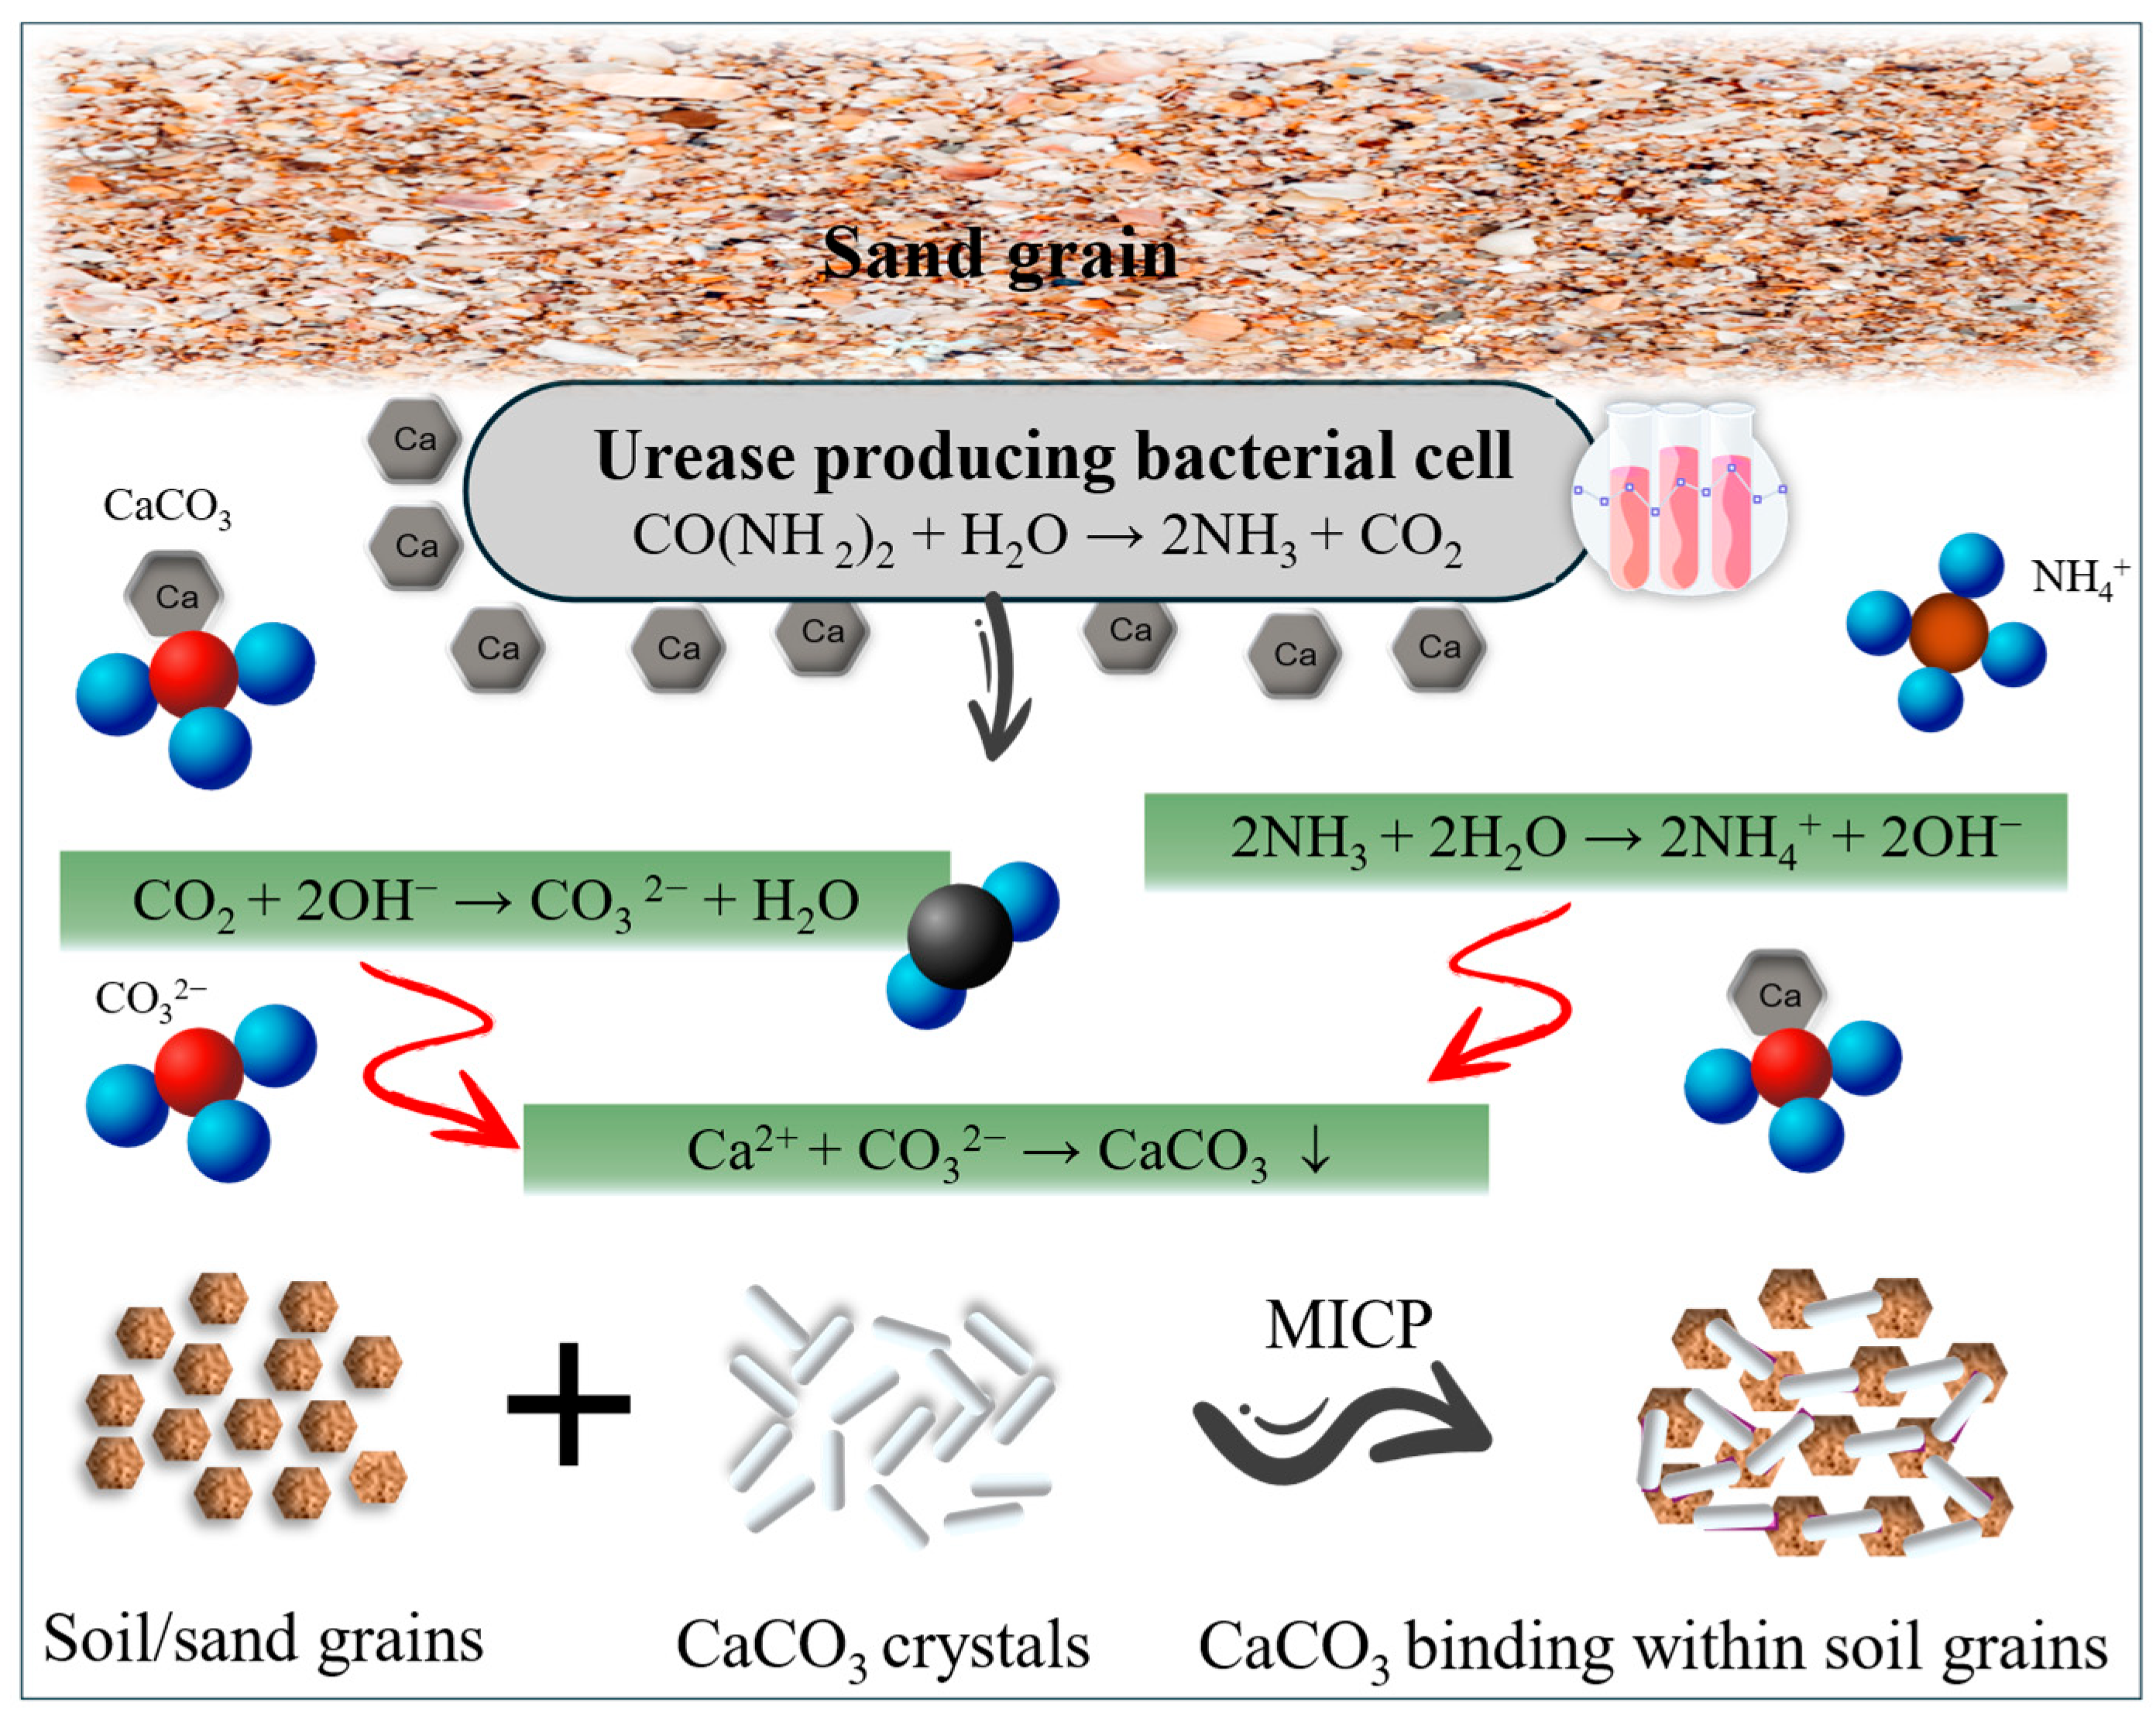
3.1. Microbially-Induced Calcite Precipitation

MICP represents a bio-geotechnical engineering technology that utilises the metabolic activities of specific microorganisms to induce calcium carbonate crystal formation within soil pores (as illustrated in Figure 1), thereby achieving bio-cementation improvement of loose soil masses [33]. The core mechanism of MICP solidification technology centres on the urea hydrolysis reaction catalysed by urease-producing bacteria, primarily Sporosarcina pasteurii. This biochemical process encompasses a series of consecutive chemical reactions [34]. Initially, urease secreted by bacteria decomposes urea into ammonia and carbon dioxide. Subsequently, ammonia ionises in water to produce hydroxide ions, elevating local pH values. Carbon dioxide then reacts with hydroxide ions to generate carbonate ions [35,36,37,38]. The complete reaction process can be represented as
C O ( N H 2 ) 2 + H 2 O u r e a s e 2 N H 3 + C O 2 2 N H 3 + 2 H 2 O 2 N H 4 + + 2 O H C O 2 + 2 O H C O 3 2 + H 2 O
Ultimately, under suitable chemical conditions, carbonate ions combine with calcium ions in the environment to form calcium carbonate precipitation:
C a 2 + + C O 3 2 C a C O 3
The entire treatment process must be conducted under appropriate temperature and pH conditions to maintain microbial activity and reaction efficiency. According to the relevant literature [2], MICP treatment effectiveness is comprehensively influenced by multiple factors, including soil particle characteristics, microbial activity, nutrient solution composition, and environmental conditions. Specifically, the particle gradation characteristics of sand directly affect bacterial distribution and the spatial distribution of calcium carbonate precipitation. Soil porosity determines the space available for bacterial activity and precipitate filling, exerting a significant influence on final cementation effectiveness. Among microbial-related parameters, bacterial optical density reflects bacterial concentration and activity state, while urease activity directly determines urea hydrolysis efficiency and calcium carbonate generation rate. Regarding nutrient solution composition, calcium chloride concentration provides the calcium ion source, while urea concentration serves as the enzymatic reaction substrate. The ratio between these components affects the extent of precipitation reaction progression. Additionally, calcite content in treated sand serves as a direct indicator for evaluating MICP treatment effectiveness and correlates closely with soil strength enhancement [6].
The MICP database compiled for this research integrates experimental data from relevant research fields both domestically and internationally [6,21], encompassing UCS test results under different soil conditions, treatment parameters, and environmental factors, with a total of 402 valid data sets (Table S1). In the referenced studies used to construct the database, Sporosarcina pasteurii was consistently adopted as the microbial agent. Calcium chloride was used as the calcium source, with urea and CaCl2 concentrations commonly ranging between 0.25 M and 0.5 M. All treated sand specimens were cured under ambient room temperature (approximately 20–30 °C) and maintained at neutral pH conditions (around 7.0). The variation in sample contributions among different studies within the database reflects the diversity in experimental scales and research emphases of different research teams. Based on the availability and completeness of influencing parameters in the existing literature, this study focuses on eight critical input parameters: calcite content (FCaCO3), median particle size (D50), initial void ratio (e0), bacterial suspension optical density (OD600), urea concentration (Mu), calcium chloride concentration (MCa), urease activity (UA), and uniformity coefficient (Cu). The selection of these parameters comprehensively considers their important roles in MICP mechanisms as well as their reporting frequency and data quality in the published literature.

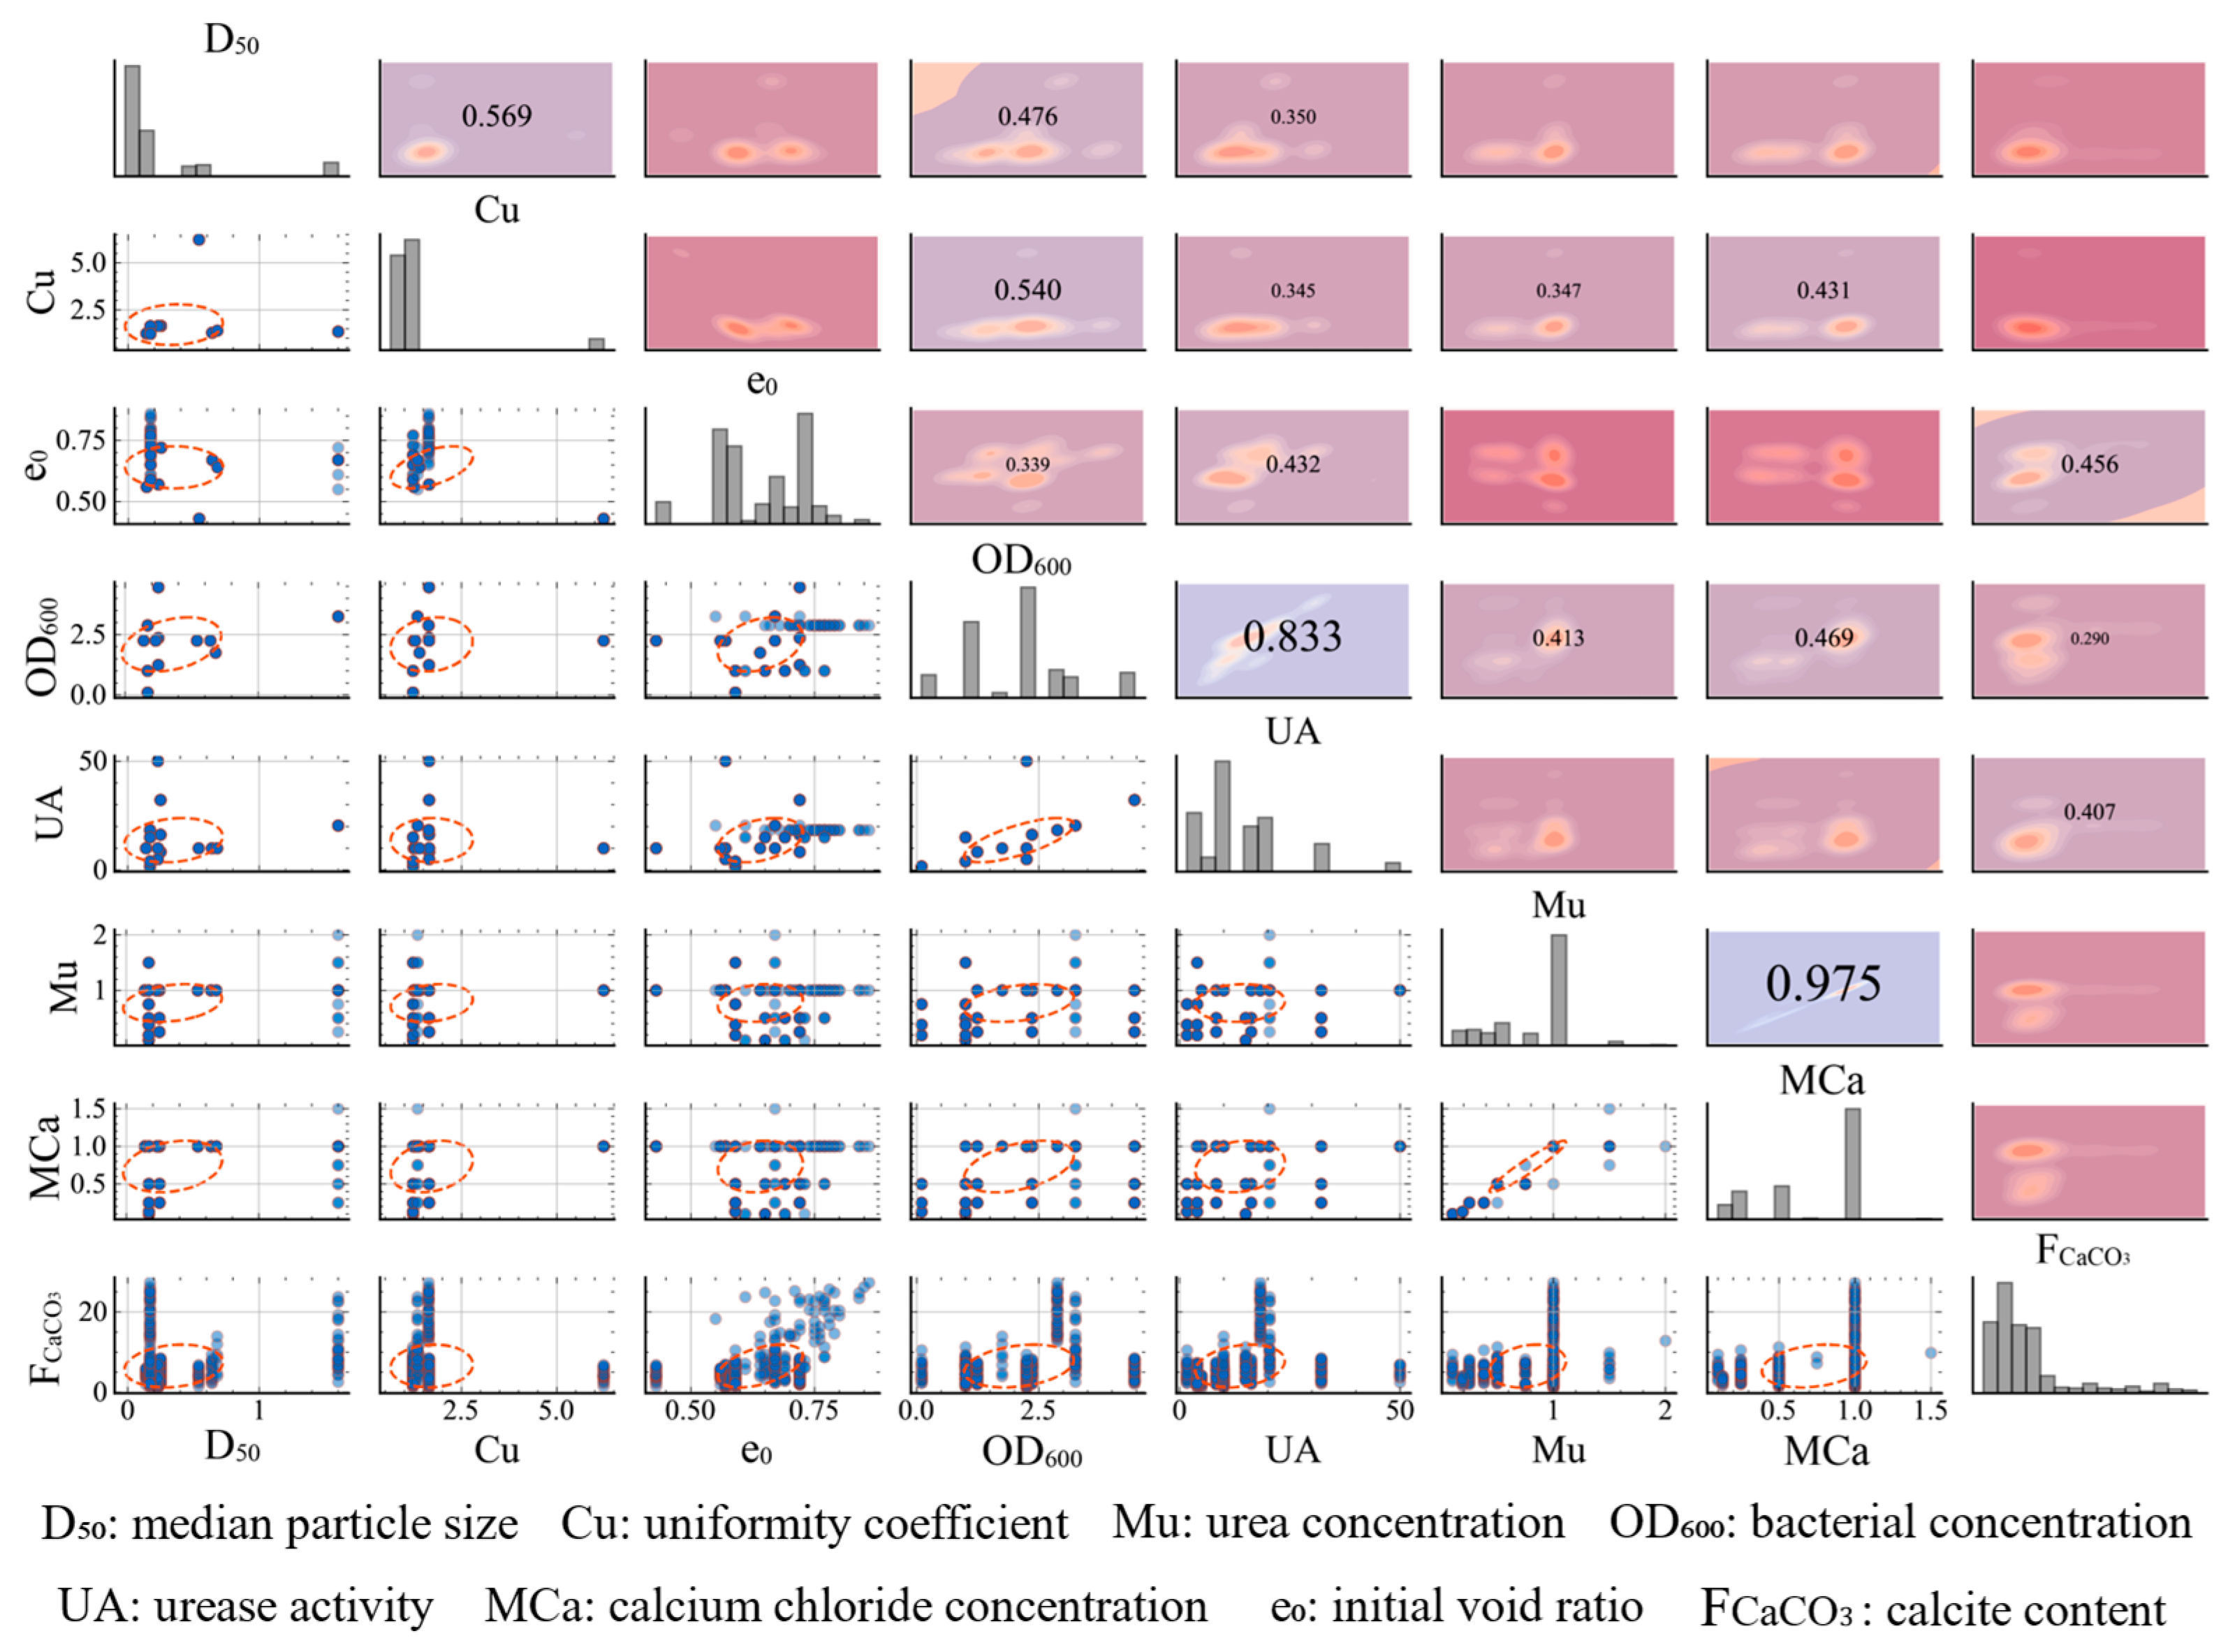
3.2. Data Statistical Analysis

To understand the distribution characteristics and intrinsic correlations among parameters within the database, this study conducted a detailed statistical analysis of relevant parameters. As illustrated in Figure 2, each parameter exhibits distinct distribution patterns and variability characteristics in the density distribution plots. The median particle size demonstrates a highly concentrated unimodal distribution, with data primarily clustered around 0.15 mm and a relatively narrow distribution width, indicating that the database samples predominantly consist of fine sand. The uniformity coefficient also presents a relatively compact unimodal distribution, with a peak value of approximately 1.8. The initial void ratio distribution is comparatively broad, mainly concentrated between 0.5 and 0.8, with multimodal characteristics, reflecting sample diversity in compaction states and density conditions.
Among microbial-related parameters, bacterial optical density varies within the 0.5–3.5 range, forming distinct bimodal structures around 1.5 and 2.5, while urease activity distribution exhibits the greatest complexity, with the primary peak located in the 10–15 U/mL interval and overall multimodal characteristics, revealing significant differences among various bacterial strains and cultivation conditions. Regarding nutrient solution parameters, both urea concentration and calcium chloride concentration demonstrate concentrated and regular unimodal distributions. Calcite content is primarily concentrated in the 4–10% range, but the distribution tail extends beyond 25%, presenting pronounced long-tail characteristics. Unconfined compressive strength is concentrated in the 1–4 MPa range with tail extension to 15 MPa, indicating that most samples exhibit relatively low strength values, with extremely high strength values being relatively rare.
The correlation analysis presented in Figure 3 illustrates the quantitative relationships among the input parameters used in the MICP dataset. The lower-left off-diagonal panels display scatter plots between variable pairs, the upper-right panels present the corresponding correlation heatmaps, and the diagonal panels show individual parameter distributions as histograms. Overall, most input parameters exhibit relatively weak pairwise correlations, with a few notable exceptions. For example, urease activity (UA) shows a strong positive correlation with bacterial concentration (OD600) (r = 0.833), while the correlation between urea concentration (Mu) and calcium chloride concentration (MCa) is extremely high (r = 0.975), reflecting their typical use in fixed molar ratios during MICP treatments. This coupling is expected, as urea and calcium chloride, respectively, serve as the primary sources of carbonate and calcium ions in the precipitation process. In contrast, variables such as median particle size (D50) exhibit weak or inconsistent correlations with other parameters, suggesting that their influence on the MICP process is more complex and may not follow simple linear patterns. Moderate positive associations are also observed between initial void ratio (e0) and microbial-related parameters (OD600 and UA), indicating potential interactions related to pore space availability and microbial activity.

4. Development of the Strength Model

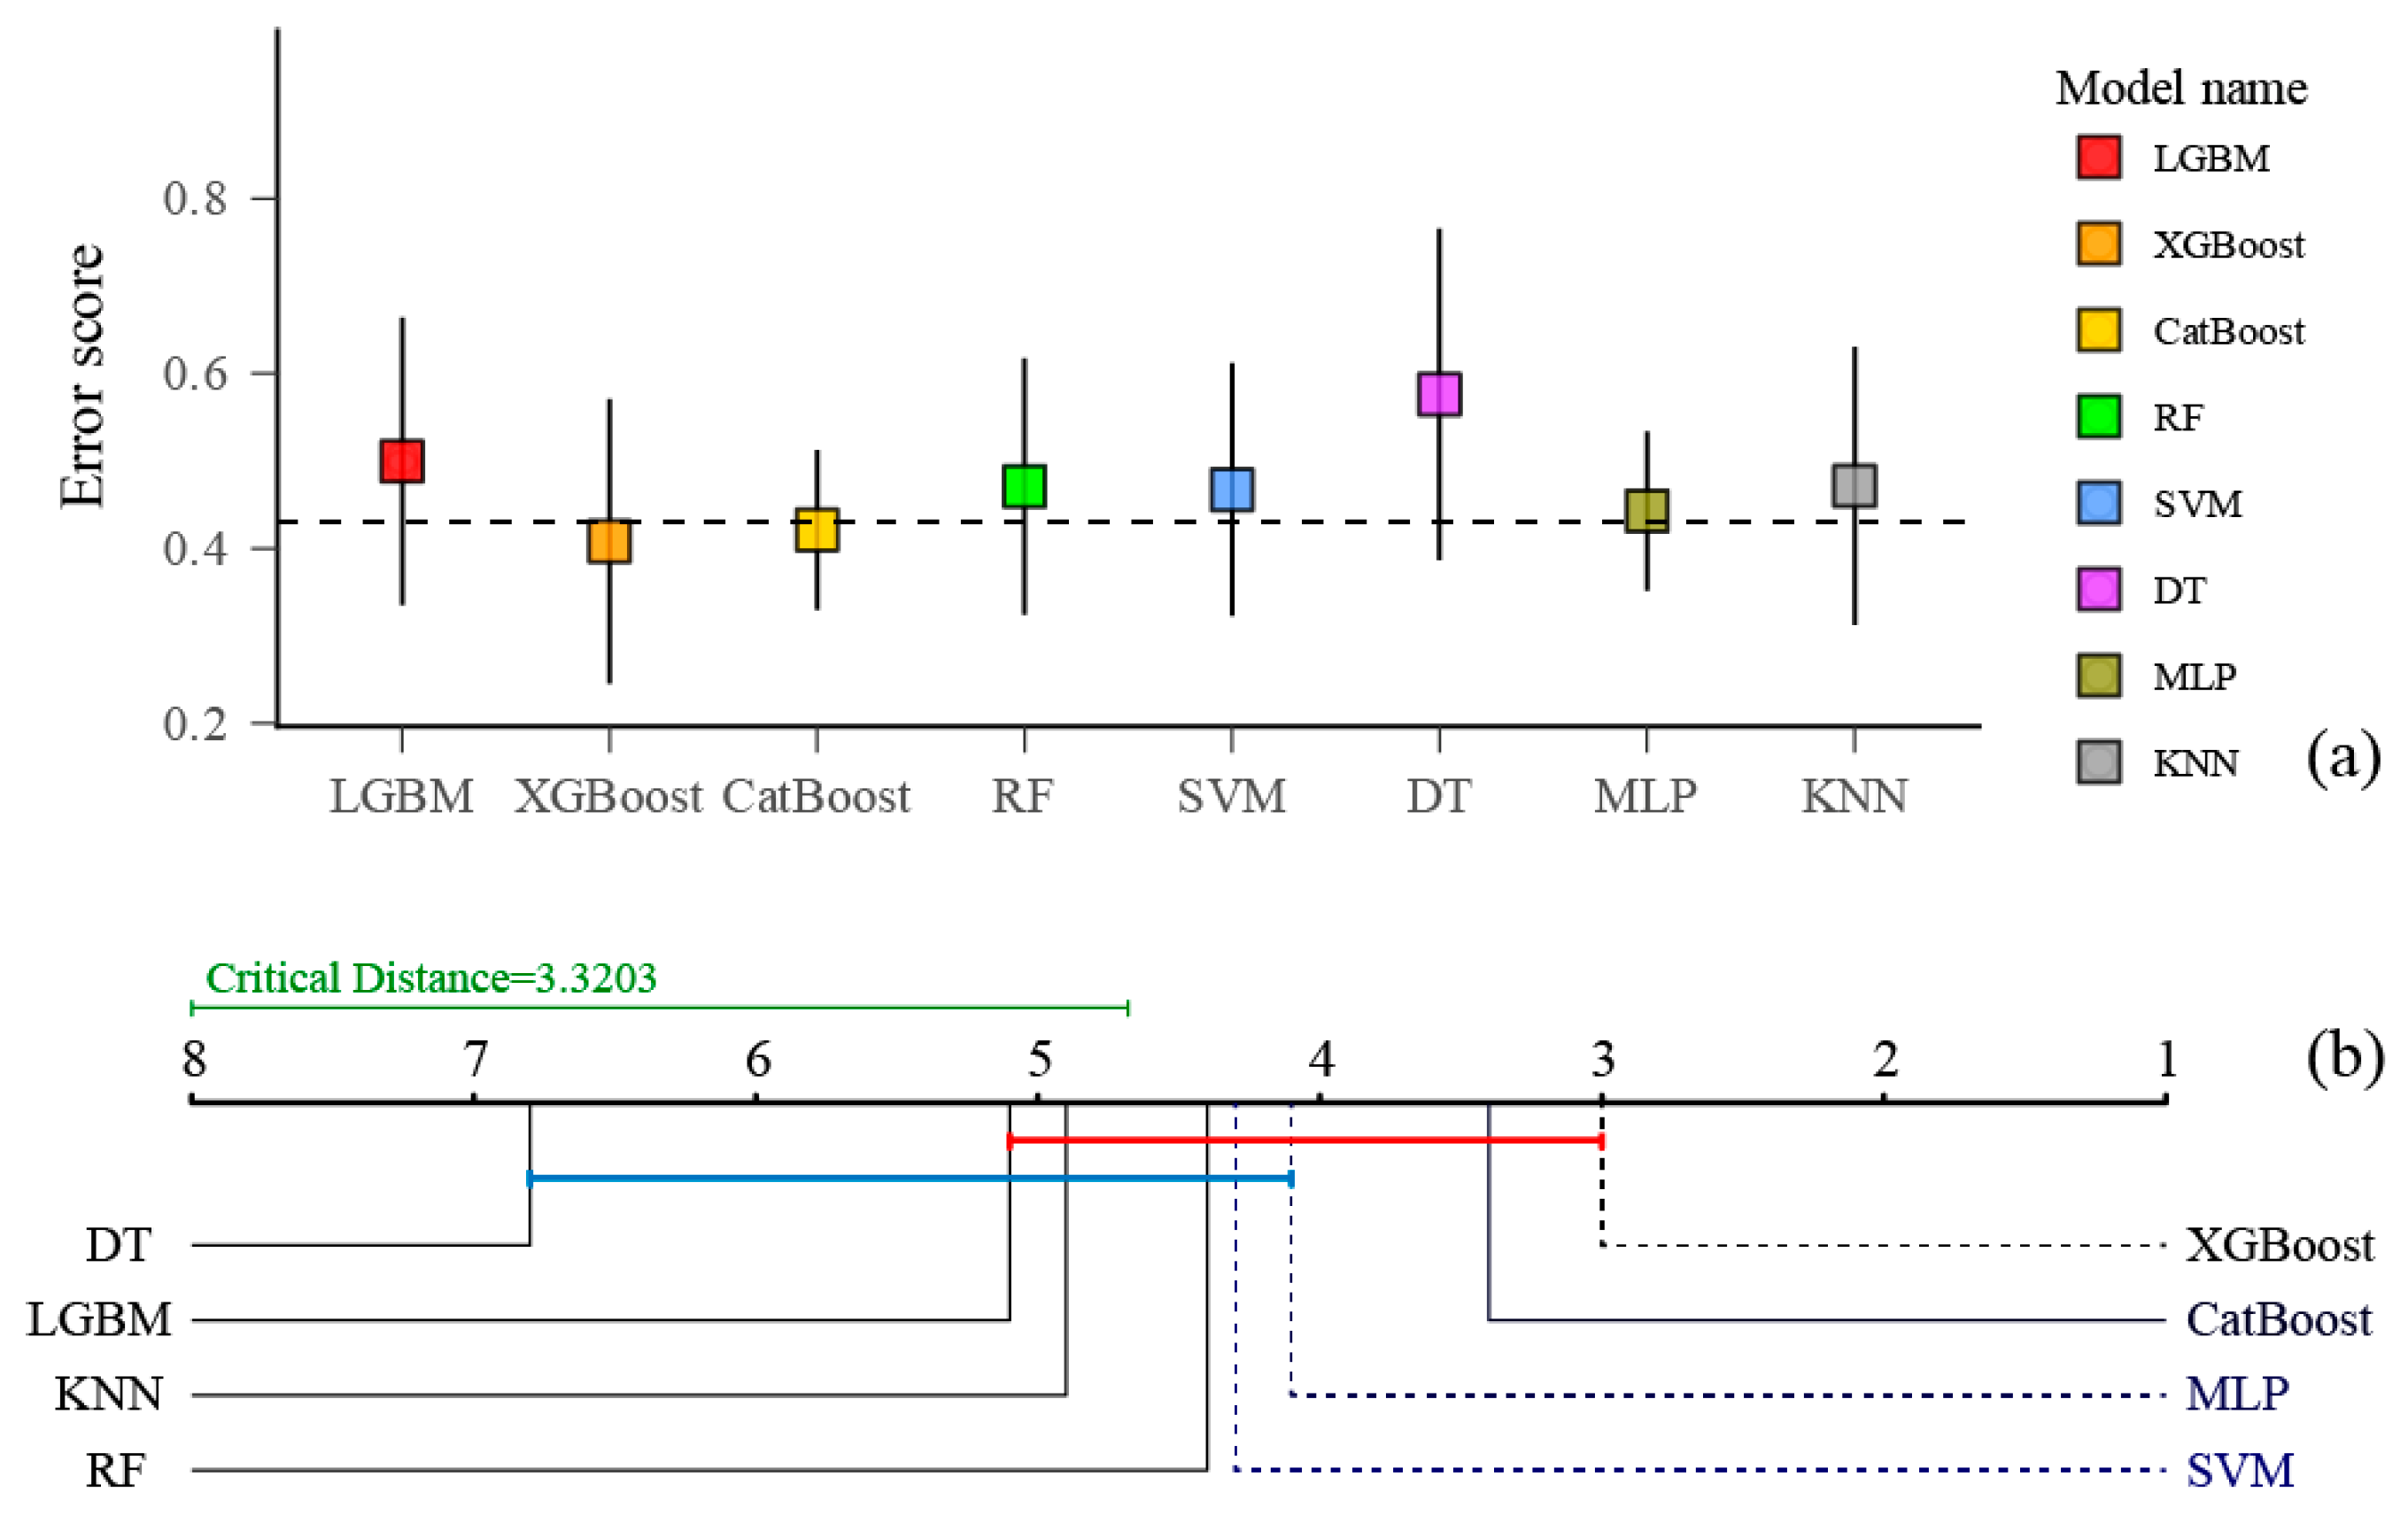
4.1. Selection of the Base Model

The selection of base learners directly influences final performance in establishing an ensemble learning framework for predicting compressive strength of MICP-improved sand [22,27]. Therefore, this study employs diverse machine learning methods for comparative analysis to identify optimal model combinations.
Through a comprehensive consideration of theoretical foundations, learning mechanisms, and applicable scenarios of different approaches, this study selected eight representative machine learning methods, including SVM, XGBoost, categorical boosting (CatBoost), random forest (RF), light gradient boosting machine (LGBM), decision tree (DT), MLP, and k-nearest neighbours (KNN). These models encompass different ML paradigms, including tree-based methods, kernel function methods, and neural network approaches, establishing a solid foundation for subsequent ensemble development. To evaluate model performance, this study adopts multiple cross-validation approaches to systematically assess each model’s performance across different datasets. Specifically, to ensure evaluation result stability and reliability, multiple repeated experiments were conducted to perform statistical analysis of error performance for each model across multiple data subsets, with confidence intervals of error distributions serving as the primary basis for performance evaluation.
Based on the performance comparison results shown in Figure 4a, various models demonstrate significant differences in accuracy. From an overall effectiveness perspective, XGBoost exhibits the most outstanding performance among multiple tree models, thereby being selected as the representative tree-based method. Additionally, SVM effectively handles nonlinear problems in high-dimensional spaces and demonstrates strong resistance to interference. Its error range remains relatively concentrated, with overall performance superior to most comparative models. MLP similarly demonstrates favourable error distribution performance. Although its error levels are slightly higher than XGBoost, fluctuations remain minimal with strong consistency, making it particularly suitable as a meta-learner to capture interactive features among different base model outputs. In comparison, KNN and DT exhibit significantly larger error fluctuations with relatively poor prediction consistency, therefore excluding them from the final selection.
Given the objective existence of performance differences among models, this section further employs non-parametric statistical methods to quantitatively evaluate significant differences between models. Specifically, the study utilises Friedman testing to assess whether significant differences exist among multiple models, followed by Nemenyi testing for pairwise comparison analysis. Nemenyi testing determines whether performance differences between any two models reach statistical significance levels by calculating critical difference values [39,40]. The calculation formula for critical difference values is
C D = q α × λ ( λ + 1 ) 6 N t
where qα represents the critical value based on the significance level, λ denotes the number of learners participating in comparison, and Nt represents the number of datasets.
Figure 4b shows that XGBoost achieves the best average ranking, while the ranking differences among XGBoost, SVM, and MLP remain below the critical difference threshold, forming a homogeneous performance group. In contrast, models such as DT, LGBM, and KNN exhibit significantly lower average rankings, particularly DT, positioned at the bottom, with ranking differences from XGBoost far exceeding critical difference values, indicating highly significant statistical differences in performance. This stratification phenomenon reflects adaptability differences among models when handling complex features in MICP data, providing an objective quantitative basis for base model screening. Based on the comprehensive evaluation above, the final determination incorporates XGBoost, SVM, and MLP into this study’s sand-strength ensemble-learning framework.

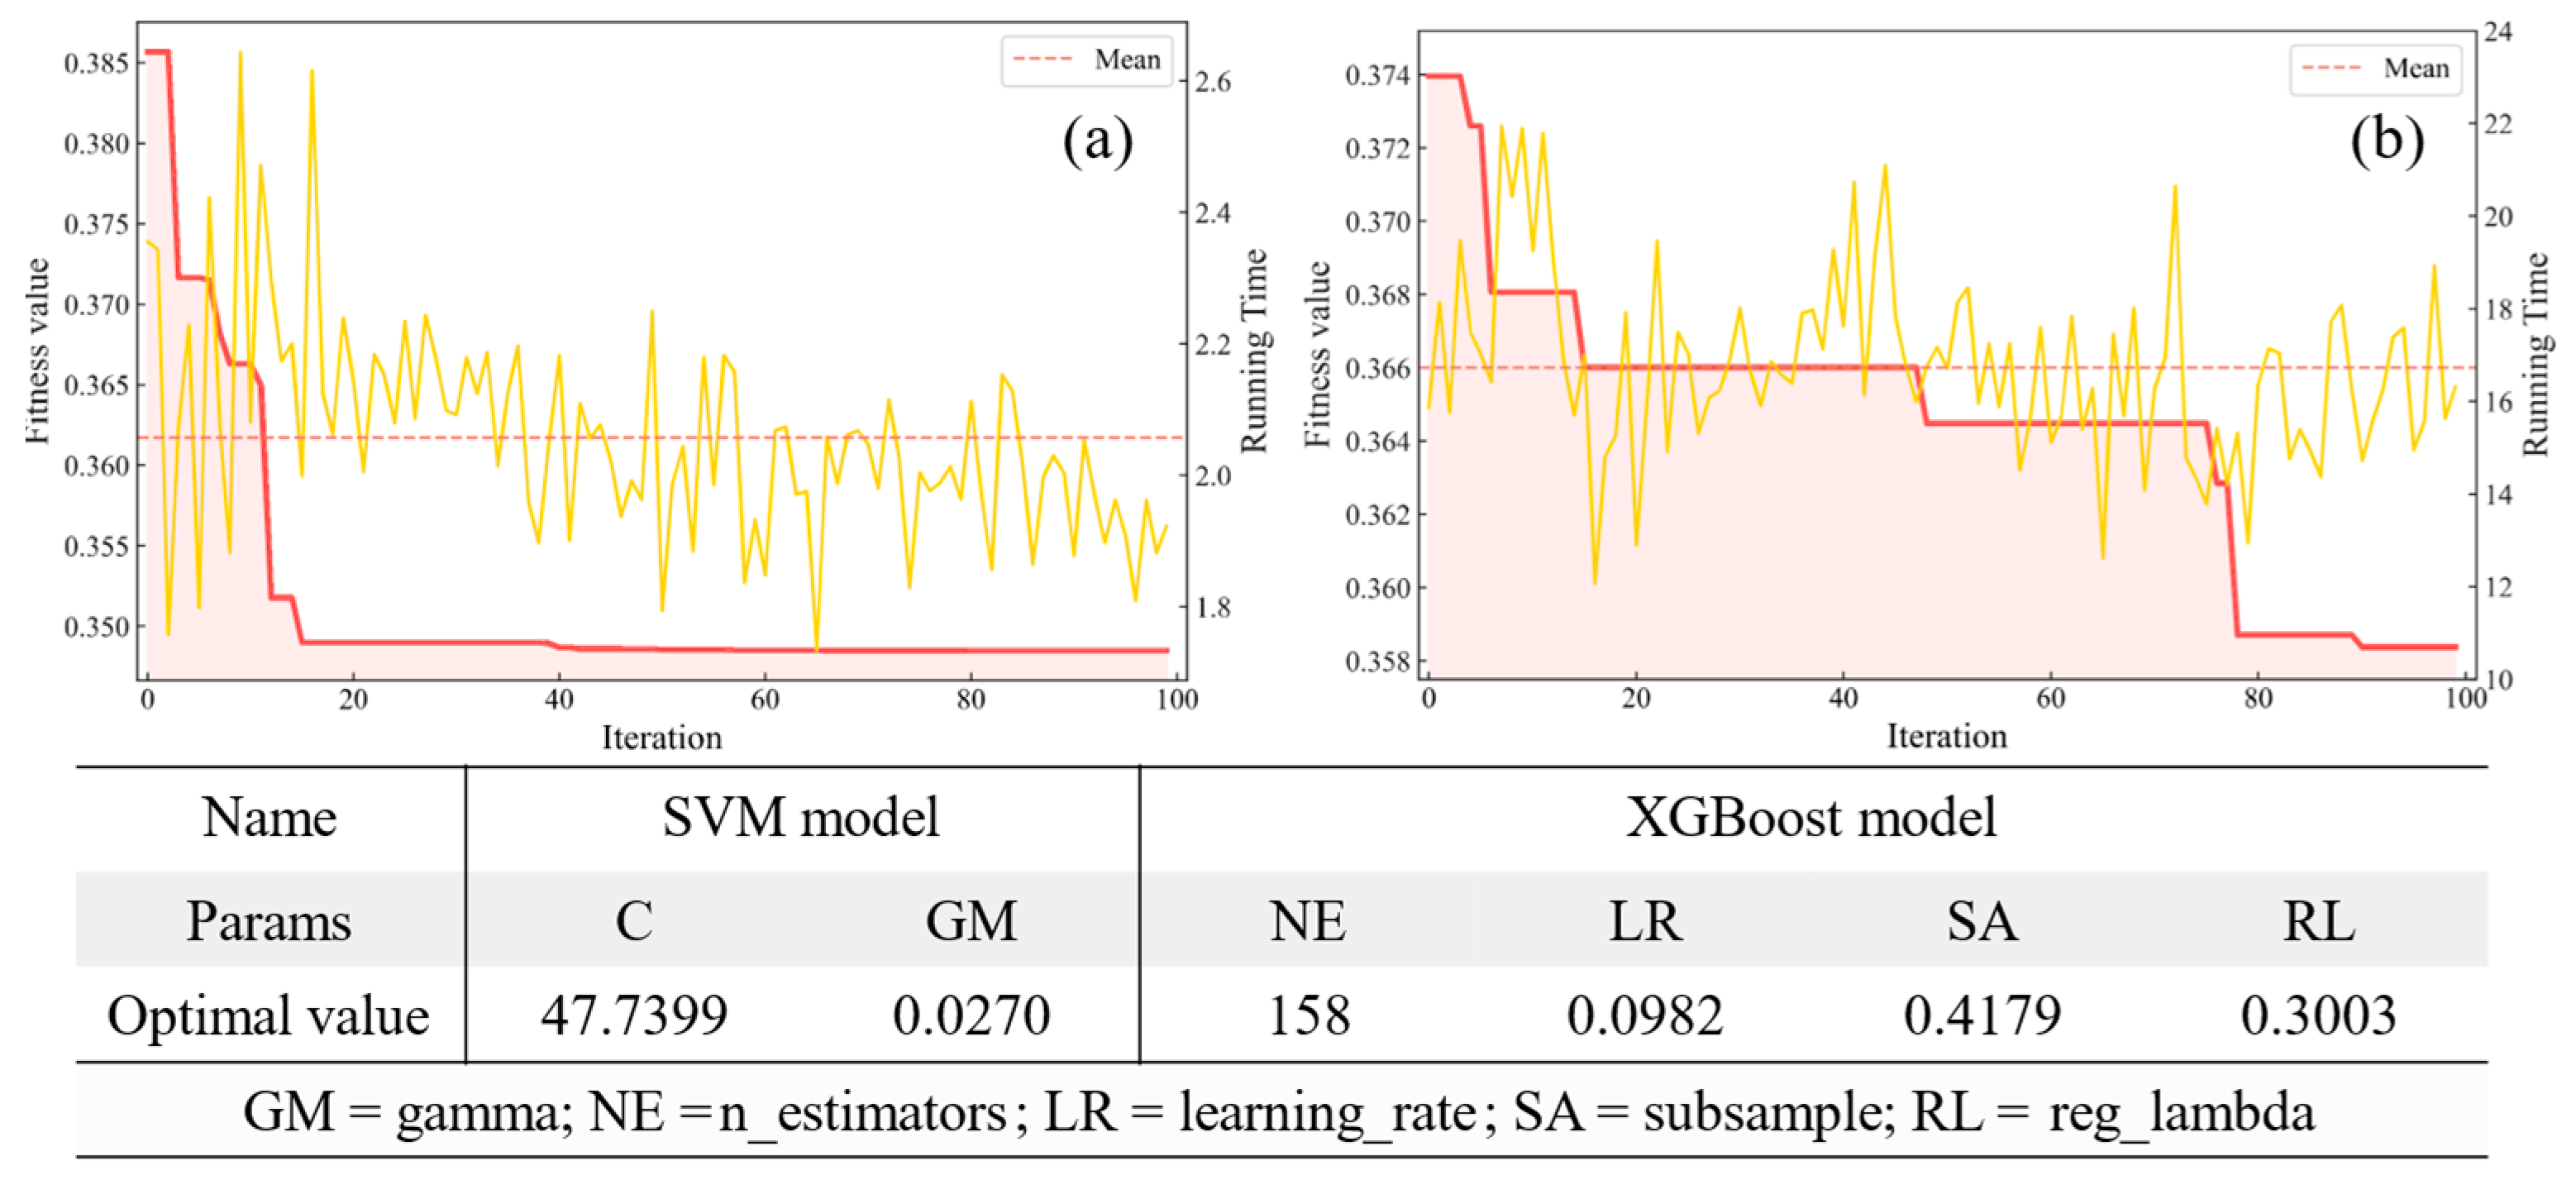
4.2. Base Model Optimisation and Ensemble

Following the determination of base learner combinations, model optimisation becomes a critical step for enhancing ensemble performance. To improve search efficiency and avoid local optima entrapment, this study employs the aforementioned LARO method for optimisation.
During the experimental process, the primary optimisation parameters for SVM include the penalty parameter (C) and the kernel parameter (GM) of the radial basis function. The penalty parameter controls the model’s tolerance for training errors, while the kernel parameter determines the influence range of the radial basis function. As illustrated in Figure 5a, during the initial optimisation phase of the SVM model (first 10 iterations), the fitness value rapidly decreases from an initial level of 0.385 to approximately 0.365, demonstrating LARO’s efficient optimisation capability. In subsequent iterations, the fitness curve exhibits pronounced fluctuation characteristics, reflecting the effects of the Lévy flight mechanism in the LARO method, which introduces random perturbations to prevent premature algorithm convergence to local optimal solutions. Within the 15–40 iteration interval, the curve fluctuation amplitude gradually diminishes, indicating the algorithm’s entry into the fine search phase. After approximately 50 iterations, performance indicators stabilise, with the final determined parameter combination being: C = 47.7399 and GM = 0.0270.
XGBoost model optimisation involves more parameter dimensions, primarily including the number of estimators (NE), learning rate (LR), subsample ratio (SA), and regularisation parameter (RL). Figure 5b presents the performance optimisation curve for XGBoost. Compared to SVM, the XGBoost fitness curve exhibits more intense fluctuations in the initial phase, with fitness values oscillating dramatically within the 0.358–0.374 range, reflecting the complex characteristics of its parameter space. During the first 15 iterations, the algorithm experiences multiple alternating processes of local search and global jumps. Throughout the 15–70 iteration period, the fitness curve maintains relatively stable fluctuation states within the 0.364–0.369 interval. During the 70–80 iteration period, fitness values exhibit a significant decline, rapidly decreasing from approximately 0.365 to below 0.360, subsequently stabilising. The final parameter configuration obtained is NE = 158, LR = 0.0982, SA = 0.4179, RL = 0.3003.
The optimised base models and the MLP meta-learner together constitute the ensemble architecture LARO-EnML, developed in this study for predicting the strength of MICP-treated sand. Overall, this modelling strategy integrates intelligent optimisation with model diversity, demonstrating favourable scalability and practical value while providing a methodological foundation for similar geotechnical engineering prediction problems.

5. Results and Discussion

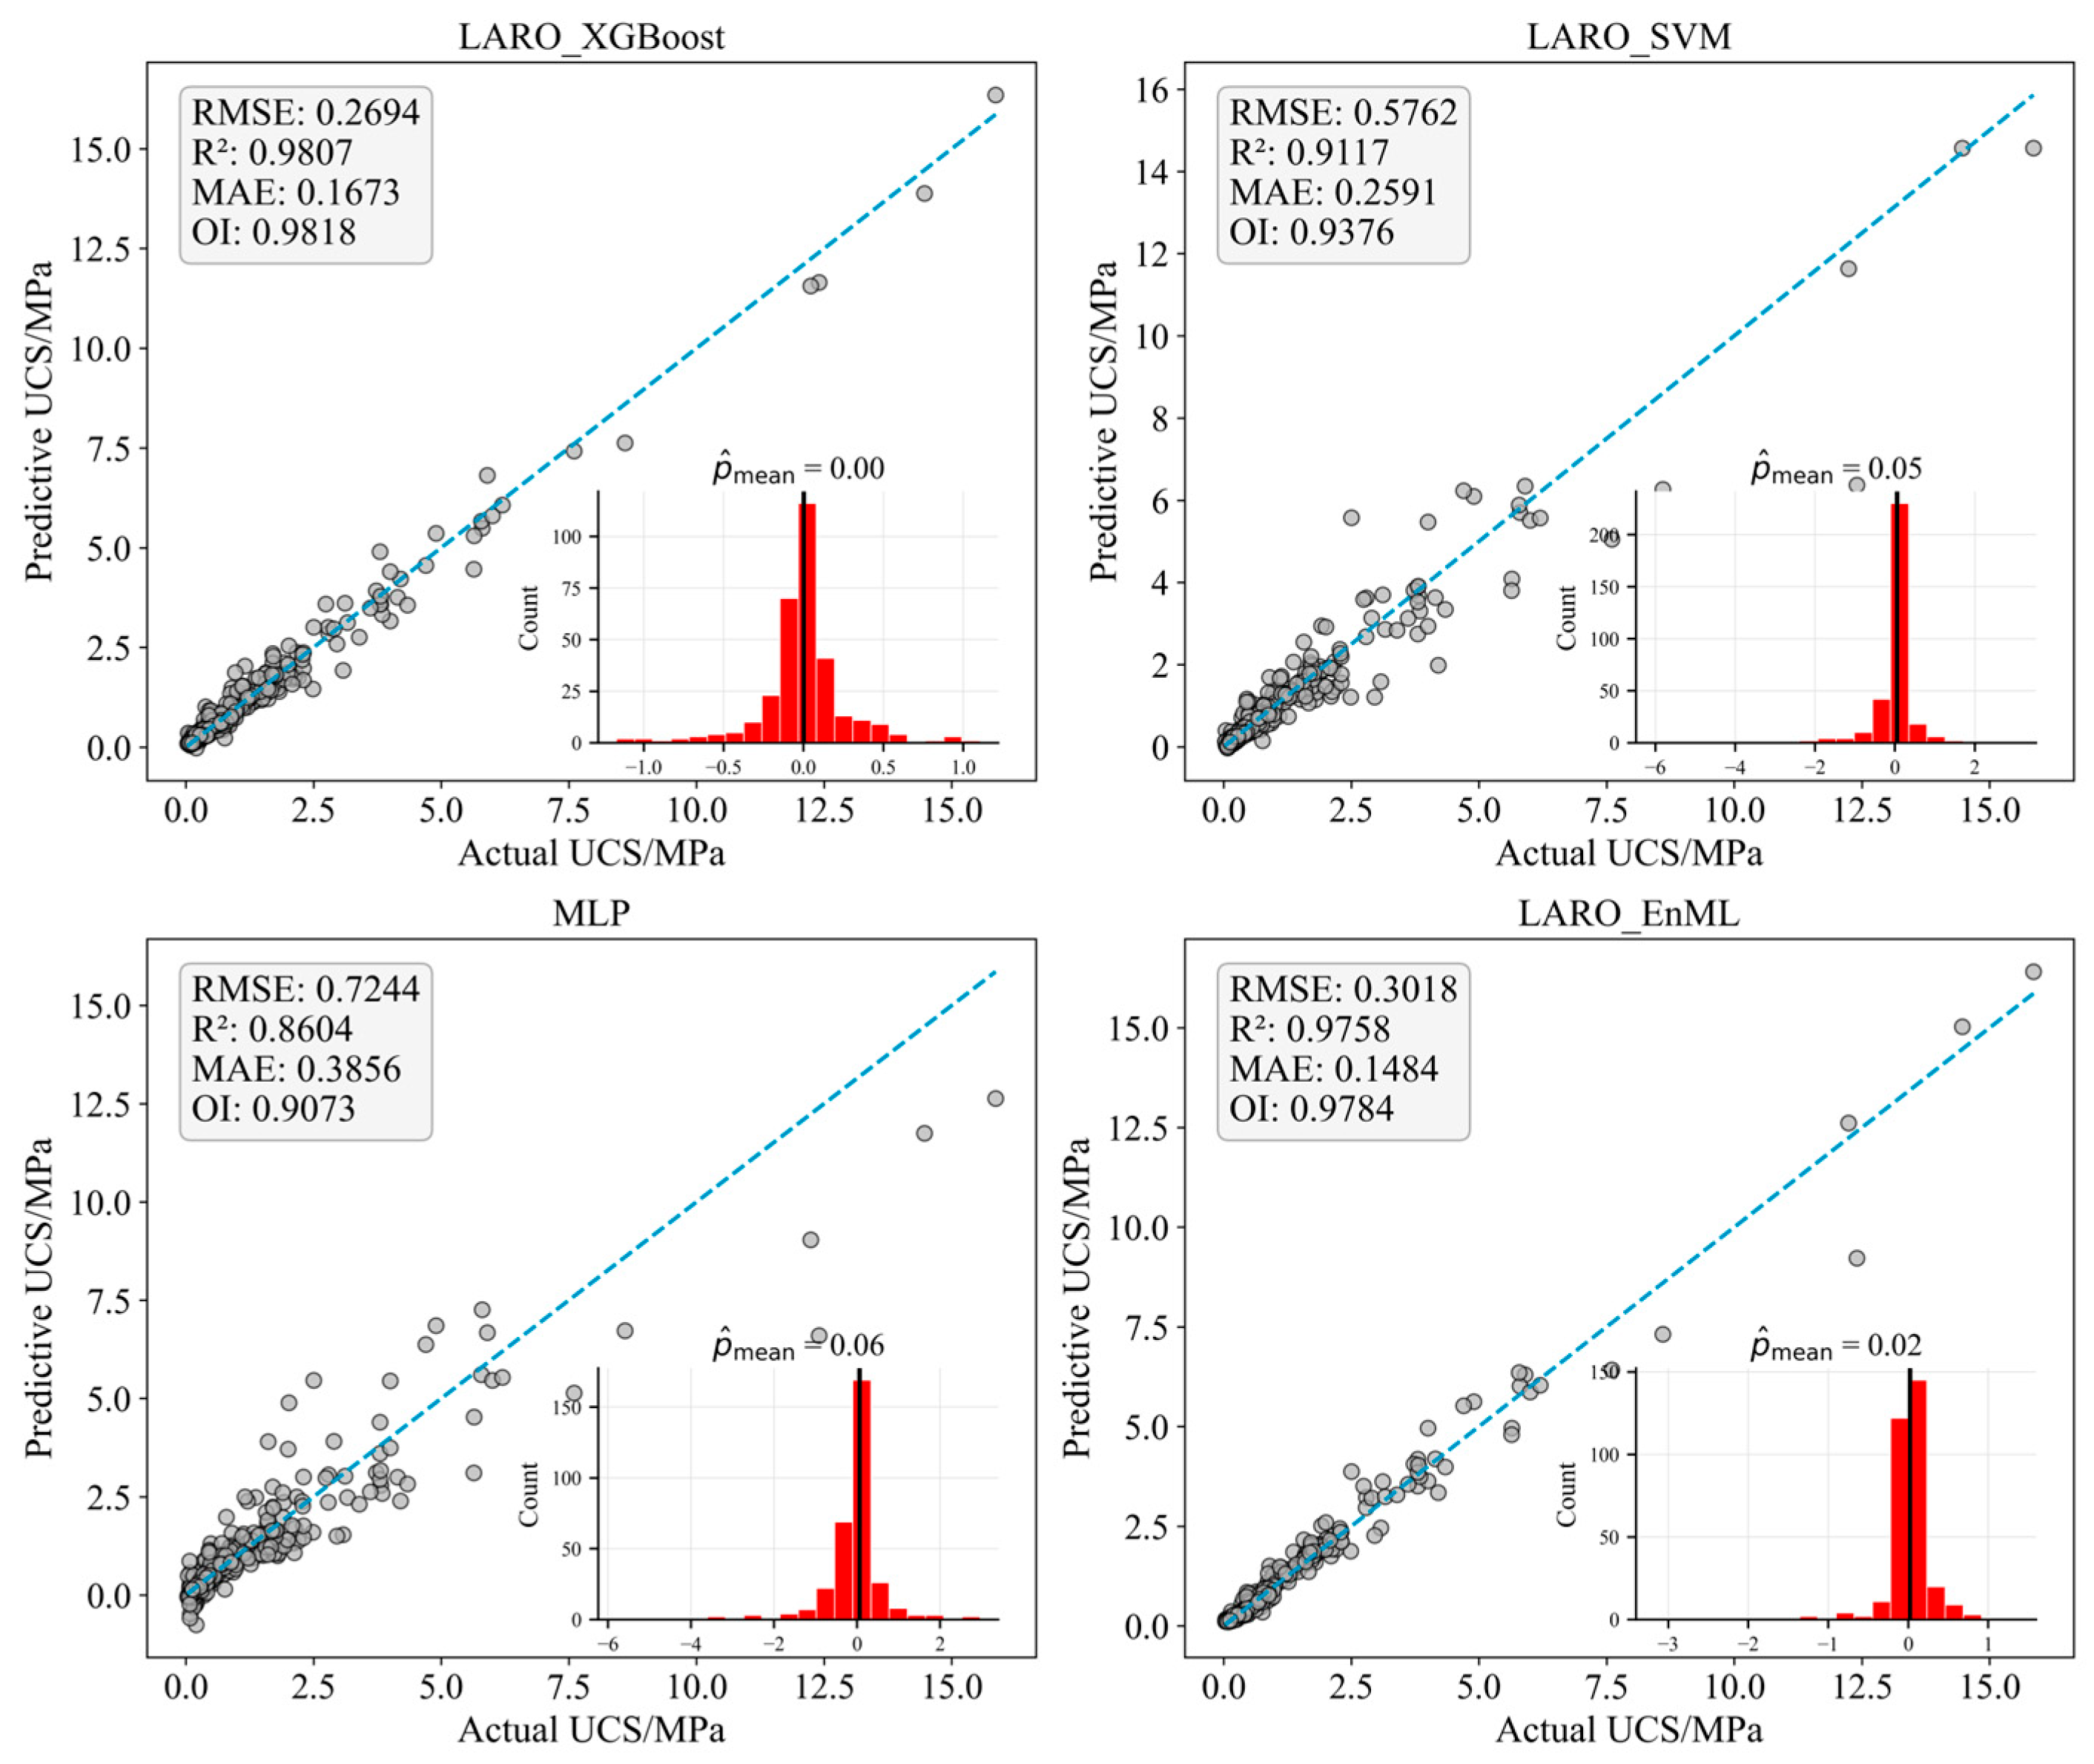
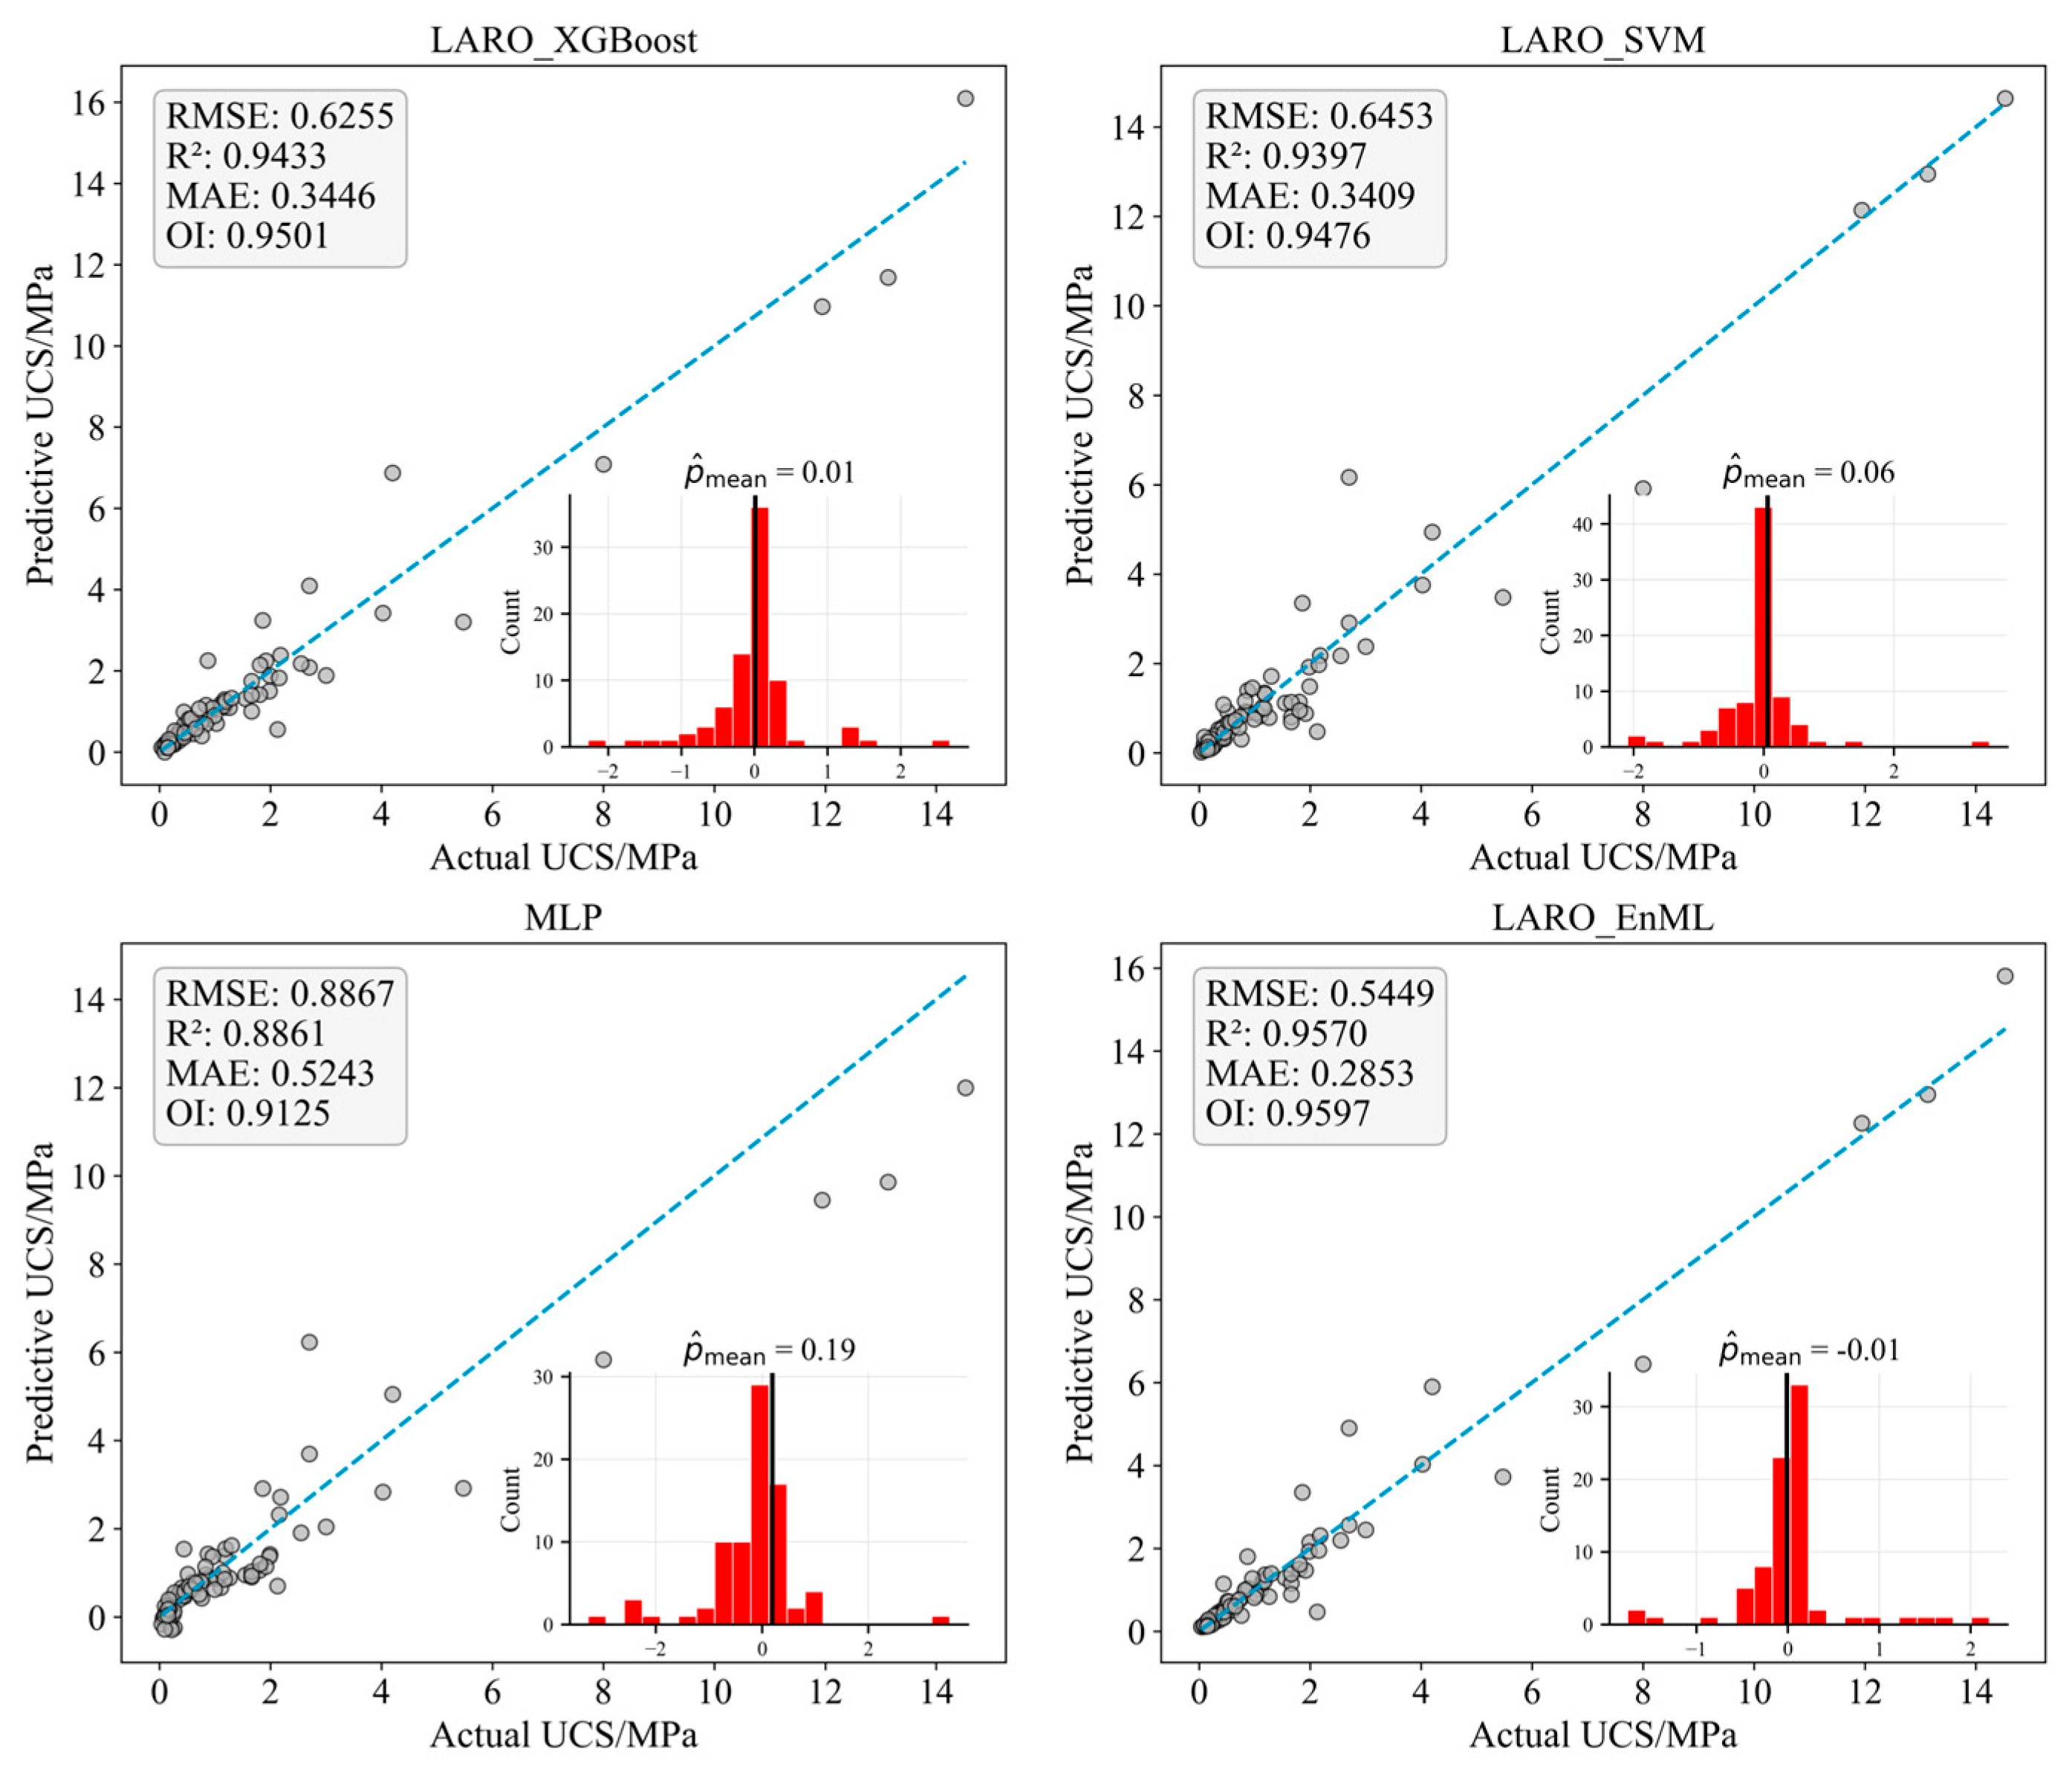
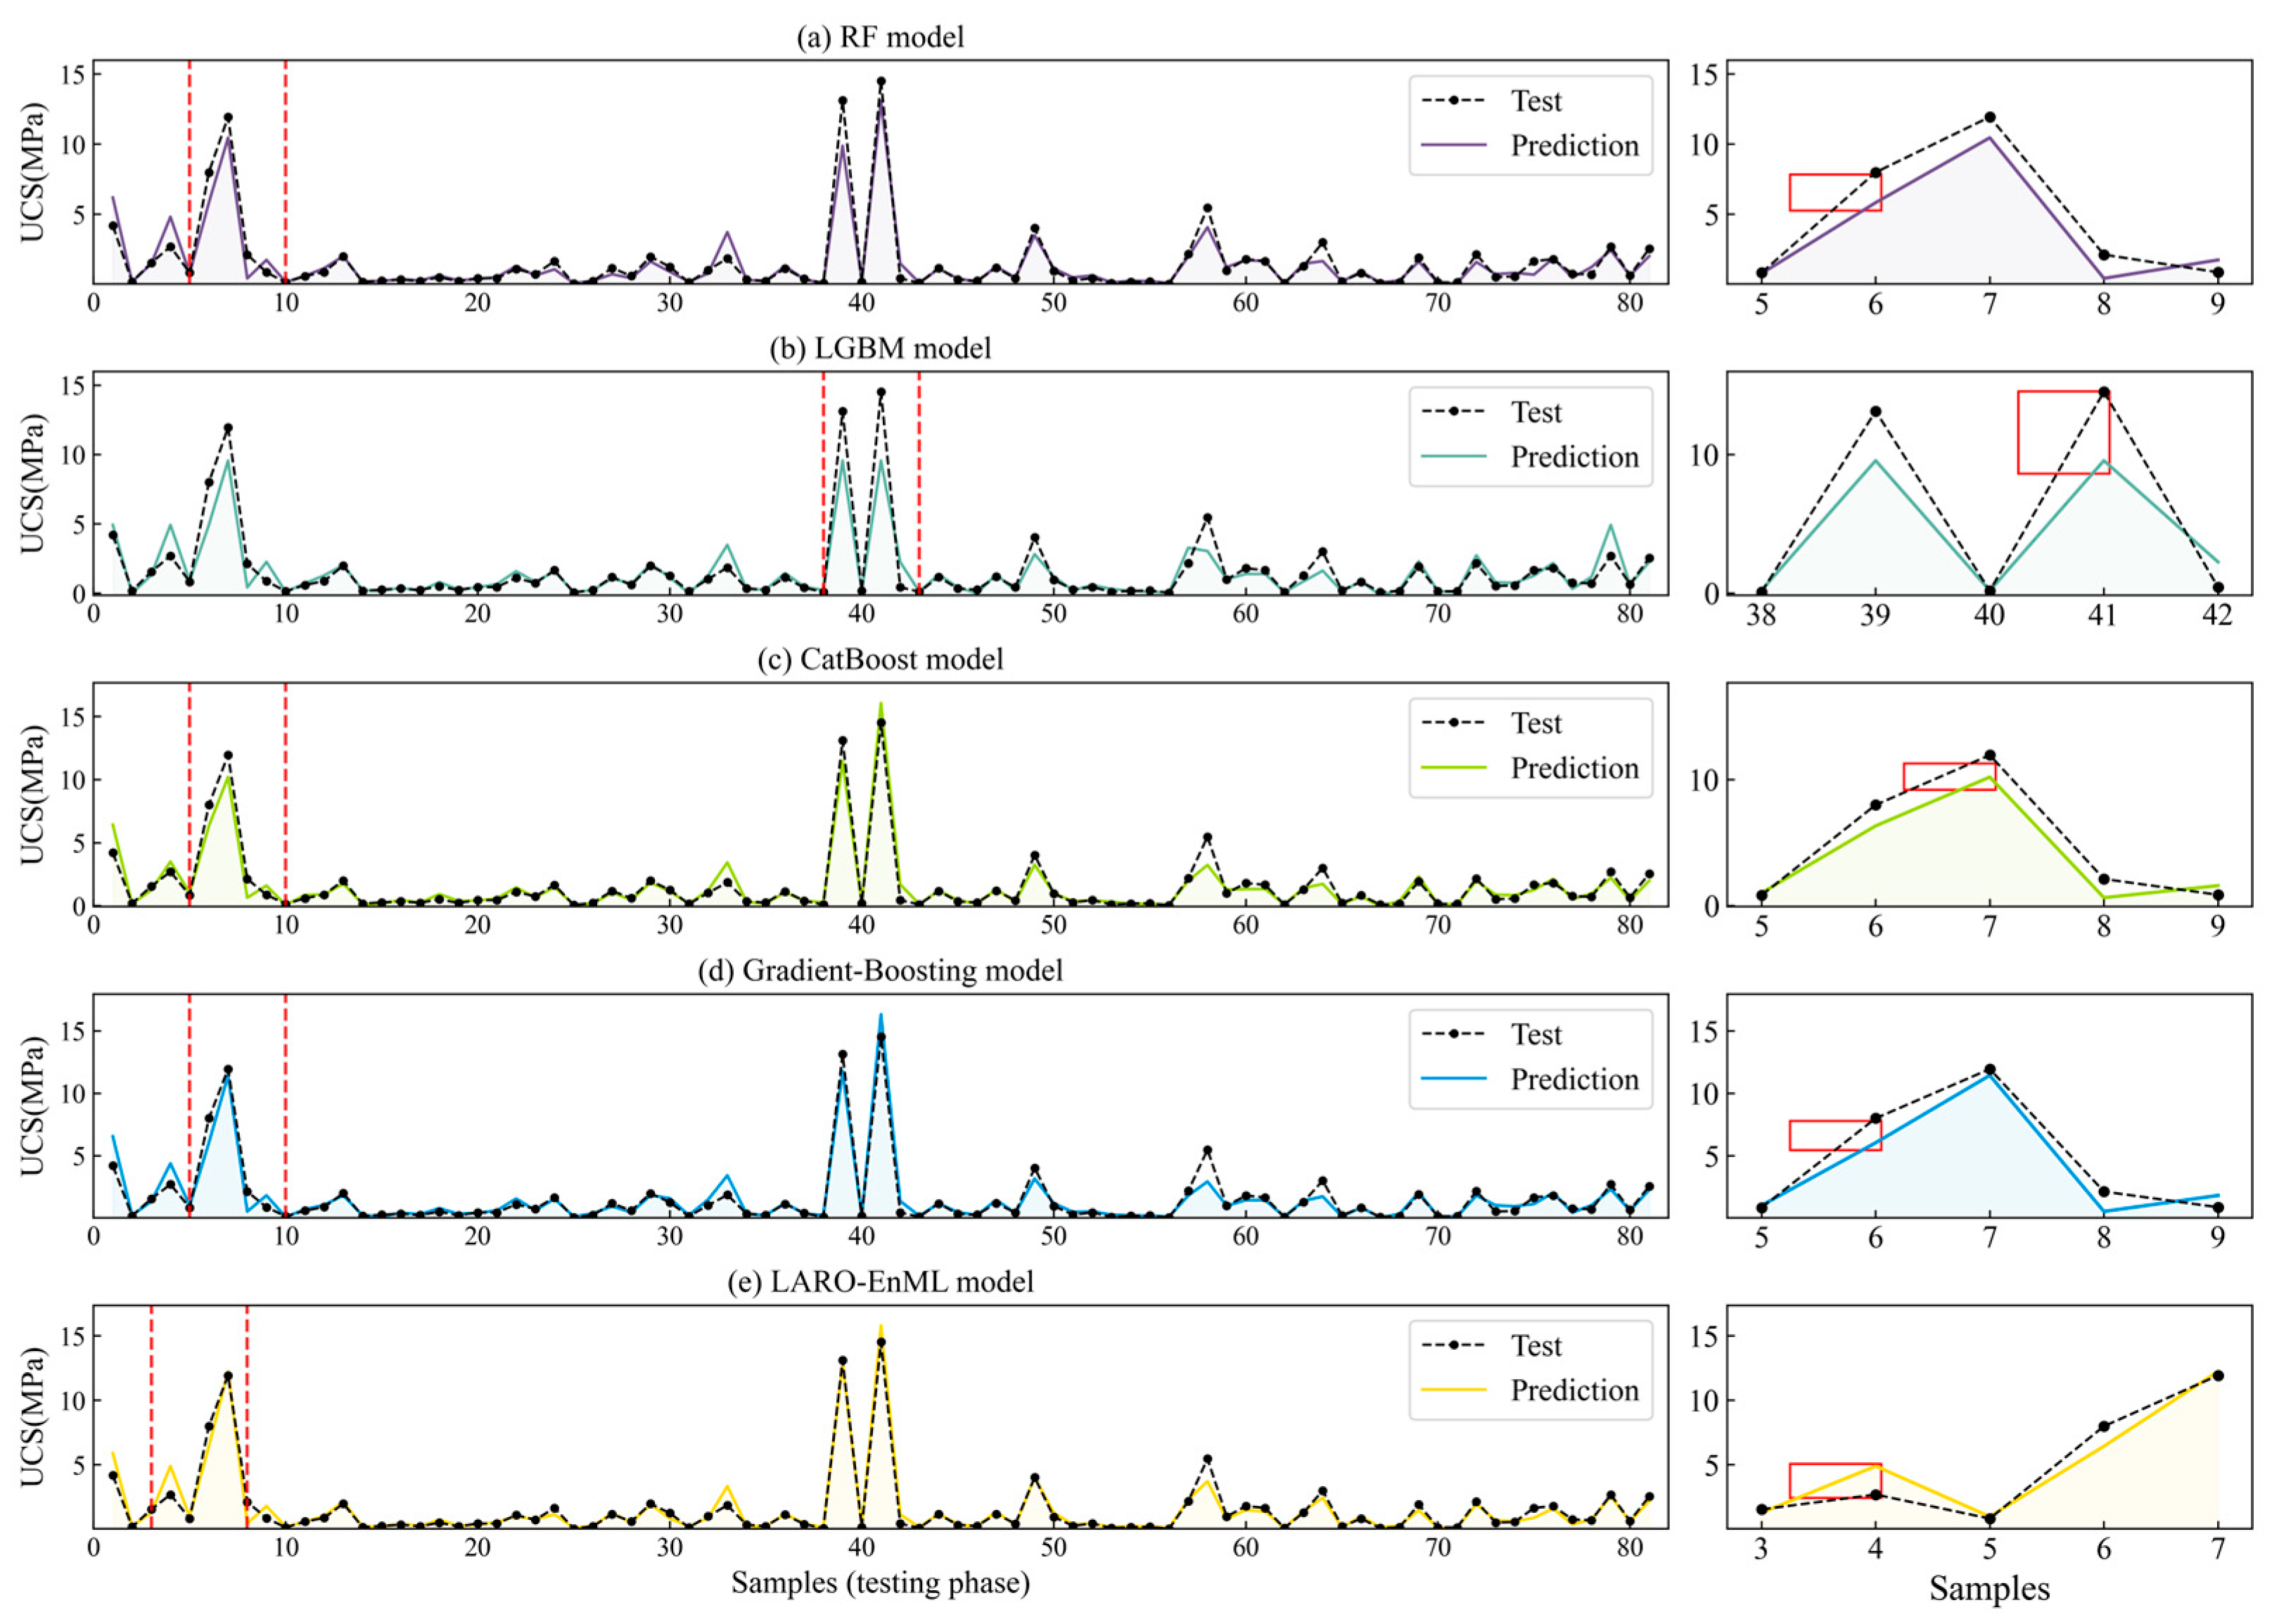
5.1. Performance Comparison

The variation in strength of bio-cemented sand directly relates to the design safety and engineering performance of overlying structures. The LARO-EnML proposed in this study effectively addresses nonlinearity and multi-factor coupling issues in MICP-treated sand strength assessment by integrating the advantages of multiple learning methods.
To comprehensively evaluate LARO-EnML performance, this section conducts a systematic comparative analysis with various base learners to thoroughly analyse the effectiveness of the ensemble strategy. Table 1 presents the performance evaluation indicator comparison results for each model on the training set. As shown in the table, the LARO-XGBoost demonstrates the most excellent performance on the training set, with RMSE of 0.2694, MAE of 0.1673, R2 reaching 0.9807, and OI value of 0.9818, with all indicators representing the best performance among all models. The LARO-EnML follows closely, with RMSE of 0.3018, MAE of 0.1484, R2 of 0.9758, and OI value of 0.9784, ranking second among all models. Among base learners, LARO-optimised models generally outperform their original versions. Compared to the standard XGBoost, LARO-XGBoost shows significant improvement, with RMSE decreasing from 0.3262 to 0.2694 and R2 increasing from 0.9717 to 0.9807, demonstrating the significant enhancement of the LARO method on model performance. Similarly, LARO-SVM exhibits obvious performance improvement compared to the standard SVM model, with RMSE substantially decreasing from 0.9323 to 0.5762 and R2 increasing from 0.7688 to 0.9117. It should be noted that MLP serves as the meta-learner in architecture, with its role being to learn combination relationships among base learner outputs, resulting in relatively weaker performance on the training set.
Beyond quantitative indicators, Figure 6 intuitively demonstrates the prediction performance differences of various models on the training set through visualisation. From the scatter plots, it can be observed that prediction points from LARO-XGBoost and LARO-EnML models are most closely distributed around the ideal prediction line (dashed line), indicating their high prediction accuracy. Residual distribution histograms show that LARO-XGBoost has an average bias of 0.00 and LARO-EnML has an average bias of 0.02, with both models’ residuals primarily concentrated around zero values, presenting favourable distribution characteristics. In contrast, other base learners exhibit relatively dispersed residual distributions, particularly MLP, with an average bias reaching 0.06.
From the perspective of evaluating the actual application value of models, performance on test data serves as the key criterion for measuring model generalisation capability and engineering applicability. As shown in Table 2, the LARO-EnML demonstrates optimal performance on the test set. This model achieves an RMSE of 0.5449, MAE of 0.2853, R2 of 0.9570, and OI value of 0.9597, with all indicators representing the best performance among all models, fully demonstrating the superiority of ensemble learning strategies in generalisation capability. Particularly noteworthy is the performance variation from training set to test set. Although LARO-XGBoost performs optimally on training data, its performance experiences a substantial decline on test data, with R2 decreasing from 0.9807 to 0.9433 and RMSE increasing from 0.2694 to 0.6255, indicating certain degrees of overfitting phenomena in this model. In contrast, the EnML-LARO model demonstrates better stability.
To intuitively demonstrate the performance of various models on the test set, Figure 7 provides a visual analysis of relevant prediction results. The figure clearly shows that LARO-EnML maintains excellent prediction accuracy on the test set, with prediction points closely distributed around the ideal diagonal line. Residual analysis reveals that LARO-EnML’s average bias approaches the ideal state of near-zero bias, with concentrated residual distribution. Comparatively, other models show varying degrees of performance decline on the test set, particularly the MLP model, with average bias increasing to 0.19, indicating certain generalisation limitations in single models. The comprehensive performance analysis fully demonstrates the core advantages of ensemble architecture in suppressing overfitting and enhancing generalisation capability, providing reliable technical support for predicting the strong performance of MICP-treated sand.
To further validate the effectiveness of the proposed LARO-EnML model, this study also conducted a comparative analysis with other mainstream methods. Table 3 presents the performance comparison results of LARO-EnML against typical ensemble models, including CatBoost, RF, LGBM, and gradient boosting on test data. The results demonstrate that the LARO-EnML model achieves an RMSE of 0.5449, significantly lower than other ensemble methods; an MAE of 0.2853, also representing the lowest value; R2 reaching 0.9570, notably higher than other models; and an OI value of 0.9597, the highest among all comparative models.
Additionally, Figure 8 presents prediction versus actual value comparison curves for each model, providing an intuitive visualisation. From the overall prediction trajectory perspective, EnML-LARO (bottom yellow curve) exhibits the highest degree of overlap with the actual value curve (black dashed line), particularly in peak strength regions where this model accurately captures sudden strength variation characteristics. In contrast, other models demonstrate varying degrees of prediction deviations in these critical regions. The RF model performs reasonably well in most areas but exhibits obvious underestimation phenomena at extreme value points. The LGBM model shows considerable prediction fluctuations, particularly displaying significant prediction deviations in the selected error region on the right side. CatBoost andgradient boosting performance falls between the others but still cannot match LARO-EnML in terms of accuracy. These results fully demonstrate the superiority of the proposed LARO optimisation strategy-based ensemble framework compared to traditional models in applications targeting MICP-treated sand strength modelling.

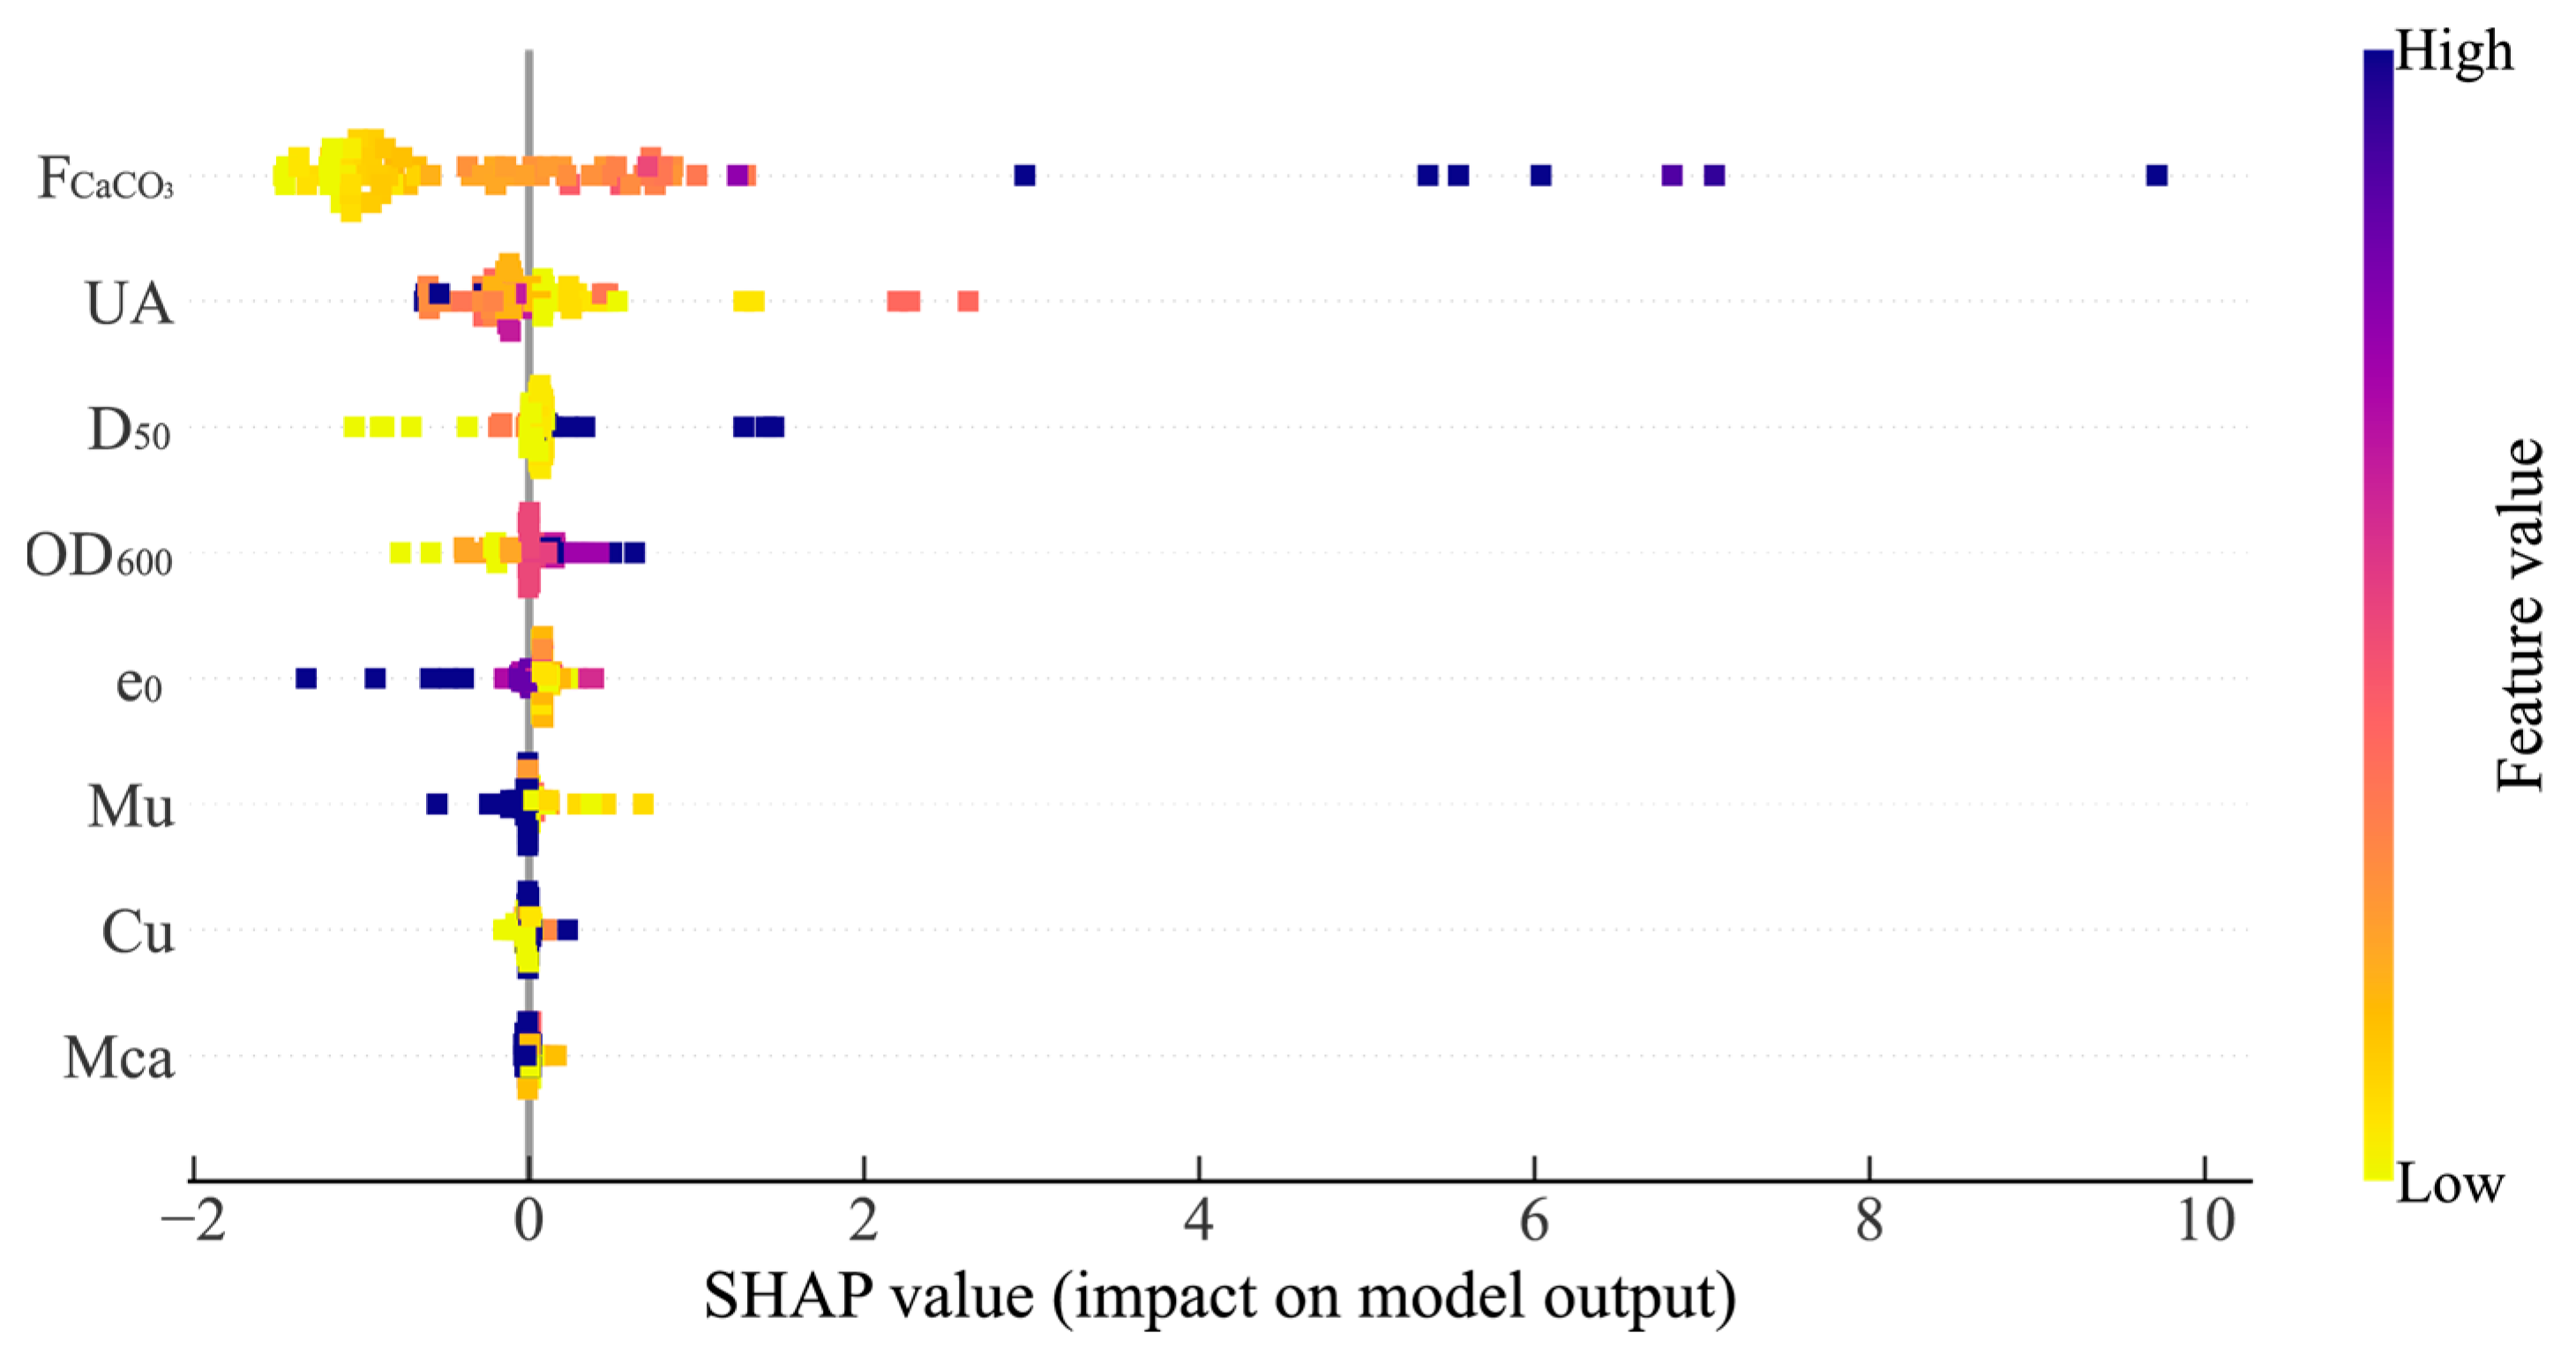
5.2. Sensitivity Analysis

5.2.1. Overall Feature Analysis

To thoroughly understand the influence degree and mechanism of various input parameters in predicting compressive strength of MICP-improved sand, this study introduces the SHAP (SHapley Additive exPlanations) analysis method to perform interpretability analysis on the constructed EnML-LARO. This method originates from Shapley value theory in game theory and can be used to quantitatively evaluate the relative contributions of input variables to model outputs, helping to enhance the comprehensibility and engineering applicability of model results [41,42,43,44,45].
Figure 9 presents the SHAP value distribution of the eight input variables’ influence on model prediction results. The horizontal axis represents the magnitude and positive/negative direction of each feature’s influence on strength prediction, while the vertical axis lists the eight main input parameters involved in modelling, including calcite content (FCaCO3), urease activity (UA), median particle size (D50), bacterial optical density (OD600), initial void ratio (e0), urea concentration (Mu), uniformity coefficient (Cu), and calcium chloride concentration (MCa). Different colours represent the high-low values of features, with colours transitioning from light yellow to deep blue, reflecting the variation range of feature values in the samples.
From the figure, it can be clearly observed that calcite content represents the most significant factor influencing model prediction results, with its SHAP value distribution range being the broadest, extending to approximately 9–10 in the positive region, and the majority of data points distributed in the positive influence area. Notably, when FCaCO3 content is high (deep blue points), the corresponding SHAP values are significantly positive, indicating that increased calcite content can substantially improve predicted target values. This result aligns with the fundamental principles of MICP technology, where calcite serves as the primary cementation product and its content directly determines soil strengthening effectiveness.
The influence degree of urease activity is relatively weaker, with SHAP values mainly concentrated in the −1 to 3 range. This variable demonstrates varying positive and negative effects under different values, indicating that the effectiveness of urease activity possesses certain complexity and conditionality. The SHAP value distribution of median particle size presents distinct bidirectional characteristics, with both significant negative influences and positive contributions, with SHAP values ranging from approximately −1.5 to 1.8. Colour variations show that smaller particle sizes (yellow) primarily contribute negative effects, while larger particle sizes (blue) are associated with positive influences. In contrast, bacterial optical density, initial void ratio, urea concentration, uniformity coefficient, and calcium chloride concentration all exhibit limited SHAP value distribution ranges, mainly concentrated in small intervals near zero values, indicating that these factors have relatively weak dominant effects on model prediction results.

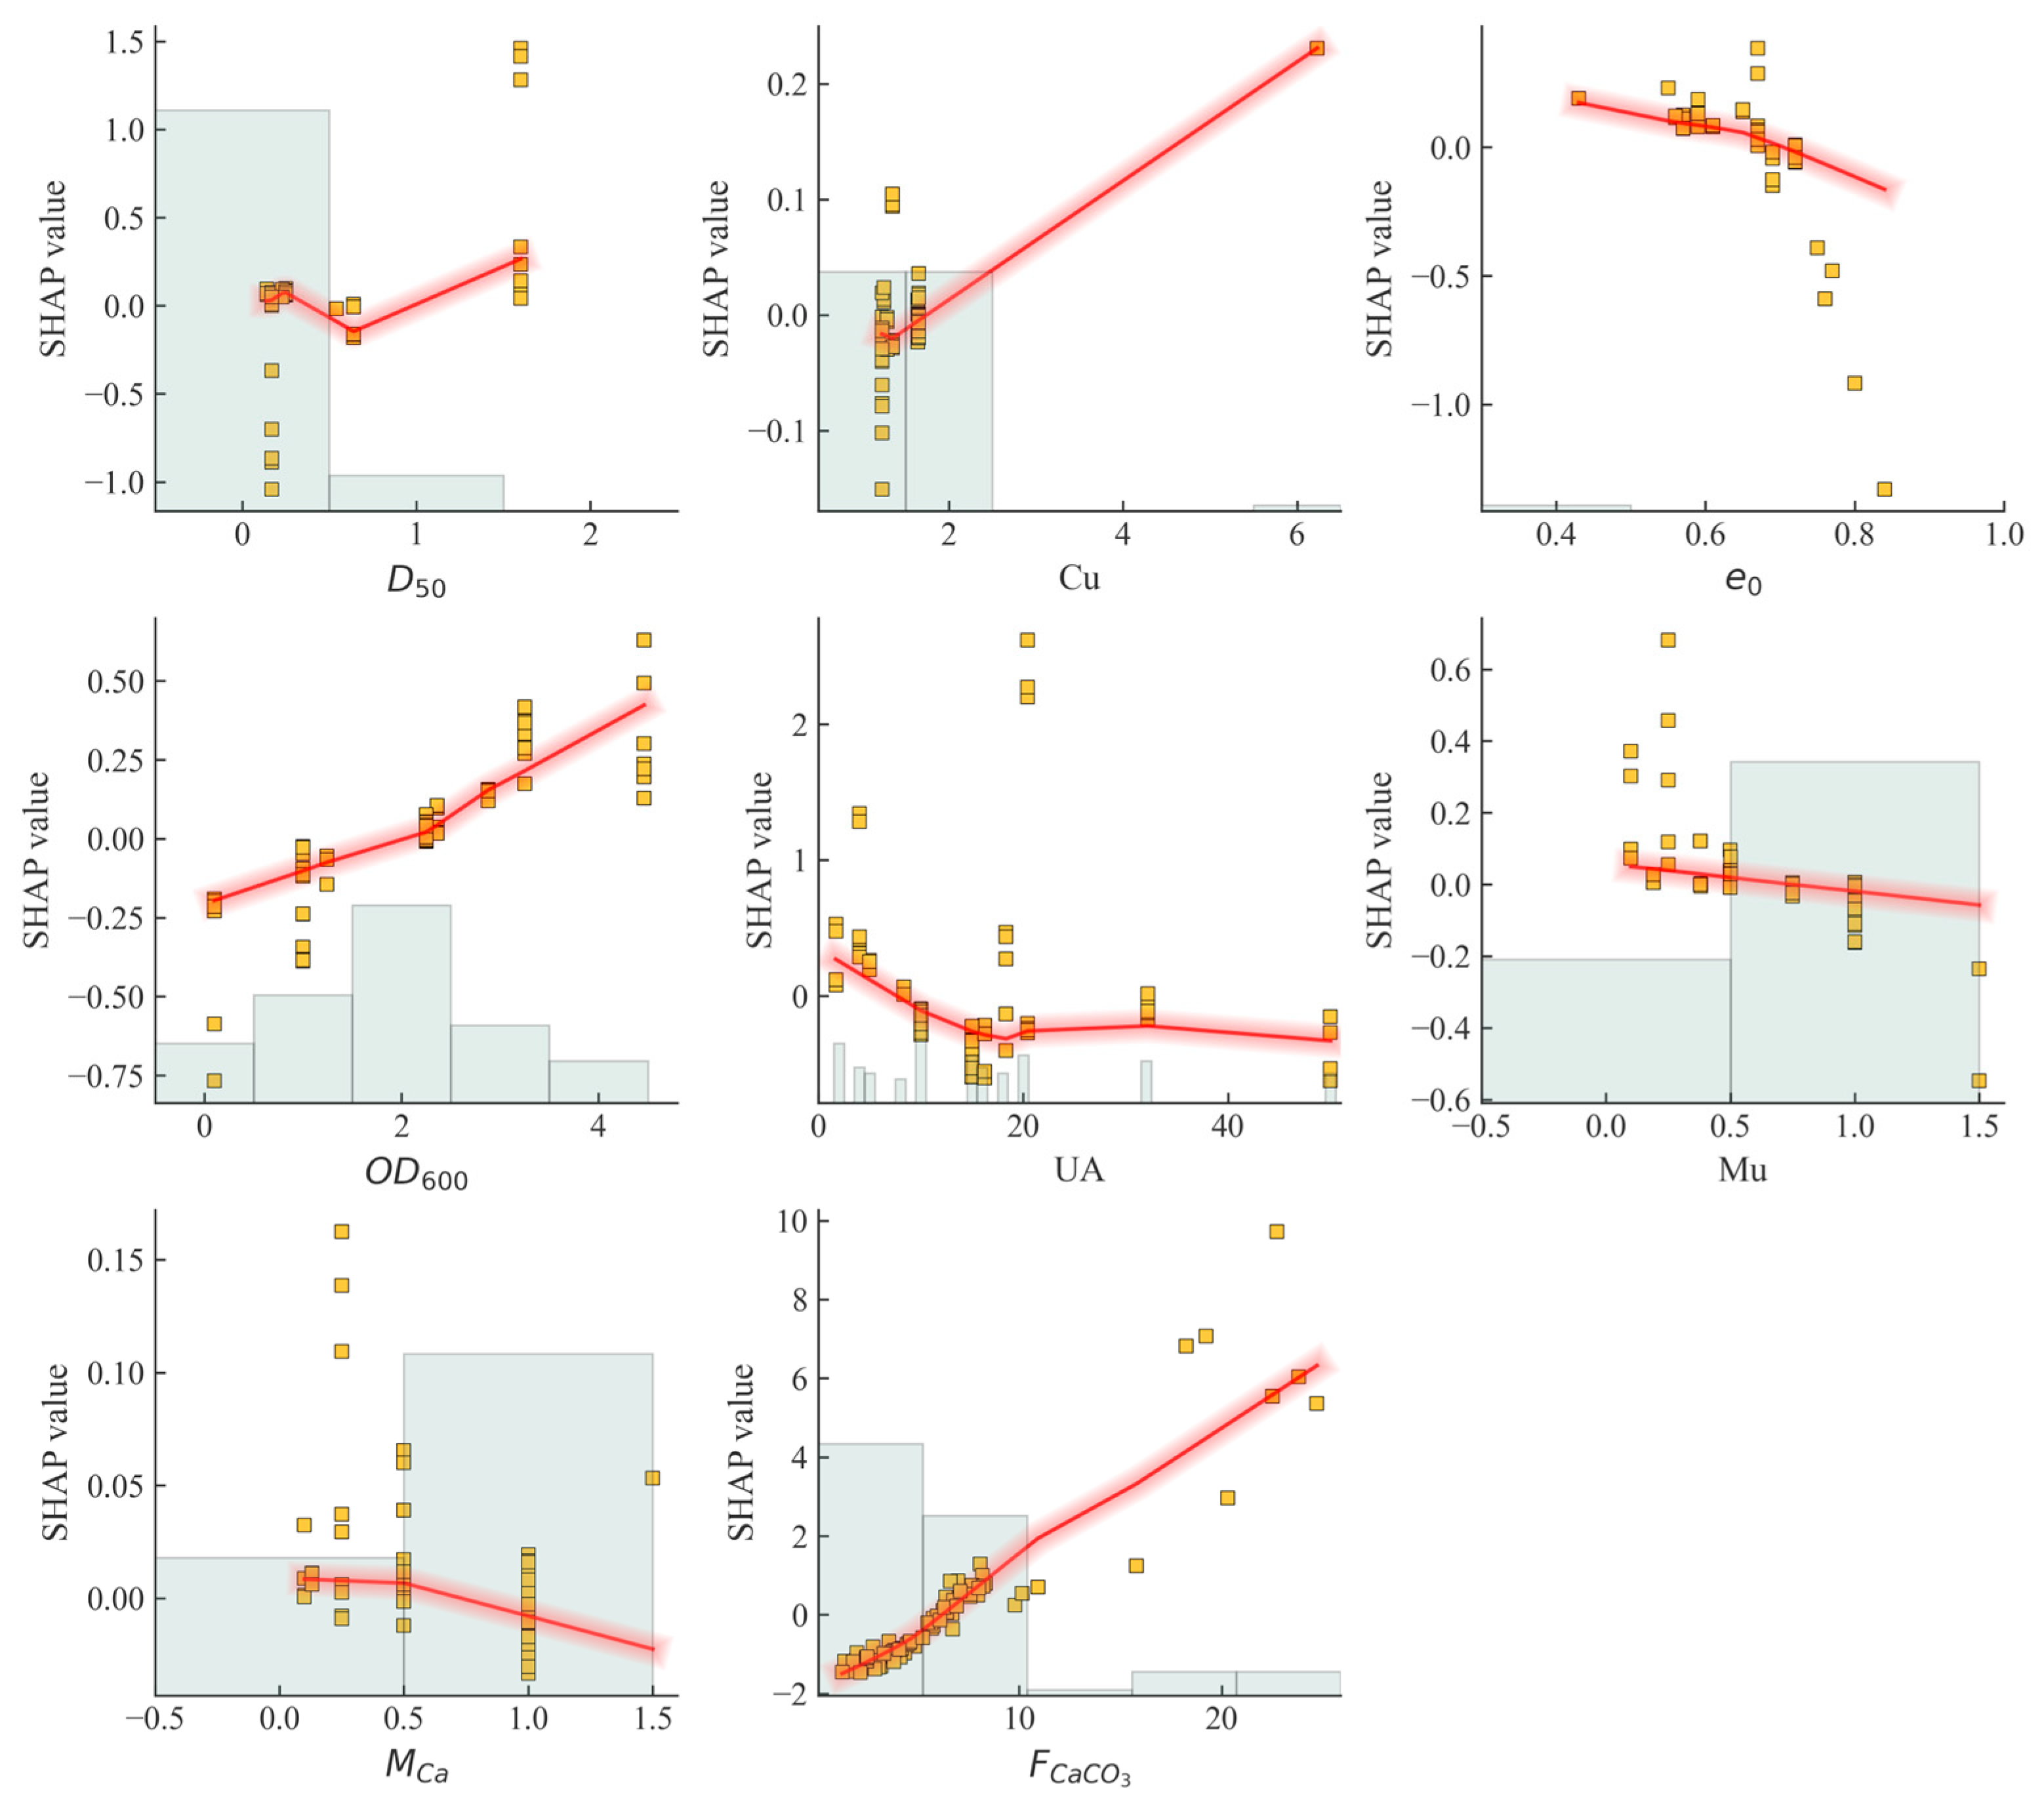
5.2.2. Feature Dependency Relationship Analysis

Figure 10 further presents the dependency relationships between main input variables and their corresponding SHAP values, facilitating an in-depth understanding of the variation patterns of each factor’s influence on model outputs. In each subplot, the horizontal axis corresponds to the variable’s own values, while the vertical axis represents the variable’s contribution to sand strength prediction results, with the overlaid red curve reflecting the overall influence trend.
From the figure, it can be observed that FCaCO3, as the most important influencing factor, exhibits a significant positive correlation with SHAP values. When calcite content increases from approximately 5% to 25%, SHAP values rise from near zero to above six, with an influence magnitude far exceeding other input parameters. This approximately linear positive trend indicates that calcite content is a key factor determining MICP treatment effectiveness, and its generation efficiency and distribution uniformity should be prioritised in practical engineering applications. UA demonstrates distinct staged influence characteristics. Within the lower range (0–5), UA contributes positively to model outputs, with SHAP values mainly distributed between 0.2 and 1.3, indicating that low-level urease activity promotes the strength of MICP-treated sand. This trend aligns with experimental observations by Cheng et al. [40], whose research demonstrated that under identical calcium carbonate precipitation amounts, lower urease activity resulted in higher UCS.
As UA gradually increases to the 5–18 transition interval, SHAP values rapidly decline, with the fitting curve showing a typical negative exponential decay trend, reflecting rapidly diminishing marginal gains. When urease activity exceeds 20, the model’s response tends to stabilise, with SHAP values approaching zero. D50 also exhibits complex, non-monotonic variation trends. Within the low particle size range near 0, SHAP values are highly dispersed, reflecting significant uncertainty in prediction results. As particle size increases to 0.4–0.7, the contribution gradually stabilises with a slight decline. However, upon further increase to the 0.8–1.7 range, SHAP values rise again, indicating significant nonlinear inflection points located approximately around 0.7. OD600 presents a clear positive influence trend, with SHAP values continuously increasing from approximately −0.75 to 0.5. This result aligns with MICP reaction mechanisms, where higher bacterial concentrations facilitate improved calcium carbonate precipitation efficiency, thereby enhancing sand cementation performance. Therefore, in engineering implementation, bacterial cultivation conditions should be rationally optimised to achieve appropriate bacterial density. e0 demonstrates a negative correlation with SHAP values. As the void ratio increases from 0.4 to 1.0, its SHAP values gradually decrease, indicating that larger pore spaces may result in uneven distribution of bacteria and nutrient solutions, subsequently weakening cementation effectiveness.
In contrast, the remaining input parameters (Mu, Cu, MCa) have relatively limited influence on strength prediction results. For instance, Mu’s SHAP values are mainly distributed between −0.6 and 0.6, with the overall trend slightly negative. Although these factors’ individual contributions are not significant, their synergistic effects with dominant factors should still be comprehensively considered in actual engineering design to achieve optimal sand improvement results. In summary, this analysis provides theoretical support for MICP parameter optimisation, emphasising that calcite generation, urease activity control, and particle size characteristic adjustment should be prioritised in strength prediction and engineering practice.

6. Conclusions

This study developed an ensemble learning framework for predicting the unconfined compressive strength of MICP-treated sand, combining advanced optimisation algorithms with interpretable techniques. Based on a comprehensive analysis, the following key conclusions can be drawn:
(a)
The proposed LARO-EnML attained the best results (RMSE = 0.5449, MAE = 0.2853, R2 = 0.9570, OI = 0.9597) on the test data, compared to individual ML methods. The integration of LARO optimisation effectively enhanced base learner performance, while the hierarchical architecture successfully mitigated overfitting issues, resulting in superior generalisation capability and providing a robust prediction tool for complex bio-geotechnical systems.
(b)
SHAP interpretability analysis identified calcite content as the dominant factor governing MICP treatment effectiveness, exhibiting a strong positive correlation with strength enhancement. Urease activity demonstrated optimal effectiveness at lower concentrations with diminishing returns at higher levels, while median particle size revealed nonlinear dependency with distinct thresholds for bio-cementation efficiency. These findings establish fundamental parameter hierarchies and provide quantitative guidance for MICP process optimisation in engineering applications.
(c)
While bacterial optical density, initial void ratio, and nutrient solution parameters demonstrated relatively weaker individual contributions, their synergistic interactions with dominant factors proved essential for optimising MICP treatment outcomes. The analysis revealed that these secondary parameters influence bio-cementation efficiency through mechanisms affecting bacterial distribution, reaction kinetics, and precipitation uniformity, emphasising the necessity of holistic parameter optimisation strategies.

Supplementary Materials

The following supporting information can be downloaded at: https://www.mdpi.com/article/10.3390/app15147972/s1, Table S1: Summary of input features and data sources for model development [5,42,46,47,48,49,50,51].

Author Contributions

Y.Q.: methodology, investigation, writing—review and editing; S.Y.: data curation, investigation; H.Q.: software, formal analysis; M.K.: investigation, writing—review and editing, supervision; J.Z.: conceptualisation, writing—review and editing, funding acquisition, supervision. All authors have read and agreed to the published version of the manuscript.

Funding

This research was supported by the National Science Foundation of China (42177164) and the Distinguished Youth Science Foundation of Hunan Province of China (2022JJ10073).

Institutional Review Board Statement

Not applicable.

Informed Consent Statement

Not applicable.

Data Availability Statement

All relevant data generated throughout this study are included in this article.

Conflicts of Interest

The authors declare that they have no known competing financial interests or personal relationships that could have appeared to influence the work reported in this paper.

Abbreviations

MICPmicrobially induced calcite precipitationUCSunconfined compressive strength
SHAPSHapley Additive exPlanationsLGBMlight gradient boosting machine
MLmachine learningMAEmean absolute error
MEPmulti-expression programmingRMSEroot mean square error
SVMsupport vector machineR2coefficient of determination
XGBoostextreme gradient boostingOIoverall index
MLPmulti-layer perceptronAROartificial rabbits optimisation
OD600bacterial concentrationMuurea concentration
FCaCO3calcite contentD50median particle size
e0initial void ratioMCacalcium chloride concentration
UAurease activityCuuniformity coefficient
CaBoostcategorical boostingRFrandom forest
DTdecision treeKNNk-nearest neighbours
NEnumber of estimatorsRLregularisation parameter
SAsubsample ratioLRlearning rate
ECefficiency coefficientCDcritical difference

References

  1. Jalili, M.; Ghasemi, M.R.; Pifloush, A.R. Stiffness and Strength of Granular Soils Improved by Biological Treatment Bacteria Microbial Cements. Emerg. Sci. J. 2018, 2, 219–227. [Google Scholar] [CrossRef]
  2. Naveed, M.; Duan, J.; Uddin, S.; Suleman, M.; Hui, Y.; Li, H. Application of microbially induced calcium carbonate precipitation with urea hydrolysis to improve the mechanical properties of soil. Ecol. Eng. 2020, 153, 105885. [Google Scholar] [CrossRef]
  3. Amini, O.; Ghasemi, M. Laboratory study of the effects of using magnesium slag on the geotechnical properties of cement stabilized soil. Constr. Build. Mater. 2019, 223, 409–420. [Google Scholar] [CrossRef]
  4. Tang, C.S.; Yin, L.; Jiang, N.; Zhu, C.; Zeng, H.; Li, H.; Shi, B. Factors affecting the performance of microbial-induced carbonate precipitation (MICP) treated soil: A review. Environ. Earth Sci. 2020, 79, 409–420. [Google Scholar] [CrossRef]
  5. Van Paassen, L.A.; Ghose, R.; van der Linden, T.J.; van der Star, W.R.; van Loosdrecht, M.C. Quantifying biomediated ground improvement by ureolysis: Large-scale biogrout experiment. J. Geotech. Geoenviron. Eng. 2010, 136, 1721–1728. [Google Scholar] [CrossRef]
  6. Wang, H.L.; Yin, Z.Y. Unconfined compressive strength of bio-cemented sand: State-of-the-art review and MEP-MC-based model development. J. Clean. Prod. 2021, 315, 128205. [Google Scholar] [CrossRef]
  7. Terzis, D.; Perego, C.; Cappa, M.; Pianta, E.; Mauri, F.; Principi, P. Biocementation beyond the Petri dish, scaling up to 900 L batches and a meter-scale column. Sci. Rep. 2025, 15, 3030. [Google Scholar] [CrossRef] [PubMed]
  8. De Jong, J.T.; Mortensen, B.M.; Martinez, B.C.; Nelson, D.C. Bio-mediated soil improvement. Ecol. Eng. 2010, 36, 197–210. [Google Scholar] [CrossRef]
  9. Ivanov, V.; Chu, J. Applications of microorganisms to geotechnical engineering for bioclogging and biocementation of soil in situ. Rev. Environ. Sci. Bio/Technol. 2008, 7, 139–153. [Google Scholar] [CrossRef]
  10. Chen, L.; Song, Y.; Fang, H.; Feng, Q.; Lai, C.; Song, X. Systematic optimization of a novel, cost-effective fermentation medium of Sporosarcina pasteurii for microbially induced calcite precipitation (MICP). Constr. Build. Mater. 2022, 348, 128632. [Google Scholar] [CrossRef]
  11. De Muynck, W.; De Belie, N.; Verstraete, W. Microbial carbonate precipitation in construction materials: A review. Ecol. Eng. 2010, 36, 118–136. [Google Scholar] [CrossRef]
  12. Ng, W.S.; Lee, M.L.; Hii, S.L. An overview of the factors affecting microbial-induced calcite precipitation and its potential application in soil improvement. In Proceedings of the World Academy of Science, Engineering and Technology; World Academy of Science, Engineering and Technology: New York, NY, USA, 2012; Volume 62, pp. 723–729. [Google Scholar]
  13. Mitchell, J.K.; Santamarina, J.C. Biological considerations in geotechnical engineering. J. Geotech. Geoenviron. Eng. 2005, 131, 1222–1233. [Google Scholar] [CrossRef]
  14. Chu, J.; Stabnikov, V.; Ivanov, V. Microbially induced calcium carbonate precipitation on surface or in the bulk of soil. Geomicrobiol. J. 2012, 29, 544–549. [Google Scholar] [CrossRef]
  15. Wani, K.M.N.S.; Mir, B.A. Microbial geo-technology in ground improvement techniques: A comprehensive review. Innov. Infrastruct. Solut. 2020, 5, 82. [Google Scholar] [CrossRef]
  16. Mujah, D.; Shahin, M.A.; Cheng, L. State-Of-The-Art Review Of Biocementation By Microbially Induced Calcite Precipitation (MICP) For Soil Stabilization. Geomicrobiol. J. 2016, 34, 524–537. [Google Scholar] [CrossRef]
  17. Chu, J.; Ivanov, V.; Naeimi, M.; Stabnikov, V.; Liu, H.-L. Optimization of calcium-based bioclogging and biocementation of sand. Acta Geotech. 2013, 9, 277–285. [Google Scholar] [CrossRef]
  18. Yang, P.; Yong, W.; Li, C.; Peng, K.; Wei, W.; Qiu, Y.; Zhou, J. Hybrid random forest-based models for earth pressure balance tunneling-induced ground settlement prediction. Appl. Sci. 2023, 13, 2574. [Google Scholar] [CrossRef]
  19. Sioutas, K.N.; Benardos, A. Boosting Model Interpretability for Transparent ML in TBM Tunneling. Appl. Sci. 2024, 14, 11394. [Google Scholar] [CrossRef]
  20. Navarro-Rodríguez, A.; Castro-Artola, O.A.; García-Guerrero, E.E.; Aguirre-Castro, O.A.; Tamayo-Pérez, U.J.; López-Mercado, C.A.; Inzunza-Gonzalez, E. Recent Advances in Early Earthquake Magnitude Estimation by Using Machine Learning Algorithms: A Systematic Review. Appl. Sci. 2025, 15, 3492. [Google Scholar] [CrossRef]
  21. Talamkhani, S. Machine Learning-Based Prediction of Unconfined Compressive Strength of Sands Treated by Microbially-Induced Calcite Precipitation (MICP): A Gradient Boosting Approach and Correlation Analysis. Adv. Civ. Eng. 2023, 2023, 3692090. [Google Scholar] [CrossRef]
  22. Cheng, C.; Xu, P.-F.; Cheng, H.; Ding, Y.; Zheng, J.; Ge, T.; Sun, D.; Xu, J. Ensemble learning approach based on stacking for unmanned surface vehicle’s dynamics. Ocean Eng. 2020, 207, 107388. [Google Scholar] [CrossRef]
  23. Shafieian, S.; Zulkernine, M. Multi-layer stacking ensemble learners for low footprint network intrusion detection. Complex Intell. Syst. 2022, 9, 3787–3799. [Google Scholar] [CrossRef]
  24. Qiu, Y.; Zhou, J. Short-term rockburst damage assessment in burst-prone mines: An explainable xgboost hybrid model with scso algorithm. Rock Mech. Rock Eng. 2023, 56, 8745–8770. [Google Scholar] [CrossRef]
  25. Sagi, O.; Rokach, L. Ensemble learning: A survey. Wiley Interdiscip. Rev. Data Min. Knowl. Discov. 2018, 8, e1249. [Google Scholar] [CrossRef]
  26. Rokach, L. Ensemble-based classifiers. Artif. Intell. Rev. 2010, 33, 1–39. [Google Scholar] [CrossRef]
  27. Qiu, Y.; Zhou, J. Short-term rockburst prediction in underground project: Insights from an explainable and interpretable ensemble learning model. Acta Geotech. 2023, 18, 6655–6685. [Google Scholar] [CrossRef]
  28. Wang, L.; Cao, Q.; Zhang, Z.; Mirjalili, S.; Zhao, W. Artificial rabbits optimization: A new bio-inspired meta-heuristic algorithm for solving engineering optimization problems. Eng. Appl. Artif. Intell. 2022, 114, 105082. [Google Scholar] [CrossRef]
  29. Gülmez, B. Stock price prediction with optimized deep LSTM network with artificial rabbits optimization algorithm. Expert Syst. Appl. 2023, 227, 120346. [Google Scholar] [CrossRef]
  30. Wang, Y.; Huang, L.; Zhong, J.; Hu, G. LARO: Opposition-Based Learning Boosted Artificial Rabbits-Inspired Optimization Algorithm with Lévy Flight. Symmetry 2022, 14, 2282. [Google Scholar] [CrossRef]
  31. Rezaeineshat, A.; Monjezi, M.; Mehrdanesh, A.; Khandelwal, M. Optimization of blasting design in open pit limestone mines with the aim of reducing ground vibration using robust techniques. Géoméch. Geophys. Geo-Energy Geo-Resour. 2020, 6, 1–14. [Google Scholar] [CrossRef]
  32. Zhang, Y.-L.; Qiu, Y.-G.; Armaghani, D.J.; Monjezi, M.; Zhou, J. Enhancing rock fragmentation prediction in mining operations: A Hybrid GWO-RF model with SHAP interpretability. J. Central South Univ. 2024, 31, 2916–2929. [Google Scholar] [CrossRef]
  33. Cheng, L.; Shahin, M.A. Microbially induced calcite precipitation (MICP) for soil stabilization. Ecol. Wisdom Inspired Restor. Eng. 2019, 47–68. [Google Scholar]
  34. Razbani, M.A.; Jettestuen, E.; Røyne, A. Direct Pore-Scale Numerical Simulation of Microbially Induced Calcium Carbonate Precipitation. Water Resour. Res. 2023, 59, e2022WR032988. [Google Scholar] [CrossRef]
  35. Jiang, L.; Xia, H.; Wang, W.; Zhang, Y.; Li, Z. Applications of microbially induced calcium carbonate precipitation in civil engineering practice: A state-of-the-art review. Constr. Build. Mater. 2023, 404, 133227. [Google Scholar] [CrossRef]
  36. Umar, M.; Kassim, K.A.; Chiet, K.T.P. Biological process of soil improvement in civil engineering: A review. J. Rock Mech. Geotech. Eng. 2016, 8, 767–774. [Google Scholar] [CrossRef]
  37. Huang, S.; Liu, K.; Li, Y.; Shi, X.; Fan, H.; Xu, M.; Jiang, Z.; Hu, F.; Ma, H.; Li, P. Electrolyte-rock interactions in salt cavern flow batteries. Energy 2025, 330, 136811. [Google Scholar] [CrossRef]
  38. Zehner, J.; Røyne, A.; Wentzel, A.; Sikorski, P. Microbial-induced calcium carbonate precipitation: An experimental toolbox for in situ and real time investigation of micro-scale pH evolution. RSC Adv. 2020, 10, 20485–20493. [Google Scholar] [CrossRef] [PubMed]
  39. Demšar, J. Statistical comparisons of classifiers over multiple data sets. J. Mach. Learn. Res. 2006, 7, 1–30. [Google Scholar]
  40. Zhou, J.; Li, X.; Mitri, H.S. Classification of rockburst in underground projects: Comparison of ten supervised learning methods. J. Comput. Civ. Eng. 2016, 30, 04016003. [Google Scholar] [CrossRef]
  41. Zhou, J.; Qiu, Y.; Khandelwal, M.; Zhu, S.; Zhang, X. Developing a hybrid model of Jaya algorithm-based extreme gradient boosting machine to estimate blast-induced ground vibrations. Int. J. Rock Mech. Min. Sci. Géoméch. Abstr. 2021, 145, 104856. [Google Scholar] [CrossRef]
  42. Cheng, L.; Shahin, M.A.; Mujah, D. Influence of key environmental conditions on microbially induced cementation for soil stabilization. J. Geotech. Geoenviron. Eng. 2017, 143, 04016083. [Google Scholar] [CrossRef]
  43. Qiu, Y.; Zhou, J. Novel rockburst prediction criterion with enhanced explainability employing CatBoost and nature-inspired metaheuristic technique. Undergr. Space 2024, 19, 101–118. [Google Scholar] [CrossRef]
  44. Zhou, J.; Huang, S.; Qiu, Y. Optimization of random forest through the use of MVO, GWO and MFO in evaluating the stability of underground entry-type excavations. Tunn. Undergr. Space Technol. 2022, 124, 104494. [Google Scholar] [CrossRef]
  45. Qiu, Y.; Zhou, J. Methodology for Constructing Explicit Stability Formulas for Hard Rock Pillars: Integrating Data-Driven Approaches and Interpretability Techniques. Rock Mech. Rock Eng. 2025, 58, 5475–5502. [Google Scholar] [CrossRef]
  46. Mujah, D.; Cheng, L.; Shahin, M.A. Microstructural and geomechanical study on biocemented sand for optimization of MICP process. J. Mater. Civ. Eng. 2019, 31, 04019025. [Google Scholar] [CrossRef]
  47. Qabany, A.A.; Soga, K. Effect of chemical treatment used in MICP on engineering properties of cemented soils. In Bio-and Chemo-Mechanical Processes in Geotechnical Engineering: Géotechnique Symposium in Print 2013; ICE Publishing: London, UK, 2014; pp. 107–115. [Google Scholar] [CrossRef]
  48. Cheng, L.; Cord-Ruwisch, R.; Shahin, M.A. Cementation of sand soil by microbially induced calcite precipitation at various degrees of saturation. Can. Geotech. J. 2013, 50, 81–90. [Google Scholar] [CrossRef]
  49. Wang, Y.; Konstantinou, C.; Soga, K.; DeJong, J.T.; Biscontin, G.; Kabla, A.J. Enhancing strength of MICP-treated sandy soils: From micro to macro scale. arXiv 2020. [Google Scholar] [CrossRef]
  50. Mahawish, A.; Bouazza, A.; Gates, W.P. Factors affecting the bio-cementing process of coarse sand. Proc. Inst. Civ. Eng.-Ground Improv. 2019, 172, 25–36. [Google Scholar] [CrossRef]
  51. Mahawish, A.; Bouazza, A.; Gates, W.P. Unconfined compressive strength and visualization of the microstructure of coarse sand subjected to different biocementation levels. J. Geotech. Geoenvironmental Eng. 2019, 145, 04019033. [Google Scholar] [CrossRef]
Figure 1. Schematic illustration of the MICP process in sand matrix.
Applsci 15 07972 g001
Figure 2. Density distributions of input and output parameters in the MICP database.
Applsci 15 07972 g002
Figure 3. Correlation matrix of the input parameters used in this study.
Applsci 15 07972 g003
Figure 4. Performance evaluation and statistical comparison of ML models: (a) Model performance comparison; (b) Statistical ranking of models.
Applsci 15 07972 g004
Figure 5. LARO optimisation convergence curves for base learners: (a) SVM model; (b) XGBoost model.
Applsci 15 07972 g005
Figure 6. Strength prediction results for each model on the training set.
Applsci 15 07972 g006
Figure 7. Strength prediction results for each model on the test set.
Applsci 15 07972 g007
Figure 8. Prediction trajectory comparison across different models.
Applsci 15 07972 g008
Figure 9. SHAP analysis of key variables influencing MICP-treated sand strength.
Applsci 15 07972 g009
Figure 10. Dependency analysis of key variables for MICP-treated sand strength.
Applsci 15 07972 g010
Table 1. Performance comparison of ML models on the training set.
Model NameEvaluation
RMSEMAER2OI
XGBoost0.32620.21550.97170.9755
LARO-XGBoost0.26940.16730.98070.9818
SVM0.93230.41420.76880.8549
LARO-SVM0.57620.25910.91170.9376
MLP0.72440.38560.86040.9073
LARO-EnML0.30180.14840.97580.9784
Table 2. Performance comparison of ML models on the test set.
Model NameEvaluation
RMSEMAER2OI
XGBoost0.70430.40280.92820.9398
LARO-XGBoost0.62550.34460.94330.9501
SVM1.36810.61830.72900.8173
LARO-SVM0.64530.34090.93970.9476
MLP0.88670.52430.88610.9125
LARO-EnML0.54490.28530.95700.9597
Table 3. Comparison of LARO-EnML and mainstream ensemble methods.
Model NameEvaluation
RMSEMAER2OI
LARO-EnML0.54490.28530.95700.9597
CatBoost0.64250.36630.94020.9480
RF0.73480.38380.92180.9356
LGBM1.03820.52840.84390.8861
Gradient Boosting0.66450.36840.93610.9451
Disclaimer/Publisher’s Note: The statements, opinions and data contained in all publications are solely those of the individual author(s) and contributor(s) and not of MDPI and/or the editor(s). MDPI and/or the editor(s) disclaim responsibility for any injury to people or property resulting from any ideas, methods, instructions or products referred to in the content.

