Article

Experimental Study on Grouting Visualization of Cover Layer Based on Transparent Soil

State Key Laboratory of Simulation and Regulation of Water Cycle in River Basin, China Institute of Water Resources and Hydropower Research, Beijing 100038, China
*
Author to whom correspondence should be addressed.
Appl. Sci. 2025, 15(14), 7854; https://doi.org/10.3390/app15147854
Submission received: 13 June 2025 / Revised: 9 July 2025 / Accepted: 10 July 2025 / Published: 14 July 2025
(This article belongs to the Section Civil Engineering)

Abstract

Grouting, as a widely applicable and versatile foundation treatment technology, plays a crucial role in addressing seepage control problems in cover layers due to its flexibility and convenience. The effectiveness of grouting largely depends on slurry diffusion; however, due to the opaque nature of geotechnical media, the diffusion mechanism of slurry in the cover layers remains insufficiently understood. To investigate this, a visual grouting model device was designed and fabricated, and grouting tests were conducted using transparent soil materials to simulate the cover layers. The slurry diffusion patterns and the velocity field within the transparent soil were analyzed. The results show that, based on refractive-index matching, fused quartz sand of specific gradation and white mineral oil were selected as simulation materials for the cover layers. A stable slurry suitable for transparent grouting was also chosen to satisfy visualization requirements. The transparent soil grouting model, integrated with a Digital Image Correlation (DIC) monitoring system, has the advantages of demonstrating simple operation, real-time monitoring, and high precision. These tests verify the feasibility of visualizing slurry diffusion in cover layers. Furthermore, step-pressure grouting tests preliminarily reveal the dynamic mechanism of slurry diffusion. The results suggest that, in the cover layer, the cover layer in this grouting test is mainly splitting grouting, accompanied by compaction grouting. These methods offer new insights and methods for model testing of cover layer grouting mechanisms.

1. Introduction

Grouting technology, a principal method for improving the mechanical behavior of loose rock and soil particles by injecting grout into their voids, is extensively employed in civil engineering, water conservancy, mining, transportation, and related fields to enhance stability, bearing capacity, and impermeability. Owing to its adaptability to complex geological conditions, flexible construction procedures, and precise controllability, grouting has become the core technique for seepage control and reinforcement of cover layers (Xia et al., 2022) [1]. Investigating visualized slurry-diffusion methods within the cover layer not only deepens our understanding of the cover layer reinforcement mechanisms but also plays a vital role in optimizing grouting quality and performance.
Grouting tests are an important method for studying grouting mechanisms. Currently, many researchers have conducted extensive experimental studies on the grouting process (Kambiz et al., 2019) [2], slurry material properties (Ruan, 2005) [3], stratigraphic characteristics (Geng et al., 2017) [4], grouting scheme design etc. (Fu et al., 2014) [5], in order to analyze the hydraulic behavior of grouting in the cover layer. Due to the invisibility of natural rock and soil layers, it is difficult for the traditional grouting test to directly observe the diffusion process of slurry in soil. Even with numerous sensors, technical challenges remain, including limited spatial resolution, lack of temporal continuity, and difficulties in the coupling and decoupling of multiple fields (Hu et al., 2022) [6]. With the rapid development of transparent soil testing technology, visualizing slurry diffusion in the cover layer has become achievable. Researchers have conducted extensive studies on the physical properties and geotechnical engineering applications of transparent soil materials. Through the triaxial consolidation undrained tests and direct shear tests on transparent glass sand and standard sand, it was found that under the same gradation, their shear strengths were similar, indicating that transparent glass sand can effectively simulate natural sand (Kong et al., 2016) [7]. By setting visible particles in transparent soil slope, the instability process caused by internal deformation of transparent soil slope is successfully simulated (Wang et al., 2019) [8]. In studying the seepage characteristics of transparent soil materials, the fluid–solid interaction process in debris flow was simulated by using transparent particles and corresponding mixed oil (Sanvitale et al., 2012) [9]. Based on the self-developed transparent soil permeameter, the piping mechanism of non-cohesive soil was studied by using glass sand, fluorescent agent, and mineral oil with different gradations (Hunter et al., 2017) [10]. Transparent sand was prepared with fused quartz particles and mixed mineral oil, and the feasibility of grouting diffusion visualization was verified by a simple grouting test (Hu et al., 2024) [11]. The visualization of the chemical slurry infiltration grouting process in a transparent soil model was completed by using a laser and a CCD camera. The research showed that the chemical slurry was “pear-shaped” diffusion under the action of gravity; that is, the vertical diffusion distance was greater than the horizontal diffusion distance (Gao and Wang, 2016) [12].
At present, transparent soil technology has been gradually applied to grouting test research. However, the existing research on grout in transparent soil mostly uses dye pigments as diffusion tracer materials, which makes it difficult to truly reflect the flow characteristics of Bingham fluid represented by cement grout in the overburden. In addition, due to the size of the model box, the slurry diffusion is easily affected by the boundary effect, which leads to the deviation between the research results and the actual situation, and most studies only qualitatively analyze the diffusion form of slurry in transparent soil. In the current transparent soil grouting test, the grouting medium used is mostly uniform particle size, which makes it difficult to describe the seepage characteristics of slurry under the real grading. In this paper, based on the transparent soil test technology, the visual grouting test model and a non-contact measurement device with a large model similarity ratio are independently developed, which simulates the real overburden material according to the specific particle grading, and selects the transparent soil and slurry material. The visual monitoring of the whole process of slurry diffusion is realized through the step pressure grouting test, and the qualitative and quantitative analysis is carried out combined with PIV technology. The research results are expected to provide new research ideas and technical paths for grouting theory and test methods.

2. Visualization Grouting Test System
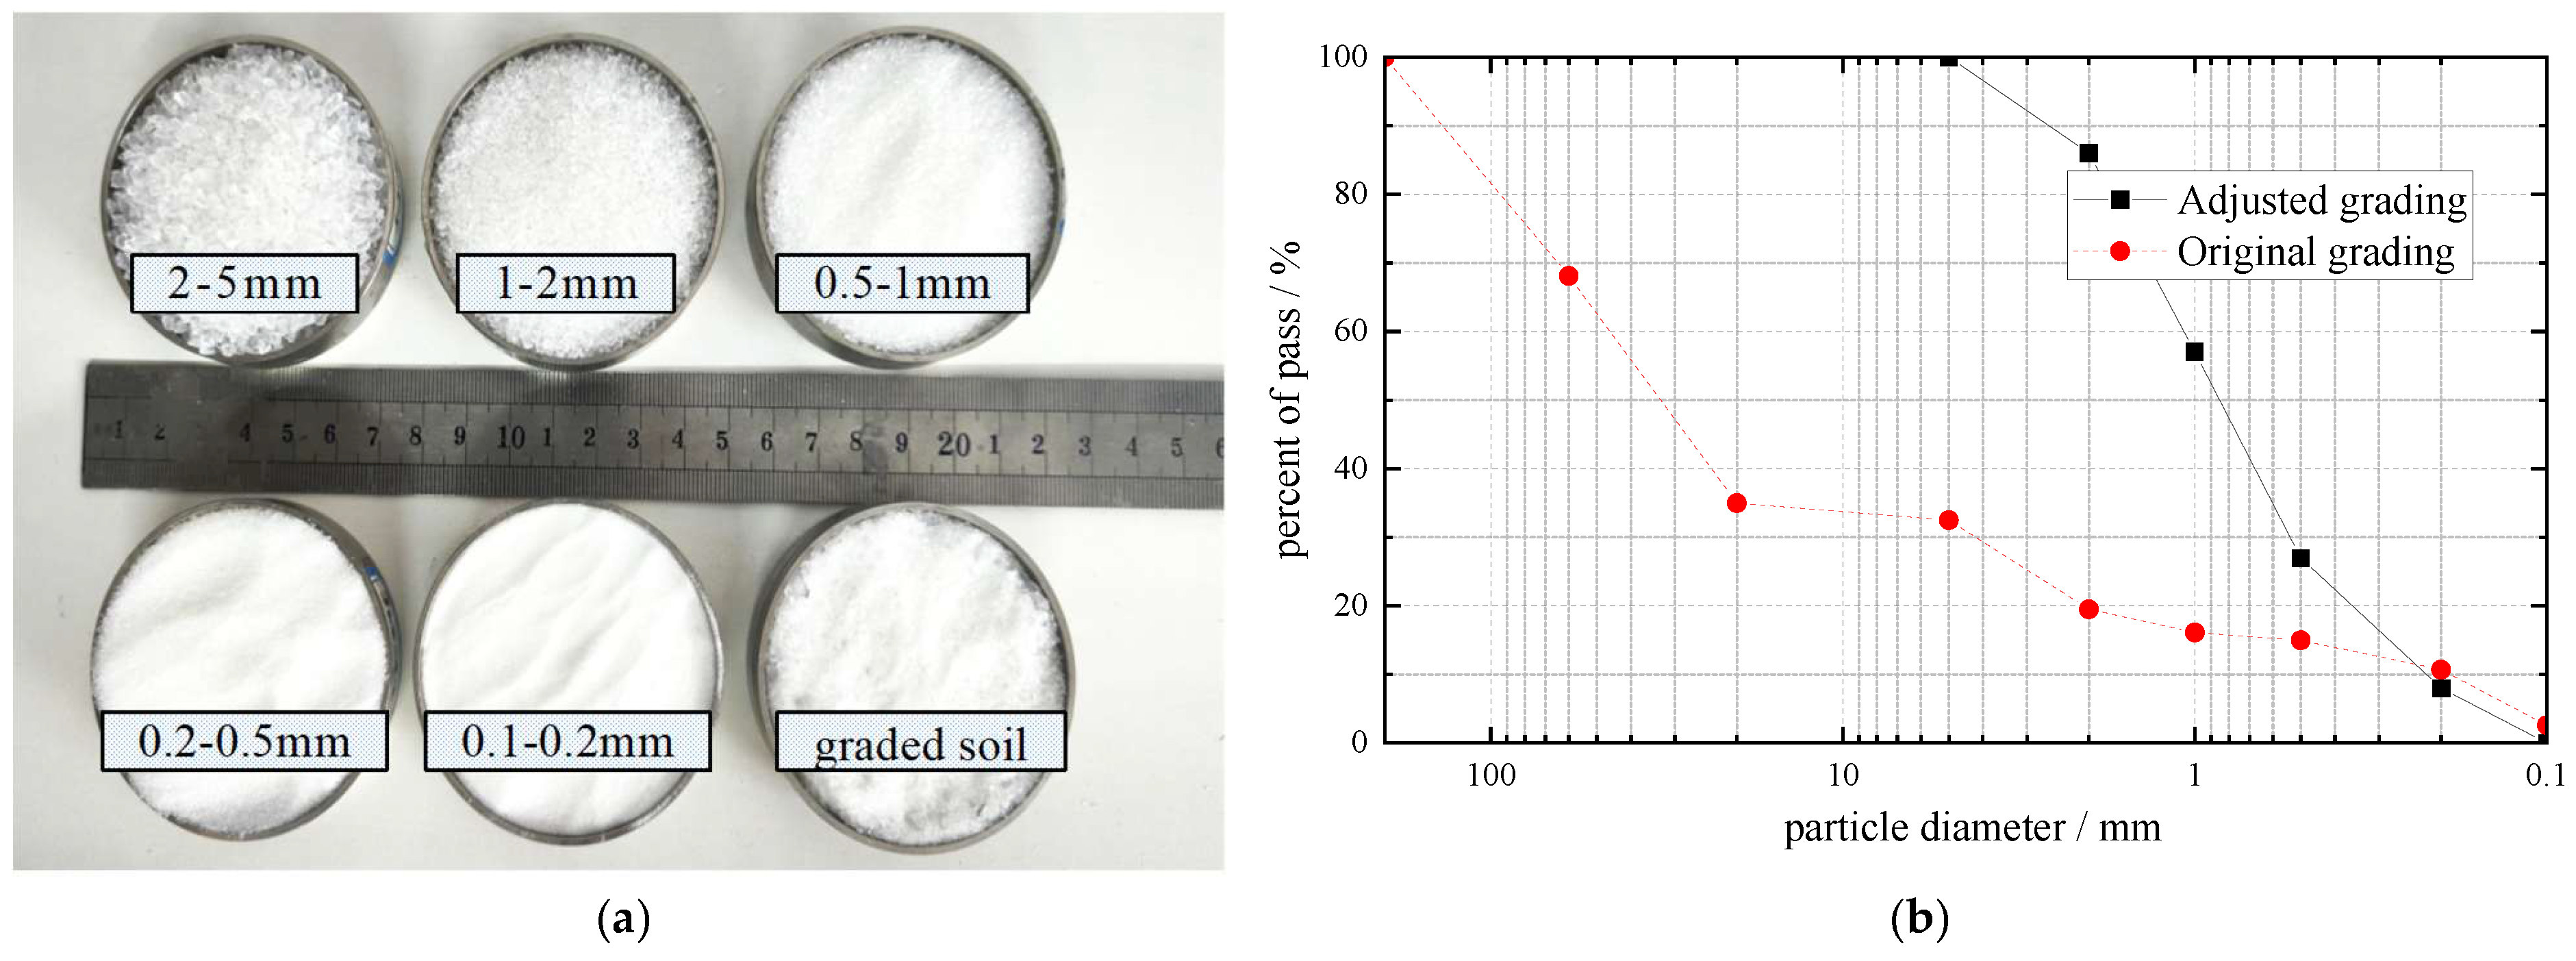
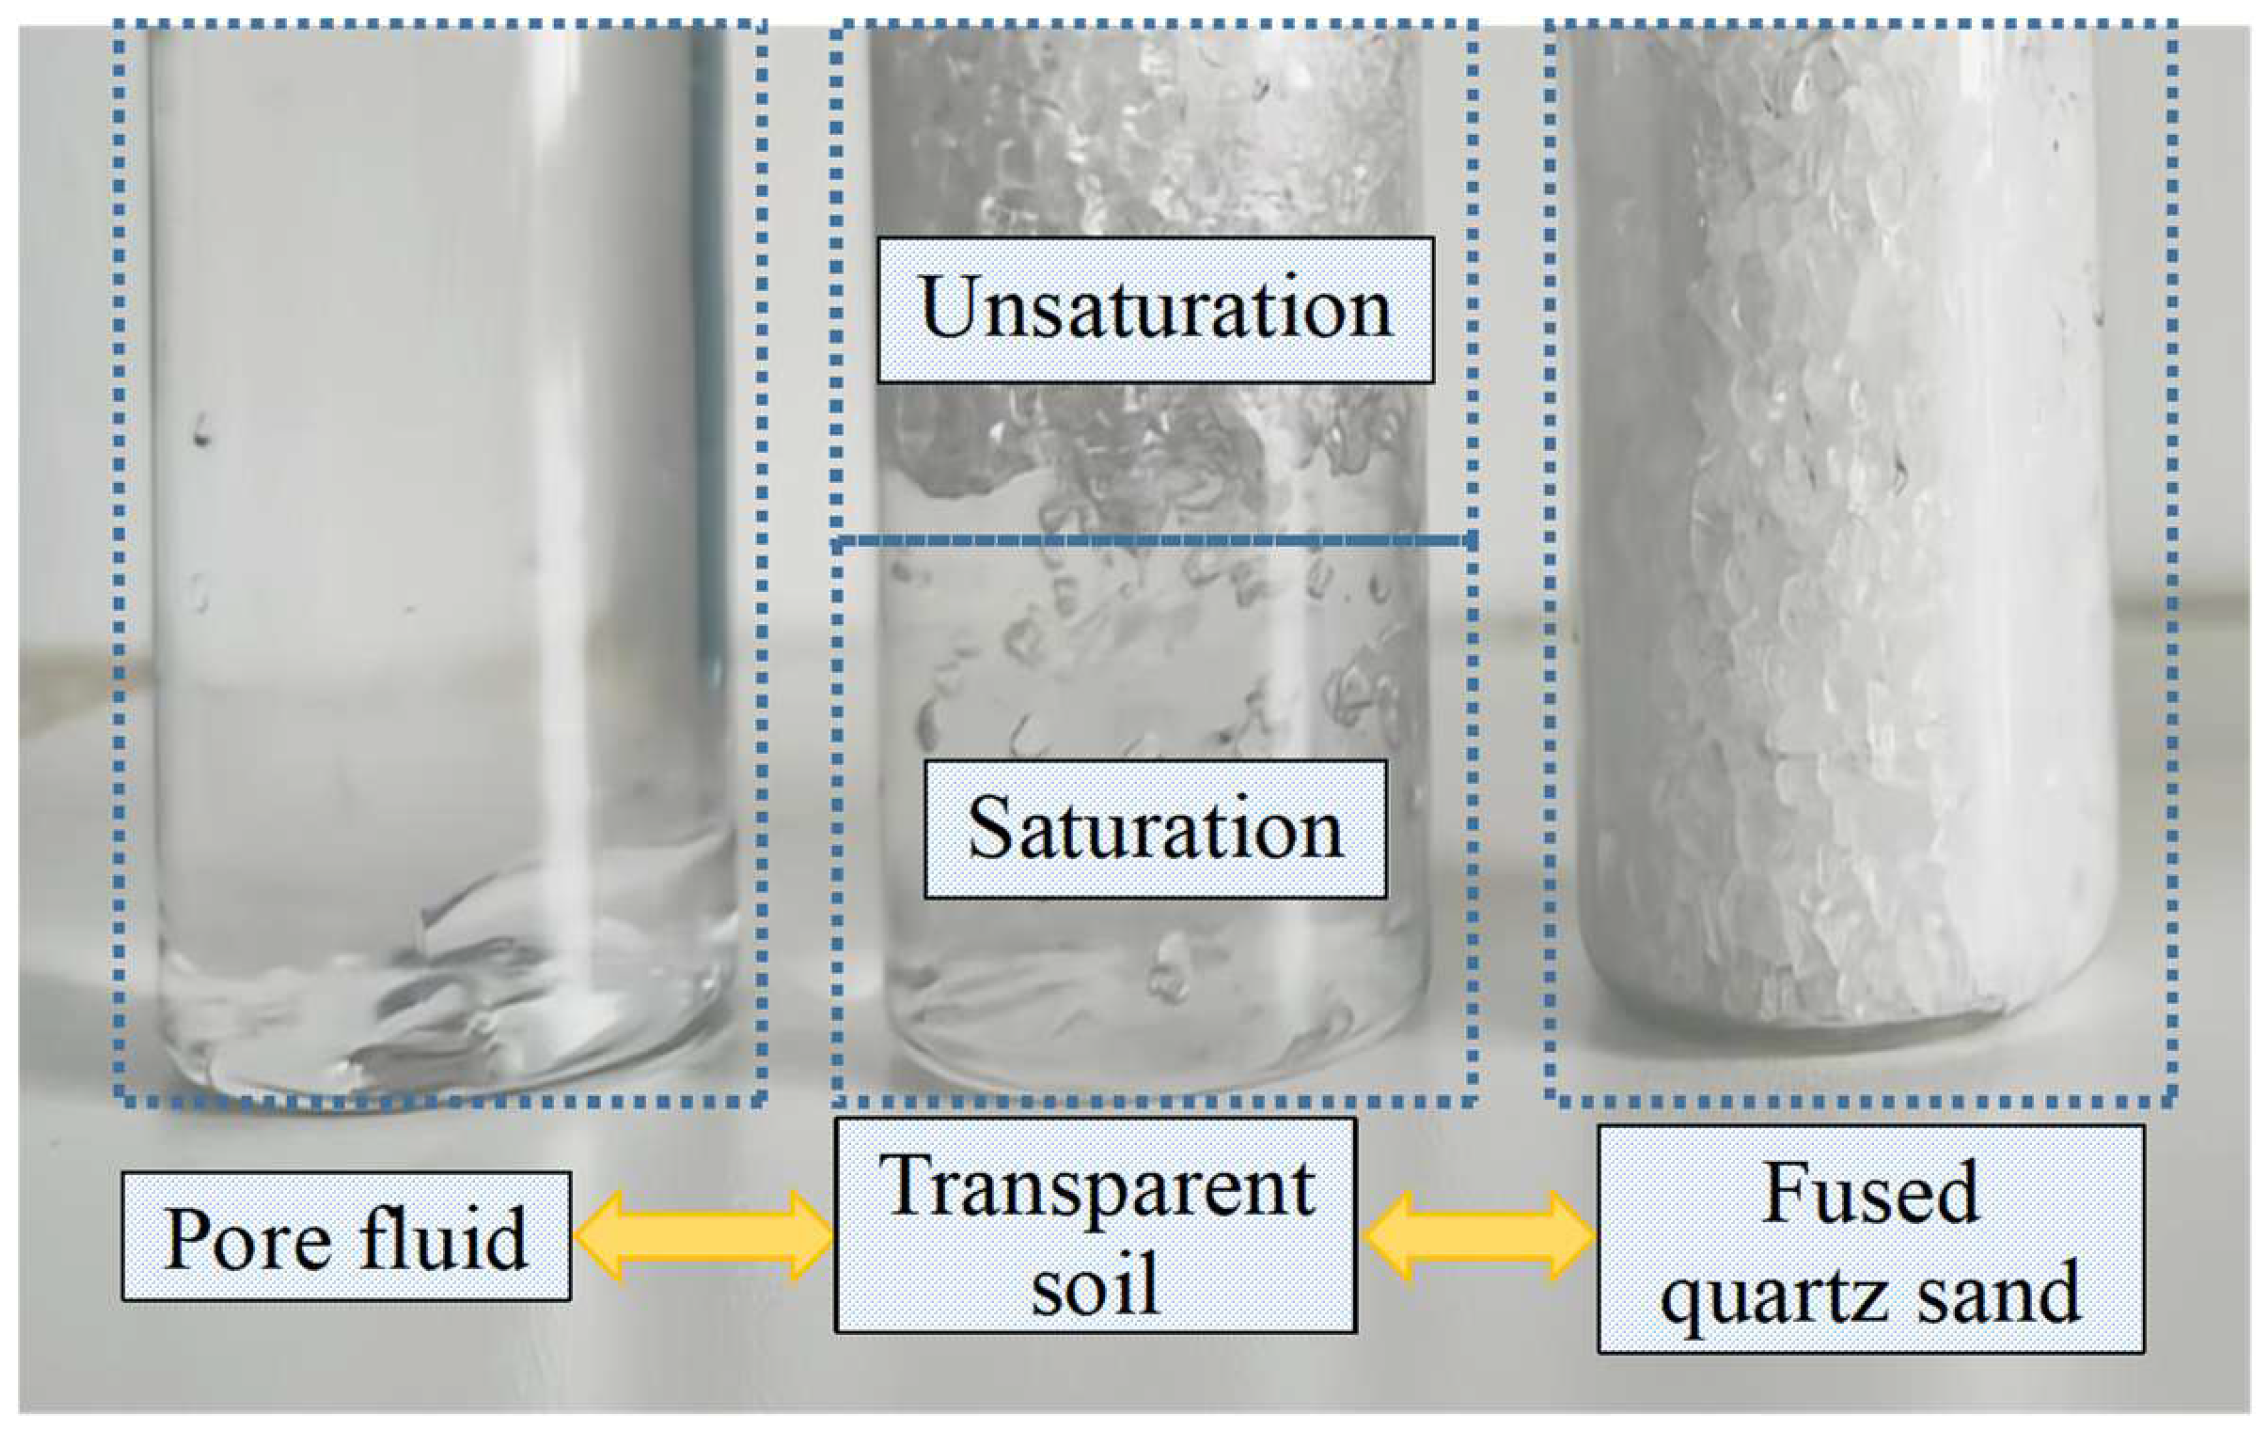
2.1. Test Materials

(1)
Transparent soil materials
To better observe the grouting process in the cover layer, this study uses fused quartz sand particles with high transparency and stable properties to simulate the cover layer. In its semi-transparent state, the material allows visibility up to 250 mm (Liu et al., 2024) [13], meeting the requirements for tracking slurry diffusion and observing formation deformation. In this experiment, fused quartz sand produced by Jiangsu Welfare Fucai Factory, Lianyungan, China was used as the transparent soil matrix. Its main chemical component is silica (SiO2), with a refractive index of 1.458. Relevant parameters are provided in Table 1.
Although the transparent soil (fused silica sand and mineral oil) used in the experiment is different from natural soil in physical and chemical composition, its particle size, particle grading, dense state, and slurry compatibility are controlled in the range close to the actual sand soil layer (Kong et al., 2016) [7]. In the experiment, geometric, dynamic, and material similarity criteria based on similarity theory were used to control key parameters (such as particle size distribution and permeability coefficient) to maintain the similarity of diffusion behavior of the experimental system as much as possible (Gao et al., 2016) [12].
The prototype particle size distribution of the model was derived from the dam foundation cover layer of the Xiabandi Water Conservancy Project in Xinjiang Province. This paper selects the sand and soil of the glacial water accumulation layer in this stratum as the ground to be injected. According to the sample preparation requirements outlined in the Standard for Geotechnical Test Methods (GB/T 50123-2019) [14], the maximum particle size of the test soil must be less than one-fifth of the sample’s characteristic dimension. The test materials consisted of fused quartz sand particles ranging from 0.1 to 5 mm, categorized into five size intervals: 0.1–0.2 mm, 0.2–0.5 mm, 0.5–1 mm, 1–2 mm, and 2–5 mm. Based on the material gradation characteristics, the original grading was optimized using a combination of the equal-amount replacement method and the elimination method, aiming to minimize the impact of scale reduction on grading properties. The scale reduction process involved two steps: first, the similar grading method was applied to reduce the scale by two-thirds; then, the equal-amount replacement method was used to further reduce the scale to a maximum particle size of 5 mm. Following the screening test and gradation curve fitting, the uniformity coefficient was determined to be 5.38, and the curvature coefficient was 1.13. The grading curves of the test materials before and after scale reduction are shown in Figure 1a,b.
Industrial #15 white mineral oil (manufactured by Morunke Company, Shanghai, China) and isomeric dodecane (from Chukyo Company, Nagoya, Japan) were selected as pore fluids and mixed in a volume ratio of 5:1, based on the refractive index calculation method outlined in the literature (Aminabhavi, 1984) [15]. The resulting mixture is a colorless and transparent liquid at room temperature (25 °C). The refractive index of the mixture, measured using an Abbe refractometer, is 1.458. After being mixed with fused quartz particles, the mixture exhibits good transparency, as shown in Figure 2.
When preparing transparent soil, we first weigh each component according to the accurate mass ratio, and then fully mix it by mechanical mixing until there is no visible stratification in the mixture. In the filling process, the method of combining layered laying and light vibration-assisted compaction is adopted to ensure that the thickness of each layer is consistent, so as to effectively reduce the non-uniformity of density distribution.
(2)
Grouting slurry
In the transparent soil grouting test, the slurry displaces the pore-filling mineral oil under pressure. However, water released from the slurry can alter the refractive index of the transparent soil, thereby affecting the accuracy of visual monitoring of the slurry front movement. Therefore, in this model test, a stable slurry with a low water separation rate was selected as the grouting material (Zhang et al., 1991) [16]. The mass ratio of the stable slurry components was water/cement/superplasticizer/bentonite = 0.7:1:0.005:0.015, with a measured water separation rate of 3% after 2 h.

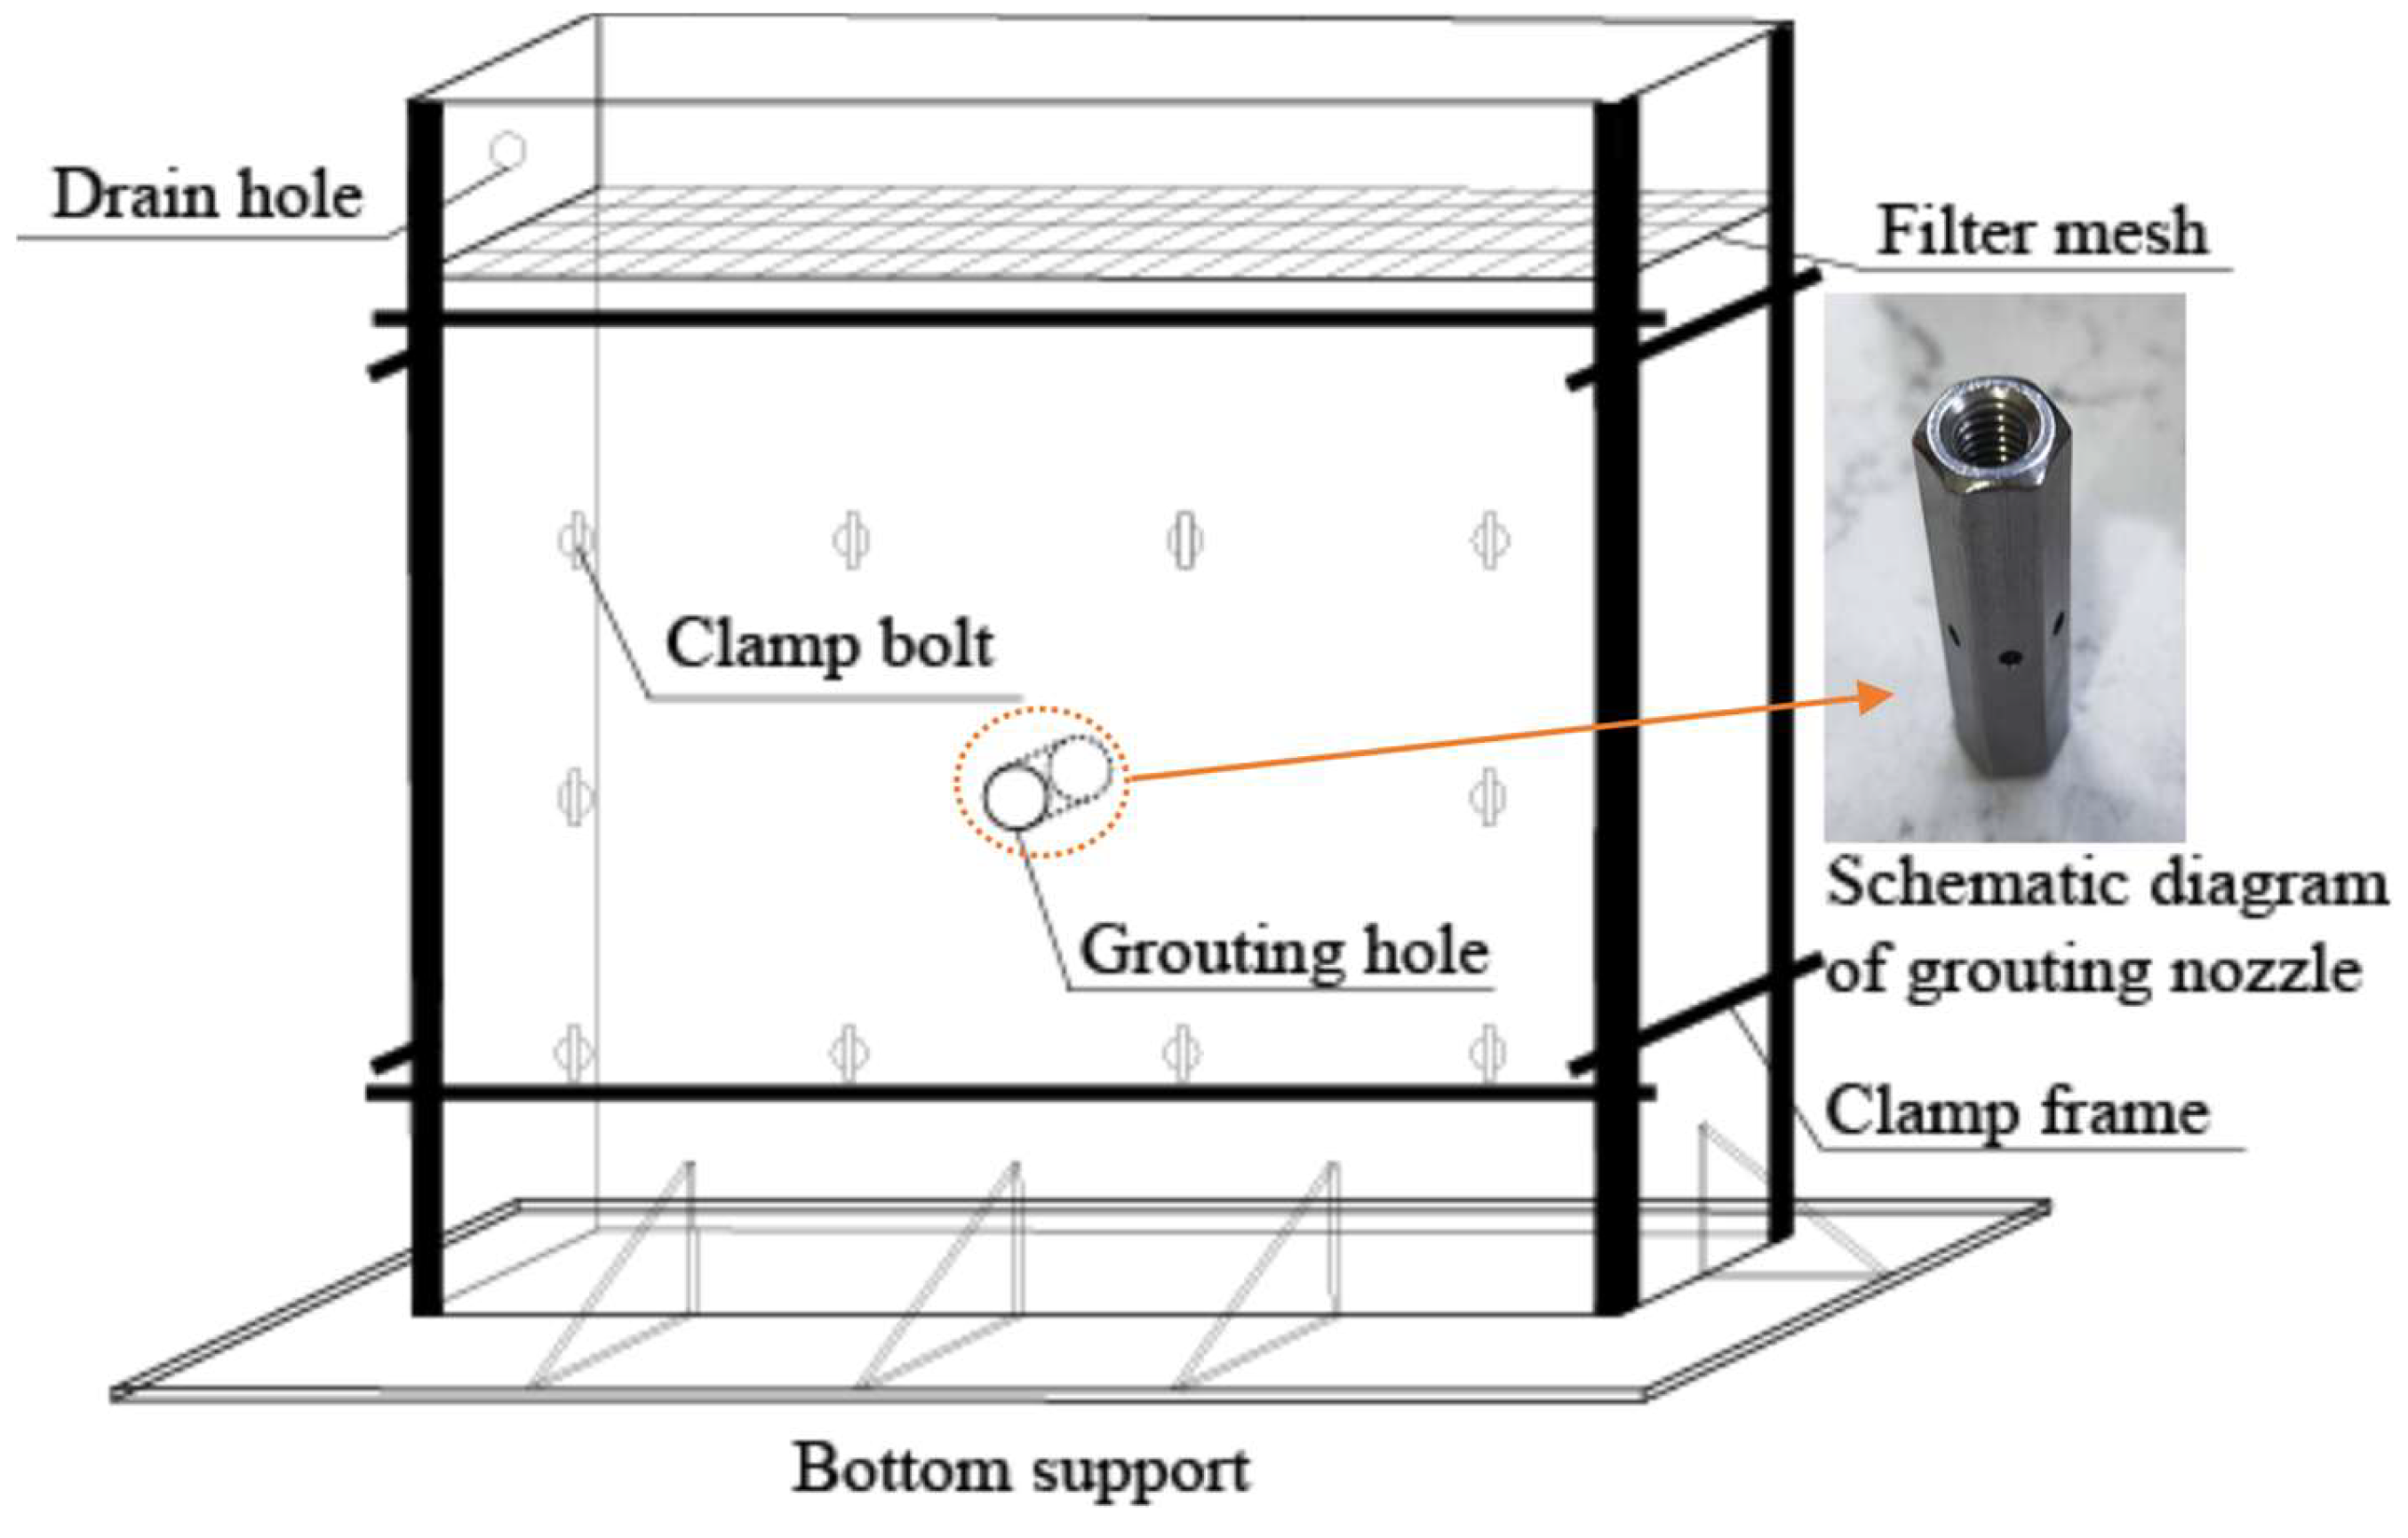
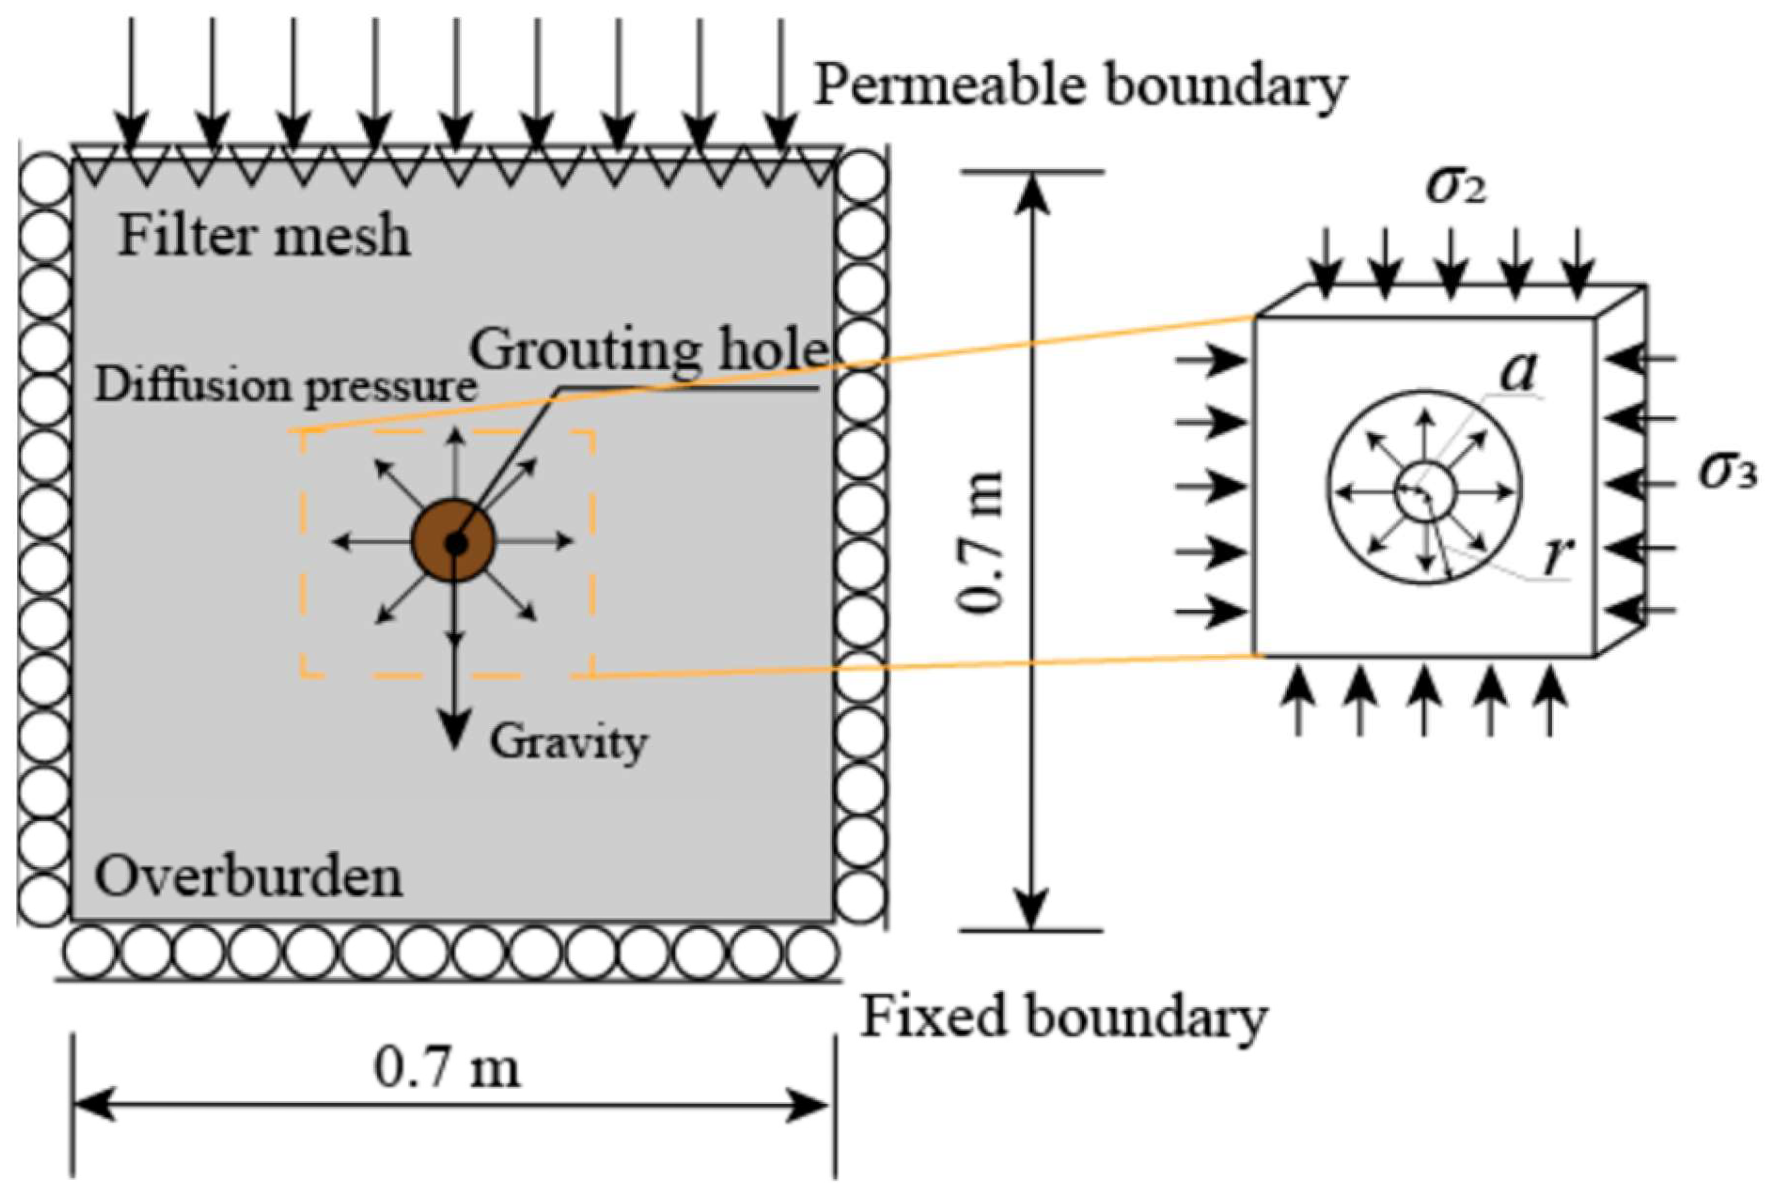
2.2. Transparent Test Chamber

Considering the boundary effects in the model test, a preliminary grouting test was conducted to determine the slurry diffusion distance, d, as 130 mm, aiming to minimize the boundary-induced interference in the diffusion process. Accordingly, the length and width of the grouting model box were set to 700 mm (>5 d), and the thickness to 80 mm, considering the space requirements for laser irradiation and transparent soil filling. The model box was constructed using acrylic glass. To enhance the overall strength of the model box and ensure its stability and sealing under varying grouting pressures, a clamp frame was installed around the exterior. The frame consisted of four ∠30 × 4 mm angle steel columns, welded perforated plates, and was clamped together using 12 long bolts. A 3 mm thick rubber pad was placed between the frame and the model box to provide cushioning. The structure of the model box is illustrated in Figure 3.
Due to the wide particle size distribution of the cover layer, with maximum particle sizes exceeding 1 m, conducting indoor grouting tests using prototype materials would present insurmountable challenges in model box construction, sample preparation, test control, and result accuracy, while also significantly increasing costs. In this study, a geometric scaling method was adopted for test design, with a similarity ratio SL = 10 (i.e., a model size of 0.7 m corresponding to a prototype of 7 m), to simulate the slurry diffusion characteristics in real-world cover layers. The current scale model primarily satisfies geometric similarity and partial physical similarity. However, due to the small size of the model, slurry diffusion may be more significantly influenced by boundary effects and wall friction—especially near the boundaries, where atypical diffusion patterns are more likely to form. In addition, the model does not fulfill mechanical similarity requirements (such as stress fields and fluid inertia effects).
Although the geometric scale method can bring convenience to the research, it is undeniable that different physical quantities cannot meet the similarity criteria at the same time (such as the gravity, slurry viscosity, and geometric scale ratio are different in this test). In addition, in the grouting test, minor factors such as the surface tension and particle roughness of the slurry under small size may dominate the slurry diffusion results. On the other hand, if the small error of the model is scaled up, it may lead to the deviation of the prototype prediction. Therefore, the experimental study in this paper is limited to the analysis of the diffusion pattern of slurry and the rule of visual flow in the overburden layer, and does not involve the influence of the size scale effect of the grouting model. The influence of the model scale effect on slurry diffusion will be the focus of the follow-up research.

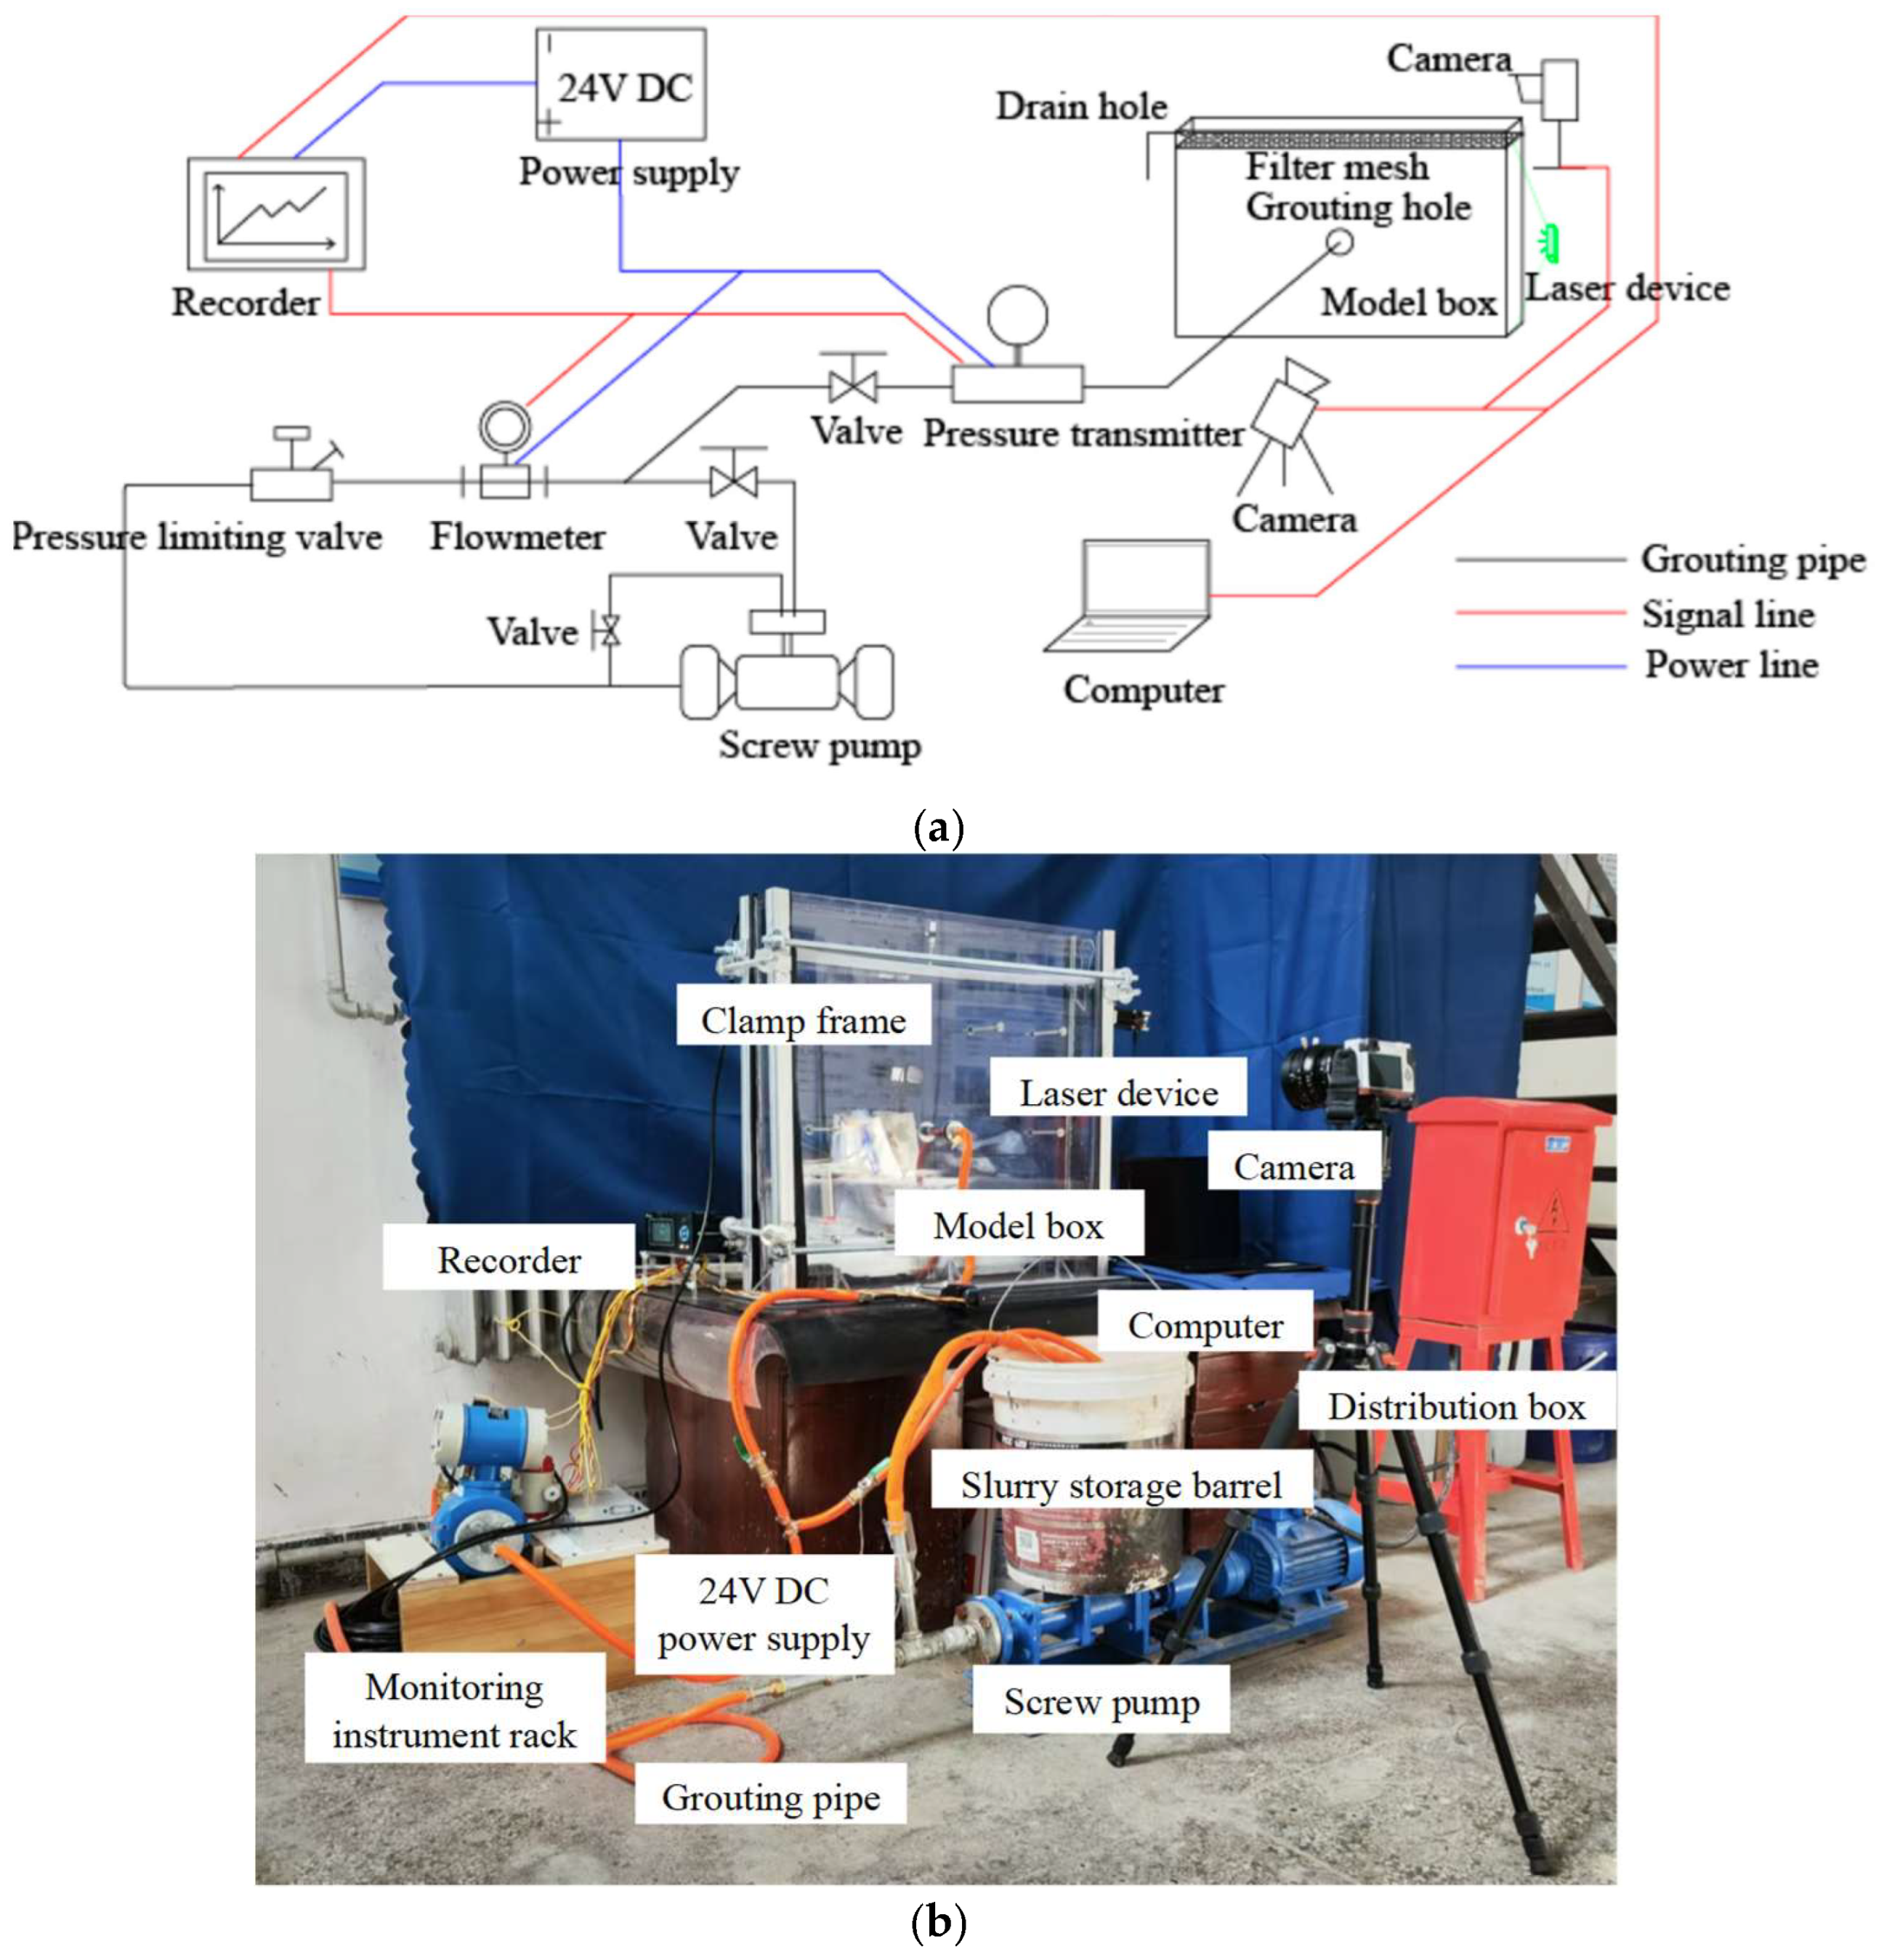
2.3. Information Monitoring System

The information monitoring system comprises two components: data acquisition and digital image capture. The data acquisition unit includes a pressure transmitter, an electromagnetic flowmeter, and a data recorder. The system collects real-time data on pipeline pressure and grouting volume, and controls grouting pressure dynamically by adjusting the grouting valve. The digital image capture unit consists of a camera and a laser transmitter, utilizing a 2500 mW green laser generator. During the test, the camera was positioned perpendicular to the laser axis, with the intersection point located in the slurry diffusion zone of the transparent soil. This configuration ensured stable, continuous image capture and provided raw data for the subsequent PIV algorithm.
In order to reduce the measurement error of PIV technology, the same experimental image sequence was processed three times independently, and the key frame results were compared in the preliminary test. The error of the main direction change in the velocity vector field was less than 3°, and the error of velocity amplitude was within ±7%. In addition, in the experiment, we estimated the distance measurement error according to the relationship between image resolution and scale conversion, and compared the measured values with the bolt diameter pixels with a known diameter. In this experiment, the bolt hole diameter was 40 mm, while the measured pixel value was 39.8 mm, and the relative error was 0.5%. Therefore, we believe that the speed and displacement measurement accuracy requirements are basically met.

2.4. Grouting Power Equipment

In the experiment, pure pressure grouting was employed, using a G20-1 single-screw pump (from Haineng Company, Wenzhou, China) as the power source. A double-stage circulating grouting pipeline, connected to the storage tank, was used to ensure a stable power supply for the grouting process. Before grouting, the stable slurry was thoroughly mixed and stored in the tank, with continuous stirring maintained at a uniform speed during the grouting process. The grouting test setup for the transparent soil overlay is illustrated in Figure 4a,b.

3. Grouting Test

3.1. Grouting Pressure Setting

In the cover layer, the grout is usually diffused and reinforced in various forms under different grouting pressures. In order to show a variety of grouting states, it is necessary to first determine the critical splitting stress, so as to facilitate the setting of grouting pressure in the test. Regarding the covering layer as a continuous medium, on the basis of continuum mechanics, we believe that the following: At the onset of grouting, the borehole wall is subjected to the applied grouting pressure. Once this pressure exceeds the initial in situ stress, splitting (fracturing) of the borehole wall occurs. Assuming the cover layer is a homogeneous rectangular prism of uniform thickness, and based on elastic theory, the initial stress around the borehole under an applied grouting pressure p can be expressed as (Chen et al., 2008) [17]:
σ r = σ 2 + σ 3 2 ( 1 η 2 ) + σ 2 σ 3 2 cos 2 θ ( 1 η 2 ) ( 1 3 η 2 ) + p η 2
σ θ = σ 2 + σ 3 2 ( 1 + η 2 ) σ 2 σ 3 2 cos 2 θ ( 1 + 3 η 4 ) p η 2
τ r θ = σ 2 σ 3 2 sin 2 θ ( 1 η 2 ) ( 1 + 3 η 4 )
In the formula: η = a / r , a is the drill hole radius, r is the slurry diffusion radius; σ r , σ θ , and τ r θ are the radial, circumferential, and tangential stresses of the slurry diffusion body, respectively; σ 2 and σ 3 are the second and third principal stresses, respectively; θ is the clockwise deflection angle; and p is the grouting pressure. When shear failure occurs, according to the Mohr–Coulomb failure criterion, the critical splitting stress σ θ satisfies:
σ θ = 3 σ 3 σ 2 p
When the hoop stress σ θ σ t ( σ t , the tensile strength of the transparent soil) is applied, the cover layer at the borehole wall will experience cracking. Combined with the test parameters of the model box and the strength data of the transparent soil, the critical splitting stress in the grouting test is 9.37 kPa, which can be solved by substituting Equation (4). To prevent the grout from breaking through the transparent soil too quickly, a stepped grouting pressure is set up during the experiment to show changes in the grout diffusion pattern at each level until the grout breaks through the top surface of the transparent soil and stops grouting. Considering that the organic glass of the model box breaks when the pre-test grouting pressure reaches 300 kPa, the stepped grouting pressures are set at 50 kPa, 100 kPa, and 200 kPa. To form a high-quality scattering surface within the transparent soil and reduce interference from the grout diffusion process on laser imaging, this experiment chooses to drill horizontally. The mechanical concept diagram for the grouting test is shown in Figure 5.

3.2. Test Process

The main procedures for conducting the transparent soil grouting test are as follows: (1) Preparation of transparent soil materials: Prepare a sufficient quantity of transparent soil according to the method described in Section 2.1. (2) Inspection of grouting pipeline and sensors: Ensure that all valves in the grouting pipeline are open and properly sealed. Check the integrity of the signal cables for all sensors to confirm there is no damage. (3) Laser setup: Turn on the laser and adjust its power and incidence angle to generate a high-quality speckle field. Ensure that the laser sheet, the centerline of the model slot, and the grouting axis are properly aligned to guarantee effective laser projection. (4) Pressure valve adjustment: Adjust the pressure-limiting valve to control the maximum grouting pressure in the pipeline and maintain pressure stability. (5) Image acquisition setup: Adjust the image capture device to ensure high-quality imaging of the observation surface. Firmly attach a ruler to the surface of the model slot to aid in the calibration and identification process during transparent soil image analysis. (6) Slurry preparation: Prepare the stable slurry according to the specified mix ratio. Stir thoroughly, transfer to the storage tank, and configure the return slurry pipeline. (7) Start data recording: Activate the timed shutter switch to begin recording the entire grouting process. (8) Pressure ramp-up grouting: Close the return valve and open the grouting valve to initiate the formal grouting process. To prevent early overflow of slurry at the transparent soil surface and to clearly visualize the diffusion process, the pressure increase is divided into three stages: 50 kPa, 100 kPa, and 200 kPa. Pressure is applied continuously until it reaches 50 kPa, maintained for 50 s, then increased to 100 kPa for 100 s, and finally to 200 kPa for another 100 s. At each stage, ensure the grouting rate remains below 2 mL/s for at least 30 s. The total grouting duration is 300 s.

4. Result Analysis

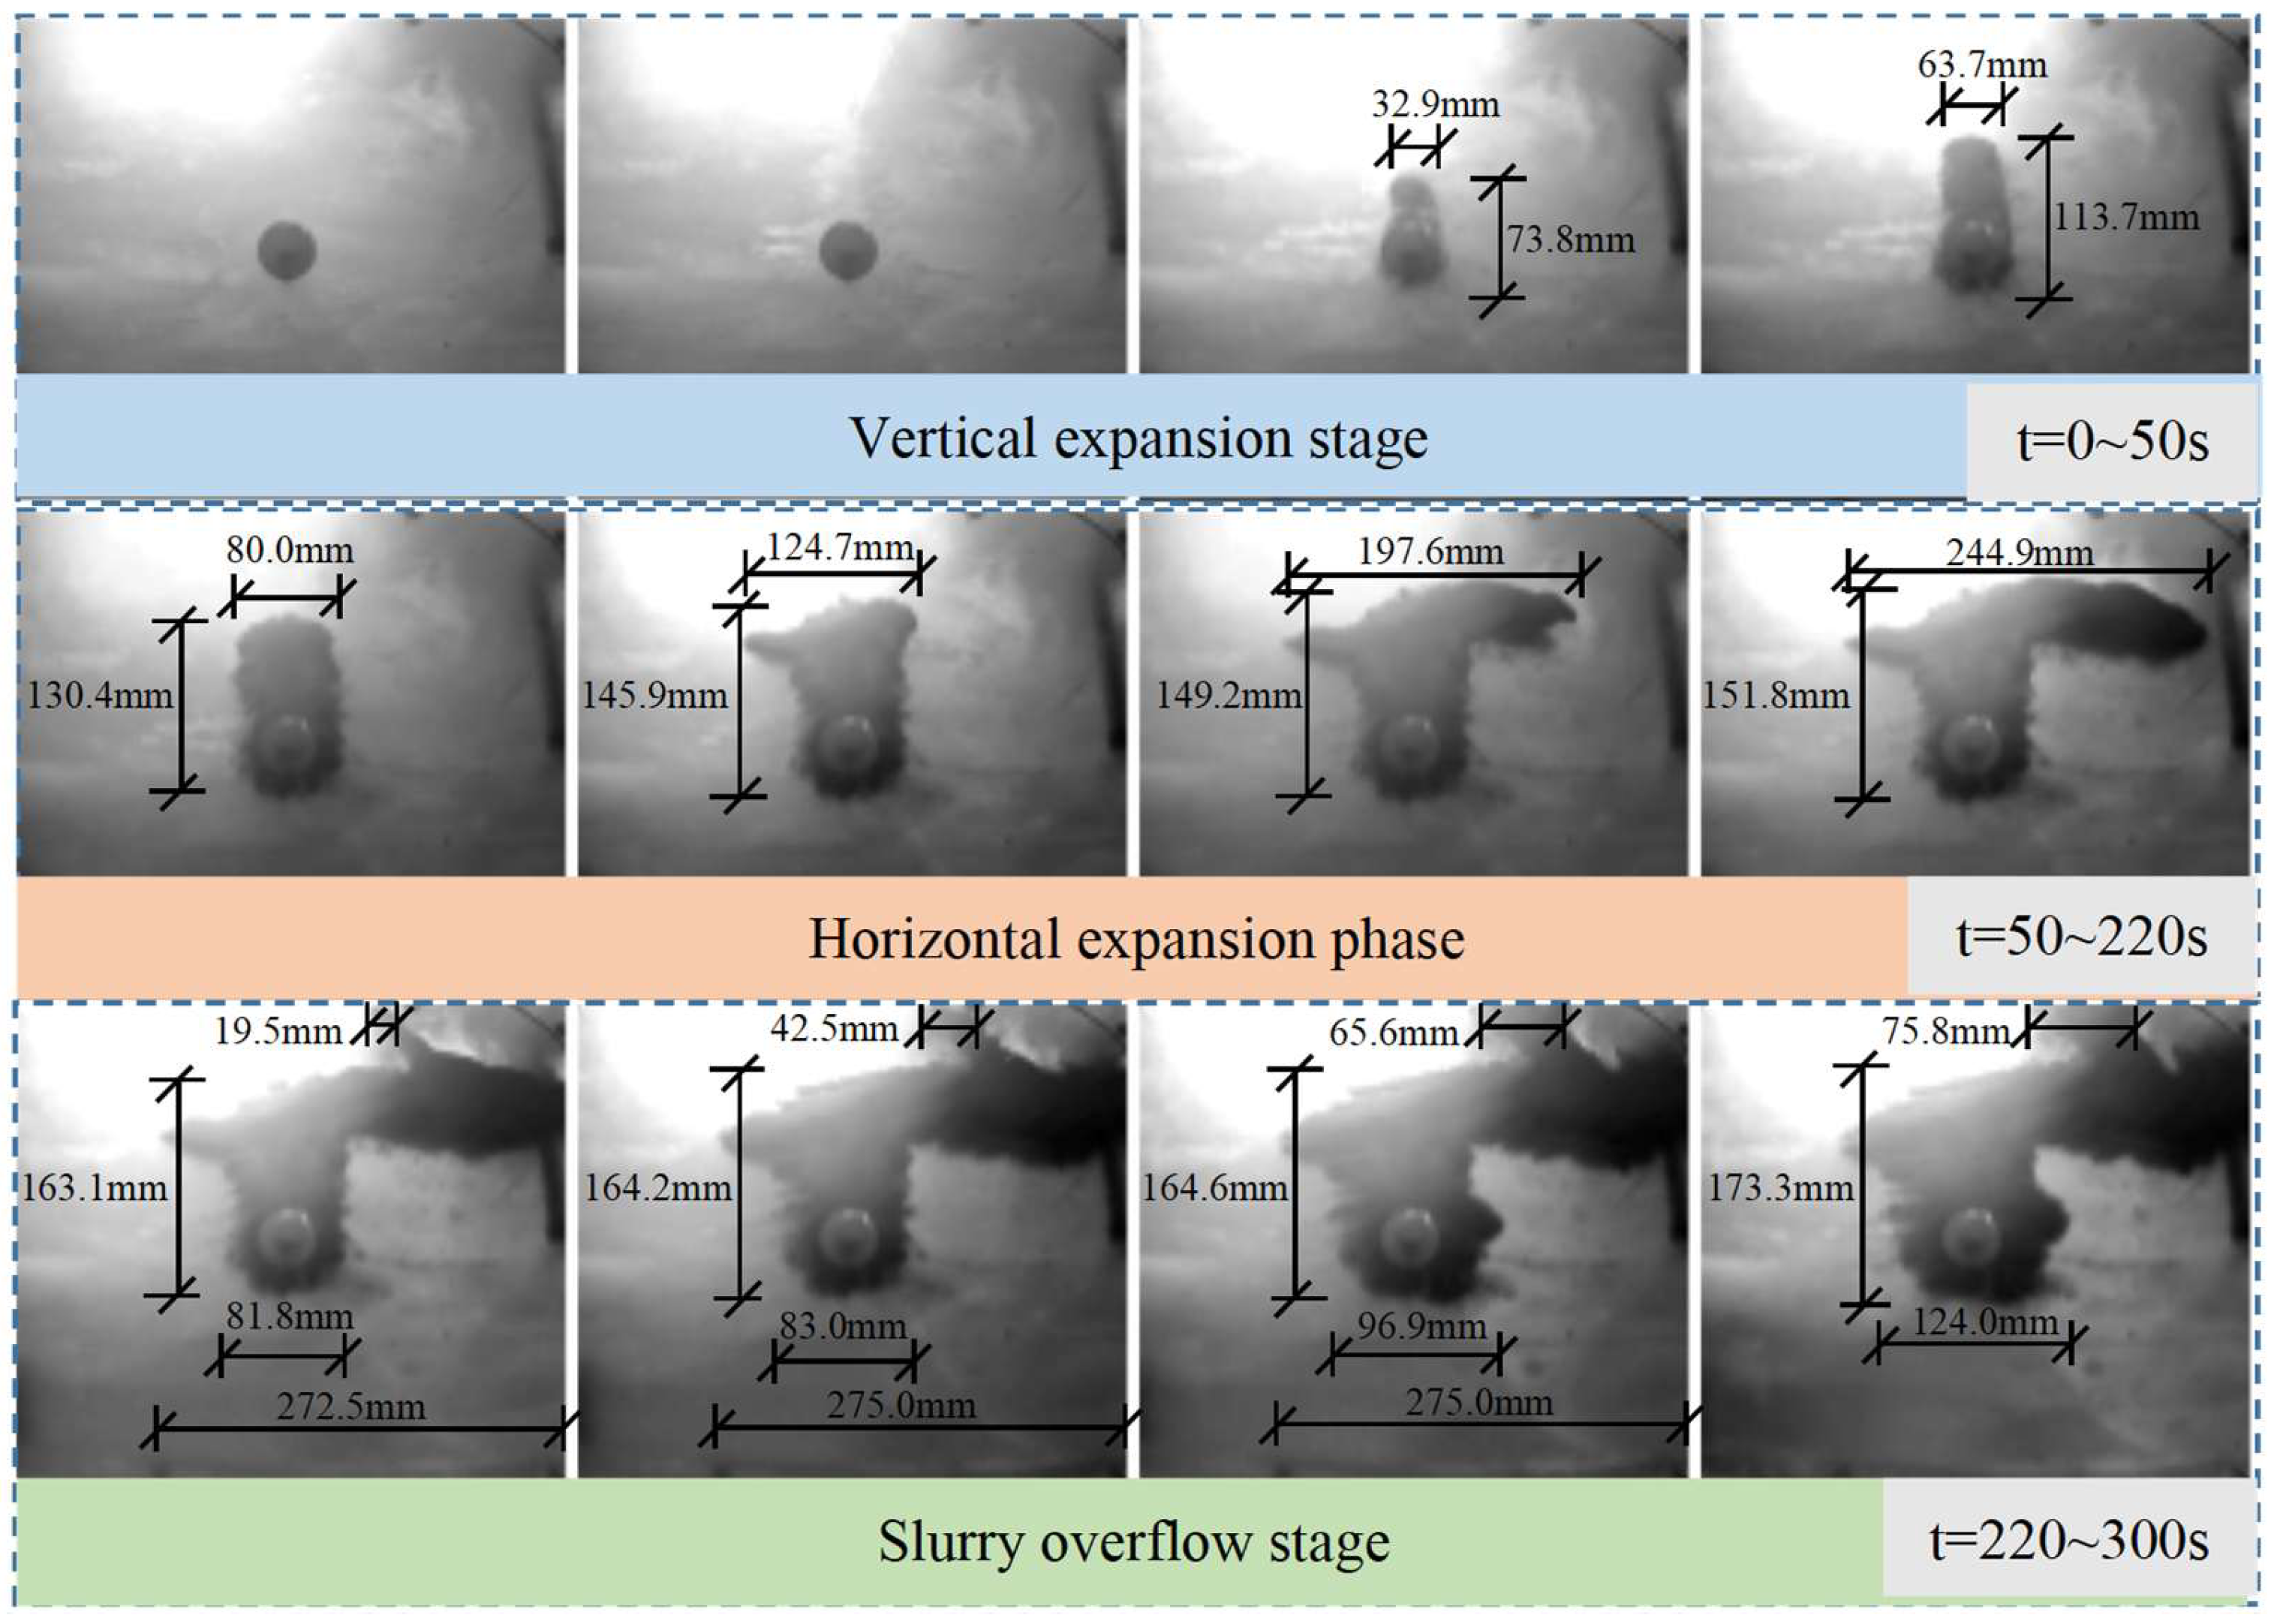
4.1. Analysis of Slurry Diffusion Pattern

The emergence and continuous advancement of digital image processing technology have enabled real-time, non-destructive deformation measurements in indoor geotechnical testing. By recording the grouting test and applying image binarization, the diffusion pattern of grout over the entire process was visualized. Based on the diffusion characteristics of the grout, the grouting process is divided into three stages, as illustrated in Figure 6: (1) Vertical expansion stage (t = 0–50 s): With the opening of the grouting valve, due to the relatively small constraints on the upper side and bottom of the model box, the slurry diffuses upward at the grouting hole to form a rectangular slurry shape, which conforms to the law of slurry diffusion along the weak surface of the formation. At this stage, the width of the slurry vein near the grouting hole reaches 63.7 mm; (2) Horizontal expansion stage (t = 50–220 s): When the height of the rectangular slurry vein reaches 145.9 mm, constrained by the pore fluid plate on the top of the model box, the continuous upward expansion trend of the slurry is hindered by the top, and gradually extends to the weaker right area to form a horizontal expansion shape. The overall slurry vein presents a “Γ” shape, but the slurry has not yet broken through the top surface of the transparent soil; (3) Slurry overflow stage (t = 220–300 s): In this final stage, the overall shape of the grout veins remained largely unchanged, but they continued to expand laterally, exhibiting quasi-static diffusion via osmotic action. By 240 s, leakage points appeared at the top surface of the transparent soil. During this phase, the diameter of the cylindrical grout veins at the injection points increased significantly from 81.8 mm to 83.0 mm, 96.9 mm, and 124.0 mm. Concurrently, the width of the slurry overflow outlet at the top surface expanded from 19.5 mm to 42.5 mm, 65.6 mm, and 75.8 mm.

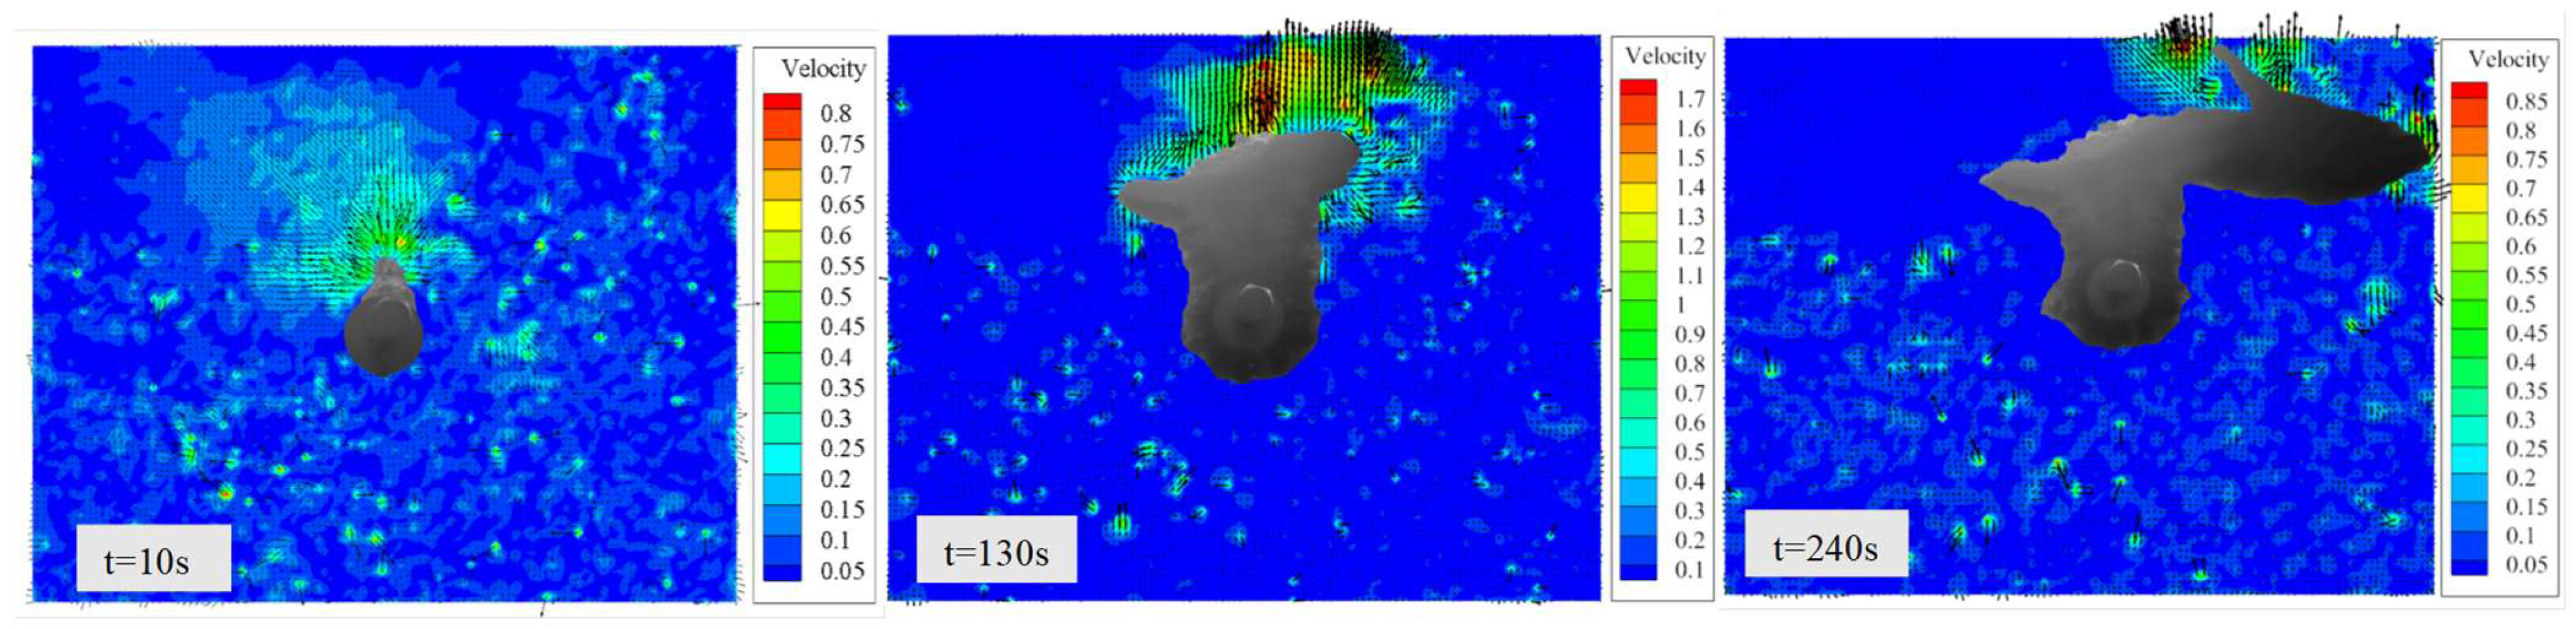
4.2. Analysis of Transparent Soil Velocity Field

Particle Image Velocimetry (PIV) technology offers the advantages of being transient, multi-point, and non-contact. This study utilizes PIV to analyze the instantaneous velocity field characteristics of transparent soil during the grouting process. Representative results are presented in Figure 7: (1) Grouting time t = 10 s: As the grouting pressure gradually increases to 50 kPa, the pump transmits pressure to the slurry. Under the combined influence of pressure and formation resistance, the slurry exhibits upward splitting and spreading behavior. The maximum velocity of the transparent soil occurs at the leading edge of the slurry front, reaching 0.80 mm/s. Densification of the surrounding soil is observed along the expansion direction. (2) Grouting time t = 130 s: With the continuous expansion of the main slurry vein, the transparent soil around the slurry front presents a state of compaction to the outside. The highest velocity remains at the top of the grout front, reaching 1.70 mm/s. A rightward expansion trend is also observed; the observed asymmetric diffusion results are more likely attributable to microstructural self-organization effects or local pathway variations inherent to the random medium. (3) Grouting time t = 240 s: The slurry continues to expand horizontally toward the right and forms a fracture channel through the top of the transparent soil at the right side of the model box, resulting in slurry overflow. The velocity of the transparent soil near the outlet reaches 0.85 mm/s. Notably, PIV technology provides intuitive advantages for observing the forms of slurry splitting and compaction-induced diffusion, as well as for predicting the resulting movement trends of the soil strata. In this experiment, the splitting behavior observed in transparent soil grouting can be summarized as follows: Under continuous grouting pressure, the slurry initially compacts the surrounding transparent soil and forms a splitting channel. The slurry then occupies the channel and continues to propagate outward along the grout vein. Therefore, the diffusion mode of the slurry in this experiment is primarily governed by splitting, with supplementary effects from permeation-induced compaction.

5. Discussions

Compared with traditional grouting test methods (Yu et al., 2023) [18], where the diffusion distance and morphology of the grout can only be assessed after the process is complete and the grout has solidified (Niu et al., 2020) [19], dynamically display the diffusion shape and the movement of the grout front in real time. Therefore, transparent soil grouting tests offer significant advantages for investigating grout diffusion mechanisms in cover layers. Although the preliminary test results are obtained through the transparent soil grouting test, there are still some problems in the research:
Transparent soil experiments are typically conducted at a reduced scale (Feng et al., 2023) [20]. Boundary and scale effects have consistently posed challenges in transparent soil testing. It is difficult to fully satisfy the third law of similarity in all aspects of the test, inevitably resulting in similarity errors (Feng et al., 2023) [20]. Nevertheless, conducting experiments under conditions that satisfy the primary similarity criteria can still achieve the intended research objectives. In this study, the model box was designed with dimensions five times the slurry diffusion distance observed in pre-experiments, aiming to minimize boundary effects. Unlike Cao et al. [21] (2014) who used a small cylindrical plexiglass model container with a size of 180 mm × 180 mm and a height of 265 mm, this paper introduced a large model box with a size of 700 mm × 700 mm × 40 mm to more accurately capture the spatial diffusion characteristics of slurry in the overburden. In contrast, Hu et al. [11] (2024) ignored the influence of model boundary on slurry morphology in their simulation, and their model box design did not consider the sensitivity of mixed oil transparency to temperature changes, which may lead to a decrease in visibility of transparent soil. In addition, Hu [11] did not consider the water precipitation effect of cement slurry in the grouting test. Due to the water analysis caused by the particle settlement of slurry in the setting process, the additional water will reduce the visibility of transparent soil, thus affecting the accurate judgment of the slurry expansion process in the model box. On the other hand, most previous studies (such as Feng et al., 2023 [20]) used uniform particle-size particles to simulate the overburden, ignoring the effect of particle gradation in natural soil on grouting behavior, which may lead to misjudgment of slurry diffusion in actual projects. In this paper, through the configuration of transparent soil and the introduction of the actual particle size distribution, to explore and simulate the flow law of slurry in the complex pore channel closer to the actual working condition. Thus, the experimental results are closer to the field conditions, and the engineering applicability of the study is improved. Although Que et al. [22] (2024) used a similar visualization method in the study of transparent soil grouting, the flow medium they used was tracer materials such as water flow or dye flow, which failed to reflect the real flow characteristics of the slurry. In order to more accurately simulate the diffusion behavior of Bingham fluid in the overburden, a slurry with a low water separation rate and high stability is selected in this paper. Compared with ordinary cement slurry or dyeing water flow, the grouting material selected in this paper has more obvious advantages in visual effect and authenticity of flow behavior.
Although Gao et al. [12] (2016) used similar PIV technology in the study of the grouting diffusion model, the grouting pressure range in their test was small (60 kpa), and the effect of hole wall constraint on diffusion morphology was not considered. In this paper, systematic tests are carried out under a wider range of pressure gradients (0–200 kpa), and the boundary conditions are more strictly controlled. In addition, most existing studies (such as Wang et al. [23], 2016; Fan et al. [24], 2024) focus on the final diffusion form of grouting, but pay less attention to the dynamic evolution in the diffusion process. In contrast, through continuous image acquisition and time-series analysis, this paper reveals the unstable evolution process of the slurry flow front, which provides a more comprehensive time-domain perspective for the understanding of the diffusion mechanism. It is worth noting that under the model box pressure set in this study, the slurry diffuses in a “Γ” shape, and its asymmetric shape can be derived from the self-organization effect of microstructure or the local path difference in random media. When the slurry forms a dominant flow in a certain direction, it often continues to expand along the path, showing a certain randomness in the flow direction. This phenomenon reflects the microstructure difference of the medium, rather than the artificial layout deviation on a large scale.
During the experiment, to facilitate the outflow of pore fluids, the top of the model box was designed as a permeable boundary that prevents sand migration, thereby creating a boundary condition different from the fixed sides and bottom. Additionally, due to limitations in the structural strength of the model plates and the sealing performance of the interface bolts, complete sealing could not be achieved, imposing an upper limit on the internal grouting pressure. Due to the material strength of the acrylic model box, the top was not fully closed during the test, but a pressure boundary was set. This causes the slurry to diffuse upward along the weak part under the action of pressure difference, which conforms to its basic diffusion characteristics. In addition, it should be pointed out that the model is more suitable for revealing the evolution trend and mechanism of the diffusion process than for accurately predicting the numerical results at the actual engineering scale. This paper focuses on the preliminary exploration of the diffusion behavior of single-hole grouting under typical working conditions. The test is based on a single condition, and systematic repeated tests have not been carried out to verify the universal repeatability of the diffusion pattern. The current results only represent a representative diffusion form under the test conditions. In the future, a series of repeated tests will be carried out in combination with different grouting pressure conditions, particle grading types, and random initial structures to further verify and expand the scope of application of the diffusion form, and to further explore the diffusion form and mechanism of grout in the overburden. Therefore, the conclusions drawn in this study are primarily intended to reflect the trends and mechanistic characteristics of grouting behavior. For practical engineering applications, these findings still require validation through field experiments and large-scale numerical simulations.

6. Conclusions

(1)
This study selects transparent soil materials capable of simulating the cover layer and designs a visual testing apparatus for grouting simulation within the cover layer. The results demonstrate that the transparent soil, in combination with the model box, offers a clear observation window for grouting, providing superior visualization and intuitiveness compared to traditional grouting tests. This facilitates detailed observation of grout flow dynamics and diffusion patterns within the cover layer. The use of transparent soil materials for analyzing grout diffusion in cover layers is thus demonstrated to be feasible.
(2)
A non-contact monitoring method for grout diffusion in cover layers, based on transparent soil materials and stable slurry, has been developed. Based on digital image technology, this method allows for real-time monitoring of grout diffusion patterns. This visual testing approach overcomes the limitations of traditional contact-based methods and provides significant advantages for continuous observation and dynamic characterization of grout diffusion morphology throughout the grouting process.
(3)
Based on a self-developed transparent soil visual grouting model device, a stepwise pressure grouting test was conducted to investigate the slurry diffusion morphology and the velocity field distribution characteristics of transparent soil under varying grouting pressures. Preliminary observations indicated that the splitting of the formation was accompanied by a compaction process during the grouting procedure. This device provides a valuable reference for the design of similar cover layer grouting test systems and for further research on visualized slurry diffusion.
(4)
In this transparent soil test, the grouting experiment was carried out under the condition of a large scale. The stable grout was used to implement single-hole pressure grouting, and the diffusion law of grout under the condition of step pressure was obtained. In view of the fact that multiple rows of porous grouting are mostly used in the grouting project of the overburden, based on this study, porous grouting tests can be carried out in the future by improving the structural strength and sealing performance of the model box, and the influence mechanism of pore sequence on the slurry diffusion behavior can be discussed in depth, so as to provide a reference for the formulation of the construction sequence and pressure control strategy of porous grouting.

Author Contributions

Writing—review & editing, P.G.; Writing—review & original draft, W.Z. All authors have read and agreed to the published version of the manuscript.

Funding

This research was funded by Doctoral Student Innovation Fund of China Institute of Water Resources and Hydropower Research, grant number BS202302. And The APC was funded by Special scientific research project of China Institute of Water Resources and Hydropower Research, grant number EM0145B022021.

Institutional Review Board Statement

Not applicable.

Informed Consent Statement

Not applicable.

Data Availability Statement

The original contributions presented in this study are included in the article. Further inquiries can be directed to the corresponding author. The data are not publicly available due to privacy.

Conflicts of Interest

The authors declare that they have no known competing financial interests or personal relationships that could have appeared to influence the work reported in this paper.

References

  1. Xia, T.; Zhen, S.A.; Ren, Y.; Han, D. Comparison of hydropower development degrees of key countries and regions in the world. J. Hydroelectr. Eng. 2022, 41, 1–11. [Google Scholar] [CrossRef]
  2. Meshkabadi, K.; Zandi, Y. The Effects of Grout Curtain Parameters on Uplift and Piping Phenomenon; Case Study: Sattarkhan Dam. Hydrology 2019, 6, 71. [Google Scholar] [CrossRef]
  3. Ruan, W. Research on diffusion of grouting and basic properties of grouts. Chin. J. Geotech. Eng. 2005, 27, 69–73. [Google Scholar]
  4. Geng, P.; Lu, Z.K.; Ding, T.; Quan, Q.L.; Yan, Q.X. Research on the dynamic process simulation of rock grouting based on particle flow. J. Railw. Eng. Soc. 2017, 34, 34–40. [Google Scholar]
  5. Fu, P.; Qin, P.F.; Wang, C.; Yang, X.D. Design of grouting parameters in rock based on grouting time. Chin. J. Geotech. Eng. 2014, 36, 1808–1813. [Google Scholar] [CrossRef]
  6. Hu, S.; Liu, Q.; Li, S.; Sang, H.; Kang, Y. Advance and review on grouting critical problems in fractured rock mass. Coal Sci. Technol. 2022, 50, 112–126. [Google Scholar]
  7. Kong, G.Q.; Sun, X.J.; Xiao, Y.; Zhao, H.H. Comparative experiments on compressive deformation properties of transparent soil and standard sand. Chin. J. Geotech. Eng. 2016, 38, 1895–1903. [Google Scholar] [CrossRef]
  8. Wang, Z.; Li, C.; Ding, X.M. Application of transparent soil model tests to study the soil-rock interfacial sliding mechanism. J. Mt. Sci. 2019, 16, 935–943. [Google Scholar] [CrossRef]
  9. Sanvitale, N.; Bowman, E.T. Internal imaging of saturated granular free-surface flows. Int. J. Phys. Model. Geotech. 2012, 12, 129–142. [Google Scholar] [CrossRef]
  10. Hunter, R.P.; Bowman, E.T. Visualisation of seepage induced suffusion and suffosion within internally erodible granular media. Géotechnique 2017, 68, 918–930. [Google Scholar] [CrossRef]
  11. Hu, H.X.; Xie, Z.L.; Gan, B.Q.; Lu, Y.F.; Deng, C. Basic properties of transparent sand and its application to grouting model test. J. Water Resour. Water Eng. 2024, 35, 179–186. [Google Scholar] [CrossRef]
  12. Gao, Y.; Wang, D.L. Transparent soil experiment study on chemical grouting prevention and control for secondary water inflow occurred in mine shaft. Coal Sci. Technol. 2016, 44, 194–199. [Google Scholar] [CrossRef]
  13. Liu, T.F.; Wu, Y.D.; Zhou, Y.F.; Liu, J. Experimental study on disturbance deformation of soil sampler penetration based on transparent clay. J. Hohai Univ. (Nat. Sci.) 2024, 52, 77–83. [Google Scholar] [CrossRef]
  14. GB/T 50123-2019; Standard for Geotechnical Testing Method. Standardization Administration of China: Beijing, China, 2019.
  15. Aminabhavi, T.M. Use of mixing rules in the analysis of data for binary liquid mixtures. J. Chem. Eng. Data 1984, 29, 54–55. [Google Scholar] [CrossRef]
  16. Zhang, J.J.; Liu, J.C. Study on grouting performance of low water content stable cement slurry. Water Resour. Hydropower Eng. 1991, 52–56. [Google Scholar] [CrossRef]
  17. Chen, M.; Jin, Y.; Zhang, G.Q. Rock Mechanics of Petroleum Engineering; China Science Press: Beijing, China, 2008. [Google Scholar]
  18. Yu, Y.Q.; Zhang, C.X.; Zhang, J.Y.; Fan, L.D.; Tang, J.Z.; Su, Z.H. Experimental study on the diffusion law of sand medium grouting. Metal Mine 2024, 66–74. [Google Scholar] [CrossRef]
  19. Niu, J.; Li, Z.; Gu, W.; Chen, K. Experimental study of split grouting reinforcement mechanism in filling medium and effect evaluation. Sensors 2020, 20, 3088. [Google Scholar] [CrossRef] [PubMed]
  20. Feng, Y.; Chen, Y.-M. Experimental study on water gushing-sand bursting in shield tunnels based on transparent soil. Tunn. Constr. 2023, 43, 75. [Google Scholar] [CrossRef]
  21. Cao, Z.H.; Kong, G.Q.; Liu, H.L.; Zhou, H. Model tests on pipe pile penetration by using transparent soils. Chin. J. Geotech. Eng. 2014, 36, 1564–1568. [Google Scholar]
  22. Que, Y.; Weng, B.; Cai, S.L.; Liu, J.Y. Analysis of preferential flow migration in unsaturated transparent soil. Rock Soil Mech. 2022, 43, 857–867. [Google Scholar] [CrossRef]
  23. Wang, Q.; Wang, S.; Sloan, S.W.; Sheng, D.; Pakzad, R. Experimental investigation of pressure grouting in sand. Soils Found. 2016, 56, 161–173. [Google Scholar] [CrossRef]
  24. Fan, K.; Sun, W.; Li, Z.R.; Feng, X.L.; Wang, S.Y.; Chen, C.; Jiang, M.G. Study on diffusion mode and distance influence mechanism of chemical grout grouting in moraine soil. Met. Mine 2024, 89–93. [Google Scholar] [CrossRef]
Figure 1. Grading characteristics of transparent soil particles: (a) Basic particle size of fused quartz sand. (b) Schematic diagram of particle skeleton distribution.
Applsci 15 07854 g001
Figure 2. Transparent soil material configuration process.
Applsci 15 07854 g002
Figure 3. Schematic diagram of the transparent soil grouting model box.
Applsci 15 07854 g003
Figure 4. Schematic diagram of grouting test device for transparent soil cover: (a) Grouting test line connection diagram. (b) Field assembly dia.
Applsci 15 07854 g004
Figure 5. Mechanical concept diagram of the grouting test.
Applsci 15 07854 g005
Figure 6. Schematic diagram of the diffusion transport of the slurry front.
Applsci 15 07854 g006
Figure 7. Transparent soil velocity fields at different times (mm/s).
Applsci 15 07854 g007
Table 1. Basic physical and mechanical parameters of transparent soil particles.
Particle Specific Gravity
d s
Maximum Dry Density
ρ max / ( g / cm 3 )
Maximum Void Ratio
e
Minimum Dry Density
ρ min / ( g / cm 3 )
Minimum Porosity Ratio
e
Average Density
ρ / ( g / cm 3 )
Average Porosity Ratio
e
2.301.720.841.500.531.610.685
Disclaimer/Publisher’s Note: The statements, opinions and data contained in all publications are solely those of the individual author(s) and contributor(s) and not of MDPI and/or the editor(s). MDPI and/or the editor(s) disclaim responsibility for any injury to people or property resulting from any ideas, methods, instructions or products referred to in the content.

