Abstract
The design of automobile chassis structures is fundamentally linked to the optimization of mass and structural robustness. While conventional chassis structures predominantly utilize metals, achieving further mass reduction and enhanced rigidity necessitates the adoption of composite sandwich materials, typically comprising carbon fiber-reinforced polymer (C.F.R.P.) laminate skins bonded to an aluminum honeycomb core. This study focuses on presenting a framework methodology for minimizing the mass of a race car chassis by calculating an optimal baseline lamination sequence through the modification of the composite material parameters on either side of the aluminum core, using an optimization algorithm (O.A.), finite element (F.E.) analysis, composite mechanics theory, and failure criteria. Optimal solutions were derived by varying the laminae orientation and sequence parameters under two scenarios: unconstrained and constrained laminae angles. The optimization results indicate that the proposed lamination scheme reduces mass by 12.36 kg (41.66%) compared to the original lamination, with constraints imposed on laminae angles having no significant impact on the ultimate optimal outcome.
1. Introduction
Composite materials are seeing a growing range of numerical, analytical and experimental applications across various engineering disciplines where high stiffness, strength, and reduced structural mass is required [1,2,3,4,5]. Lightweight design methodologies, recognized as essential for developing higher performance, fuel-efficient vehicles [6,7,8,9,10,11,12], are being actively researched by leading automotive manufacturers and suppliers committed to minimizing mass in vehicle structures [5,13]. Among other materials, carbon fiber-reinforced polymers (C.F.R.P.) stand out as the foremost choice for achieving lightweight structural solutions, owing to their superior vibration, fatigue, and corrosion resistance, high specific strength and stiffness, and exceptional energy absorption capabilities [14]. Consequently, CFRP composite structures are widely employed in monocoque chassis designs for racing and high-performance vehicles [15], despite the limitations in manufacturing that hinder cost-effective mass production.
The primary determinant of the performance of composite structures, excluding the factor of the geometry of the structure they are applied to, lies in the final mechanical properties of the C.F.R.P. material after the curing of the matrix, which are affected by factors such as the elastic properties of the individual orthotropic laminae, their orientation angles, and the stacking sequence within the laminate [1,3]. Consequently, achieving an optimal design requires a combinatorial approach to the subject, considering the extensive range of parameters affecting the behavior of the composite under specific thermomechanical loading conditions. Generally, such approaches involve varying the design variables, using advanced computational tools, and performing analysis on the resulting configurations.
To achieve this target, optimization algorithms (O.A.) are usually paired with analytical or numerical models to ensure the accuracy of the computed quantities [16]. Indicative examples of such studies were performed by Le Riche and Haftka (1995) [17], who optimized the stacking sequence of composite laminate plates for maximizing buckling load capacity, and Messager et al. (2002) [18], who focused on determining numerically optimized stacking sequences for a simplified model of an underwater vessel. Also, recently, a single-objective genetic algorithm (G.A.), based on the non-dominant principle, was introduced by Ma et al. (2020) [16] to establish an optimization model for thin wall beams in automotive structures which used constraints such as their cross-sectional stiffness, manufacturability, and cost. Moreover, analogous research from the domain of aeronautical engineering, exemplified by the works of Dinulović et al. (2024) [5] and Milić et al. (2025) [19], further illustrates the potential advancements achievable in structural design through the coupling of these methodologies.
Despite concordance between analytical model outcomes and experimental data, these studies are limited by either the parameters of constituent materials or the simplicity of geometric configurations and load case examined factors that significantly influence composite layer optimization procedure. In this study, analytically determining stress distribution proves challenging, complicating the computation of alternative lamination designs.
In the case of this research, to overcome these problems, the application of optimization routines in combination with the F.E. method was implemented. This decision was derived from the advantages of combining these methods, which included achieving the main objective of the study while saving computational resources and allowing a more thorough examination of a larger portion of the design space to optimize the chassis’ mass through a structured and automated method. Also, while automated routines for investigating alternative designs are well established in various fields, their application to the optimization of layering in composite monocoque chassis constitutes a novel approach. This is because these methods reduce the evaluation time required for different laminations for specific geometries and improve the understanding of the parameters and their interconnections, compared to manual experimentation, which can assess limited numbers of alternative designs at a time, and yield an overall more efficient research method that allows the analysis of more complex alternative designs and future comparisons with experimental data [20].
Despite limited research on the application of analogous methodologies in student automotive design competitions—primarily due to their inherent complexity and the constrained resources available to participants—this study aims to showcase a novel, more structured approach for preliminary design of composite chassis for student race car applications. Additionally, it provides data on the feasibility of employing a genetic algorithm (G.A.) for the monocoque chassis’ optimization, ultimately reaching the objective of establishing a more robust foundation for improved analysis and a deeper understanding of future designs. The Formula Society of Automotive Engineering (F.S.A.E.) competition is a series of racing events organized by the SAE with the participation of engineering student teams across several countries. The main goal of the competition is to motivate university students to apply theoretical knowledge in designing racing cars with specific guidelines. Key factors, including chassis mass and torsional stiffness, are set to be improved as they enhance suspension performance and lap speed. Factors such as the mass and torsional stiffness of the chassis are of particular importance, as they improve the performance of the suspension system and increase the average pace per lap. As a result, the optimal design of an F.S.A.E. racing vehicle’s chassis is achieved mainly through research to achieve improvements in the areas of mass, resistance to deformation, and structural strength.
The primary objective of this study is to present a methodology for the optimization of an F.S.A.E. composite race car chassis, emphasizing mass reduction while maintaining sufficient failure strength. Additionally, the research seeks to investigate the mechanical behavior of the chassis and the advantages of design parameterization in its enhancement. The optimization parameters included the properties of the constituent laminate material, while the loading conditions were derived from a static equivalent scenario of the vehicle’s dynamic operation. Furthermore, comparative analyses were conducted to validate the selection of certain variables, and mesh refinement in the finite element analysis was performed to ensure stress convergence.
Due to the geometric complexity of the analyzed structure, the optimization of its mass necessitates the use of a parameterized F.E. model. In this case, increasing the number of parameters in this model escalates the computational demand for the execution of the algorithm, as more alternative designs require evaluation. In reality, resource constraints, analysis tool limitations, and manufacturing techniques restrict the parameter space based on engineering or exogenous criteria. For instance, while laminated composites theoretically allow continuous variation in layer orientations (0° to 180°), practical applications, particularly outside aerospace engineering, typically see more limited laminae orientations to 0°, 45°, −45°, and 90°, which affects the efficacy of the optimization process. Furthermore, inherent computational analysis flaws, such as rounding errors, cause deviations from analytical solutions, increase the cost of design validation, and complicate decision-making.
Moreover, it is crucial to recognize that the output of optimization routines alone does not guarantee the attainment of the absolute optimal solution; rather, it necessitates the judicious selection of parameter sets to reduce problem complexity and achieve a feasible solution. Consequently, particular attention was devoted to problem simplification during the search for the optimal material parameters by combining the finite element method and genetic algorithm optimization. As a result, the developed F.E. model employed a uniformly adopted lamination scheme in its sub-parts to approximate manufacturing specifications and was subjected to load conditions that simulate the race car’s operation.
Finally, it should be noted that the optimal stacking sequence is dictated by the monocoque’s most heavily loaded region, potentially leading to over-engineering. This issue can be mitigated by subdividing the laminate geometry into smaller local sections to enhance accuracy. However, due to the increased computational demands, which were beyond available resources, this approach was not pursued in the scope of this study.
The first step towards the analysis of the monocoque’s response under loading is the specification of its geometry. During the design phase, considerations of chassis layout emerged, with different designs presenting varying advantages and disadvantages. Consequently, the selection and design of the new chassis type were executed through a meticulous examination of cost, performance, space, and safety-related constraints.
The fabrication of a “hybrid” composite chassis was selected as the optimal choice, as it balances performance, cost, and manufacturing complexity (Figure 1). The primary criteria were achieving higher stiffness and lower mass compared to a spaceframe design and reducing manufacturing costs compared to a full monocoque chassis (Figure 2). Additionally, the autoclave oven’s space limitations for where the structure would be manufactured influenced the decision. Figure 1 summarizes this information, abstractly illustrating the advantages of each criterion, namely rigidity, mass, and manufacturing complexity, to clarify the ranking of alternative chassis designs. The designs are categorized by the extent to which they possess each property; for example, the green bar for the hybrid chassis indicates medium levels of weight, thus its medium length, rigidity, and manufacturing cost, positioning it on the x and z axes for length and height, accordingly.
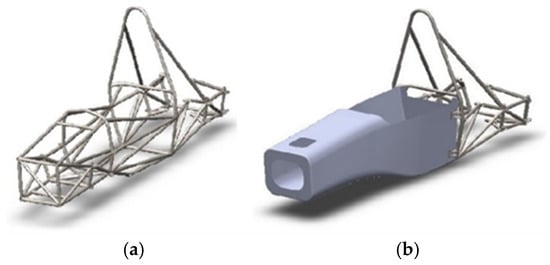
Figure 1.
Examples of different chassis layouts (a) space frame and (b) hybrid.
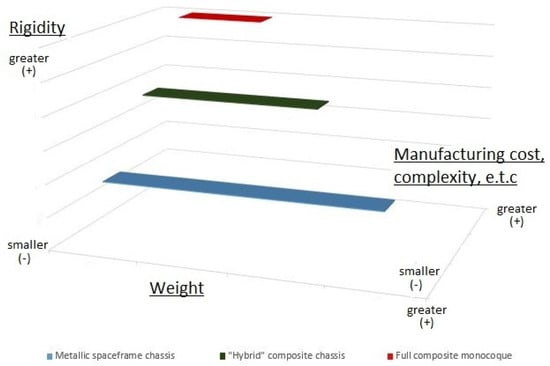
Figure 2.
Ranking of alternative chassis designs.
2. C.F.R.P. Material Analysis
One of the most important goals of structural design is guaranteeing robustness under the application of loads. Due to the large volume of data necessary to construct and solve the problem in its three-dimensional form, the sets of equations are usually reduced to a two-dimensional simplified scheme for plane stress, provided that the lamina under study is considered to be “thin” and does not carry any out-of-plane loads [21]. In most cases, the models of either Love and Kirchhoff, also known as C.L.T., or Reissner and Mindlin, which include the effects of shear deformation, are used in order to compute the behavior of the laminate. Also, additions are made in these existing models in order to include the effects of the residual stresses that develop after the curing of the composite and the effects of moisture absorption [21]. Last but not least, it should be noted that such failure theories have been implemented in the analysis of the CFRP structure.
2.1. Failure Criteria
2.1.1. Tsai–Wu Failure Criterion
One of the most frequently used failure criteria is the quadratic interaction criterion or the Tsai–Wu failure criterion [1]. That criterion, being based on the total strain energy failure theory of Beltrami, possesses the additional advantage of considering the stress interactions between and . Also, its mathematical representation is materialized via a summation of terms, which are exhibited in Formulas (1) and (2) for three-dimensional and plane stress cases [1,18]. The constants () used in the corresponding formula for the three-dimensional stress state are used to express the coupling coefficients, whose value is −1. Finally, for plane stress, the lamina’s strength parameters , , , , , and are calculated experimentally by utilizing the data derived from the tensile, compressive, and shear loading of the lamina.
where
Additionally, as far as the evaluation of parameter is concerned, its values are also determined experimentally, in a similar manner to the rest of the constants, with the yielded values exhibiting a significant dependence on the applied load combination. Due to that reason, empirical formulae are derived from the literature in order to calculate [1].
Among the implemented criteria, the Tsai–Wu method was chosen due to its ability to model multiaxial stress interactions in the composite, as it incorporates interaction terms between normal and shear stresses, especially the – coupling, which is an important factor in the case of this research, capturing complex loads in C.F.R.P. structures. Unlike simpler criteria, Tsai–Wu accounts for C.F.R.P.’s anisotropy, making it ideal for finite element analysis where local stresses vary [1]. Moreover, despite concerns such as its inability to explicitly identify specific failure modes, or the fact that its accuracy relies on experimental strength parameters, like the empirically estimated coefficient, it remains a practical, computationally efficient tool for assessing C.F.R.P. monocoque failure.
2.1.2. Tsai–Hill Failure Criterion
The maximum work failure theory, also widely known as the Tsai–Hill failure criterion, is based on a modification of the Von Mises distortion energy criterion for isotropic materials. According to this criterion, a lamina that displays orthotropic behavior is bound to fail if its plain stress state violates Equation (6). The maximum work failure criterion differentiates itself with respect to other failure theories, because it takes into account the interaction between the three strength parameters that exist in a unidirectional lamina. However, one of its inherent drawbacks is the absence of distinguishment on whether the stress state under examination concerns compressive or tensile loading. Additionally, it should be noted that the maximum work failure criterion does not provide information regarding the mode of failure, a fact that leads to the need for further examination of the loads by calculating the absolute values of the ratios of to , to , and to and selecting the greatest value [1].
The Tsai–Hill failure criterion was also applied to offer an alternative view on failure initiation in CFRP laminates. Based on the maximum work theory and analogous to the Von Mises criterion, it enabled an analysis of stress interactions among tensile, compressive, and shear strengths. Although it does not differentiate tension from compression or specify failure modes, it provides a practical estimate of combined loading effects.
where
2.2. Theoretical Assumptions
The study of the mechanics of composite materials is performed with the help of specific theoretical tools due to the exhibited anisotropy. Composite structures follow the same basic principles for their analysis and incorporate specific criteria that are used to determine the failure point within their boundaries. Finally, it should be noted that such information is of high importance in order to examine the validity of a proposed design parameter set in the optimization procedure of a composite structure.
The fabrication of race cars in formula student competitions is usually carried out through the use of composite sandwich panels, in order to shape the chassis structure. Moreover, to ensure the structural integrity of the structure, in the case of an accident, F.S.A.E. rules require that the fabricated composite chassis must possess equal or greater strength than the traditionally used steel space frames. In particular, the rulebook specifies the minimum levels of strength that must be exhibited by the manufactured structure to characterize it as safe to be allowed to race. Some examples of these specifications include perimeter shear strength, the main roll hoop attachment point strength, and the driver harness attachment point strength.
As a result, due to the complex geometry of the structure and the number of different methods and composites that can be implemented to form it, the optimization procedure becomes very computationally intensive. For that reason, to reduce the complexity of the problem and contain its materialization within a sensible time frame, a series of assumptions that are presented in the following list were integrated into the design procedure.
- The composite has a symmetric layup with respect to its z = 0 surface, shown in a latter chapter of the manuscript.
- Only a U.D. and a woven fiber C.F.R.P. with 0°/90° configuration are included in the analysis.
- The positioning angles of the composite prepreg were selected to be only 0° and 90°.
- The use of more than three UD laminates in direct succession is prohibited, so as to avoid the appearance of resin pools which induce local changes in properties in the composite and cause defects.
- The use of at least one outer protective layer of woven material is mandatory and cannot be assigned a value of zero by the optimization algorithm.
- The thickness of the honeycomb core is constant in the structure.
- A uniform lamination sequence is used throughout the structure.
- The composite ultimately formed complies with the criteria that characterize it as a “thin” laminate.
2.3. Materials Elastic Constants
In order to obtain information about the properties of the C.F.R.P. composite materials that were to be used in the fabrication of the monocoque, test specimens that conform with the specifications of DIN-EN-ISO-527-4 [22] type 3 were fabricated and tested in a tensile machine, shown in Figure 3. The test specimens were divided into two categories according to their constitutive material. The first category included prepreg fabrics that consisted of strands of PX35 50K continuous tow unidirectional carbon fibers, (from ZOLTEK, St. Louis, MO, USA) coupled with the Epicote MGS LR 285 epoxy matrix system in proportions of 60% and 40%, respectively, (from Westlake Epoxy, Houston, TX, USA). The second category comprised prepreg fabrics consisting of woven Toray T300 3K fibers in 0°/90° degree directions, (from Toray Advanced Composites, Morgan Hill, CA, USA) impregnated with the Epicote MGS LR 285 epoxy matrix, in proportions of 58% and 42%. The materials used in the research were sourced from Germany. Finally, a total of three composite specimen were tested in their minor and major directions to balance the occurring costs and experiment efficacy.
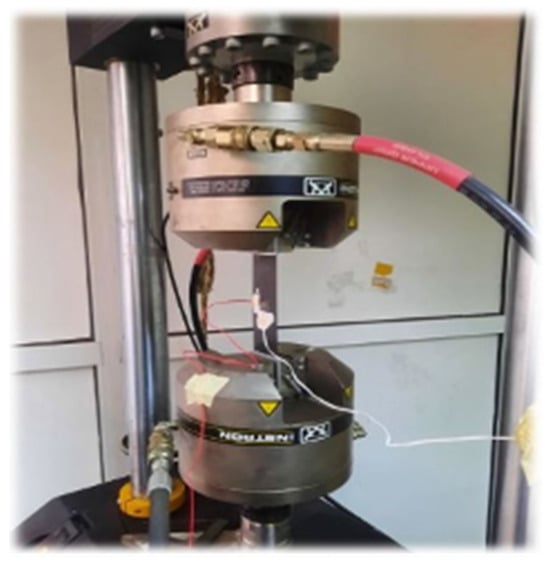
Figure 3.
Execution of tensile experiments.
The execution of experiments was aimed at calculating the elastic coefficients of the materials, and was performed using KYOWA (Tokyo, Japan) strain gauges and a portable terminal from the manufacturer Tokyo Sokki Kenkyuo (Tokyo, Japan). In analogy to the case of unidirectional fiber test specimen testing, experiments were carried out with woven composite prepregs, using the specifications prescribed in DIN-EN-ISO-527-4 [22]. Also, after consulting the available literature, it was decided that the use of structural aluminum honeycomb as a material for the core of the composite was the most suitable option in order to enhance its mechanical properties, while keeping the mass of the structure at a low level. Honeycombs, being cellular materials, exhibit a behavior that approximates that of orthotropic materials. As a result, the modeling of the core was performed as a solid layer with differentiating directional properties, retrieved from datasheets and the literature [21]. Material properties that were integrated into the analysis are presented in Table 1 and Table 2, with an average relative standard deviation of 3.65%.

Table 1.
Properties of unidirectional CFRP laminate.

Table 2.
Properties of woven CFRP laminae.
In alignment with ISO DIN-EN-ISO-527-4 [22], the tensile testing procedures adhered to several key preconditioning and measurement protocols to ensure the accuracy and reproducibility of the mechanical properties obtained. Prior to testing, all specimens were conditioned at a temperature of 23 ± 2 °C and relative humidity of 50 ± 5% for a minimum of 48 h, as specified by the standard, to stabilize moisture content and prevent variability due to environmental effects. Furthermore, the test machine was calibrated to maintain a uniform crosshead speed of 2 mm/min, suitable for the quasi-static tensile testing of fiber-reinforced composites [22]. The strain measurements were conducted using high-precision KYOWA strain gauges, carefully positioned within the gauge length to capture local deformations, with data acquisition performed via the Tokyo Sokki Kenkyujo terminal. The gripping system employed ensured minimal slippage and stress concentration at the specimens, complying with DIN-EN-ISO-527-4 [22] recommendations for composite specimens. These additional measures reinforce the validity of the derived elastic moduli and tensile strength properties of the material and confirm that the tests adhered to international standards and produced results that are representative of the material behavior under the expected operation conditions.
3. Finite Element Model
3.1. Discretization and Assumptions
In order to analyze the chassis response to force components and generate input for the O.A., a computer model was developed using the F.E.A. software ANSYS v.2019 [2]. To reduce analytical complexity, only the composite section of the structure was modeled, with corresponding adjustments to boundary conditions. Although this approach may lead to structural over-design, it was justified by the need to avoid errors arising from modeling the entire hybrid chassis. Regarding geometric partitioning, the software makes multiple element types available, though results depend on element type, size, and order. Therefore, it was deemed necessary to conduct experiments to determine the optimal mesh configuration for the model. After examining the analogous literature [23,24] as well as the nature of the experiments to be performed on the chassis, specific test schemes were adopted to grade the performance of F.E.A. software elements. These tests aimed to evaluate the behavior of elements in bending and torsion, while varying their dimensions and making comparisons with the analytical solutions. Finally, in order to further focus the search, only four types of elements were tested, according to software manual [2] and previous studies [23,24], with more details about the experiments presented subsequently.
In the initial test scenario, whose details are included in Table 3, the geometry under investigation was modeled as a thin-walled cylinder, characterized by a thickness-to-internal-diameter ratio of 1/20. Accordingly, for a unit thickness, the internal diameter of the cylinder was specified as 20 mm. The cylinder’s length and the applied torque at the nodes along the internal diameter at the free end were both set to 1 Nm to execute the computational analysis. Furthermore, the meshing of the geometry was conducted uniformly using a single element type throughout the volume, with the element categories evaluated including SOLID185, SOLID186, SHELL181, and SHELL281 [2]. The geometry was assigned an orthotropic material model, incorporating the mechanical properties detailed in the problem statement. The results were subsequently validated through comparison with the analytical solution for the torsion of cylindrical composite shafts [1]. Finally, the calculated results for the angular displacement of each case of elements are exhibited in Figure 4.

Table 3.
Information about the torsion experiments.
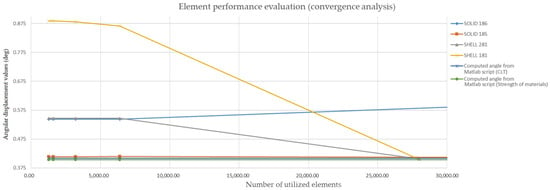
Figure 4.
Evaluation of finite elements in torsion.
Similar to the previous scenario, the geometry was assumed to be a “thin” laminate, characterized by a length-to-thickness ratio consistent with Euler–Bernoulli beam theory, with further details of the experiment provided in Table 4. Accordingly, the beam length was set at 100 mm for a unit thickness. A total load of 1 N was applied uniformly to the top surface nodes to simplify calculations. The geometry was meshed uniformly with a single element type, as in the torsion experiment, while the laminae were assigned orthotropic material properties as specified in the problem description. The experimental results were validated using a MATLAB (R2025a) script that computed the analytical solution for the bending of a Euler–Bernoulli beam. Finally, the calculated results for the maximum displacement of each element are shown in Figure 5.

Table 4.
Information about the second category of experiments.

Figure 5.
Evaluation of finite elements in bending.
The performance analysis indicates that all element categories accurately capture the maximum deflection of the bent beam with comparable precision, though they differ in convergence rates towards the analytical solution. Notably, SOLID185 elements demonstrated a satisfactory approximation of the theoretical results relative to SHELL and higher-order elements. However, a discrepancy of approximately 33% was observed between the analytical solution and numerical torsional experiments, with all element types exhibiting similar performance. This discrepancy raises concerns regarding potential computational errors and suggests that increased safety factors are necessary to mitigate structural failure risks. The experimental setup prioritized the maintenance of aspect ratio values near the unit (1), to enhance the validity of comparisons. The element selection process concluded by considering software licensing constraints, which ultimately led to the choice of SOLID185 elements for mesh construction due to their computational efficiency and performance. Furthermore, a sufficiently dense mesh was employed to ensure result accuracy, complemented by convergence tests to validate the analysis outcomes. Finally, a picture of the meshed geometry, constructed using SOLID 185 elements, is exhibited in Figure 6.
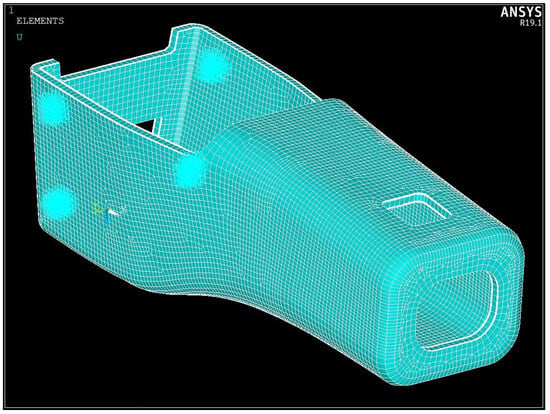
Figure 6.
Meshing of chassis geometry with SOLID 185 elements.
3.2. Boundary Conditions
To analyze the structural response under loading, an initial load input must be supplied to the F.E. model. Accurate loading conditions are critical, as the subsequent optimization analysis heavily depends on this input. Therefore, the analysis software was provided with the most detailed representation of boundary conditions possible, as displayed in Figure 7. This necessitated calculating the forces transmitted from the suspension system to the chassis during a specific cornering scenario. Although this process was complex due to the need to account for various suspension variables, the challenge was mitigated by implementing several simplifying assumptions, which are detailed below.
- The parts of the suspension system are assumed to be of infinite rigidity, causing no changes in its geometry.
- The forces are assumed to pass through the tire and rim assembly without deforming their geometries.
- Loads are assumed to transfer directly to the chassis through the mounting brackets of the suspension arms, as depicted in Figure 8.
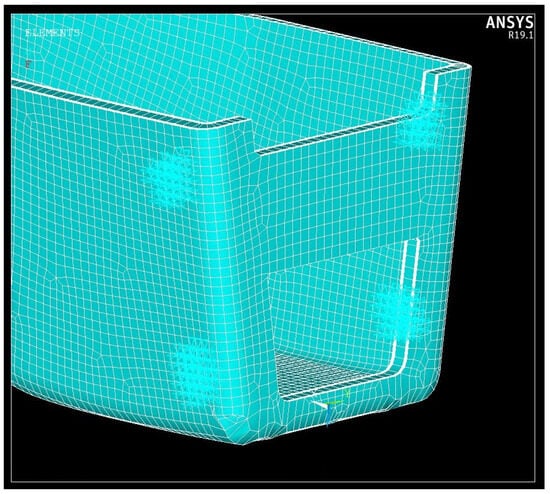 Figure 7. Fixations of the chassis (cyan arrows—display of finite element graphics).
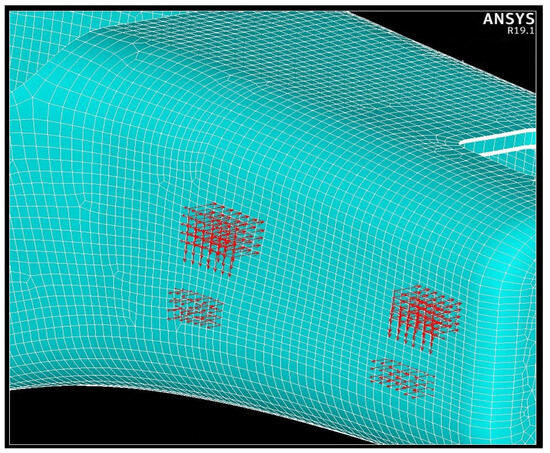 Figure 8. A-arm forces on the chassis (red arrows—display of finite element graphics).
Regarding the rationale for simplifying the finite element (F.E.) model by including only the composite section of the chassis, it is important to emphasize that these measures are primarily aimed at improving computational efficiency. Model simplification substantially decreases computational time and resource demands, which is particularly advantageous for large-scale analyses such as this. Furthermore, the reduction in computational cost facilitates the design optimization process by enabling the rapid evaluation of various composite material configurations, thereby expanding the scope for identifying the optimal design alternatives.
Despite the benefits of simplifying the finite element model, inherent limitations arise, the principal one being the loss of accuracy caused by adopting fixed supports at the rear of the monocoque, as depicted in Figure 7, which simplistically represents the connection to the space-frame segment of the hybrid chassis due to neglecting its compliance. This simplification may lead to an overestimation of stress magnitudes within the composite structure. Nonetheless, since the mechanical properties of both components will be independently assessed through physical testing in the post-manufacturing phase, focusing the analysis exclusively on the composite section was considered an appropriate choice.
The loading scenario assumes that the vehicle drives in a constant-radius turn, simulating a skid pad track of two interconnected circles, each with a 15.25 m radius, forming a figure-eight layout (Figure 9). The track width is specified as 3 m. For force calculations on the monocoque, the race car is modeled to traverse the midpoint of the right half of the track at a constant speed, completing a lap in 5.67 s. Consequently, the requisite inertial and reaction forces to achieve this lap time were determined.
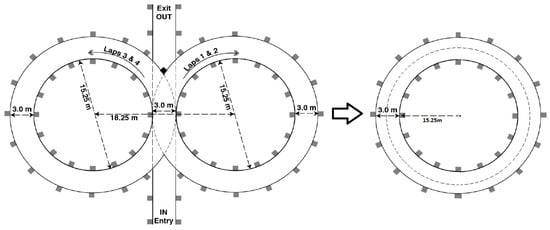
Figure 9.
The layout of the simplified skid pad track.
Subsequent to evaluating the suspension system’s geometric characteristics, the resultant force components transmitted to the chassis were computed and applied as boundary conditions directly on the nodes corresponding to the interface surfaces (1–6) from Figure 10, between the suspension mounting brackets and the chassis. It is important to note that, due to the implemented assumptions, the results are anticipated to deviate from empirical test data. As a precautionary measure to accommodate anticipated abrupt increases in forces during racing conditions, the applied forces were scaled by a factor of 2.5. A static force analysis was executed due to the indeterminate variables inherent in dynamic analysis, as adopting a dynamic approach would complicate the model, compromise result accuracy, and increase the algorithm’s execution time. The loads calculated from the suspension are summarized in Table 5.
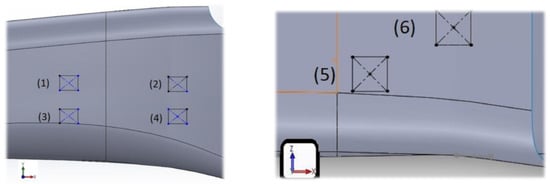
Figure 10.
Numbering of the load application points on the chassis.

Table 5.
Components of the applied forces on the front suspension mounting points.
3.3. Solution Eligibility Criteria
It should be noted that determining the eligibility of a solution requires meeting specific criteria, the most critical being the proximity of the composite material to failure (lighter colored areas in Figure 11 and Figure 12). Accordingly, a comparison was conducted between the maximum nodal values of stress and the Tsai–Wu (Figure 11) and Tsai–Hill (Figure 12) failure criteria. The results from these criteria were then used to evaluate the proposed solution’s eligibility, with first ply failure denoting an ineligible design [25]. Furthermore, considering the material’s strength parameters and computational deviations from the theoretical solutions, the maximum allowable failure criterion values were adjusted for the final design decision and the failure threshold was set at 0.78, where a value of 1 indicates material failure [3].
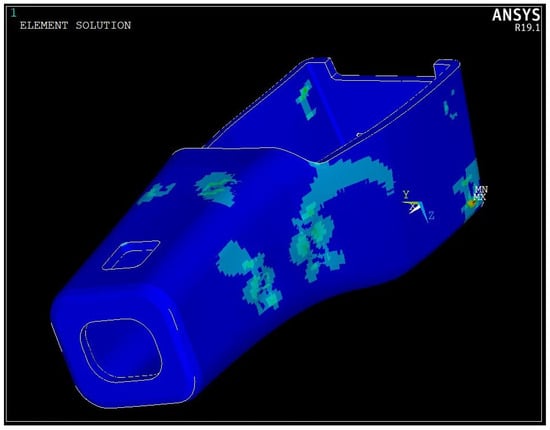
Figure 11.
Strength assessment of the monocoque using Tsai–Wu failure criterion.
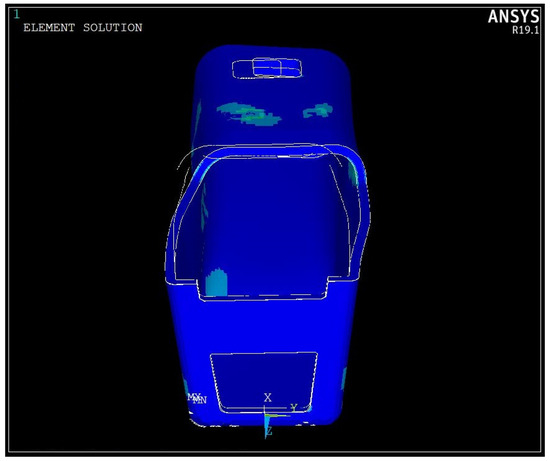
Figure 12.
Strength assessment of the monocoque using Tsai–Hill failure criterion.
4. Composite Optimization
The optimization routine applied to the monocoque structure leverages the dependency of composite material properties on the characteristics of its constituent lamina and core materials. By representing these laminate characteristics as variables, a parametric design genome defining a specific lamination sequence is constructed. Targeted modifications within this genome are expected to yield a structure with enhanced properties according to predefined criteria. Additionally, two distinct cases differing by the inclusion of lamina orientation angles in the variable set were examined to comprehensively assess the influence of this parameter on the results. Finally, it should be stated that the available literature from related research on the weight optimization of composites [6,25,26], as well as time limitations and the authors’ familiarity with this method, were key elements in the adoption of that method in comparison to other alternatives.
As previously noted, genetic algorithms optimize composite structures by iteratively selecting advantageous traits and eliminating inferior ones to achieve optimal outcomes aligned with predefined objectives. This process, analogous to natural selection and biological evolution—hence the term “genetic”—facilitates the exploration of novel design space regions to identify superior solutions. The optimization of the composite chassis structure is a resource-intensive process, systematically segmented into distinct phases, starting by formulating the problem in terms of design variables, including material type, properties, thickness, ply count per lamina, fiber orientation, and stacking sequence within the composite. Specifically, the optimization variables in this study comprise the number of plies per lamina and their orientation angles (see Table 6).Constraints were subsequently applied to the design variables to improve the simulation’s fidelity to real-world conditions and ensure compliance with fabrication requirements. These included examples such as limits on the maximum number of consecutive unidirectional or woven prepreg plies to prevent resin pooling and maintain symmetrical lamination.

Table 6.
Optimization parameters of the GA.
Following the imposition of constraints on design variables, the chassis’s structural performance was evaluated according to specific criteria. To minimize structural mass, the proposed designs were assessed via a single objective function representing the total monocoque mass, computed as the sum of individual finite element masses. Optimal solutions from each generation were retained for subsequent iterations, while new designs were introduced, prioritizing the retention of high-performance individuals. Finally, this iterative process adopted as termination criteria a minimum depth of 200 generations and a stagnation period of 50 generations,
Regarding the algorithm’s application, a simple genetic algorithm was adopted for the mono-criterion problem. The initial parent population was set to 20 randomly generated designs, while uniform crossover and mutation operations were utilized in the procedure. To clarify the implementation, the terms “gene” and “genome” refer to a variable and the composite lamination, respectively. In the uniform crossover, each gene has an equal probability of inheritance from either parent. The 60% crossover probability in Table 7 denotes the likelihood that crossover occurs; otherwise, offspring inherit parent genomes unchanged.

Table 7.
Setup parameters of the GA.
Conversely, mutation independently modifies a gene’s value regardless of parental designs. For instance, the variable Surface_Ply_1.number_of_layers could randomly mutate from three to nine plies, thereby introducing a novel gene into the composite lamination genome pool. Selection was conducted via a tournament, wherein two parent designs were simultaneously compared based on their fitness values. Each design’s selection probability, based on fitness, was calculated using a bounded random number generator and the selection probabilities of each design to determine the new genome. Fitness was defined as the inverse of the objective function’s output, and the selection probability was the ratio of each design’s fitness to the total fitness of the compared designs. It should also be noted that no adaptive mutation technique was implemented in this study.
These actions are executed by implementing the algorithmic procedure in combination with the ANSYS ACP script, existing in the ANSYS project’s folder, which includes the parameter “number_of_layers” for each ply in the composite laminate model. Finally, the boundary-condition-induced stresses on the structure were evaluated using the specified composite failure criterion, while designs satisfying this criterion with lower mass were prioritized. In summary, the key G.A. specifications are presented in Table 7 and Table 8.

Table 8.
Selection probabilities for the three fittest results of G.A.
4.1. Comparison of Optimization Criteria
The selection of optimization criteria requires evidence-based validation. Specifically, employing mass as the sole criterion should be critically evaluated against alternative metrics to assess potential performance improvements and ancillary benefits. This study examined two criteria: total structural mass and the ratio of structural mass to torsional stiffness. As a direct comparison proved inconclusive, fitness was evaluated via finite element simulations, with results analyzed and presented schematically. The mass optimization procedure generates data that can be represented as two- or three-dimensional surfaces, elucidating the mechanical behavior of the structure under various compositional modifications. Due to the impossibility of visualizing data beyond the three-dimensional space, specific simplifications were implemented. This sub-study assumed that the sub-laminate layers of woven and unidirectional C.F.R.P. form a symmetric composite; thus, sub-laminates corresponding to variables (1), (3), (5), (7), (8), (10), (12), and (14) were set to have equal values, as were those corresponding to variables (2), (4), (6), (9), (11), and (13). Only variables (1), (2), and the torsional stiffness-to-mass ratio were plotted on the X, Y, and Z axes, respectively, since the remaining variables within each subcategory were assigned values equal to either (1) or (2), reflecting their shared characteristics. The results and plotted data for the composite laminations are presented in Figure 13, Figure 14 and Figure 15.
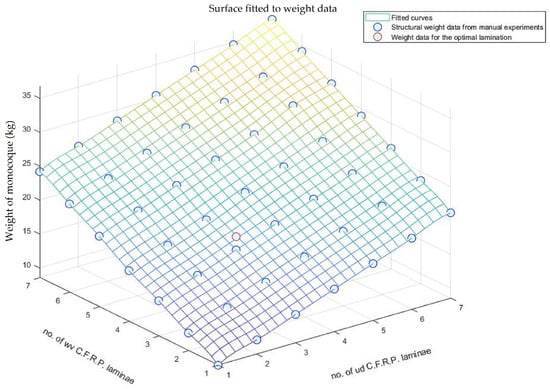
Figure 13.
Surface fitted to data for estimates of mass from F.E. experiments.
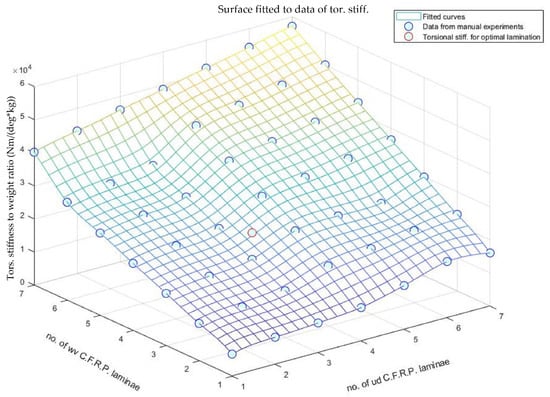
Figure 14.
Surface fitted to data of torsional rigidity from F.E. experiments.
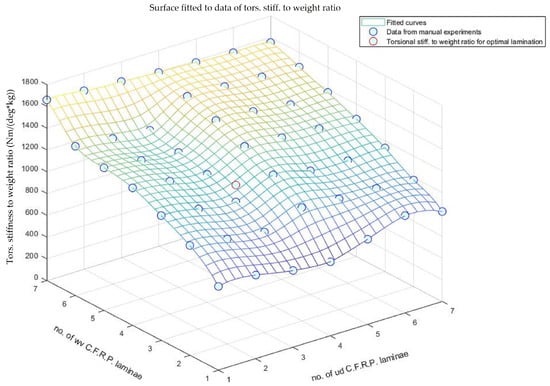
Figure 15.
Surface fitted to data of torsional rigidity to mass ratio from F.E. experiments.
The data in Figure 14 illustrates the torsional stiffness-to-mass ratio of the monocoque under torsion, obtained using methods consistent with those in the finite element optimization experiments. Analysis along the x-axis, representing the number of unidirectional laminae, reveals a slight decline in the torsional stiffness-to-mass ratio with up to three U.D. layers. Subsequently, the ratio plateaus before increasing nonlinearly as woven plies are added. The incorporation of both U.D. and woven plies substantially enhances the torsional stiffness-to-mass ratio, particularly beyond the seventh woven ply; however, this improvement coincides with an approximately linear mass increase, as shown in Figure 13. Although the stiffness gains outweigh the mass increase—suggesting the torsional stiffness-to-mass ratio as a suitable optimization criterion—it should be noted that the optimization targets that were set to prioritize minimizing the total mass due to its greater impact on vehicle performance. Specifically, given a race car’s fixed engine power across the rev range, increased mass imposes a higher load on the engine, diminishing efficiency, and increasing lap times relative to a lighter vehicle. In the case of this study, as the per lap pace of the car was set to be of utmost importance, the parameter of mass was finally adopted as an optimization criterion. Moreover, existing research where monocriterion optimization was performed backed up the selection of that criterion over alternatives [27]. It is important to note that concerns regarding the vehicle’s passive safety are mitigated through the incorporation of impact dampers and localized composite reinforcements within the monocoque body. Thus, as this study primarily focuses on identifying the optimal baseline lamination for the main monocoque structure in a simplified operation scenario, further work is required to integrate components, such as brackets for the impact attenuators, in the physical structure, following good engineering practices.
4.2. Calculation of Optimal Parameter Set
The optimal set was derived after a minimum of 200 generations and a stagnation period of 50 generations. To mitigate the computational burden associated with determining the optimal design parameter combination, specific constraints—such as enforcing symmetry in the composite material lamination—were imposed to reduce processing time. The optimization outcome is deemed to be in close proximity to the Pareto optimal point, as further attempts to reduce the structure’s mass resulted in unfeasible designs. Alternative designs generated and evaluated by the algorithm are depicted as points in Figure 16, where the x-axis represents the design ID and the y-axis the corresponding computed mass. Due to the predominantly discrete nature of the design variables, a stepwise reduction in the structure’s mass was anticipated and observed, as shown in Figure 16, reflecting the incremental addition or removal of laminae in the composite material stacking. Finally, the initial composite characteristics alongside the optimization results are presented in Table 9 and Figure 17.
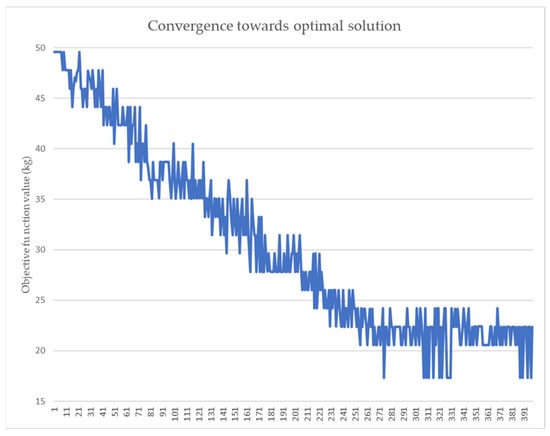
Figure 16.
Output of the genetic algorithm objective function.

Table 9.
Optimized lamination sequence.
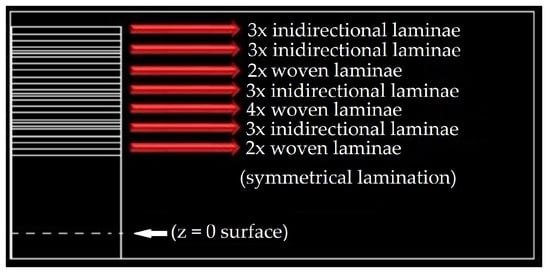
Figure 17.
Simplified depiction of the optimal lamination sequence.
The analysis of the O.A. results indicates a mass reduction of approximately 12.36 kg (41.66%) from the initial lamination of while maintaining developed stresses in the monocoque structure at suitably low levels. However, despite significant mass savings, a disproportionately greater decrease in torsional rigidity was observed. This reduction is attributed to the removal of laminae from the composite, which diminished the stiffness matrix components. Notably, torsional rigidity measurements were recorded at a horizontal distance of 937.6 mm from the plane defined by the fixation points.
4.3. Convergence of Solution
While the initial results appear satisfactory, the F.E. method requires a convergence check of the output data. This procedure can be performed by varying the size or order of the finite elements in the mesh [7,25]. In this study, the first alternative was selected, due to the implementation of SOLID 185 elements, which precludes the second option. The results of the stress convergence check are shown in Table 10 and Table 11. Physical experiments on the monocoque to validate computational data were planned. However, due to limited financial resources and challenges in mitigating exogenous factors such as manufacturing defects, these experiments were set to be included in a subsequent study.

Table 10.
Impact of the element size on the maximum absolute normal stress values.

Table 11.
Impact of the element size on the maximum absolute shear stress values.
4.4. Structural Performance in Pure Torsion
In addition to low mass, a critical requirement in the design and manufacture of racing automobile chassis structures is high stiffness. This necessity arises because lateral loads are transmitted from the front to the rear of the vehicle in proportion to the roll stiffness of the suspension assemblies. Therefore, a sufficiently robust platform must be provided to support their mounting, as vehicle dynamic performance and handling critically depend on this parameter.
As a general principle, the target stiffness of a structure is determined by comparing the deformation with the deflections of the suspension springs and tires. However, the inherent adjustability of race car suspension systems to varying conditions complicates this comparison. Consequently, defining the optimal rigidity of a race car chassis remains challenging. Conversely, some scholars argue that chassis stiffness should be increased only until the overall mass of the structure remains within acceptable limits [28]. Moreover, it is important to note that in this study, chassis stiffness is determined by the applied boundary conditions and, consequently, by the output of the genetic algorithm. Therefore, its load behavior must be assessed based on specific performance criteria.
The analysis of chassis torsional behavior under complex loading is challenging due to the complexity of the resulting stress field. Consequently, to circumvent the precise specification of local stress tensor as boundary condition—which may compromise accuracy—a simplified scenario involving the application of a pure moment was utilized. In this scenario, the torsional load was applied at the nodes located on the plane bisecting the centers of the front wheels. This approach eliminated vertical surface loads on the monocoque, thereby simplifying the stress distribution within the structure. Additionally, it facilitated comparisons between the numerical results and an analytical beam torsion model to support conclusive data evaluation [29].
The chassis torsional response was evaluated analytically by partitioning it into two segments, simulating the monocoque cockpit, modeled as springs in series with the first segment represented as a U-shaped tube and the second as an orthogonally shaped tube under torsion, as in Figure 18. Additionally, the model’s movement was constrained at the rear of the U-shaped section and a moment was applied at the front. The resulting torsional stiffness or twist angles from both analytical and finite element models were then compared.

Figure 18.
Simplification of the chassis geometry.
For the U-shaped section, the initial hypothesis posits that the applied torque induces torsional deformation by twisting the section about its central top–bottom point of geometry. Consequently, this action transforms the section’s exploded view into a horizontally oriented lozenge-shaped parallelogram or rhombus, analogous to the deformation observed under shear force in classical mechanics [24]. Moreover, the twisting of the U-section tube involves two moment components, one related to the lozenge geometry and the other to its bending, but as the latter has a negligible effect on calculations it is omitted from them [30]. To streamline the procedure and minimize computational errors, an initial moment of 1000 Nm was applied. Finally, the analytical and numerical results are compared using Equations (8)–(10), with a summary presented in Table 12.

Table 12.
Comparison between analytical and FEA model calculation results.
It should be noted that the difference between the proposed analytical solution and the result that is obtained from the F.E. model is calculated at 17.85%. The deviation between the F.E. model and analytical solution 1, is attributed to the fact that the two sections of the model could warp in isolation and that the factor of the bending moments is not included in the calculations. Finally, it is noteworthy that the results from the finite element analysis (FEA) and analytical calculations exhibit small discrepancies, thereby corroborating the adequacy of the finite element model in that particular scenario, despite the inherent limitations of the analytical approach.
4.5. Influence of the Positioning Angle on the Optimal Solution
Another important factor that affects the overall performance of composite structures is the positioning angle of the laminae from which the overall composite material consists of. That fact is attributed to the inclusion of the positioning angle in the calculations of the constituents of the stiffness matrix (ABBD) [1]. Moreover, another way to visualize the dependence of the performance of composites based on the positioning angle of their laminae is to consider the fact that the alignment of the major axis of the constitutive plies with the direction of distributed force applied to them leads to smaller deformations and a lower failure probability. For the previously mentioned reasons, it was considered important to repeat the simulation procedure and include the positioning angles of woven laminae as additional variables in the process. Finally, the results from the repetition of the experiment with the expanded variable set are presented in Table 13.

Table 13.
Output of the O.A., taking into account positioning angles.
4.6. Reassessment of Maximum Developed Stress Components
The consequent reduction in the monocoque’s mass is anticipated to alter the distribution of stress components. This effect arises because the decreased mass influences the forces transmitted through the suspension system, resulting in different stress magnitude and distribution within the race car’s body. Therefore, despite the expectation of improved performance according to the selected composite failure criteria, accurately determining the characteristics of the new stress components remains essential. The loading scheme used for the calculations was identical to that of the initial model, wherein the vehicle was assumed to execute a constant radius turn under inertial forces. The results of the updated analysis, along with the required convergence verification based on maximum stress components computed as nodal differences, are presented in Table 14. Notably, the maximum stress component values for the structure are lower than those in the original loading scenario, as anticipated, due to the reduced overall mass of the structure. This reduction consequently decreases the stress on the suspension components and chassis under inertial loading. Finally, the location of the highest value of the composite failure criterion after the reassessment of the developed stresses, as well as an illustration of the deformations, are used in Figure 19 and Figure 20.

Table 14.
Convergence checks on recalculated maximum absolute stress values.
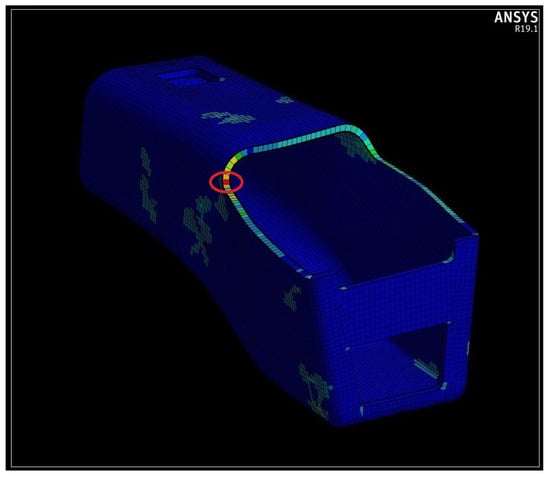
Figure 19.
Location of the maximum computed value of failure criterion on the stressed monocoque.
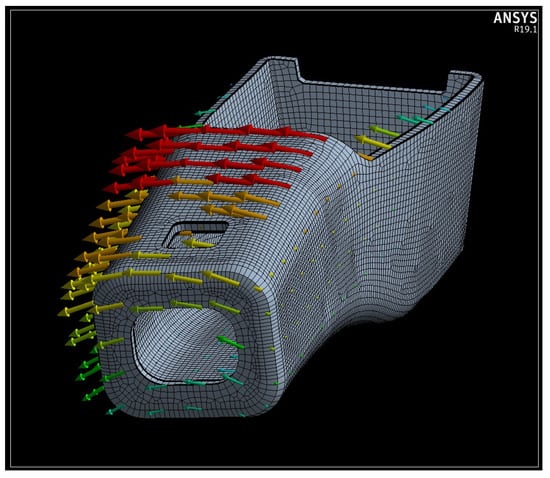
Figure 20.
Depiction of the deformation of the monocoque shape.
4.7. Sensitivity Analysis
In order to obtain an image regarding the effect of the alteration of the values of the different variables of the problem, which represent the different laminae categories, in the robustness of the composite, it was decided to execute a sensitivity analysis. The criterion of the robustness of the composite was selected as it consists of the criterion of validating the alternative designs. The effect of reduction in laminae plies per variable on the robustness of the composite was studied and the results were examined to identify the variables with greatest impact. The results from the execution of this study are presented in Table 15.

Table 15.
Sensitivity analysis results.
The sensitivity analysis was conducted by computing the elementary effects (E.E) of each variable on the model output across seven scenarios. For each scenario, the E.E. was calculated as the difference between consecutive output values, assuming a unit step change in input variables. The mean of the absolute elementary effects (), mean E.E. (), and standard deviation () were derived to quantify the magnitude, direction, and variability of each variable’s influence. Results indicate that Scenario (1) and Scenario (7) exhibit the highest sensitivity, with values of approximately 0.0135 and 0.0134, respectively, suggesting that the variables involved in these scenarios have the greatest impact on performance, identifying key variables for targeted optimization. Lower sensitivity was observed in Scenarios (2), (4), and (6), with values below 0.0085. The relatively low standard deviations across scenarios imply mostly linear effects with limited interaction.
Within the sensitivity analysis that was performed, the impact on torsional rigidity was also measured. Scenarios with fewer variable levels (e.g., Scenario 2 and Scenario 6) exhibited larger magnitudes of elementary effects, indicating a more pronounced impact of individual variable perturbations on the output. Conversely, scenarios with more extensive variable levels (e.g., Scenario 1 and Scenario 3) demonstrate comparatively smaller mean absolute elementary effects, suggesting a more gradual influence of variable changes. The mean absolute values of the elementary effects () provide a robust measure of the average sensitivity, while the standard deviations () reflect the heterogeneity and potential nonlinearity in the response. Also, elevated standard deviations in scenarios such as Scenario 2 and Scenario 5 denote the presence of complex interactions or nonlinear effects within the system. In summary, variables (2), (13), (5), and (9) are the most influential on torsional rigidity, as confirmed by the experiments and sensitivity metrics, denoting a connection between the monocoque panels’ resistance to bending and the torsional rigidity exhibited by the structure.
4.8. Discussion of Results
The data obtained from varying the orientation angles of each lamina indicated that the genetic algorithm did not alter the optimized ply sequence. Consequently, repeated simulations demonstrated that deviating individual lamina angles from the initial 0° configuration conferred no advantage in this analysis. Furthermore, additional tests with lamina angles adjusted to 45° showed a slight increase in the maximum failure criterion values predicted by the finite element model and decreased values of torsional resistance, suggesting diminished structural durability under identical loading conditions. This would necessitate additional laminae to maintain structural integrity, thereby increasing the chassis mass. Ultimately, it was concluded that modifying the orientation of woven prepreg layers to 45° did not enhance the structure’s torsional rigidity or overall strength in this scenario. This phenomenon is attributed to the decrease in strength of the lamina oriented obliquely to the axial load as it approaches its minor axis, despite the increase in the respective components of the lamination’s stiffness matrix, which is critical for shear strain calculations [1,16]. Consequently, fiber reinforcements with greater load-bearing capacity contribute less to load transfer, thereby shifting the load-bearing role to the composite matrix, something that elevates the risk of catastrophic failure in individual laminae. Additionally, it can be hypothesized that, under this loading scenario, the material’s failure criterion value is increased due to the bending and lozenging of the monocoque’s geometry, in the vertical and horizontal–parallel direction, rather than due to pure torsion. As is also backed up by the results of the sensitivity analysis, it can be said that the C.F.R.P. material baseline lamination should aim to enhance the resistance of the chassis panels to bending, thereby ensuring the strength adequacy of the structure. Finally, the inclusion of local ±45° laminae reinforcements, in addition to the baseline lamination, should not be excluded as a means to increase the resistance of the structure in pure torsion, but as the current research focusses on the specification of the optimal composition of the baseline lamination, that alternative is left to be researched in future analysis efforts.
Additionally, it is noteworthy that the increased torsional compliance of the chassis arises from the dyadic nature of the moment components, inducing both lozenge and bending deformation in specific geometric regions, as well as being influenced by certain material properties. The increased observed bending correlates with the in-plane engineering moduli of the sandwich composite, E1 and E2. Variations in these constants, as shown in Figure 20 and Figure 21, demonstrate a slight but not insignificant reduction in moduli in these directions, which despite the increase in G12 lead to increased deformations [1,16]. Consequently, these greater deformations result in reduced torsional stiffness, aligning with the F.E. analysis results.
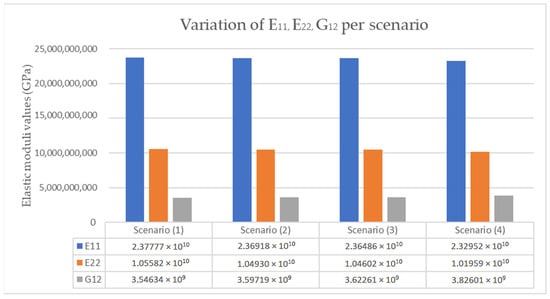
Figure 21.
Variation in the elastic moduli value per experiment scenario.
5. Conclusions
In conclusion, the findings from this study underscore the effectiveness of using a lamination of , as shown in the table with all laminae oriented at 0°, for achieving near-optimal performance balance in terms of structural strength and mechanical characteristics while minimizing mass. The significant reduction in vehicle mass demonstrated by a 41.66% or 12.36 kg decrease in the monocoque weight highlights the potential for substantial gains in efficiency and performance. Furthermore, the anticipated 16.83% reduction in the overall hybrid chassis’ mass, 42.984 kg in contrast to the 35.752 kg, compared to a conventional tubular frame, suggests that alternative designs can offer considerable benefits. Researchers and engineers are encouraged to consider these findings when designing similar structures, as the approach outlined enhances performance and also offers insights into efficient mass reduction strategies. However, it is important to note that modifications to the lamina orientation may not yield significant improvements in the areas of torsional stiffness and structural robustness, as shown by the data of Table 13 and Table 16 and Figure 21 and Figure 22, while they may introduce complexity in the manufacturing process, due to difficulties in accurately positioning the laminate plies.

Table 16.
Data from the executed experiments.
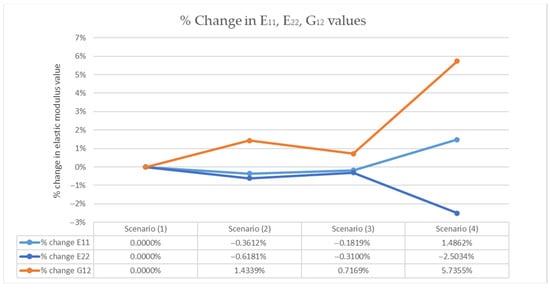
Figure 22.
Percentage variation in elastic moduli values per experiment scenario.
The results derived from the optimization algorithm offer a valuable reference for future research on optimizing composite materials in structural engineering applications, as they provide critical insights into the methodology, underscore the need for further evaluation, and identify areas for subsequent investigation. In particular, comparative analyses between the selected genetic algorithm and alternative optimization techniques such as particle swarm optimization (P.S.O.) methods would help to assess the G.A.’s efficacy in identifying near-optimal designs using metrics related to performance, such as computational time and resource usage. Furthermore, employing robust statistical methods, given sufficient tools and data, could more thoroughly evaluate the advantages and limitations of various optimization criteria. Additionally, investigating combinations of materials with diverse mechanical properties may enhance structural performance and mitigate failure risks. Moreover, the effect of adopting a material with more core height should be researched and incorporated in future executions of optimization routines. Finally, incorporating material cost parameters or further optimization criteria into the algorithmical procedure could facilitate the development of enhanced designs that balance mechanical properties with reduced manufacturing costs.
Author Contributions
Conceptualization, I.T. and D.A.D.; methodology, I.T., D.A.D., A.S. and E.E.T.; software, I.T.; validation, I.T. and D.A.D.; formal analysis, I.T. and D.A.D.; investigation, I.T.; resources, I.T., A.S., D.A.D. and E.E.T.; data curation, I.T.; writing—original draft preparation, I.T.; writing—review and editing, I.T., D.A.D., A.S. and E.E.T.; visualization, I.T.; supervision, D.A.D. and E.E.T.; project administration, D.A.D.; funding acquisition, D.A.D. All authors have read and agreed to the published version of the manuscript.
Funding
This research received no external funding.
Institutional Review Board Statement
Not applicable.
Informed Consent Statement
Not applicable.
Data Availability Statement
The original contributions presented in this study are included in the article. Further inquiries can be directed to the corresponding authors.
Conflicts of Interest
The authors declare no conflicts of interest.
References
- Autar, K.K. Mechanics of Composite Materials, 2nd ed.; CRC Press: Boca Raton, FL, USA, 2005. [Google Scholar]
- ANSYS, Inc. ANSYS Theory Reference, Release 5.6; ANSYS, Inc.: Canonsburg, PA, USA, 1999. [Google Scholar]
- Baker, A.A.; Dutton, S.; Kelly, D. Composite Materials for Aircraft Structures, 2nd ed.; American Institute of Aeronautics and Astronautics: Reston, VA, USA, 2004. [Google Scholar]
- Barbero, E.J. Finite Element Analysis of Composite Materials using Abaqus®, 2nd ed.; CRC Press: Boca Raton, FL, USA, 2023. [Google Scholar] [CrossRef]
- Dinulović, M.; Bengin, A.; Krstić, B.; Dodić, M.; Vorkapić, M. Flutter Optimization of Carbon/Epoxy Plates Based on a Fast Tree Algorithm. Aerospace 2024, 11, 636. [Google Scholar] [CrossRef]
- Lu, S.; Ma, H.; Xin, L.; Zuo, W. Lightweight Design of Bus Frames from Multi-material Topology Optimization to Cross-Sectional Size Optimization. Eng. Optim. 2019, 51, 961–977. [Google Scholar] [CrossRef]
- Nealer, R.; Hendrickson, T.P. Review of recent lifecycle assessments of energy and greenhouse gas emissions for electric vehicles. Curr. Sustain./Renew. Energy Rep. 2015, 2, 66–73. [Google Scholar] [CrossRef]
- Park, G.; Park, H. Structural design and test of automobile bonnet with natural flax composite through impact damage analysis. Compos. Struct. 2018, 184, 800–806. [Google Scholar] [CrossRef]
- Primo, T.; Calabrese, M.; Del Prete, A.; Anglani, A. Additive manufacturing integration with topology optimization methodology for innovative product design. Int. J. Adv. Manuf. Technol. 2017, 93, 467–479. [Google Scholar] [CrossRef]
- Cazaku, R. Comparison between the Performance of GA and PSO in Structural Optimization Problems. Am. J. Eng. Res. 2016, 5, 268–272. [Google Scholar]
- Zhou, D.; Kang, Z.; Su, X. Novel collaborative design method for lightweight optimization design of vehicle load-bearing parts. Int. J. Automot. Technol. 2023, 24, 1269–1284. [Google Scholar] [CrossRef]
- Zuo, W.; Fang, J.; Zhong, M.; Guo, G. Variable Cross-Section Rectangular Beam and Sensitivity Analysis for Lightweight Design of Bus Frame. Int. J. Automot. Technol. 2018, 19, 1033–1040. [Google Scholar] [CrossRef]
- Cifuentes, A.O.; Kalbag, A. A performance study of tetrahedral and hexahedral elements in 3-D finite element structural analysis. Finite Elem. Anal. Des. 1992, 12, 313–318. [Google Scholar] [CrossRef]
- Zhang, W.; Xu, J. Advanced lightweight materials for automobiles: A review. Mater. Des. 2022, 221, 110994. [Google Scholar] [CrossRef]
- Kanketr, T.; Phongphinnittana, E.; Patamaprohm, B. Design of a CFRP composite monocoque: Simulation approach. IOP Conf. Ser. Mater. Sci. Eng. 2019, 501, 012014. [Google Scholar] [CrossRef]
- Ma, Y.; Chen, R.; Bai, J.; Zuo, W. Shape optimization of thin-walled cross section for automobile body considering stamping cost, manufacturability and structural stiffness. Int. J. Automot. Technol. 2020, 21, 503–512. [Google Scholar] [CrossRef]
- Le Riche, R.; Haftka, R.T. Improved genetic algorithm for minimum thickness composite laminate design. Compos. Eng. 1995, 5, 143–161. [Google Scholar] [CrossRef]
- Messager, T.; Pyrz, M.; Gineste, B.; Chauchot, P. Optimal laminations of thin underwater composite cylindrical vessels. Compos. Struct. 2002, 58, 529–537. [Google Scholar] [CrossRef]
- Milić, M.; Svorcan, J.; Ivanov, T.; Atanasovska, I.; Momčilović, D.; Flajs, Ž.; Rašuo, B. Structural Optimization and Experimental Validation of a Composite Engine Mount Designed for VTOL UAV. Aerospace 2025, 12, 178. [Google Scholar] [CrossRef]
- Chen, Y.; Zhang, J.; Li, Z.; Zhang, H.; Chen, J.; Yang, W.; Yu, T.; Liu, W.; Li, Y. Intelligent methods for optimization design of lightweight fiber-reinforced composite structures: A review and the state-of-the-art. Front. Mater. 2023, 10, 1125328. [Google Scholar] [CrossRef]
- Gibson, L.J.; Ashby, M.F. Cellular Solids: Structure and Properties, 2nd ed.; Cambridge University Press: Cambridge, UK, 1997. [Google Scholar]
- International Organization for Standardization. Plastics—Determination of Tensile Properties—Part 4: Test Conditions for Isotropic and Orthotropic Fibre-Reinforced Plastic Composites; ISO: Geneva, Switzerland, 2023. [Google Scholar]
- Reddy, J.N. An Introduction to the Finite Element Method, 4th ed.; McGraw Hill Education: New York, NY, USA, 2019. [Google Scholar]
- Sadd, M.H. Elasticity: Theory, Applications, and Numerics, 2nd ed.; Academic Press: Cambridge, MA, USA, 2009. [Google Scholar] [CrossRef]
- Wang, Z.; Sobey, A. A comparative review between Genetic Algorithm use in composite optimisation and the state-of-the-art in evolutionary computation. Compos. Struct. 2019, 220, 111739. [Google Scholar] [CrossRef]
- Liu, X.; Qin, J.; Zhao, K.; Featherston, C.A.; Kennedy, D.; Jing, Y.; Yang, G. Design Optimization of Laminated Composite Structures Using Artificial Neural Network and Genetic Algorithm. Compos. Struct. 2022, 305, 116500. [Google Scholar] [CrossRef]
- Xu, S.; Liu, Y.; Zhang, J.; Zheng, Y. Preliminary Design and Optimization of Primary Structures for a Tilt-Duct UAV. Aerospace 2024, 11, 286. [Google Scholar] [CrossRef]
- Milliken, W.F.; Milliken, D.L.; Metz, L.D. Race Car Vehicle Dynamics; SAE International: Warrendale, PA, USA, 1995. [Google Scholar]
- Seaburg, P.A.; Carter, C.J. Torsional Analysis of Structural Steel Members; American Institute of Steel Construction: Chicago, IL, USA, 1997. [Google Scholar]
- Wu, J.; Agyeman Badu, O.; Tai, Y.; George, A.R. Design, analysis, and simulation of an automotive carbon fiber monocoque chassis. SAE Int. J. Passeng. Car-Mech. Syst. 2014, 7, 838–861. [Google Scholar] [CrossRef]
Disclaimer/Publisher’s Note: The statements, opinions and data contained in all publications are solely those of the individual author(s) and contributor(s) and not of MDPI and/or the editor(s). MDPI and/or the editor(s) disclaim responsibility for any injury to people or property resulting from any ideas, methods, instructions or products referred to in the content. |
© 2025 by the authors. Licensee MDPI, Basel, Switzerland. This article is an open access article distributed under the terms and conditions of the Creative Commons Attribution (CC BY) license (https://creativecommons.org/licenses/by/4.0/).