1. Introduction
Drilling core sampling and chemical analysis represent the most direct and conventional methods for quantifying mineral element concentrations in solid mineral deposits. However, these approaches suffer from three major limitations: a low drilling efficiency, high sampling costs, and lengthy chemical analysis cycles [
1]. In existing uranium mines in China—particularly in northern oil and gas basins such as the Songliao Basin, Ordos Basin, and Yili Basin [
2]—it is common for the uranium content to be low, the ore layers to be thin, and the uranium-bearing layers to be dispersed. For example, the minimum recoverable content of sandstone type uranium deposits is only 0.01%, with a recoverable thickness of just 70 cm or more. Consequently, quantitative methods based on core chemical analysis further exacerbate the abovementioned three limitations.
Approximately 99% of natural
-ray radiation originates from the uranium and thorium decay series, as well as potassium in the Earth’s crust. Consequently, uranium exploration relies heavily on natural
-ray logging, including both total count and spectral logging methods [
3,
4,
5]. In both uranium exploration and in situ leach (ISL) uranium mining—collectively referred to as uranium prospecting and mining activities—quantitative interpretation primarily relies on natural
-ray logging. This is typically supplemented by core chemical analysis to determine uranium concentrations. Furthermore, since U–Th–K mixed mineralization accounts for less than 5% of uranium deposits in China, natural
-ray total logging alone is generally sufficient for the preliminary estimation of uranium (or radium) content in uranium-bearing layers [
6,
7].
It should be noted that uranium and thorium are the parent nuclides of the uranium and thorium decay series, respectively. These parent nuclides do not emit
-rays directly; instead, certain daughter nuclides—referred to as gamma-emitting nuclides—are responsible for
-ray emissions [
8,
9]. When the decay rates of the parent and daughter nuclides are equal, the system is said to be in a state of radioactive equilibrium. Under such conditions, the uranium and thorium decay series enable the quantification of uranium, thorium, and their progeny, based on
-rays emitted by their respective gamma-emitting nuclides [
10,
11].
Typically, the thorium series in nature readily achieves radioactive balance, making thorium content determination via thorium series
-rays straightforward. However, the uranium–radium–radon balance within the uranium series is rarely maintained. When dividing the uranium series into two subsections—the uranium subsection and radium subsection—the subsection balance becomes more attainable. Critically, the radium-subsection contributes over 97% of total
-ray emissions in the uranium series, enabling reliable radium content determination from uranium-series
-rays. Conversely, uranium content derivation carries substantial risk. Therefore, with radium-derived
-rays dominating the signal, the uranium content interpreted from logs lacks guaranteed reliability. This necessitates the
exploration specifications on in situ leaching sandstone type uranium deposits [
12] to require core chemical analysis for no less than 30% of samples to obtain the uranium–radium–radon balance coefficient for content correction [
13]. Consequently, this approach fails to eliminate the “three kinds of shortcomings”.
Theoretically, prompt neutron logging utilizing pulsed neutron-induced uranium fission responds exclusively to uranium (
235U), making it an ideal method for uranium quantification [
14,
15,
16,
17]. However, compared to natural
-ray total logging, the neutron yield from uranium fission is extremely low, resulting in very slow logging speeds that render prompt neutron logging impractically inefficient [
18,
19,
20]. To address this issue, a combined logging method has been developed. Although the count rates—measured in counts per second (cps)—from prompt neutron logging at individual borehole measurement points are low, the cumulative count rate across the entire uranium-bearing layer remains significant. By first using natural
-ray total logging to determine the radium-subsection content at each measurement point within the uranium-bearing layer and then applying the total prompt neutron count rate to calculate the average uranium content of the entire layer, the uranium–radium–radon balance coefficient of the uranium-bearing layer can be derived. This coefficient is subsequently used to correct the radium content to uranium content at each measurement point. With this method, core chemical analysis is no longer required, allowing for the rapid and accurate determination of the true uranium content at all measurement points [
21].
2. Uranium Quantitative Forward Equation of the Combined Logging
Typically, -rays generate negligible count rates in neutron detectors such as 3He proportional counters, whereas neutrons can induce inelastic scattering and capture reactions in surrounding formations and borehole materials, resulting in the emission of secondary -rays. However, most prompt neutron logging instruments are equipped with natural -ray total logging (or spectral logging) capabilities. When the distance between -ray detectors and neutron detectors is less than 1.5 m, these inelastic and capture -rays can be detected by the -ray detectors, thereby contributing background count rates to the -ray logging signal. As a result, the natural -ray logging function integrated into prompt neutron logging instruments is not directly used for uranium quantification but serves primarily to identify whether the instrument has entered a uranium-bearing layer. In contrast, prompt neutron time spectrum logging typically exhibits count rates one to two orders of magnitude lower than those of natural -ray total logging. This low logging efficiency, combined with the high operational cost and limited lifespan of neutron tubes, has hindered the broader adoption of this method. To overcome these limitations, this study proposes a uranium quantification method that leverages natural -ray total logging as the primary measurement and employs prompt neutron time spectrum logging to correct the results. This approach not only enhances the logging speed but also achieves rapid low-cost uranium quantification.
Common prompt neutron time spectrum logging instruments typically position the
-ray detector in the upper section and the neutron detector in the lower section of the tool. Logging data are acquired during the instrument’s upward movement [
16,
22,
23]. Using the center of the
-ray detector as the reference point and assigning its depth coordinate accordingly, the logging data from both detectors, when each reaches this reference position, are recorded as co-located depth point data. This method achieves the spatial integration of the measurement points.
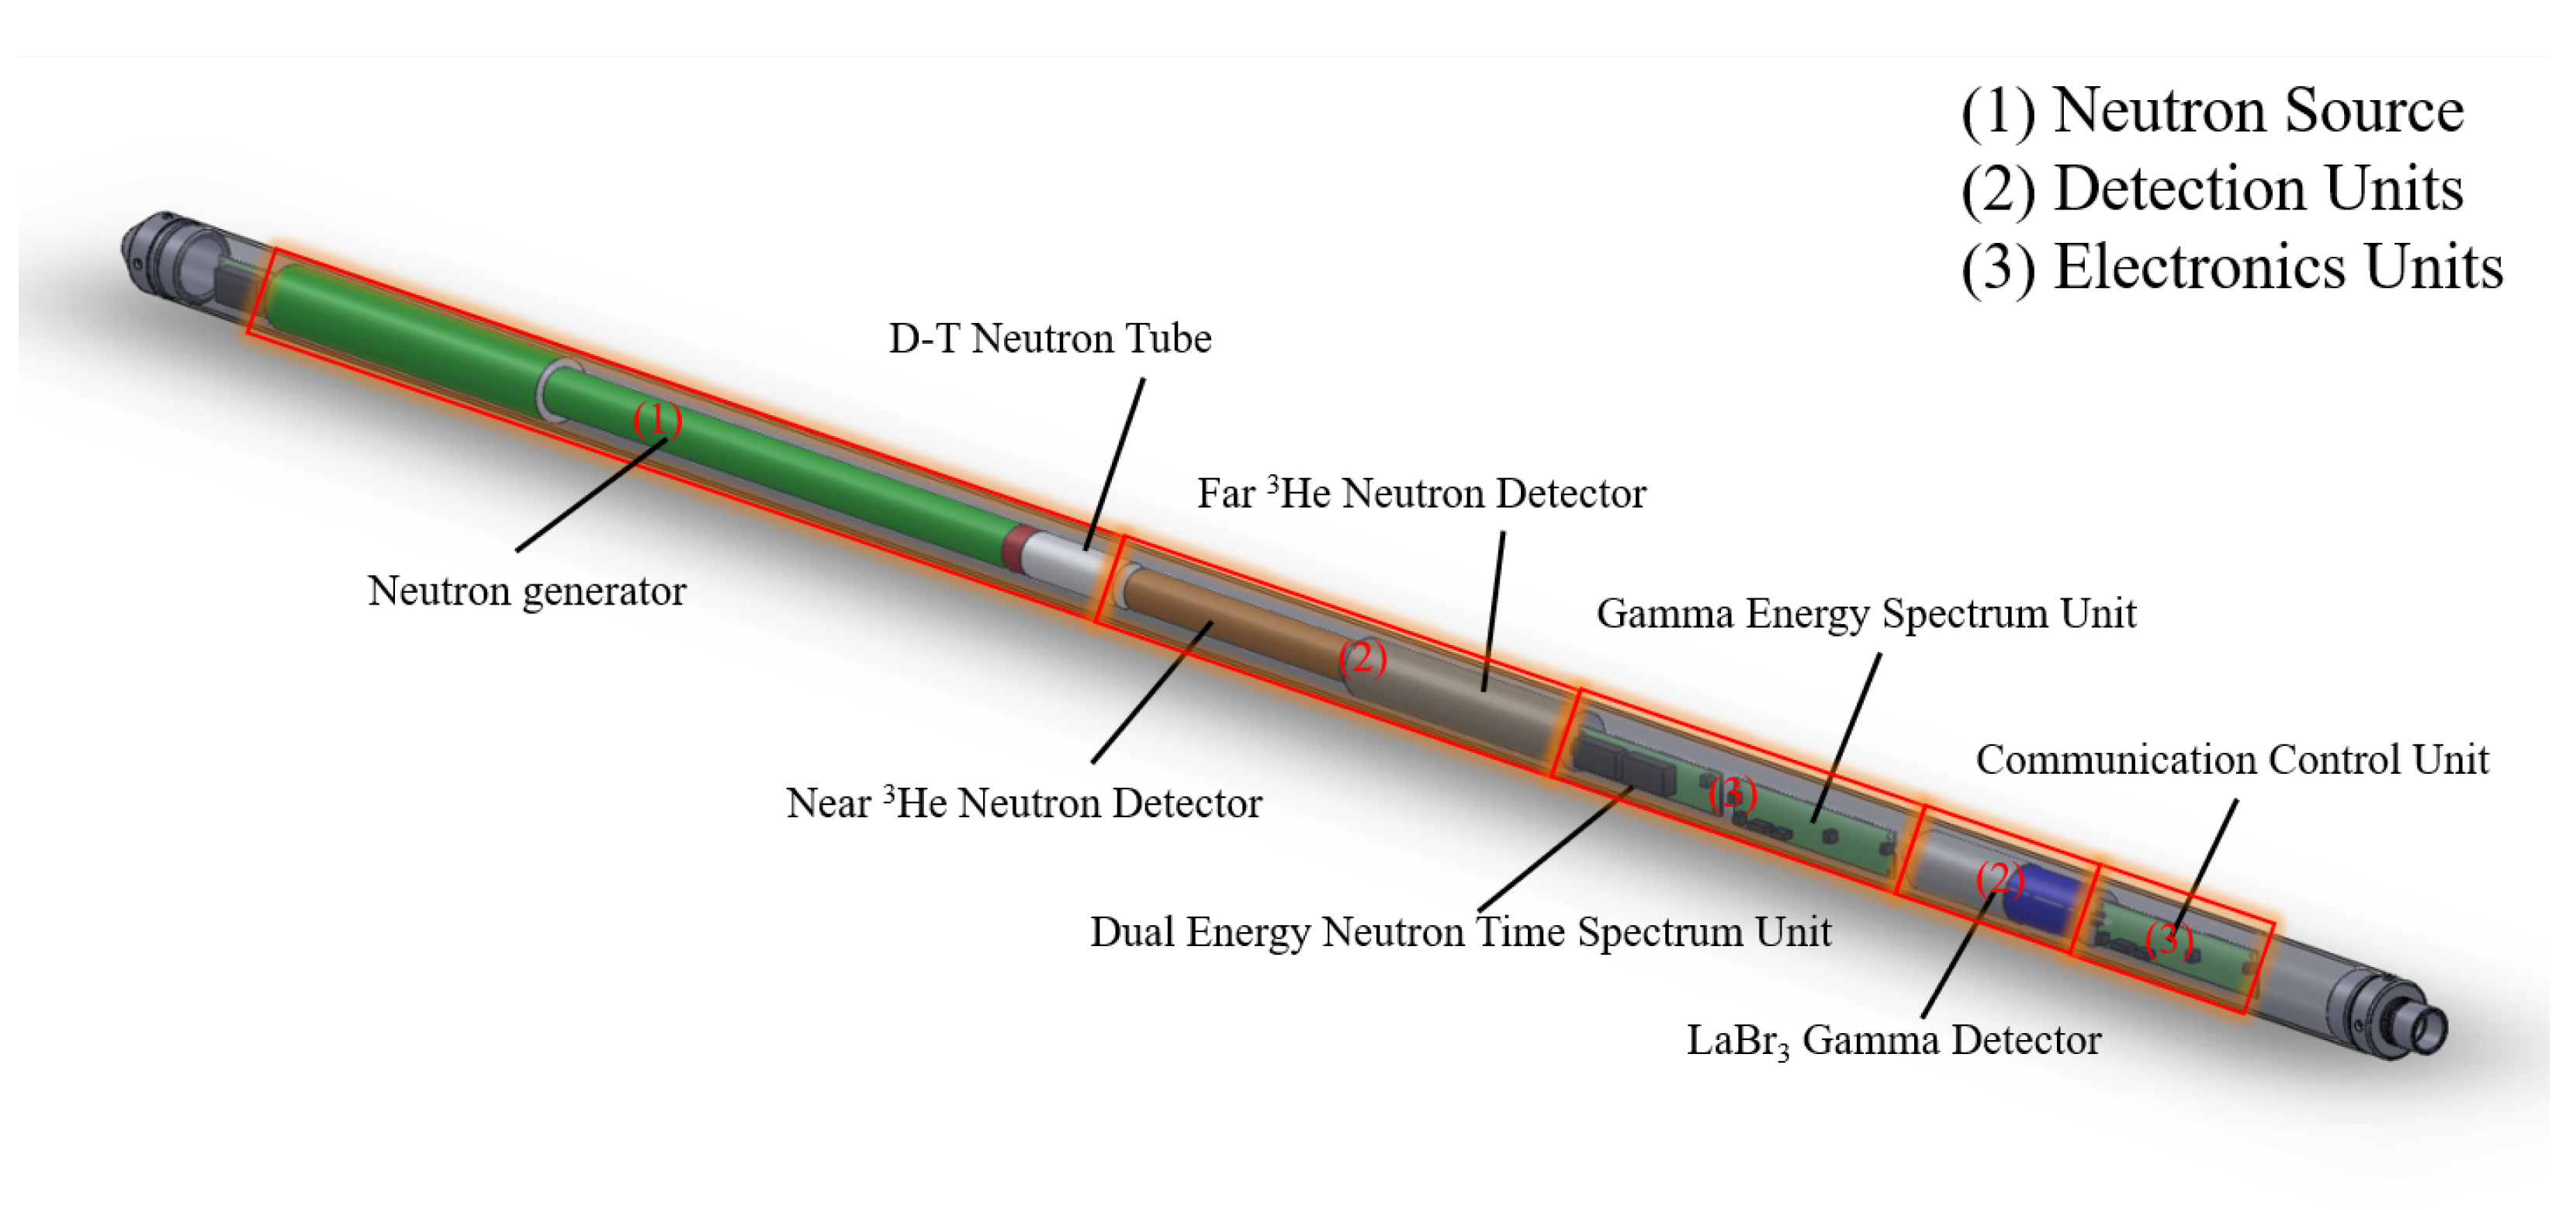
The self-developed combination logging instrument (structural schematic shown in
Figure 1) consists of three main components:
- (1)
Neutron Source: D-T neutron tube and neutron generator;
- (2)
Detection Units: two 3He neutron detectors and one -ray detector;
- (3)
Electronics Units: dual energy neutron time spectrum unit, -ray energy spectrum unit, and communication control unit.
Regarding proximity to the neutron source, the near 3He neutron detector, shielded with cadmium, detects epithermal neutrons, while the far 3He neutron detector measures thermal neutrons within the borehole. The lanthanum bromide (LaBr3) -ray detector is positioned distally to minimize interference from neutron-induced -rays and is specifically used to quantify uranium-derived -rays for uranium quantification within the uranium-bearing layer.
Since the count rates of the prompt neutron time spectrum logging exhibit proportionality solely to uranium content within the uranium-bearing layer [
24], and considering that uranium quantification may neglect or subtract contributions from thorium-series and potassium
-rays (including uranium-series
-rays), the count rates of natural
-ray total logging primarily correlate with radium content in the uranium-bearing layer [
25]. By conceptually dividing the uranium-bearing layer along the borehole into infinitely thin layers, where
denotes uranium or radium content and
represents the corresponding count rates of natural
-ray total logging and prompt neutron time spectrum logging, a functional relationship is established:
This expression is referred to as the integral form of the forward equation for uranium quantification. Here,
and
denote the uranium content and prompt neutron time spectrum logging count rates within infinitesimally thin uranium-bearing layers, respectively, while
and
represent the radium content and natural
-ray total logging count rates within the same layers. Additionally, the thickness of a thin uranium-bearing layer at borehole depth coordinate
z is represented by the differential element
. The differential expression for logging count rates generated by this thin uranium-bearing layer at depth coordinate
Z is
In the formula, Z and z denote the depth coordinates of any measurement point in the borehole and any point within the uranium-bearing layer (i.e., a thin uranium-bearing layer), respectively. Here, represents the distance from any measurement point Z to a uranium-bearing thin layer at coordinate z.
and denote the thicknesses of the upper and lower segments of the uranium-bearing layer when divided at point z along the borehole direction, where represents the total thickness of the uranium-bearing layer.
represents the uranium or radium content in a thin uranium-bearing layer at depth coordinate z, where the subscript k (=) distinguishes uranium () from radium ().
represents the logging count rates at measurement points (depth coordinate Z) within the uranium-bearing layer, where the subscript k (=) distinguishes between for the prompt neutron time spectrum logging count rates (uranium quantification), and for the natural -ray total logging count rates (radium quantification).
is designated as the geologic pulsed response function, characterizing the variation pattern of logging count rates responsive to any thin uranium-bearing layer. Specifically, the value of decreases with the increasing distance between measurement points and the thin uranium-bearing layer. This decay behavior is approximated by a negative exponential function, where is termed the characteristic parameter representing the decay rate. The magnitude of depends on the radiation type and interaction mechanisms between -rays and the uranium-bearing layer.
is termed the conversion coefficient, representing the logging count rate solely produced by the unit uranium content (or unit radium content) at the center of a saturated ore layer. Here, a saturated ore layer refers to an “infinitely thick” saturated ore layer, practically defined as having both upper segment thickness and lower segment thickness exceeding 0.6 m (measured from the central position of the saturated layer). Note that the radium content is conventionally expressed as equilibrium uranium content. In saturated ore layers composed of equilibrium uranium-series elements, uranium content and radium content are numerically equal, i.e., . However, the corresponding logging count rates differ, indicating that remains a constant parameter determined by the ore composition and uranium-bearing layer structure.
is termed the background response, encompassing background count rates (constant term) from environmental factors including logging instruments, formation strata, and borehole conditions. Specifically, the background count rates for natural -ray total logging also incorporate contributions from inelastic and capture -rays. This effect becomes particularly pronounced when the distance between the two types of detectors is less than 1.5 m, as inelastic and capture interactions induced by neutrons interacting with the uranium-bearing layer and borehole materials become notably significant.
In summary, both the integral expression (1) and differential expression (2) above constitute forward equations for uranium quantification that solve for the distribution of uranium and radium contents within the uranium-bearing layer along the borehole direction. Among these, the integral expression serves as the most widely adopted forward equation for uranium quantification.
Figure 1.
Self-developed combined logging tool.
Figure 1.
Self-developed combined logging tool.
3. Uranium Quantitative Inversion Method of Combined Logging
As indicated by the integral expression (1), the key to solving for the uranium and radium content
at any point within the uranium-bearing layer lies in the prior determination of the calibration parameters, including the conversion coefficient
and background response
. This process involves selecting a saturated ore layer (standardized model well). Since the uranium and radium contents
remain constant throughout the saturated ore layer,
at any depth coordinate
z can be regarded as a constant. This constant is represented by the value at the central point of the uranium-bearing layer (denoted as depth coordinate
):
. Therefore, the logging count rate
at any measurement point (depth coordinate
Z) is given by
Consequently, the logging count rates at any measurement point within the central portion of the saturated ore layer are also uniformly equal and can be represented by the central point value, expressed as
. Based on the equation above, the calculation formula for the conversion coefficient
is derived as follows:
Clearly, the background response
must be determined using the logging count rates obtained from a saturated ore layer that contains no radioactive elements such as uranium or radium—referred to as a zero-value saturated ore layer. By substituting
into Equation (
3), the following expression is obtained:
To minimize statistical errors, the calculation formula for the uranium–radium–radon balance coefficient can be derived using the calibration parameters—namely the conversion coefficient
and background response
—in conjunction with the measured epithermal neutron count rates
and natural
-ray total count rates
at each measurement point
within the target uranium-bearing layer [
1]:
For the natural
-ray total count rates, inversion calculations of radium content
at each measurement point are performed using Equation (
1) or Equation (
3), yielding quantitative estimates of the radium content. Then, applying Equation (
6), the corrected true uranium content
at each measurement point is determined using the following formula:
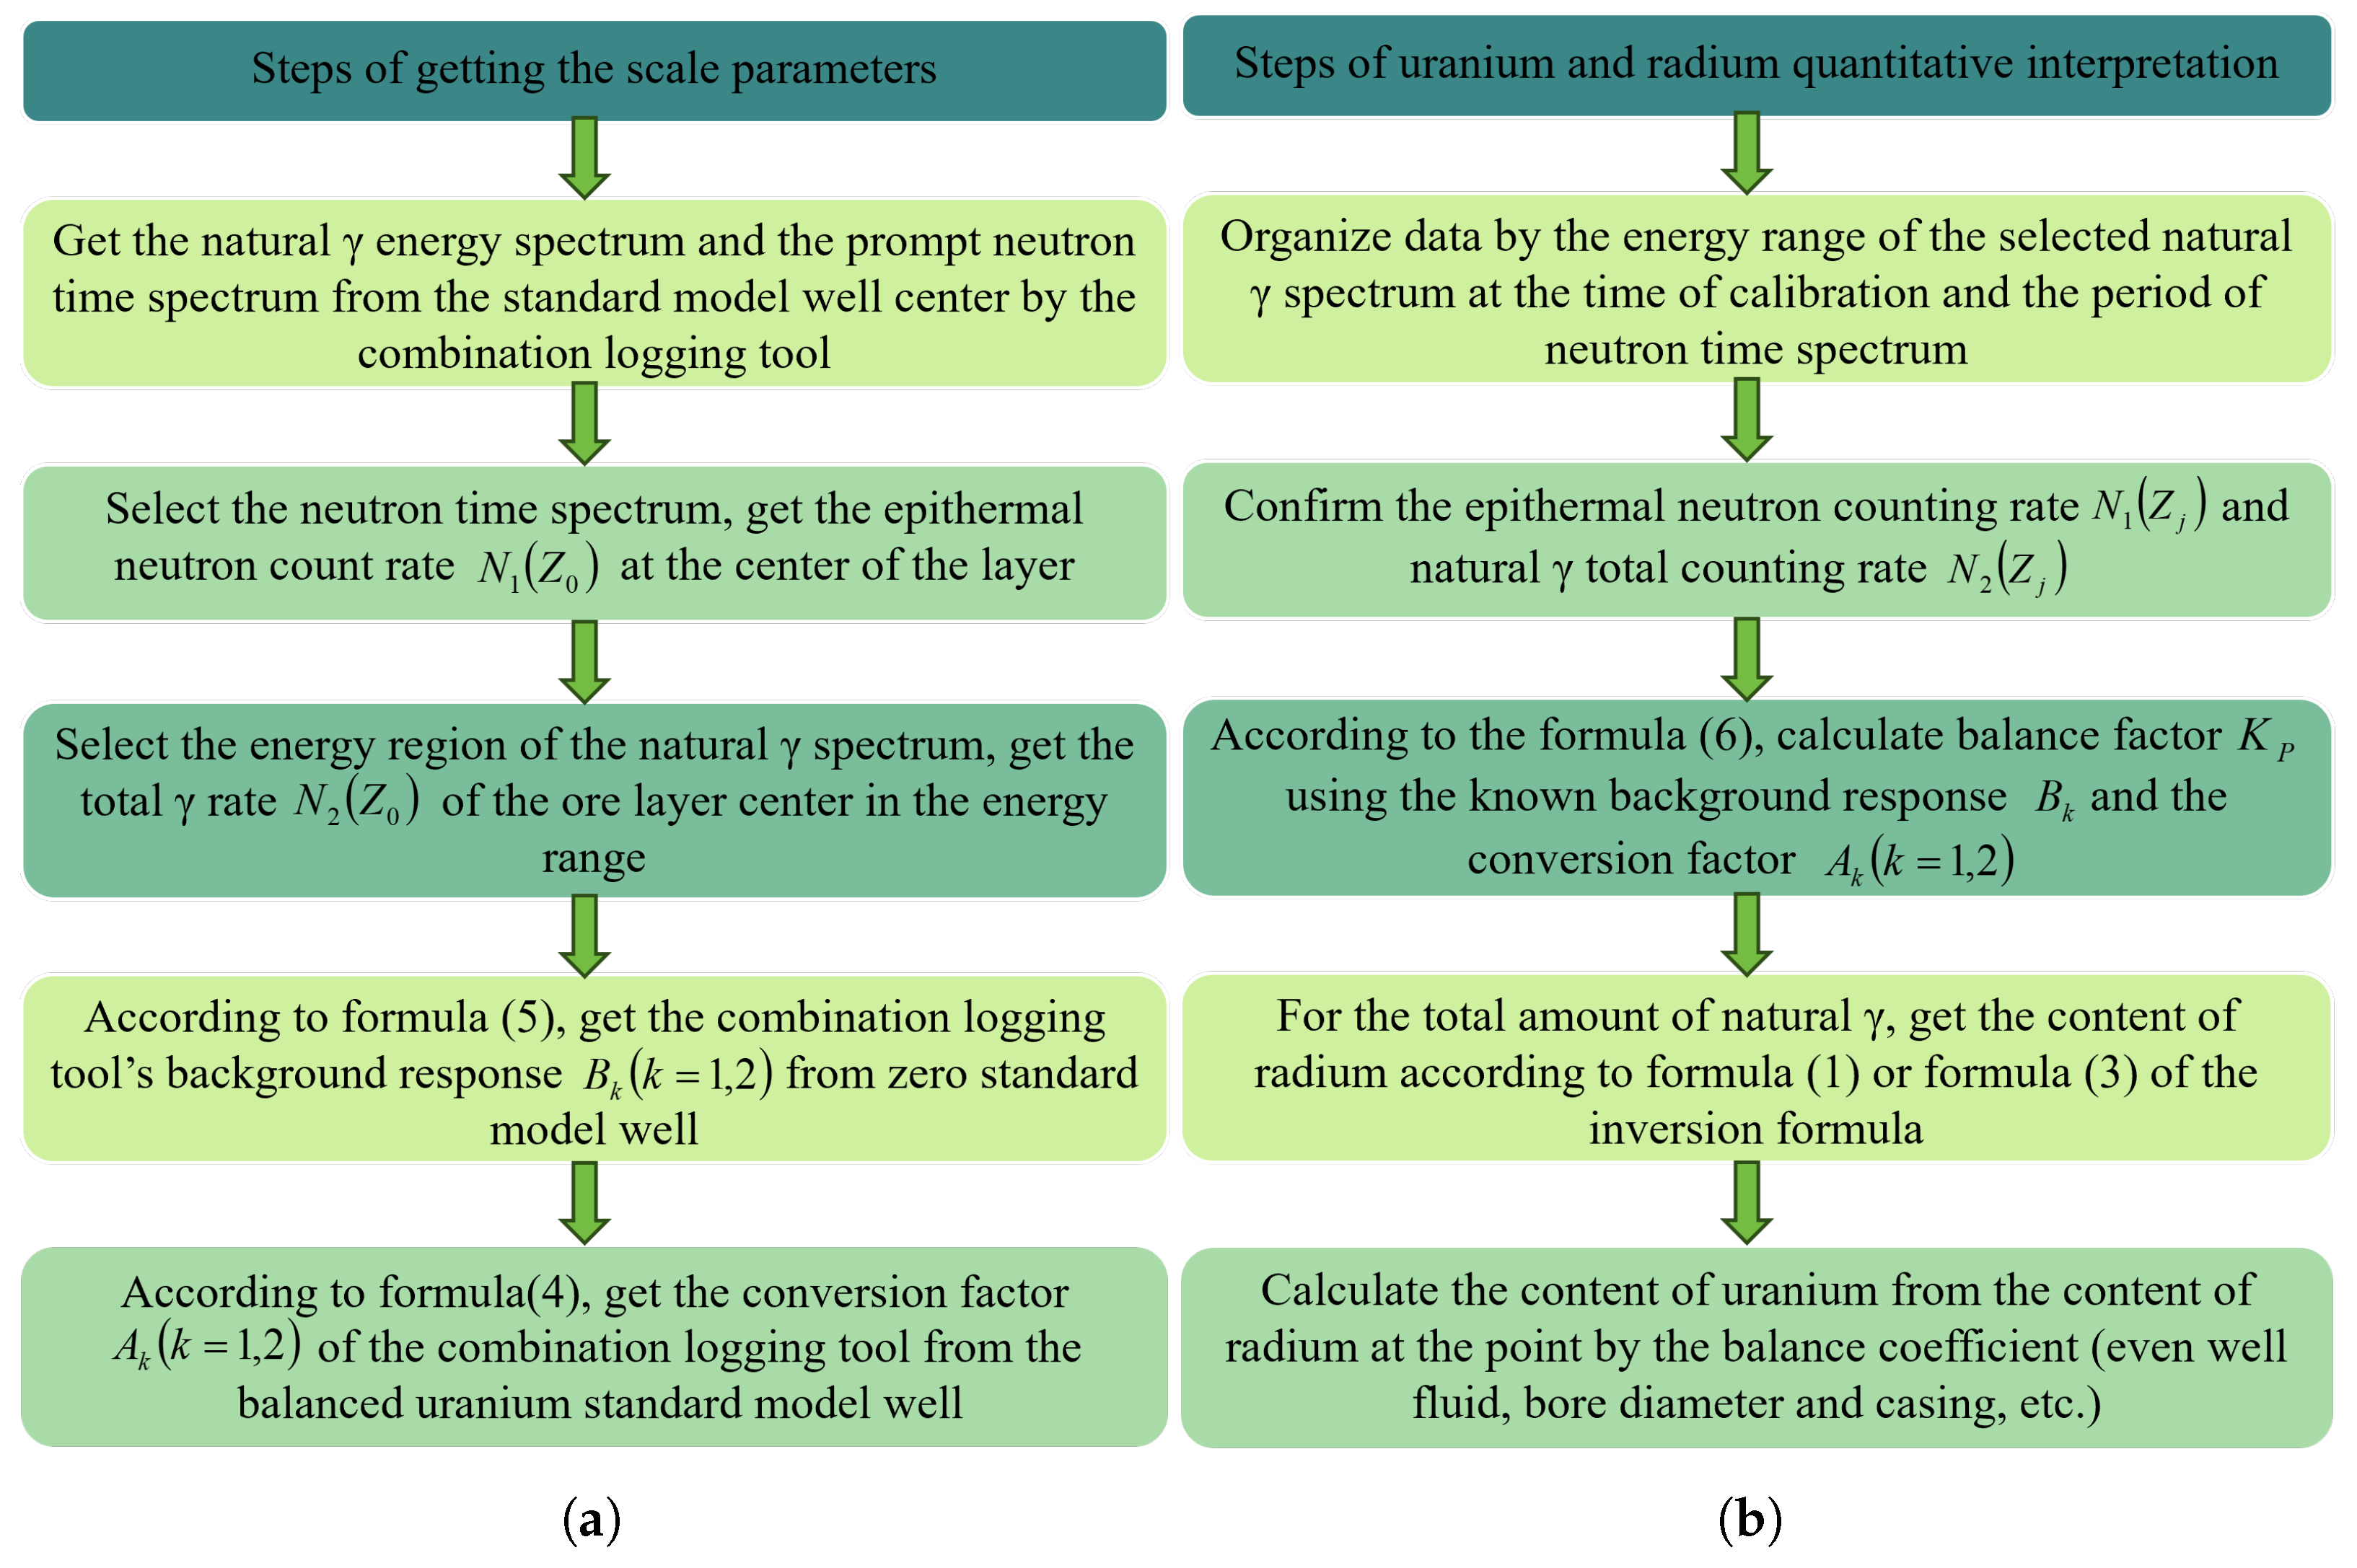
Figure 2a illustrates the procedure for determining the calibration parameters— specifically, the conversion coefficient
and background response
—of the combination logging instrument. This is accomplished through calibration experiments conducted in both a zero-value saturated ore layer model well and a saturated ore layer model well.
Figure 2b delineates the core workflow for uranium/radium quantitative interpretation, which comprises three sequential steps: the radium content inversion, uranium–radium–radon balance coefficient calculation, and true uranium content correction.
4. Experimental Data and Processing Result Analysis of Combined Logging
To effectively apply the conversion coefficient and background response for uranium quantification in field production logging, it is essential to construct saturated ore layer model wells that closely match the formation-rock layer composition, logging conditions, and borehole structure of field production wells. These model wells—referred to as standardized model wells—include equilibrium and disequilibrium uranium-series standardized uranium model wells, as well as standardized zero-value model wells. They are generally classified into at least two major types: sandstone-type standardized model wells and hard-rock-type standardized model wells.
To validate the uranium quantification method proposed in this study, verification experiments were conducted using a self-developed combined logging tool that combines natural
-ray energy spectrum logging and prompt neutron time spectrum logging (
Figure 1). These experiments were carried out at the Nuclear Industry Radiological Survey Metering Station in Shijiazhuang, Hebei Province, using standardized model wells. For the sandstone-type standardized model wells, the logging results included measured profiles from four central sections of saturated ore layers, encompassing both natural
-ray energy spectrum logging data and prompt neutron time spectrum logging data.
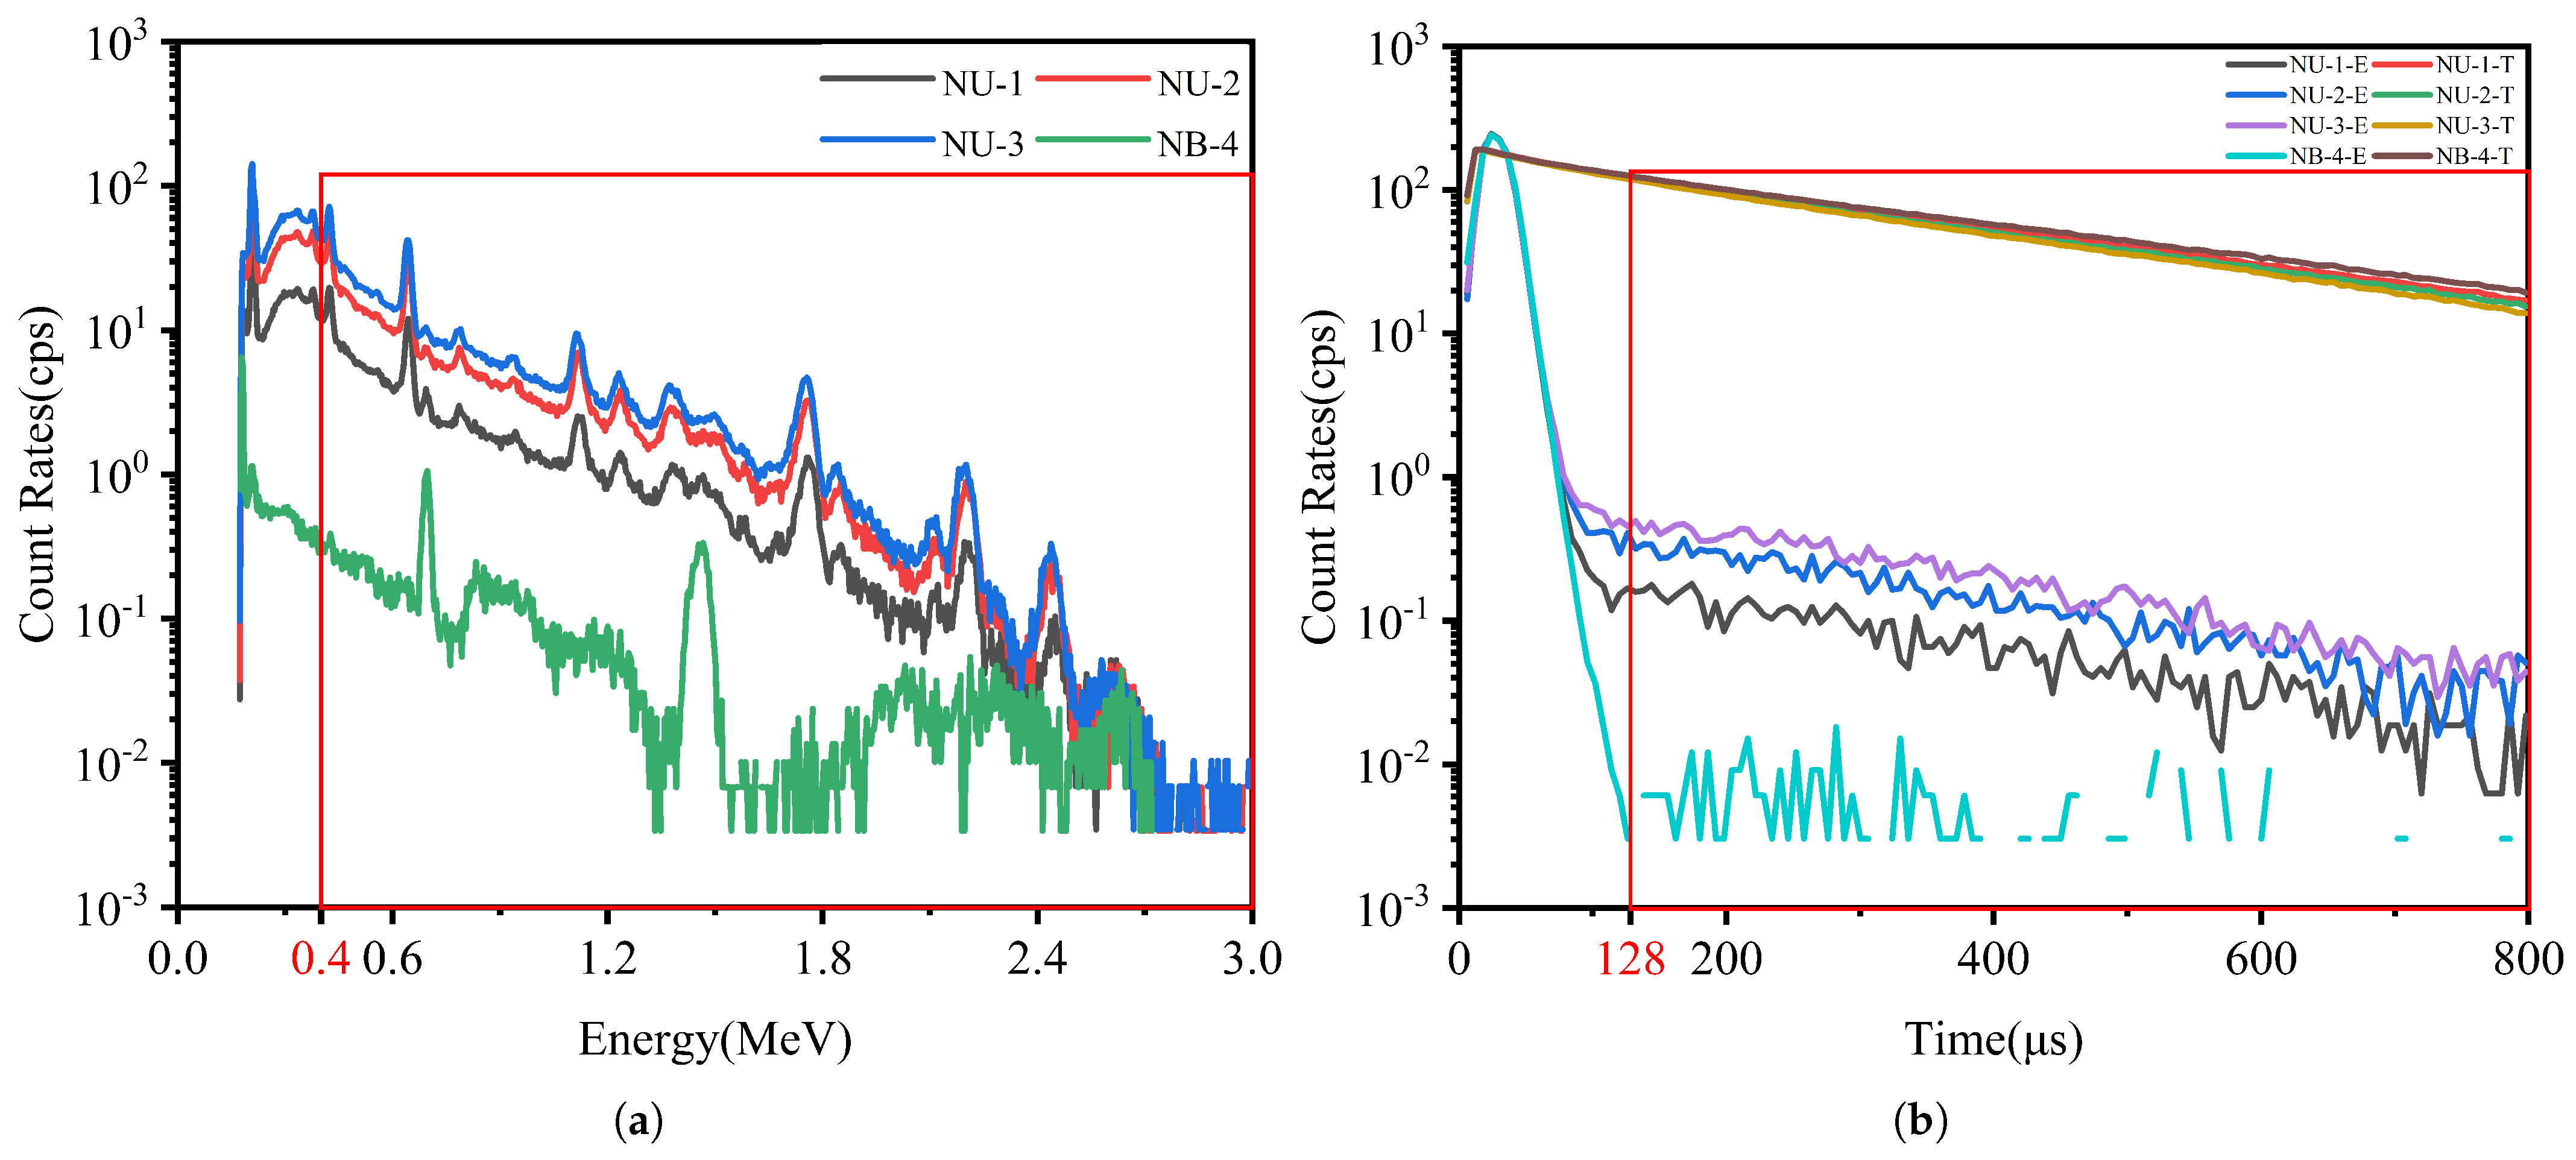
Figure 3a shows the natural
-ray energy spectrum within the central region of the measurement point, covering the energy range of 0–3 MeV.
Figure 3b displays the prompt neutron time spectrum within the same region, spanning a time range of 0–800 μs. It should be noted that the count rate for the natural
-ray total logging is derived from the
-ray energy spectrum curve, with the low-energy scattered
-rays below 0.4 MeV excluded. The count rate for the prompt neutron time spectrum logging is obtained from the epithermal neutron time spectrum curve, with neutron counts below 128 μs—primarily from source neutrons—excluded. Additionally, the epithermal neutron count rate curve is normalized using the thermal neutron count rate curve. The curves labeled NU-1-E to NB-4-E represent the epithermal neutron curves, while NU-1-T to NB-4-T denote the thermal neutron curves.
To determine the calibration parameters, including the conversion coefficient
and background response
, this study utilized a standardized zero-value model well (No. NB-4), where concentrations of radioactive elements (uranium, thorium, and potassium) were negligibly low. The logging count rates (
-ray count rates and epithermal neutron count rates) measured in this well were employed to determine
, as listed in
Table 1. Additionally, a disequilibrium uranium-series standardized uranium model well (No. NU-3) was selected, characterized by negligibly low thorium and potassium concentrations but significantly higher uranium and radium concentrations than the zero-value well. Using its measured count rates and
, the conversion coefficient
was derived and is also listed in
Table 1. The radium content is expressed as the uranium content at radioactive equilibrium, with both uranium and radium content units unified as
eU (equivalent uranium).
To validate the feasibility of the uranium quantification methodology and calibration parameters, this study arbitrarily selected two disequilibrium uranium-series standardized uranium model wells (No. NU-1 and NU-2), both exhibiting negligibly low concentrations of other radioactive elements (such as thorium and potassium). Utilizing the saturated ore layer equations for uranium and radium content (Equation (
3)), the uranium and radium contents of these saturated ore layers were derived based on the measured logging count rates and calibration parameters
and
listed in
Table 1, with the results summarized in
Table 2.
Table 2 demonstrates that for sandstone-type standardized model wells with low thorium and potassium concentrations, the combined logging methodology combining natural
-ray total logging and prompt neutron time spectrum logging developed in this study achieves accurate uranium and radium quantification. The absolute error of uranium content is within
eU, with a relative error of within
, fully meeting the requirements specified in the
exploration specifications on in situ leaching sandstone type uranium deposits [
12].
Without applying prompt neutron time spectrum logging to correct the uranium–radium–radon balance coefficient
, the calculated
values are 0.87 for NU-1 and 0.92 for NU-2. The radium contents derived from the natural
-ray total logging are consistent with those presented in
Table 2. Based on these radium contents and the corresponding
values, the inferred uranium contents are shown in
Table 3. By comparing the results in
Table 3 with those in
Table 2, it can be observed that for Borehole NU-1, the combined logging method performs better than the traditional natural
-ray total logging method. However, in Borehole NU-2, the natural
-ray total logging yields slightly better results. Overall, both methods provide essentially consistent results for uranium quantitative interpretation, while the combined logging method offers the advantage of faster on-site interpretation.
As shown in
Table 1, the conversion coefficients for radium and uranium quantification are
and
, respectively. This signifies that a saturated ore layer with 0.01% uranium content generates a natural
-ray total count rate of 271.36 cps but only an epithermal neutron count rate of 3.55 cps—a difference approaching two orders of magnitude. The experimental results indicate that the count rate of the prompt neutron time spectrum logging is relatively low. In order to reduce statistical fluctuation errors, the maximum logging speed of this method falls significantly short of the 2–4 m/min standard required by the
exploration specifications on in situ leaching sandstone type uranium deposits [
12].
Accordingly, this study proposes a method in which, for the entire uranium-bearing layer, the summed logging count rates of both logging methods are calculated separately. This cumulative value inherently exhibits minimal statistical fluctuations. The average radium and uranium contents within the interval are then determined, and the uranium–radium–radon balance coefficient for the ore interval is calculated as the ratio of these average contents. Subsequently, natural -ray total logging, which features negligible statistical fluctuations, is used to quantitatively interpret radium content at each measurement point. Finally, the true uranium content at each measurement point is obtained by applying the correction based on this balance coefficient.
5. Conclusions
This study proposes a uranium quantification method based on correcting natural -ray total logging using prompt neutron time spectrum logging. Specifically, the approach integrates natural -ray total logging with prompt neutron time spectrum logging to establish a combination logging methodology. It derives the calculation methods for the calibration parameters, including the conversion coefficient and background response , as well as the method for determining the uranium–radium–radon balance coefficient for the entire uranium-bearing layer. Subsequently, the radium content at each measurement point within the ore interval is obtained by inversion using the forward equation of natural -ray total logging for uranium quantification. Based on the uranium–radium–radon balance coefficient of the entire uranium-bearing layer, the radium content at each measurement point is corrected to obtain the true uranium content.
In this study, the background response was derived from a standardized zero-value model well (No. NB-4), and the conversion coefficient was determined using a disequilibrium uranium-series standardized uranium model well (No. NU-3). These calibration parameters were applied to calculate the uranium content in two disequilibrium uranium-series standardized uranium model wells (Nos. NU-1 and NU-2). The experimental results demonstrate that the absolute error of the true uranium content is within eU, and the relative error is within . Compared to prompt neutron time spectrum logging, the proposed method can improve the logging speed while achieving results that are basically consistent with those obtained by the traditional natural -ray total logging method, thereby validating the feasibility of the proposed uranium quantification interpretation method and calibration parameters.
The primary advantages of the uranium quantification method presented in this study are that it eliminates the need for core sampling and chemical analysis, thereby overcoming the “three kinds of shortcomings” associated with core-based chemical assays. At the same time, it addresses the low efficiency and high costs caused by the low count rates of prompt neutron time spectrum logging. Consequently, this approach enables prompt neutron time spectrum logging to serve as an auxiliary uranium quantification method in uranium exploration and extraction—particularly for in situ leach mining.
The uranium quantification method proposed in this study has so far only been validated in sandstone-type standard model wells, without fully accounting for the various challenges encountered in real-world uranium exploration. In future work, this method will be extended to hard-rock-type uranium deposits and more diverse geological settings, accompanied by validation through actual uranium exploration practices.


 ,
, 
