Featured Application
The proposed numerical simulation model creates a basis for the optimization of dynamic, operational and economical parameters of truck vehicles, such as power, revolutions, torque, fuel consumption, dynamic ratios and their relation to the particular components of the drive and transmission mechanism of the vehicle or additional components, for example, of the additional gearbox, shafts, differentials, final drives, wheels, etc. All above-mentioned parameters can be monitored but not only as instantaneous values; it is also possible to analyze their dependence on the input conditions. Thanks to the created model, it is possible to simulate the reaction of the system and its components to the various external influences, such as changes in the driver’s power requirements, braking of the vehicle, changes in the terrain gradient, changes in the surface or various wind conditions. Furthermore, these parameters can also be analyzed for the different total weights of the vehicle. Reactions of the system can be analyzed for the various parameters of the components, for the modified control logic of the components and parameters defining the behavior of the system, for example, the shift map, characteristics of the logic of the cruise control system, etc.
Abstract
Nowadays, many various types of drive and transmission mechanisms characterized by various parameters and characteristics for different types of vehicles have been designed, developed and optimized with regard to the featured applications. Our research is focused on the creation of a complex simulation model of the drive and transmission mechanism of the vehicle Iveco LMV 4 × 4 M65. The correctness of the simulation model was verified using an analytical approach. The created numerical simulation model will serve as a basis for the further optimization of dynamic, operational and economical parameters of the vehicle. As the modification or replacement of the particular components of the drive and transmission mechanism is very complicated regarding the vehicles used in military operations, our research is focused on the enhancement of the control processes. More specifically, the main goal of the presented research activities is the modification of the gearshift logic and the adjustment of the gearshift map in order to improve the dynamic properties of the vehicle and, at the same time, reduce the fuel consumption. In spite of its complexity, the proposed simulation model can serve as a basis for the optimization of not only the gearshift control under specific input or output quantities and operational or environmental conditions but also for the simulation of the system behavior with modified or replaced components of the drive and transmission mechanism of this type of truck vehicle.
1. Introduction
The drive and transmission mechanisms in vehicles are a part of any vehicle, serving as the interconnections between the engine’s power and the wheels that drive the vehicle forward. This system is applied for control over the speed and direction of the vehicle, allowing it to operate in various road conditions and terrains. This technology has been the subject of numerous researchers, with the goal to enhance the fuel efficiency or overall performance of vehicles with manual or automatic transmissions.
In many cases, the research is focused on the design and fabrication process of mechanical components of the drive or transmission mechanisms of vehicles [1]. Together with the research and development of drive and transmission mechanisms, it is necessary to analyze their structural and kinematic characteristics [2,3] or perform failure analysis [4]. The optimization process can be focused on the selection of the most convenient commercially available components, such as a pump, and their influence on the fuel economy [5]. However, in military applications, especially considering already used vehicles, it is a very complicated and time-consuming process to modify the mechanical construction or to replace the components of the vehicles. Therefore, our research is focused on the creation of the simulation model of the drive and transmission mechanism of the vehicle.
A significant number of research and development teams have been currently focused on electric vehicles, the estimation of their energy consumption [6], energy management strategies to extend the operational range of the electric vehicles [7] and the determination of factors influencing the economy of electric vehicles [8].
The analysis of stability under different conditions, such as in the case of failure of a single wheel in four-wheel vehicles [9], is also very important. In addition to the static characteristics, many research teams focus on the analysis of the dynamic characteristics of vehicles, including, currently, electric [10,11] or hybrid vehicles [12]. The ecology is also very relevant; therefore, many research and development activities are also focused on the eco-driving strategies [13] for fuel cell vehicles and fuel cell power supply systems [14]. Attention is also paid to the development of protection systems [15]. Interesting is the research comparing the performance of series-parallel hybrid transmissions with multiple gears and modes based on efficiency models [16].
Tracked vehicles [17,18,19] have many singularities in comparison to other types of vehicles. Furthermore, they are often operated in complicated driving conditions [20]. However, uneven roads and climbing characteristics have been a subject of research also in the case of wheeled vehicles [21,22,23].
The optimization process is a very complex issue and can be analyzed and studied from various points of view. Research can be focused, for example, on the optimization of driving control strategies [24,25]. The optimization of gearshift mechanisms and their control is usually focused on the selected parameter or components, such as optimal control for the shift mechanism of a planetary two-speed transmission [26], novel two-speed transmission mechanism for battery electric vehicles [27] or shifting strategy for electric heavy trucks with automated manual transmission based on extended Kalman filtering and reinforcement learning [28]. Optimization can also be carried out for the driving torque control strategies [29] or gear-shifting algorithms, which can be based, for example, on fuzzy regulators [30] or collision models [31]. Both adaptive [32] and steering-cooperative seamless gearshift control [33] also belong to perspective methods. For many applications, it is necessary to optimize the torque control [34,35,36]. However, in addition to torque control, it is often required to analyze the influence of vibrations [37,38,39].
To enhance efficiency, performance or other parameters and characteristics, many various approaches can be applied [39,40]. Research can be, in general, focused on mathematical modeling [41,42] or on the application of simulation models [43,44] of various types or components of the different types of drive and transmission systems. As the drive and transmission mechanism is a very complex system, in the articles, usually only a part of the research dealing with the chosen component or process is presented [45,46,47,48]. Very topical is the research focused on autonomous vehicles or even autonomous vehicle networks [49].
Considering the substantial variety of drive and transmission mechanisms for various types of vehicles with different engines, it is necessary to create a separate simulation model for every vehicle, in which the specific parameters and characteristics have to be involved. The simulation model has to involve all necessary inputs and affecting quantities.
Nowadays, a wide range of demanding requirements have to be fulfilled in modern military wheeled vehicles. One of the fundamental requirements is a high level of mobility, which can be evaluated from strategic, operational and tactical points of view. In this article, a specific type of vehicle used by special operations forces is presented. The nature of the tasks that these units perform and the characteristics of the operational environments in which they operate result in a requirement for a high level of dynamic properties. At the same time, however, due to the frequent absence of their own logistical support in the enemy’s rear, it is necessary to achieve high vehicle efficiency in terms of the economic and operational parameters of the vehicles. One of the most important operational parameters is their fuel consumption.
The main goal of our research is, therefore, to create a numerical and simulation model that can be used to optimize the parameters characterizing the dynamic, operational and economic properties of the Iveco LMV 4 × 4 M65 vehicle used for special purpose operations. However, the modification of the vehicle’s components is not possible in the Slovak Armed Forces for the vehicles that are currently in operation, so the main limitation of our work was that all components of the drive and transmission mechanism had to be preserved.
Therefore, our research is focused on the creation of an analytical and numerical simulation model of the drive and transmission mechanism of the Iveco LMV 4 × 4 truck vehicle. In the first phase, a hydrodynamic torque converter was connected to the gearbox block model of the ZF 6HP260 gearbox. Subsequently, the ideal source of angular velocity, or torque, was replaced by a block of a four-cylinder IVECO F1CE0489C diesel engine. Also, other mechanical components, for example, a reduction and transfer gearbox with rear differential, front differential, wheel reductions, axle shafts, drive wheels and tires, were subsequently added into the drive and transmission mechanism model.
For the verification of the complex model of the drive and transmission mechanism, the comparison of the values of the mechanical efficiency of the gearbox at particular gears achieved using analytical and numerical methods was performed. Consequently, the power, torque, traction and dynamic characteristics of the vehicle obtained using analytical and numerical methods were compared. After the verification of the correctness of the created numerical simulation model of the drive and transmission mechanism of the vehicle, it was possible to integrate the proposed model into the complex vehicle model, which will serve as a basis for the different optimization tasks for the optimization of the various parameters and characteristics related to the dynamic, operational and also economical parameters of the truck vehicle.
2. Analytical Model of the Drive and Transmission Mechanism
For the analytical calculations of the drive and transmission mechanism, parameters such as the efficiency, power, torque and dynamic factor of the vehicle were determined, as these are important parameters characterizing the resulting dynamic properties of the vehicle. And at the same time, these parameters are suitable for the comparison of the results obtained from the numerical analysis based on the created complex simulation model of the drive and transmission mechanism of the vehicle.
2.1. Mechanical Efficiency of the Gearbox
In mechanical gear transmissions, several types of losses are present. They are mainly caused by friction in terms of the contact of the gear teeth; however, if it is necessary to perform a deep analysis of the efficiency, other causes also, for example, the friction in the bearing of the gears and shafts or by the gear oil vortexes, have to be considered.
Due to the fact that in the planetary gear train (PGT) and Babineaux planetary gear train (RPGT) the power is transmitted not only by the relative motion (with losses in the contact of the gear teeth) but also by the drifting motion (without losses in the contact of the gear teeth), it is not possible to use the relation for the efficiency calculation of a gearbox with fixed shaft axes.
In the calculations, it is necessary to consider which part of the power is transferred by the relative and which part by the drift motion. Therefore, the procedure for the determination of efficiency is based on the general relation (1) for the mechanical transmission efficiency g:
where P2 is the power on the driven shaft, P1 is the power on the driving shaft, and the same indexes are applied for the driven and driving torques T2 and T1 and angular velocities ω2 and ω1, respectively. In Equation (1), ik is the kinematic transmission ratio, and iF is the force transmission ratio.
The kinematic ratio ik (2) can be defined as a function of the PGT parameters α that are in operation at a given gear:
The force transmission ratio iF (3) is a function of the kinematic ratios (PGT parameters) and of the efficiencies of these PGT parameters η, as it includes losses:
where η is the PGT efficiency (which is usually approximated to the value of 0.96), and x is the exponent with a value of ±1. To determine the + or − sign of the exponent, the following relation (4) was derived:
where ick is the kinematic gear ratio for a given gear.
After determination and application of the force transmission ratio iF (3) and the kinematic gear ratio ik (4) values, the efficiency value for a given gear can be determined. The resulting values of the mechanical efficiencies of the ZF 6HP260 gearbox are summarized in Table 1.

Table 1.
Analytically determined values of the gearbox mechanical efficiency.
Based on this table, it can be concluded that the ZF 6HP260 gearbox achieves the best mechanical efficiency in the most frequently used gears, which means from the 3rd to 6th gears.
2.2. Analytical Calculation of the Vehicle’s Dynamic Parameters
The basis for the design and verification of the drive and transmission mechanism of a vehicle is in its dynamics. Many various forces and moments act on the vehicle during driving. The vehicle therefore represents a complex mechanical system of objects with several degrees of freedom, and the detailed solution of the behavior of such a system is a very complex task. For the solution of the external dynamic conditions, it is possible to simplify the calculation model and to consider the vehicle as a single object. For this reason, it was not necessary to analyze in detail the internal forces and moments that act among the particular internal components of the vehicle. The external moments, forces and reactions used for the calculations are shown in Figure 1 and involve Fair—air resistance, Frf—rolling resistance of the front wheels, Frr—rolling resistance of the rear wheels, Fi—the vehicle’s inertia, Fs—terrain resistance, G—force of gravity, Frt—trailer drag resistance, Ftf—driving force of the front wheels, Ftr—driving force of the rear wheels, FNf—normal reaction of the front wheels, FNr—normal reaction of the rear wheels, γ—road/terrain gradient, L—wheelbase, l1—distance of the front wheels from the center of gravity, l2—distance of the rear wheels from the center of gravity, hg—height of the center of gravity and rd—dynamic wheel radius.
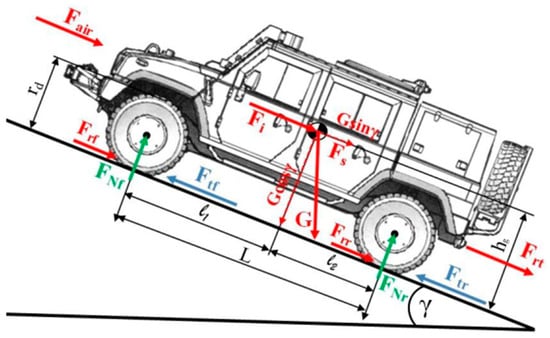
Figure 1.
Forces and moments acting on the vehicle while driving.
During the analysis of the vehicle’s behavior in straight-line driving, the dependence between the resistances and the driving effect of the engine and the entire drive and transmission mechanism of the vehicle were monitored. This dependence determines whether and how the vehicle moves, and thanks to this analysis, it is possible to also determine the values of the acceleration or deceleration of the vehicle and related forces and moments. In general, this dependence can be analyzed by applying relation (5) for the balance of power:
or the balance of forces (6):
where FT is traction force, Fr is rolling resistance, Fs is terrain resistance, Fair is air resistance, Fi is the vehicle’s inertia, FrT is trailer resistance, Pe is engine power, m is mechanical efficiency, and v the velocity of the vehicle.
To verify the correctness of the numerical model of the drive and transmission mechanism created in Matlab R2024b software and its modules, it was necessary to analyze the characteristics of the several quantities characterizing the movement and dynamic properties of the vehicle. With the increasing complexity of the model and the increasing simplifications applied during the calculations using the analytical method, it is necessary to increase the tolerance between the characteristics and values obtained using analytical and numerical methods. The deviation can be caused, for example, by the missing hydrodynamic component in analytical calculations, different initial conditions (idle speeds), insufficient accuracy of the input data (technical parameters obtained from the vehicle’s technical documentation), insufficient accuracy of the external characteristics of the IVECO F1CE0489C engine in the technical documentation of the vehicle and others. Nevertheless, it was necessary to perform this analysis to verify the behavior of the given system and to evaluate its functionality and usability for the analysis of other parameters. For these purposes, the power characteristics, torque characteristics, traction characteristics with driving force characteristics, driving resistance characteristics and dynamic factor characteristics were determined.
For the creation of the dependencies characterizing the dynamics of straight-line driving of the vehicle, the manufacturer’s data overviewed in the technical documentation of the IVECO LMV 4 × 4 M65 vehicle were used [50,51]. For the calculations, not only the dimensional and weight data of the vehicle but also parameters characterizing the particular components of the driving and transmission mechanism, for example, gear ratios, efficiencies, dimensions and inertias, were applied. Among the inputs for the analysis are the technical parameters of the IVECO F1CE0489C engine and its external revolution characteristics (Figure 2), which shows the dependence of the effective power and torque on the engine revolutions obtained from the technical documentation of the IVECO LMV 4 × 4 M65 vehicle.
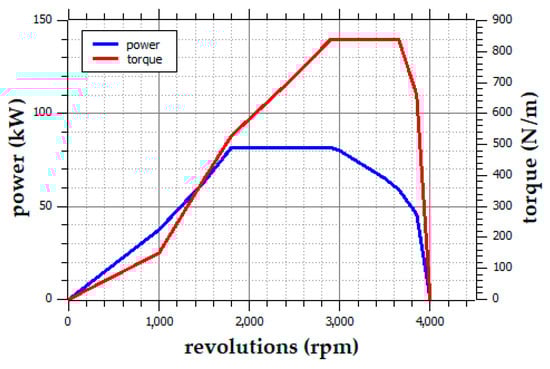
Figure 2.
External revolution characteristics of the IVECO F1CE0489C engine.
The calculation procedure for the creation of the characteristics then begins with the selection of the characteristic points of the external engine characteristics, the determination of the magnitude of the torques at the given points and the corresponding engine revolutions and the determination of the coordinates [Te, ne] and [Pe, ne]. The obtained values summarized in Table 2 are used for the transformation of the coordinates [Te, ne] to [FT, v], [Te, v] and [Pe, v]. Then, it is possible to apply the coordinates [Te, v] for the particular gears to plot the torque characteristics and to apply the coordinates [Pe, v] for the particular gears to plot the power characteristics. Consequently, the characteristics of the power values needed for driving can be plotted in the form of power characteristics. The coordinates [FT, v] were used for plotting the traction characteristics of the particular gears and for the creation of the traction characteristics from the traction resistance values. Finally, dynamic factor D can be calculated and visualized.
Table 2.
Parameters of the external revolution characteristics of the IVECO F1CE0489C engine.
2.3. Torque Characteristics
The graphical representation of the expression of the equilibrium of torques acting on the vehicle during driving in the form of torque characteristics shows the dependence of the engine torque Te considering the full fuel supply on the engine revolutions ne.
The engine torque values at the full fuel supply can be obtained directly from the external revolution characteristics of the engine. Another important relation that has to be considered during the creation of the torque, traction and power characteristics of the engine and vehicle is Equation (7) for the calculation of the current vehicle speed:
The torque characteristics of the IVECO F1CE0489C engine shown in Figure 3 can be obtained as the dependence of the torque on the vehicle speed related to the external engine characteristics, considering the dynamic radius of the driving wheel rd obtained from its static value rs given in the vehicle’s technical documentation and the overall gear ratios ic for every gear.
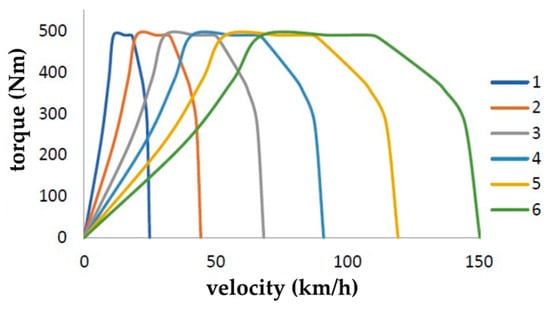
Figure 3.
Analytical torque characteristics of the IVECO F1CE0489C engine.
Torque characteristics have a wide range of application possibilities. However, for the purposes of this part of the research, they are primarily used to verify the torque characteristics obtained numerically. Due to the simplifications of the analytical method (especially the absence of a hydrodynamic member and different initial conditions), the course of the values of the analytical method was modified by a numerical tool for the purpose of this comparison.
2.4. Power Characteristics
Power characteristics are a method of graphical visualization of the balance of powers. They show the dependence of the usable engine powers and the powers required to drive the vehicle as the dependence on its speed. Power characteristics are therefore a graphical representation of the results obtained by the solution of Equation (5).
Similarly to the torque values, the power values at full fuel delivery are obtained directly from the external engine revolution characteristics overviewed in Table 2. In the equation for the determination of the vehicle speed (7), the engine revolutions corresponding to the given points of the external engine characteristics and other necessary parameters were applied. In this way, the values of the usable engine power at all gears can be obtained.
To calculate the power (8) required to overcome the driving resistance, a modified version of Equation (5) can be used:
where Pe is engine power, ηm is the mechanical efficiency of the drive and transmission mechanism, v is the vehicle speed, g is gravitational acceleration, m is the vehicle mass, α is the terrain slope angle, f is the rolling resistance coefficient, ρ is air density, cx is the air resistance coefficient, S is the vehicle frontal area, ϑ is the rotating mass resistance coefficient, a is vehicle acceleration, ψ is the road resistance coefficient, m’ is the trailer mass, and γ is the coupling angle.
At the same time, there is a relation (9) between the engine power, its torque and revolutions:
where Te represents engine torque, ωe the engine angular velocity and ne the engine revolutions.
Figure 4 shows the characteristics of the usable powers of the IVECO F1CE0489C engine at full fuel supply for particular gears together, with the values of power required to overcome the driving resistance at different terrain slope angles visualized by the dashed line. Based on the analysis of the power characteristics, it is possible to get a very good overview of the vehicle’s driving characteristics, such as its maximum speed in straight-line driving, its climbing ability at individual gears, the required gear to overcome the resistance considering the given terrain slope angle, the maximal speed for a certain terrain slope angle, etc. Power characteristics also provide information about the driving speed at which it is appropriate to shift gears.
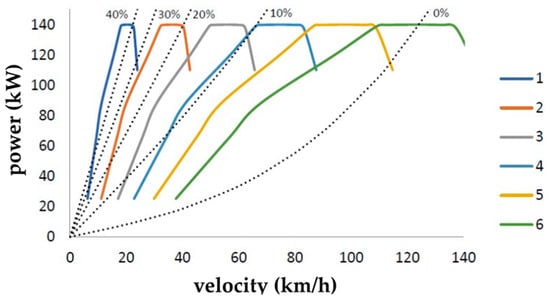
Figure 4.
Analytical power characteristics of the IVECO F1CE0489C engine.
2.5. Traction Characteristics
Traction characteristics graphically represent the balance of forces acting on the vehicle in the direction of its movement. It shows the dependence of the driving forces and driving resistances on the vehicle speed. Traction characteristics are therefore a graphical solution of Equation (6), which can be modified into the form (10):
where ic is the overall gear ratio and rd the dynamic wheel radius.
Using this relation, it is possible to find the values of traction forces on the driving wheels of the vehicle for every gear. Applying this equation, it is also possible to obtain the characteristics showing the dependence of the driving resistances considering different terrain slope angles, as can be seen in Figure 5.
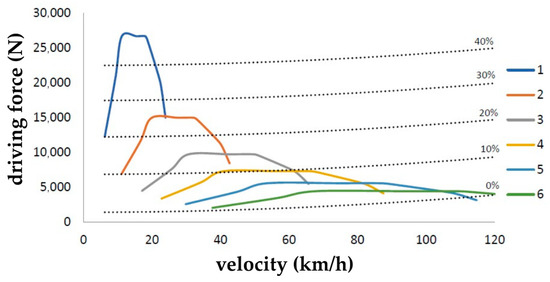
Figure 5.
Analytical traction characteristics of the Iveco LMV 4 × 4 M65 vehicle.
The traction characteristics of the IVECO LMV 4 × 4 M65 vehicle provides, similarly to the power characteristics, a high-quality overview of the vehicle’s driving characteristics, such as its maximum speed in straight-line driving, climbing ability at particular gears, the required gear to overcome resistance at a given terrain slope angle, the maximum speed for a certain terrain slope angle, etc. The traction characteristics also provide information about the driving speed at which it is appropriate to shift gears. While overcoming driving resistances lower than the driving force at full fuel supply, we can use the traction characteristics to determine the values of the excess driving force, which can then be used to accelerate the vehicle or tow a trailer.
From the traction characteristics, it is possible to determine the values of excess power when overcoming lower driving resistances than the value of the usable power at full fuel supply, which can be then used to accelerate the vehicle or to pull a trailer.
2.6. Dynamic Characteristics
The dynamic characteristics shows the dependence of the specific traction force FT per unit of the vehicle’s gravitational force G after subtracting the air resistance Fair. The given dimensionless quantity is called the dynamic factor D and can be obtained using Equation (11):
The traction force varies with the engine revolutions and, therefore, with the vehicle speed and, at the same time, with the selected gear. Similarly, air resistance varies quadratically with vehicle speed, and for this reason, it is appropriate to show the dynamic factor values graphically using the dynamic characteristics of the vehicle (Figure 6).
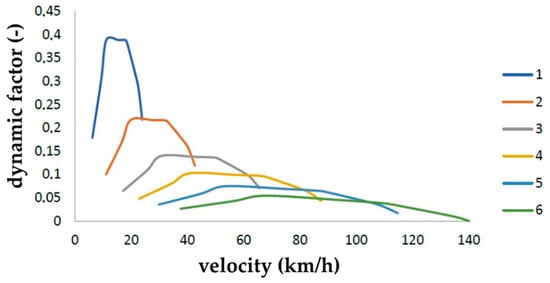
Figure 6.
Analytical dynamic characteristics of the Iveco LMV 4 × 4 M65 vehicle.
From the dynamic factor values of the IVECO LMV 4 × 4 M65 vehicle corresponding to the certain gear and a certain speed, it is possible to determine some dynamic characteristics of the vehicle, such as the vehicle’s climbing ability at a constant speed without a trailer, the vehicle’s acceleration in straight-line driving without a trailer or the traction force in the trailer during straight-line driving at a constant speed. The main advantage of the dynamic characteristics is its dimensionlessness and its relation to the unit weight of the vehicle, thanks to which it is an effective tool for the comparison of the dynamic properties of different vehicles.
3. Simulation Model of the Drive and Transmission Mechanism
To analyze various parameters, such as the efficiency, acceleration, fuel consumption, driving forces, power, dynamic factors and related characteristics depending on the external and internal inputs, such as driving conditions, driver requirements and changing the parameters of the drive and transmission mechanism elements, it is necessary to create a complex simulation model (Figure 7), which includes the gearbox together with the main components of the vehicle’s drive and transmission mechanism.
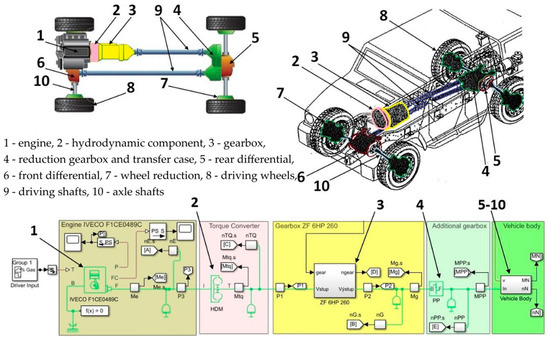
Figure 7.
Complex model of the drive and transmission mechanism of the Iveco LMV 4 × 4 M65 vehicle.
The fundamental assumption for the creation of a functional model is in the transformation of the drive and transmission mechanism of the Iveco 4 × 4 M65 vehicle into the simulation environment. For our purposes, Matlab software with its modules was chosen.
The model of the mechanical part of the drive and transmission mechanism of the vehicle involves all fundamental mechanical components organized into five subgroups:
- Engine: IVECO F1CE0489C engine characterized by the parameters available in the technical documentation;
- Torque converter: general model of the drive and transmission mechanism;
- Gearbox: ZF 6HP26 gearbox characterized by the parameters available in the technical documentation;
- Additional gearbox: reduction gearbox and transfer case;
- Vehicle body: subgroup consisting of rear (5) and front (6) differentials, wheel reductions (7) and driving wheels (8). The simulation model also includes driving shafts (9), axle shafts (10) and various different sensors for revolutions, torque, power, speed, etc., which create the output of the system. Subgroup 5, vehicle body, is also characterized by the dimensions, weights and external factors acting on the vehicle.
In the created simulation model of the vehicle, the previously created numerical simulation model of the planetary gearbox was applied. The simulation model of the ZF 6HP260 planetary gearbox used in the vehicle is described in detail in [52].
The simulation model is designed to work reliable only if the input data are assigned correctly and in the predefined tolerance range and if they are complete. Otherwise, the created model will not perform the simulation. In the case of modification or replacement of components, it may be necessary to synchronize the processes to a 1 kHz sampling frequency.
3.1. Numerical Calculation of the Mechanical Efficiency of the ZF 6HP 260 Gearbox
Thanks to the created complex model, it is possible to analyze not only the torques and revolutions but also the significant number of other outputs, for example, power, efficiency, fuel consumption, inertia or traction characteristics. As the efficiency is the most complex parameter of the ZF 6HP 260 gearbox, which was also obtained analytically, this part of the research was focused on the comparison of the gearbox efficiency at individual gears, obtained using the numerical and analytical method.
During the verification of the simulation model, it was not necessary to implement any element of automation of internal or external simulation inputs. The external simulation input in this case can be represented by the driver’s demand for power either in the form of the required fuel supply or in the form of the accelerator pedal position. For the purpose of the comparison of the values of mechanical efficiency η, driving forces F1, powers P and dynamic factors at the particular gears, the scenario of full fuel supply (T = 1) was chosen. In this case, the second external input of manual gear shifting also remained, which is achieved by the activation or deactivation of the related gearbox control components (B1, B2, C1, C2 and C3) at an adequate time (Figure 8).
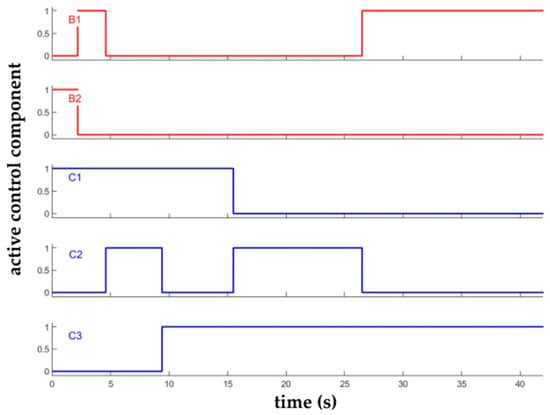
Figure 8.
Input signals controlling the operation of the gearbox model control elements.
Also, for this complex model of the drive and transmission mechanism of the Iveco LMV 4 × 4 M65 vehicle, it can be concluded that the acceptable deviation Δmax between the values obtained analytically and numerically is ≤1%.
As it was mentioned above, the simulation involves a number of sensors for various parameters. Sensors detecting the values of the powers transmitted in particular components of the drive and transmission mechanism model were used to determine the values of the mechanical efficiencies of the vehicle’s transmission at particular gears (1–6) according to the relation (12):
The mechanical efficiency of the transmission η can therefore be defined as the ratio of the powers at the gearbox output and input. That is the reason why the power sensor P1 was placed on the input shaft of the gearbox and the power sensor P2 was placed on the output shaft of the gearbox.
From the power characteristics at the particular gears shown in Figure 9, it can be seen that mechanical losses occur in the gearbox model. The calculated values of the mechanical efficiency of the ZF 6HP 260 gearbox at the particular gears can be seen in Figure 10.
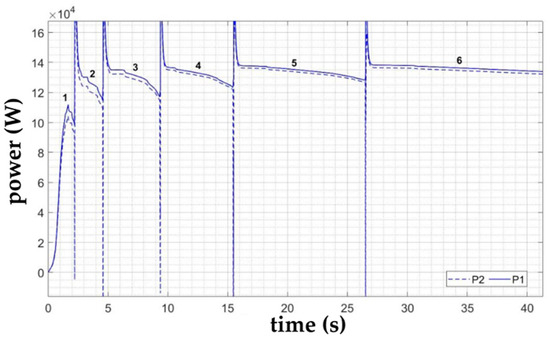
Figure 9.
Power values at the input and output shaft of the gearbox.
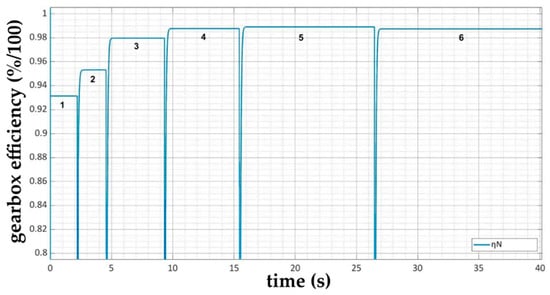
Figure 10.
Values of the gearbox mechanical efficiency determined numerically.
These values can be subsequently used to verify the functionality and accuracy of the gearbox model by comparing them with the values obtained analytically.
To verify the functionality of the complex model of the drive and transmission mechanism of the Iveco LMV 4 × 4 M65 vehicle, the average values of torques, powers, tractions, dynamic factors and related characteristics were compared.
3.2. Torque Characteristics
For the creation of the torque characteristics as a graphical representation of the dependence of the engine torque Me on the engine revolutions ne at full fuel supply, it was necessary to define the input values of the IVECO F1CE0489C engine model. For this purpose, a general engine block was chosen with the parameterization according to the engine revolution vectors and its torques obtained from the manufacturer data. In the simulation model, the same values as in the analytical method were applied. The values of idle revolutions, revolution limiter, engine inertia, initial conditions, etc., were also defined.
The engine block contains one mechanical rotary port F connected to the engine crankshaft and a second mechanical rotary port B connected to the engine block (Figure 7). To determine the torque characteristics of the engine, it was necessary to connect an ideal torque sensor to the mechanical rotary port B. This block represents a device that converts the values of the variable passing through the sensor into a control signal proportional to the torque with a specific proportionality coefficient.
However, the output of this measurement is the dependence of the engine torque Me at simulation time ts. To convert this dependence to the dependence of the engine torque Me on the velocity v, it was necessary to send the values from the torque sensor and the tachometer obtained in Simulink to the Matlab workspace and to process the obtained signals to create the required characteristics shown in Figure 11.
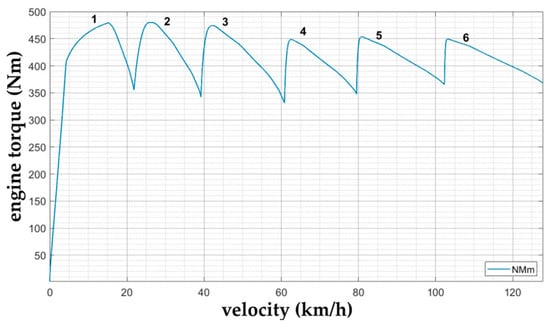
Figure 11.
Numerical torque diagram of the IVECO F1CE0489C engine.
In Figure 11, it can be seen that the graphical representation of the dependence of the IVECO F1CE0489C engine torque values on the vehicle speed obtained numerically already automatically takes into account the predefined parameters of all other components of the vehicle’s driving and transmission mechanism. In this case, these values differ from the characteristics obtained analytically, primarily due to the consideration of the mechanical efficiencies of all components of the driving and transmission mechanism, adhesion force, wheel slip, speed and power transmission ratio of the hydrodynamic converter and others.
3.3. Power Characteristics
When creating a graphical dependence of the usable engine power and the power required to drive the vehicle on its speed, the general engine block was applied again. Due to the higher continuity and usability of the model, the same model with the parameterization according to the engine speed vectors and torques obtained from the manufacturer data was used.
In the case of engine power value determination, it is not necessary to involve a power sensor into any mechanical rotary port, as the general engine block also contains an output port of the physical signal P, thanks to which the engine power values can be recorded. However, the output values are again obtained as the simulation time dependence, and therefore, also in this case, it was necessary to transform the obtained characteristics in the Matlab workspace to obtain the resulting power characteristics at all gears (Figure 12).
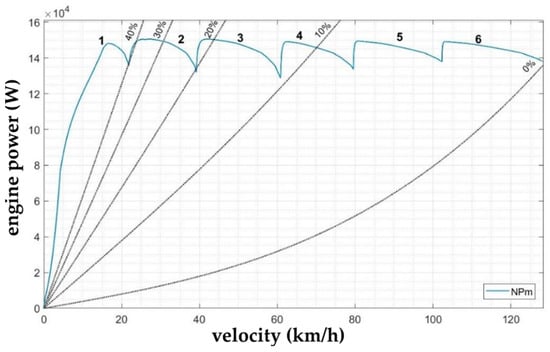
Figure 12.
Numerical power characteristics of the IVECO F1CE0489C engine.
Similarly to the torque characteristics, also in Figure 12, it can be seen that the graphical representation of the dependence of the power curve of the IVECO F1CE0489C engine on the vehicle speed obtained numerically already automatically involves the predefined parameters of all other components of the vehicle’s drive and transmission mechanism. Furthermore, this graphical representation also involves the values of the power required to overcome the driving resistance at different terrain gradients.
3.4. Traction Characteristics
Also in this case, the simulation model of the vehicle’s drive and transmission mechanism remained unchanged, with the general engine block as the source of the driving force. The traction characteristics is a graphical solution of Equation (13):
From the left side of the equation, it follows that in order to determine the values of the traction force on the vehicle’s drive wheels at individual gears, it is necessary to determine the value of the engine torque reduced by the losses caused by the mechanical efficiency of all components of the vehicle’s drive and transmission mechanism when all speed levels are engaged. The size of the dynamic radius rd of the wheel is determined again from the static radius rs stated in the technical documentation of the vehicle.
Assuming that the input parameters of every block of the drive and transmission mechanism model are correctly defined, the ideal and most accurate way to determine the torque values at the particular gears reduced by mechanical losses was their measurement on the driving wheels of the vehicle. This measurement was performed by the torque sensor block connected between the mechanical rotation port F block of the final transmission and the mechanical rotation port of the axle A block of the wheel model on all driving wheels of the vehicle. Since in the case of the Iveco LMV 4 × 4 M65 vehicle it is possible to apply torque to all wheels of the vehicle, it is necessary to measure them separately.
To determine the traction force values, it was necessary to divide the driving torques by the known size of the dynamic radius of the wheel and then to add the values of the traction forces on particular wheels to determine the resulting characteristics of the vehicle traction force Ft.
To determine the values of driving resistances for various driving conditions (terrain gradient, wheel and terrain deformation, air resistance, trailer weight, etc.), it is necessary to create a model of the right side of the equation and to substitute the known values of the parameters. And again, also for this case, it was necessary to transform the simulation time dependence to the velocity time dependence to obtain the resulting traction characteristics at all gears, shown in Figure 13.
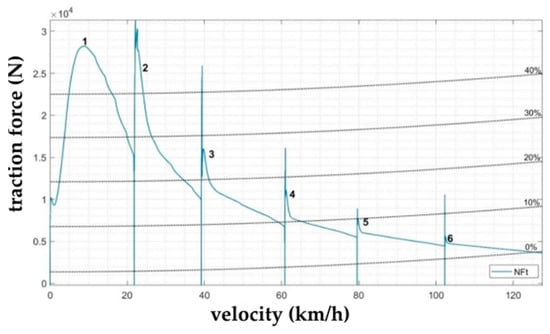
Figure 13.
Numerical traction characteristics of the Iveco LMV 4 × 4 M65 vehicle.
In Figure 13, it is clear that similarly to the previous characteristics, this considers the defined parameters of other components of the vehicle’s drive and transmission mechanism. Furthermore, the values of the driving resistance at different road gradients are considered. As it was already mentioned in the analytical calculations, thanks to this characteristic, it is possible to obtain an overview of the vehicle’s driving characteristics.
3.5. Dynamic Characteristics
When creating a graphical representation of dynamic factor values, it is not necessary to add any additional blocks and sensors to the existing simulation model of the vehicle’s drive and transmission mechanism because all necessary parameters are already known from the previously performed simulations to obtain the torque, power and traction characteristics (14):
After the determination of the traction force values from the measured torque values on the particular wheels and from the values of the air resistance, it is possible to determine the dynamic factor values as the dependence on the simulation time, which can again be processed and visualized as the dependence of the dynamic factor on the vehicle speed at all gears (Figure 14).
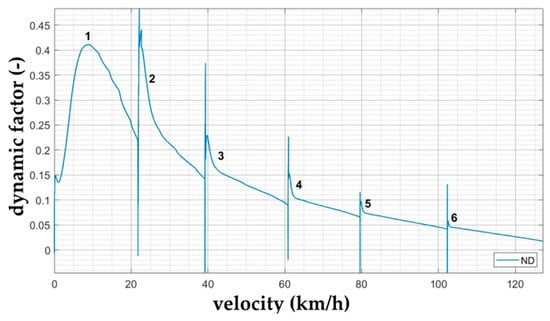
Figure 14.
Numerical dynamic characteristics of the Iveco LMV 4 × 4 M65 vehicle.
Also, from this characteristic, it can be seen that the Matlab environment and its modules consider the input parameters of other blocks of the vehicle’s drive and transmission mechanism.
4. Results
Many different requirements have to be fulfilled in the modern truck vehicles used not only for the military but also for civilian applications. These requirements involve dynamic, operational, environmental and, of course, economic parameters also that have to be analyzed for various inputs, and at the same time, different external factors have to be considered. For this purpose, the numerical simulation model of the drive and transmission mechanism of the Iveco LMV 4 × 4 M65 vehicle was created and verified using the analytical method. Consequently, it was possible to integrate this numerical simulation model into the automated simulation model of the truck vehicle.
4.1. Comparison of the Analytical and Numerical Method Results
To verify the created complex model of the entire drive and transmission mechanism of the Iveco LMV 4 × 4 M65 vehicle, it was necessary to compare the values of the mechanical efficiency ηm of the ZF 6HP260 gearbox obtained using analytical and numerical methods at all gears (Figure 15).
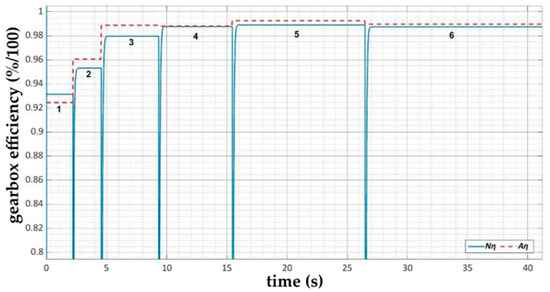
Figure 15.
Comparison of the mechanical efficiency values of the gearbox obtained using analytical and numerical methods.
Consequently, it is possible to compare the values of the parameters characterizing the dynamic properties of the Iveco LMV 4 × 4 M65 vehicle, namely the torques, powers, friction and dynamic factor values obtained using analytical and numerical methods.
To determine the numerical values, it was necessary to apply the power to the input shaft of the gearbox, which made it impossible to analyze this parameter in the first stage of the numerical tool and simplified gearbox model verification. In addition, to determine the analytical values, it was necessary to perform complex and time-demanding analytical calculations. Nevertheless, the mechanical efficiency of the gearbox can be calculated precisely. The reason is that the influence of other components and blocks of the complex model of the vehicle’s drive and transmission mechanism on its resulting values is negligible. Therefore, it was possible to effectively compare the values obtained analytically and numerically without significant distortion due to the adopted simplifications in the analytical method and inaccuracies of the inputs in the numerical method. For our research, the value of the acceptable deviation (15) of the analytical and numerical values was set to Δmax ≤ 1%.
After subtracting the values of mechanical efficiencies obtained using the numerical method Nη and the analytical method Aη, the deviation values were calculated.
The last row of Table 3 shows the relative values of deviations of the mechanical efficiency of the ZF 6HP 260 gearbox for all gears. From these values, it can be seen that the deviations of the mechanical efficiency values of the gearbox for particular gears did not exceed 1%, and therefore, the simulation model is suitable for more advanced simulations.
Table 3.
Comparison of mechanical efficiency values of the gearbox obtained analytically and numerically.
In the next step, the values of the parameters characterizing the dynamic properties of the Iveco LMV 4 × 4 M65 vehicle obtained using analytical and numerical methods were compared. More specifically, the torque and power values of the IVECO F1CE0489C engine shown in the torque and power characteristics, or the traction force and dynamic factor values of the Iveco LMV 4 × 4 M65 vehicle shown in the traction and dynamic characteristics of the vehicle, were compared.
For the comparison of the values characterizing the dynamic properties of the Iveco LMV 4 × 4 M65 vehicle obtained using analytical and numerical methods, it was necessary to implement the results of analytical calculations into the Matlab workspace. Subsequently, it was necessary to adjust the data to the driving conditions of the vehicle to ensure that the conditions under which the analytical and numerical values were analyzed were identical. This process was performed using the blocks of one-dimensional lookup tables that performed interpolation and index searching. Particular lookup tables were defined for every gear with the analytically determined parameters. The lookup table block then assigns the input values of the vehicle speed v to the values of the torque, power, traction force and dynamic parameter, based on a predefined set of coordinates. In this way, it was possible to create six signals corresponding to the six forward gears. Applying a multi-input switch, it is possible to determine, for the current revolution speed, the values of the analytically determined parameters.
From the graphical representations of the quantities characterizing the dynamic properties of the Iveco LMV 4 × 4 M65 vehicle (Figure 16), it is clear that the values of the monitored parameters differ. The main causes of these differences are the simplifications adopted in the analytical method, which result from the complexity of the drive and transmission mechanism and the large number of components that are a part of this mechanism. An important cause of the difference is also the absence of the hydrodynamic converter in the analytical calculations and the significant influence of these components on the resulting values obtained using the numerical method. The deficiency was partially suppressed by incorporating the characteristics of the dynamic ratio value of the hydrodynamic component in the phase of the conversion of the results obtained using the analytical method into the Matlab workspace. However, this characteristic depends on a large number of parameters, and the hydrodynamic converter block and the one-dimensional lookup table blocks use different interpolation methods.
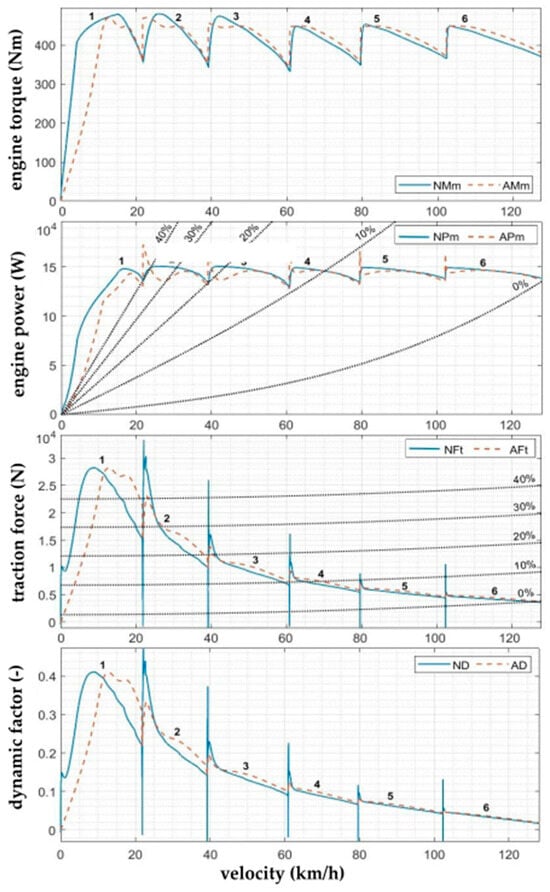
Figure 16.
Comparison of analytical and numerical powers, torques, tractions and dynamic characteristics of the vehicle.
The different initial conditions of the complex calculations are also significant. Each of the large number of components of the vehicle’s drive and transmission mechanism was characterized as accurately as possible by all the input parameters available in the vehicle’s technical documentation. Nevertheless, one of the important causes of these deviations remains the unavailability of several input parameters. That is the main reason why the values were not compared numerically for every simulation step, but the comparison was performed for the average values of the monitored parameters.
4.2. Automation of the Vehicle Model
The comparison and verification of the output values of the analytical and numerical methods proved the applicability of the complex model of the vehicle’s drive and transmission mechanism for the needs of the simulation of the vehicle driving in various conditions. The created complex simulation model provides the possibility of analyzing a large number of output parameters, characteristics, physical quantities and dependencies. However, due to the scope of the research, only chosen important parameters are presented in this article.
During the preparation of the simulation model of the vehicle, it was necessary to replace some manual system inputs, affecting the monitored output parameters, with automatic ones. For the creation of the automatic complex model of the drive and transmission mechanism of the Iveco LMV 4 × 4 M65 vehicle, it was necessary to create a model of a cruise control system based on the PID controller and then a model of the transmission control unit (TCU).
During this phase, the fundamental principles of the automatic control systems were applied. For the practical application, it was necessary to detect the output values and state values of the system by various sensors (pressure, temperature, revolution, etc.) and to ensure the execution of the commands by the appropriate components (switches, motors, solenoids, valves, human actions, etc.).
4.3. Simulation Model of the Transmission Control Unit
One of the most important elements of the system are the blocks of the system control logic. Therefore, considering the complex model of the vehicle’s drive and transmission mechanism, one of the most important components is the gearshift logic block represented in the real vehicle by the transmission control unit (TCU).
In the IVECO LMV 4 × 4 M65 vehicle, the integrated electronic control gearbox controls and monitors all gearbox functions. It is connected using data cables via the controller area network (CAN) adapter to the engine electronics and the position switch on the gearbox. The gears are therefore engaged according to the revolutions, in accordance with the engine power data and the driver’s requests. The ZF CAN adapter controls the torque distribution and transmits the gearbox’s CAN signals. The control system uses the simultaneous authentication of equals—SAE JI939 protocols. The following functions are implemented in this control system:
- Transfer of the standard I I-bit CAN protocol (gearbox) to the 29-bit CAN JI939 protocol and vice versa;
- Torque distribution control;
- Preparation of the torque distribution for the CAN VG transmission of the strategic phenomenon is not a response from the sensor;
- Oil pump temperature monitoring in the gearbox and fan control;
- Gear oil temperature monitoring for the oil’s cooler temperature setting;
- Checking the operational state and the warning lights;
- Checking the internal and external diagnostic support.
The integrated electronic control unit integrated in the gearbox controls and monitors the functions of the gearbox. It is connected via a CAN adapter to the engine electronics and to the position switch on the gearbox. The CAN adapter is located in the fuse box and controls the following functions:
- Transmission data;
- Torque distribution check;
- Checking the temperature in the gearbox tank and controlling the fan;
- Monitoring the transmission oil due to the temperature control in the oil cooler;
- Checking the warning lights on the dashboard;
- Checking the diagnostic support.
4.4. Gearshift Map
The gearshift map was created as the dependence of the desired gear on the driver’s request inputs represented by the accelerator pedal position and the instantaneous vehicle speed. To ensure the gearshift process automation up and down, it was necessary to create a primary gearshift map. Due to the unavailability of a large amount of input data characterizing the gearshift map and the absence of these parameters in the vehicle’s technical documentation, it was necessary to create the gearshift map from the available data. For this purpose, the available gearshift maps of the drive and transmission mechanisms of comparable wheeled vehicles were analyzed, values of the current fuel consumption from available curves of fuel consumption of comparable drive and transmission mechanisms were estimated, the real values of fuel consumption of Iveco LMV 4 × 4 M65 vehicles used by the Special Operations Forces of the Armed Forces of the Slovak Republic were obtained from the Pretech system, and the optimal gearshift based on the values of quantities characterizing the dynamic properties of the Iveco LMV 4 × 4 M65 vehicle were estimated. In the Pretech system, information about the operational times of the vehicle, together with the traveled distances and consumed fuel together with the calculated fuel consumption related to the price dates is recorded and archived. Therefore, the gearshift map can also be modified, for example, on the basis of the season of the year, as the fuel consumption is, of course, dependent on this parameter.
The analysis was, of course, performed on the gearshift map data of multiple vehicles with similar characteristics, engines and transmission types; with the same number of degrees of freedom and gears; and with similar purposes, weights and dimensions.
During the creation of the model of the dependence of fuel consumption on the internal and external inputs, available information on the fuel consumption of the combustion engines was integrated with the knowledge of the vehicle’s consumption in practical operation and data obtained by the approximation of the specific fuel consumption curve of a vehicle with similar characteristics applied in the Armed Forces of the Slovak Republic.
In practice, the most common requirement is to minimize the fuel consumption and to maximize the utilized power of the engine or its torque. However, in military applications, the requirements can be different, such as driving in difficult terrain conditions, etc. Even though the values of all the aforementioned parameters depend mainly on engine revolutions and load, the characteristics of their values are different, as can be seen in Figure 17.
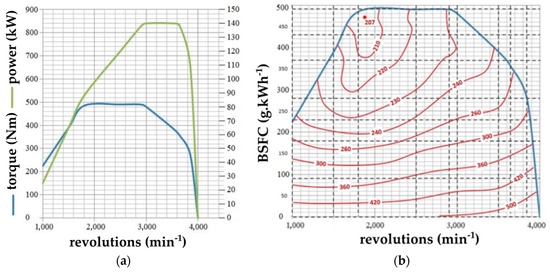
Figure 17.
(a) External engine revolution characteristics; (b) brake-specific fuel consumption (BSFC).
In Figure 17, it can be seen that from the point of view of the maximum use of engine power at full fuel supply, the ideal shifting area is between 3000 and 3600 rpm. However, from an economic point of view and related fuel consumption, shifting in this range would be ineffective. It can be concluded that it is impossible to create a shifting map ideal for every driving situation. Therefore, when creating shifting logic, it is important to create a transmission control unit capable of effective analysis of the driving situations and subsequent adaptation of the gearshift logic, with an emphasis to assign the priority to the values of critical parameters.
After performing a deep analysis of the available data and based on the results of the performed analytical and numerical calculations and simulations of the vehicle’s drive and transmission mechanism model, an input gearshift map of the Iveco LMV 4 × 4 M65 vehicle model was created.
Figure 18 and Figure 19 show the gearshift map created based on the parameter values characterizing the dynamic properties of the Iveco LMV 4 × 4 M65 vehicle determined using analytical and numerical methods. The graphic representation shows the characteristics of the traction force Ft for different power requirements represented by the accelerator pedal position level, with the 0.0 value corresponding to the minimum and 1.0 the maximum fuel delivery. The characteristics of values at chosen specific points related to the 30%, 40%, 60%, 90% and 100% power requirement are shown. To increase the readability of the graph, the characteristics of other values representing the dynamic properties of the vehicle and the fuel consumption are not shown. Nevertheless, these values influenced the dynamic characteristics of the vehicle and, of course, also speeds at which the gearshift is performed upwards (blue lines) and downwards (red lines), considering the accelerator pedal position. These assumed values are shown in the idealized two-dimensional gearshift map.
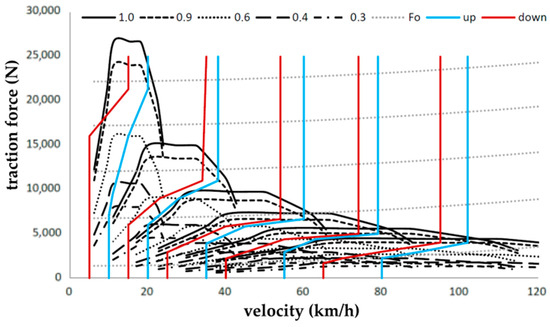
Figure 18.
Gearshift map.
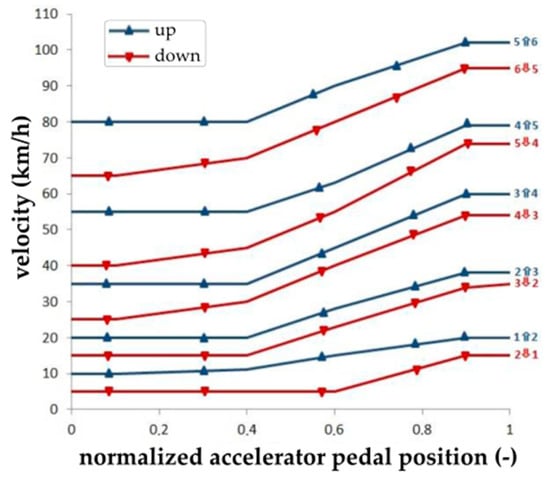
Figure 19.
Primary gearshift map.
The ideal moment for the gearshift can be assessed from many different points of view. However, in the operation of civilian and military vehicles, the priorities, driving conditions and situations are usually different. Furthermore, the particular curves shown in the gearshift map depend on a large number of variables, and it is impossible to meet all requirements.
In addition to the fundamental critical parameters that are usually monitored and evaluated during the search for ideal gearshift areas, for example, power, torque, fuel consumption or revolutions, other parameters can also be analyzed. The transmission control unit logic can be created to achieve the maximum vehicle acceleration values, the highest possible gearshift quality or to obtain the maximum comfort.
For the TCU model creation, it was necessary to implement the gearshift map into the Matlab environment through two blocks of two-dimensional lookup tables performing interpolation and index searching in the Simulink environment (Figure 20). The two-dimensional lookup tables represent functions of two variables, and their task is to create a threshold signal for upshifting and downshifting.
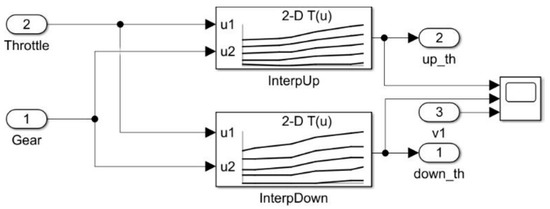
Figure 20.
The 2D interpolation tables generating gearshift thresholds.
The table providing upshifting was defined by the coordinates of the gearshift gear vector [g_up], the accelerator pedal position level corresponding to the demand on the power [dem_up] and the up-gearshift threshold [v_up]. The second lookup table providing values for the down gearshift was defined in the same way considering the values of the gear vector [g_down], the accelerator pedal depression level (power demand) [dem_down] and the downshift threshold [v_down]. The vehicle speed and the selected gear are the inputs of both tables.
Subsequently, based on the input values and vectors defined in the table, the threshold values for upshifting (up_th) and downshifting (down_th) are determined and assigned using the interpolation algorithm. In the graph in Figure 21, a graphic representation of the assigned boundary values for the primary gearshift map created in the Matlab environment is shown.
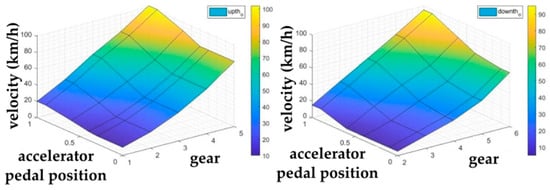
Figure 21.
Primary gearshift map of the gearshift threshold values.
Based on the graphical representation of the values for the change in the gear and the vehicle velocity v, it is possible to explain the gearshift map principle (Figure 22). If the current vehicle speed is higher than the limit value for upshifting, a higher gear is selected, and similarly, if the current speed is lower than the limit value for downshifting, a lower gear is selected.
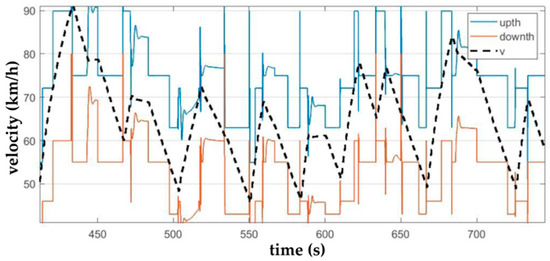
Figure 22.
Principle of operation of the gearshift map.
4.5. Gearshift Logic
Considering gear shifting, the controlled object can be represented by the entire vehicle in a broader perspective or by the gearbox itself in a narrower perspective. In the case of a vehicle with a manual gearbox, the control system (driver) analyzes the output values Y and internal states X obtained using the revolution and velocity sensors, and based on the data obtained visually or acoustically and based on the request W, he/she performs gear shifting U.
In the case of a vehicle with an automatic gearbox, the function of the control system is taken over by the transmission control unit. The gear shifting itself, represented by the action command U, is controlled automatically based on the comparison of the required values W with the output values Y and internal state values X and is performed in the form of feedback control directly in the TCU. These values are obtained using a number of sensors measuring, for example, revolutions, speed, engine load, accelerator pedal position, etc.
Figure 23 shows a simplified schematic of the IVECO LMV 4 × 4 M65 gearshift. The input for the TCU is the driver’s request for the vehicle speed, expressed by the accelerator pedal position W. It compares it with the value of the vehicle speed Y and with the internal state of the vehicle influenced by the engine revolutions, power, torque, currently applied gear, load, etc. Based on the comparison of the current and required state, it creates a command for the gearbox to engage a higher or lower gear or to maintain the current one.
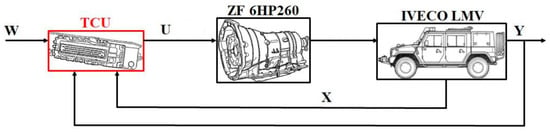
Figure 23.
Principle of operation of the gearbox control unit (W—required values, U—action command, X—internal state values, Y—output values).
The given schematic is significantly simplified, as this process involves many other components, sensors, actuators and parameters, which were not included in this schematic. In a real vehicle, the TCU performs a number of other functions that are not essential for the purposes of this study.
After the integration of the control map into the vehicle model, it is necessary to create a model of the gearshift logic itself, shown in Figure 24. To create the TCU logic model, the Stateflow module of the Matlab simulation environment was used, in which a state diagram was created. It consists of two simultaneously operating transition diagrams. The first one, marked as selection_state, is constantly active and continuously monitors the actual gear and the vehicle speed and compares them with the up_th and down_th limit values. The second transition diagram, marked as gear_state, analyzes the currently applied gear, and based on the signals for upshifting or downshifting, changes the resulting signal with the desired gear for the gearbox.
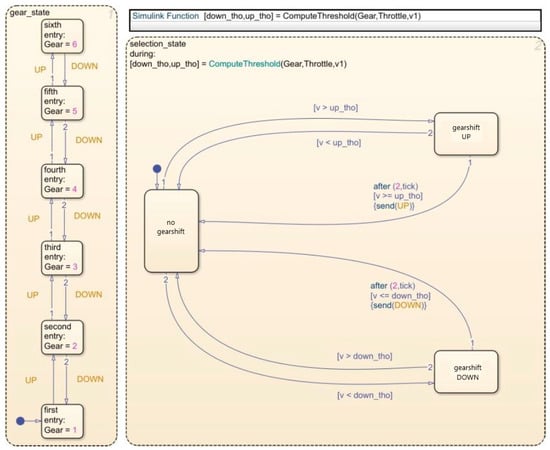
Figure 24.
Gearshift logic.
In the initial phase of the simulation, the vehicle is in a stable state (no shifting), and the first gear is set in the gearbox. The TCU constantly monitors the vehicle speed and the driver’s request (accelerator pedal position). When the speed value for upshifting or downshifting is exceeded by the current vehicle speed at the current power demand (blue lines in Figure 19, up_th values in Figure 21, red lines in Figure 19 and down_th values in Figure 21, respectively), the TCU sends a signal to the gearbox to engage a higher or lower gear. The gearshift time is recorded, and only in the case the shifting condition is present for a predefined time, shifting itself is performed. In this way, unnecessary shifting is excluded.
4.6. Fuel Consumption Model
The value of the fuel consumption depends mainly on the torque and engine revolutions. When implementing the data into the Matlab environment, the three-dimensional definition of the specific fuel consumption model was created. The input vectors speed v, torque Te and brake-specific fuel consumption (BSFC) were connected to the engine block.
After converting vectors from the general engine block of the Simscape module environment to the common Matlab workspace, it is possible to visualize the BSFC model in the form of a contour plot, as it can be seen in Figure 25.
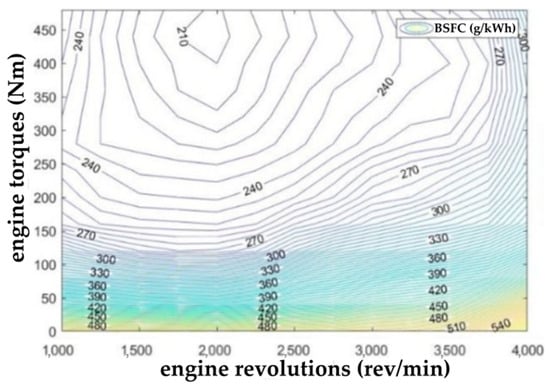
Figure 25.
Contour representation of the model’s fuel consumption values.
The lowest fuel consumption is achieved by the engine at high torques and lower to medium engine speeds, while the highest specific fuel consumption is achieved by these engines at high speeds and low torques.
Subsequently, it was possible to create a dependence of the effective engine power Pe and fuel mass flow rate FC on the engine revolutions and torque values. The obtained characteristics are shown in Figure 26.
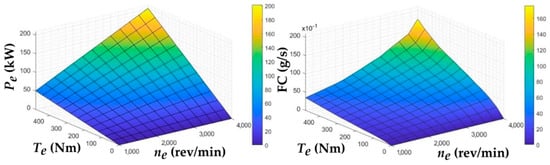
Figure 26.
Dependence of effective engine power and fuel mass flow rate on engine speed and torque values.
The graphs shown in Figure 26 confirm the assumption that the areas of maximum engine power utilization of the IVECO F1CE0489C are in the opposite area to the values of the lowest fuel consumption of the vehicle. On the contrary, the graphical representation showed that there is a direct proportion between the curves of the values of the effective engine power Pe and the fuel mass flow rate FC—the higher the power, the higher the fuel consumption—or an inverse proportion: with increasing efficiency of the driving mode from the point of view of the engine power utilization, the efficiency of the driving mode from the point of view of current fuel consumption decreases. To verify this dependence, it was necessary to analyze the intersection of these curves, and the resulting 3D graphs of the dependence of the fuel consumption on the effective torque and engine revolutions are shown in Figure 27.
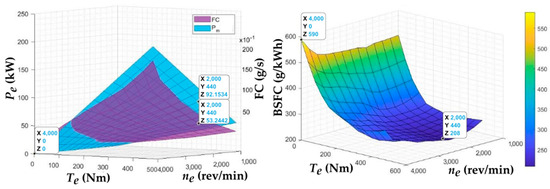
Figure 27.
Fuel consumption dependence on engine revolution and torque values.
These graphical representations prove that vehicle operation in the area of maximum utilized effective power and minimum actual fuel consumption is simultaneously impossible. The three-dimensional graph of specific fuel consumption obtained by intersecting the waveforms of these two quantities gives us a better idea of the area with the most efficient operation of the vehicle, which is located around the area of the global minimum. The global minimum was localized around the position with the largest positive differences between the effective engine power and fuel mass flow rate with the following conditions: ne = 2000 rpm, Te = 440 Nm, and BSFC = 208 g/kWh. From the point of view of sufficient use of engine power while maintaining appropriate fuel consumption, it is optimal to keep the engine velocity and torque in this range.
5. Discussion
The created analytical and numerical model of the drive and transmission mechanism of the truck vehicle will serve as a basis for the optimization of the chosen characteristics or parameters. As in the vehicles used for military purposes, the modification of the design and construction of the mechanical components is a very complicated and time-consuming process, and our research is focused on the control processes. The creation of the simulation model was inevitable also due to the fact that the research and development activities in civilian areas are mainly focused on the parameters and characteristics related to fuel consumption or torques; however, in military applications, it is often necessary to also consider many other parameters. Despite the fact that our research is focused mainly on military purposes, the research findings can also be applied to the civilian sector, manufacturers of similar type of vehicles and, of course, for educational purposes.
The crated computer-based simulation model allows us to observe the behavior of the system under various conditions. Thanks to the created complex model, it is possible to analyze complex interactions and stochastic processes that are difficult to determine analytically, mainly due to the time demands of the systems, in which many variables, scenarios and input and output parameters are monitored. Therefore, this model can be used for the simulation of real-time operation. However, the results of the model are often dependent on the quality of the model and assumptions or simplifications. Furthermore, the interpretation of the obtained results has to be conducted very carefully, as the results may be influenced by random variations. Therefore, for the verification of the created numerical simulation model, analytical mathematical modeling was applied. As the analytical analysis is based on mathematical models and formulas to derive exact solutions or insights about the system and relies on verified mathematical theories and principles, it provides more precise and exact results. In practice, this approach is advantageous for simple systems, since it does not require extensive computational resources. If we consider complex systems with nonlinearities, many components or influencing quantities, its application is very complicated. However, it is very helpful in the understanding of the fundamental principles of the systems. Therefore, we applied the analytical approach to verify the results obtained by the created simulation model for the ideal conditions. The comparison of these two approaches also provides a more comprehensive understanding of the created models of the drive and transmission mechanism of the vehicle, although this comparison was performed under ideal conditions in a steady state, without any transient phenomena.
Due to the scope of our research, only a limited selection of important parameters was presented in this article. However, there are many other parameters and related characteristics that can be analyzed thanks to the created simulation model; for example, if we consider engine characteristics, these can be power, revolutions, torque and fuel consumption. In the case of the hydrodynamic converter, among the main characteristics that can be analyzed are the revolutions and torques of the pump and turbine, as well as the dynamic ratio. If we consider the gearbox, then the efficiencies together with the revolutions, torques and powers of the particular gearbox components or revolutions, torques and pressures of particular control components can be studied. Also, the whole set of the vehicle’s parameters, such as the velocity, acceleration, longitudinal traction force at particular gear ratios, normal forces of the front and rear wheels or tire slip, can be analyzed. Furthermore, there is also the possibility of the analysis of the fundamental parameters, for example, revolutions, torques, powers, etc., on all other components of the drive and transmission mechanism, for example, on the additional gearbox, shafts, differentials, final drives, wheels, etc.
However, it has to be mentioned that the created models have their limitations, which were discussed in detail in the article, such as the absence of a hydrodynamic converter in the analytical calculations and the creation of its model based on the analytical methodology. Another limitation is that for the specific type of analysis, considering, for example, temperature dependencies of the analyzed parameters or characteristics, additional inputs have to be added. Similarly, due to the lack of data, in our article, we did not focus on sensor precision, accuracy, noise and related uncertainties and error propagation analysis, which have origin in the data obtained from the sensors, or their influence on the analytical and numerical simulation model. However, if these data were available, they can be integrated into the numerical simulation model.
An important fact is that the above-mentioned parameters can be monitored not only as instantaneous values; it is also possible to analyze their dependence on the input conditions. It is also possible to simulate reactions of the system and its components to the various external influences, such as changes in the driver’s power requirements, braking of the vehicle, changes in the terrain gradient, changes in the surface or various wind conditions. Furthermore, these parameters can also be analyzed for the different total weights of the vehicle.
We can also very easily monitor the reactions of the system and its components to the changes in the characteristics and parameters of the particular groups of the vehicle’s drive and transmission mechanism, such as changes in the parameters of the components, the replacement of an entire component (engine, hydrodynamic mechanism, etc.), changes in the control logic of the components (transmission control unit, cruise control system, engine control unit, etc.) or a change in the parameters defining the behavior of the system (shift map, characteristics of the logic of the cruise control system, etc.).
A change in any external or internal parameter can have a significant impact on the behavior of the entire system and its components. Monitoring the impact of the changes in external inputs is very important for the analysis of the behavior of a designed or already manufactured vehicle in the various driving conditions. On the other hand, monitoring the influence of internal inputs is very important for the determination of the ideal configurations of the components of the vehicle itself.
Furthermore, if the data related to the precision, accuracy or uncertainty of the particular system components or sensors integrated in the vehicle are available, it would even be possible to evaluate the influence of the errors presented in the control system and to analyze the error propagation.
The creation of the database from the obtained data was necessary for the creation of a prediction model of the values of parameters characterizing the dynamic properties of the analyzed vehicle and also for the creation of a prediction model of the values of the vehicle’s operational and economic parameters, such as fuel consumption.
The creation of this primary gearshift map is a basis for the creation of gearshift maps, which can apply the obtained predicted values to optimize parameters, for example, performance or fuel consumption in fundamental or complex vehicle driving situations.
As the simulation model was verified for the ideal conditions, such as constant speed without acceleration or braking, for direct motion without curves or slopes and for driving in not-demanding terrain, any of these changes in the proposed models have to be verified after their implementation into the analytical or numerical model.
However, as mentioned above, especially in the case of an already manufactured vehicle, changes in the parameters of the mechanical components of the vehicle or their replacement by different components would be highly inefficient. Therefore, the possibility of improving the vehicle output characteristics by changing the system control logic is the main motivation and scope of our research.
6. Conclusions
The article dealt with the comparison of the analytical and numerical calculations of the values of the mechanical efficiency of the gearbox at particular gears and related power, torque, traction and dynamic characteristics of the vehicle.
For this purpose, a complex model of the vehicle’s drive and transmission mechanism was created, consisting of all main components of the Iveco LMV 4 × 4 M65 vehicle. For the simulation model creation, the working environment of Matlab and its modules were chosen.
After the comparison of the mechanical efficiency values of the gearbox achieved using analytical and numerical methods, it was proven that the deviations between them did not exceed 1%. Therefore, it was possible to analyze the values of the parameters characterizing the dynamic properties of the vehicle. Considering significant simplifications applied in analytical calculations and different conditions, the deviations between the values and characteristics obtained analytically and numerically are negligible. Our research proved that the complex model of the vehicle’s drive and transmission mechanism created in Matlab software can be effectively applied for the simulation of the behavior of the drive and transmission mechanisms of wheeled truck vehicles. Consequently, the process of the gearbox shifting automatization, with an emphasis on gearshift map creation, was presented. The data acquisition process necessary for the gearshift map creation together with the gearshift control logic was also described.
The created complex simulation model of the drive and transmission mechanism of the vehicle Iveco LMV 4 × 4 M65 is suitable for the further optimization of the dynamic, operational and economical parameters of the vehicle.
Author Contributions
Conceptualization, M.R., P.D., K.S. and K.D.; methodology, M.R., P.D., K.S. and K.D.; validation, M.R. and P.D.; formal analysis, K.D. and K.S.; investigation, M.R., P.D., K.S. and K.D.; resources, P.D.; data curation, M.R.; writing—original draft preparation, M.R. and K.D.; writing—review and editing, K.D. and K.S.; visualization, M.R., P.D., K.S. and K.D.; supervision, P.D.; project administration, K.S. and K.D.; funding acquisition, K.S. and K.D. All authors have read and agreed to the published version of the manuscript.
Funding
This research was supported by the Research Agency ITMS 2014+ under code numbers 313011AUP1 and 313011T557 and co-funded by the European Regional Development Fund under the Operational Program Integrated Infrastructure and by the VEGA 1/0101/22 project.
Data Availability Statement
The raw data supporting the conclusions of this article will be made available by the authors on request.
Conflicts of Interest
The authors declare no conflicts of interest.
Abbreviations
The following abbreviations are used in this manuscript:
| BSFC | Brake-Specific Fuel Consumption |
| CAN | Controller Area Network |
| PGT | Planetary Gear Train |
| RPGT | Ravigneaux Planetary Gear Train |
| SAE | Simultaneous Authentication of Equals |
| TCU | Transmission Control Unit |
References
- Kumar, S.; Kumar, S.; Lakra, S. Design and Fabrication of Planetary Transmission System and Simulating Torque Vectoring on Rear-Wheel Drive Vehicle to Increase Lateral Maneuverability. In Lecture Notes in Mechanical Engineering; Springer: Singapore, 2021; pp. 675–693. [Google Scholar] [CrossRef]
- Wu, X.; Tang, W.; Zhong, A.; Zhang, J. Kinematic analysis, structural design and prototype verification for the single-stage nutation drive. Proc. Inst. Mech. Eng. Part C-J. Mech. Eng. Sci. 2025, 239, 4335–4349. [Google Scholar] [CrossRef]
- Chen, X.; Hu, Q.; Xu, Z.; Liang, X.; Li, J.; Mai, Q.; Zhu, C. Investigation into the structure and transmission mechanism of a novel multistage face gear transmission based on battery discharge current constant of an electric vehicle. Int. J. Vehicle Des. 2019, 81, 115–136. [Google Scholar] [CrossRef]
- Xia, M.; Zhao, K.-L.; Zhao, H.-X.; Yang, J. Study on failure of transmission shaft based on finite element and fracture analysis technology. IOP Conf. Ser. Mat. Sci. 2021, 1043, 052033. [Google Scholar] [CrossRef]
- Ahlawat, R.; Fathy, H.K.; Lee, B.; Stein, J.L.; Jung, D. Modelling and simulation of a dual-clutch transmission vehicle to analyse the effect of pump selection on fuel economy. Vehicle Syst. Dyn. 2010, 48, 851–868. [Google Scholar] [CrossRef]
- Lin, X.; Zhang, G.; Wei, S.; Yin, Y. Energy consumption estimation model for dual-motor electric vehicles based on multiple linear regression. Int. J. Green Energy 2020, 17, 488–500. [Google Scholar] [CrossRef]
- Xu, H.L.; Chen, Y.; Zhang, L.; Chen, G.L.; Han, J.L.; Zhang, Q.; Li, C.K. Energy Management Strategies for Extended-Range Electric Vehicles with Real Driving Emission Constraints. Appl. Sci. 2025, 15, 142. [Google Scholar] [CrossRef]
- Fu, B.; Zhu, T.; Liu, J.; Zhao, Y.; Chen, J. Influencing Factors of Electric Vehicle Economy Based on Continuously Variable Transmission. Int. J. Auto. Tech. Kor. 2022, 23, 717–728. [Google Scholar] [CrossRef]
- Xu, T.; Liu, T.; Zhao, P.; Qiang, G.; Zheng, Z.; Liu, Y. Stability control of single-wheel failure in four-wheel independent drive electric vehicles. J. Phys. Conf. Ser. 2024, 2761, 012012. [Google Scholar] [CrossRef]
- Ge, S.; Qiu, L.; Zhang, Z.; Wang, H.; Hu, M. Electromechanical coupling dynamic characteristics of electric drive system for electric vehicle. Nonlinear Dynam. 2024, 112, 6101–6136. [Google Scholar] [CrossRef]
- Guo, F.; Li, C.; Su, J.; Liu, C. Analysis of Dynamic Characteristics and Load Sharing Performance of Electric Driven Planetary Gear System Based on Electromechanical Coupling Model. In Proceedings of the 2023 SAE Vehicle Powertrain Diversification Technology Forum, Shanghai, China, 26 August 2023; SAE Technical Paper. SAE International: Warrendale, PA, USA, 2023; p. 194247. [Google Scholar] [CrossRef]
- Ge, S.; Hou, S.; Yao, M. Electromechanical Coupling Dynamic Characteristics of the Dual-Motor Electric Drive System of Hybrid Electric Vehicles. Energies 2023, 16, 3190. [Google Scholar] [CrossRef]
- Zhan, S.; Liu, C.; Yin, Y.; Yu, C.; Zhao, C. Eco-driving strategy for fuel cell vehicles in car-following scenarios considering stack heat and durability based on SAC. Energy Convers. Manag. 2024, 315, 118744. [Google Scholar] [CrossRef]
- Matejcek, M.; Sostronek, M.; Popardovska, E.; Popardovsky, V.; Babjak, M. Embedded System for Monitoring Fuel Cell Power Supply System in Mobile Applications. Electronics 2025, 14, 1803. [Google Scholar] [CrossRef]
- Bavishi, H.; D’Arpino, M.; Ramesh, P.; Guezennec, Y.; Colbert, I. Comparative Analysis of Protection Systems for DC Power Distribution in Electrified Vehicles. In Proceedings of the SAE 2022 Annual World Congress Experience, WCX 2022, Virtual, 5–7 April 2022; SAE Technical Paper. SAE International: Warrendale, PA, USA, 2022; p. 178364. [Google Scholar] [CrossRef]
- Dong, P.; Zhao, J.W.; Xu, X.Y.; Liu, Y.F.; Wang, S.H.; Huang, H.; Wang, R.P.; Zheng, L.P.; Zhou, Z.G. Performance comparison of series–parallel hybrid transmissions with multiple gears and modes based on efficiency model. Energy Convers. Manag. 2022, 274, 116442. [Google Scholar] [CrossRef]
- Yi, J.; Chen, S.S.; You, D.Z. Dynamic model of automatic transmission system of tracked vehicle. Appl. Mech. Mater. 2013, 397–400, 369–373. [Google Scholar] [CrossRef]
- Cui, T.; Li, Y.; Luo, F.; Wang, C. Fracture mechanism of transmission spindle system for high-speed tracked vehicle. Eng. Fail. Anal. 2022, 136, 106174. [Google Scholar] [CrossRef]
- Han, Z.; Liang, X.; Zhang, W.; Liu, Y.; Liu, J. Dynamic characterization and vibration response optimization of EMT system for tracked vehicles. Sci. Rep. 2025, 15, 12614. [Google Scholar] [CrossRef]
- Yi, J.; Wang, X.-L.; Hu, Y.J.; Li, C.-G. Modelling and simulation of a fuzzy controller of automatic transmission of a tracked vehicle in complicated driving conditions. Proc. Inst. Mech. Eng. Part D-J. Automob. Eng. 2007, 221, 1259–1272. [Google Scholar] [CrossRef]
- Yang, H.; Qin, Y.; Bai, W.; Ren, X.; Nie, S.; Xu, B. Adaptive Active Compliance Control for Wheel-Legged Vehicles on Uneven Roads Based on a Parallel Integrated Framework. In Proceedings of the 2024 8th CAA International Conference on Vehicular Control and Intelligence, CVCI 2024, Chongqing, China, 25–27 October 2024. [Google Scholar] [CrossRef]
- Kannan, C.; Ashok, B.; Dighe, H.; Agarwal, S.; Kapoor, D.; Kasana, A.; Mathew, A. Design, Analysis, and Simulation of a Four-Wheel-Drive Transmission for an All-Terrain Vehicle. In Proceedings of the SAE Automotive Technical Papers, WONLYAUTO 2022, Warrendale, PA, USA, 1 January 2022; SAE Technical Paper. SAE International: Warrendale, PA, USA, 2022; p. 178806. [Google Scholar] [CrossRef]
- Chen, Y.L.; Hu, W.G.; Liu, J.L.; Wang, H.; Wang, C.X.; Wu, X.D.; Liu, S.A.; Yang, L.H. Climbing characteristic of the wheeled vehicle with dual pump drive system. Appl. Mech. Mater. 2014, 535, 13–16. [Google Scholar] [CrossRef]
- Kim, J.; Ahn, J.; Jeong, S.; Park, Y.-G.; Kim, H.; Cho, D.; Hwang, S.-H. Driving Control Strategy and Specification Optimization for All-Wheel-Drive Electric Vehicle System with a Two-Speed Transmission. World Electr. Veh. J. 2024, 15, 476. [Google Scholar] [CrossRef]
- Ballo, F.; Stabile, P.; Gobbi, M.; Mastinu, G. A Lightweight Ultra-Efficient Electric Vehicle Multi-Physics Modeling and Driving Strategy Optimization. IEEE Trans. Veh. Technol. 2022, 71, 8089–8103. [Google Scholar] [CrossRef]
- Zhao, X.; Zhang, J.; Tang, J. Optimal control for shift mechanism of a planetary two-speed transmission for electric vehicles. Int. J. Electr. Hybrid Veh. 2022, 14, 231–249. [Google Scholar] [CrossRef]
- Tian, Y.; Zhang, N.; Zhou, S.; Walker, P.D. Model and gear shifting control of a novel two-speed transmission for battery electric vehicles. Mech. Mach. Theory 2020, 152, 103902. [Google Scholar] [CrossRef]
- Zhou, M.; Sun, D.; Wang, C.; Wang, J. Shifting strategy for electric heavy trucks with automated manual transmission based on extended Kalman filtering and reinforcement learning. Control Eng. Pract. 2025, 160, 106324. [Google Scholar] [CrossRef]
- Xu, S.; Li, J.; Zhang, X.; Zhu, D. Research on Optimal Driving Torque Control Strategy for Multi-Axle Distributed Electric Drive Heavy-Duty Vehicles. Sustainability 2024, 16, 7231. [Google Scholar] [CrossRef]
- Fodor, A.; Borsos, D.; Sandor, T. Fuzzy-based Gear Shifting Algorithm for Twin-drive in MATLAB Simulink model. In Proceedings of the 2024 IEEE 22nd World Symposium on Applied Machine Intelligence and Informatics, SAMI 2024—Proceedings, Stara Lesna, Slovakia, 25–27 January 2024. [Google Scholar] [CrossRef]
- Xu, X.; Luo, Y. Modeling and analysis of gear shifting process of non-synchronizer AMT based on collision model. IEEE Access 2021, 9, 13354–13367. [Google Scholar] [CrossRef]
- Liu, Y.G.; Liao, Y.H.; Zhang, J.C.; Wei, J.; Chen, Z.; Zhang, Y. Adaptive Gearshift Control for Dual Clutch Transmissions Based on Hybrid Physical and Data Driven Modeling. Automot. Innov. 2024, 7, 529–543. [Google Scholar] [CrossRef]
- Zhang, L.; Ren, C.; Wang, Z.; Chen, M. Steering cooperative seamless gearshift control for centralized and distributed coupling drive intelligent electric vehicle. Mech. Mach. Theory 2023, 187, 105388. [Google Scholar] [CrossRef]
- Wu, J.; Wang, B.; Hong, X. Driving Torque Control of Dual-Motor Powertrain for Electric Vehicles. Actuators 2022, 11, 320. [Google Scholar] [CrossRef]
- Moon, S.-K.; Seo, D.-W.; Kang, J.-Y. Torque Vectoring Control for Remote-control Driving of Differential-drive Mobile Robots. J. Inst. Control. Robot. Syst. 2024, 30, 973–981. [Google Scholar] [CrossRef]
- Kim, S.; Choi, S. Control-oriented modeling and torque estimations for vehicle driveline with dual-clutch transmission. Mech. Mach. Theory 2018, 121, 633–649. [Google Scholar] [CrossRef]
- Yang, D.; Liu, H.; Gao, P.; Zhang, W.; Yan, Q.; Chen, K.; Yang, H. Research on Drive Torque Command Optimization and System Disturbance Rejection Mechanism for Torsional Vibration Control of Electro-Mechanical Transmission System. IEEE Trans. Transp. Electrif. 2025, 11, 7636–7649. [Google Scholar] [CrossRef]
- Fuse, H.; Yu, G.; Fujimoto, H.; Sawase, K.; Takahashi, N.; Takahashi, R.; Okamura, Y.; Koga, R. Frequency-Domain Analysis and Joint Torque Vibration Suppression Control on Two-Input-Two-Output Torque Difference Amplification Motor Drive System of Electrified Vehicles. SAE Int. J. Veh. Dyn. Stab. NVH 2023, 7, 313–328. [Google Scholar] [CrossRef]
- Yang, Y.; He, Q.; Chen, Y.; Fu, C. Efficiency optimization and control strategy of regenerative braking system with dual motor. Energies 2020, 13, 711. [Google Scholar] [CrossRef]
- Li, W.; Wang, G.; Jiang, Y. Wedge-loading planetary traction drive: Modeling and performance analysis. Proc. Inst. Mech. Eng. Part J-J. Eng. Tribol. 2025, 239, 200–215. [Google Scholar] [CrossRef]
- Bodzás, S.; Tiba, Z. Creation of a general mathematical model of Torsen T-2 differential units for kinematical analysis, geometric design and CAD modelling. Int. Rev. Appl. Sci. Eng. 2025; accepted. [Google Scholar] [CrossRef]
- Diachuk, M.; Easa, S.M. Improved Mathematical Approach for Modeling Sport Differential Mechanism. Vehicles 2022, 4, 74–99. [Google Scholar] [CrossRef]
- Miklos, I.Z.; Miklos, C.C.; Alic, C.I. Dynamic simulation of the differential gear in road vehicles. J. Phys. Conf. Ser. 2024, 2714, 012017. [Google Scholar] [CrossRef]
- Zhou, K.; Xi, M.; Guo, Y.; Lu, X. Simulation Research on Non-Bevel Gear Transmission Mechanism. Mechanika 2023, 29, 502–510. [Google Scholar] [CrossRef]
- Xiang, C.; Huang, K.; Langari, R. Power-Split Electromechanical Transmission Design and Validation with Three Planetary Gears for Heavy-Duty Vehicle. IJST-Trans. Mech. Eng. 2018, 42, 383–400. [Google Scholar] [CrossRef]
- Li, Q.; Liao, M.; Wang, S. A zero-spin design methodology for transmission components generatrix in traction drive continuously variable transmissions. J. Mech. Design 2018, 140, 033301. [Google Scholar] [CrossRef]
- He, D.; Xu, H.; Wang, Y.; Duan, Z.; Yang, N.; Wang, T. Research on vertical vibration characteristics of rolling mill based on magnetorheological fluid damper absorber. Mech. Syst. Signal Pr. 2025, 224, 112203. [Google Scholar] [CrossRef]
- Liu, X.; Tan, J.; Long, S. Multi-axis fatigue load spectrum editing for automotive components using generalized S-transform. Int. J. Fatigue 2024, 188, 108503. [Google Scholar] [CrossRef]
- Wang, Y.; Su, Z.; Xu, Q.; Luan, T.H.; Lu, R. Secured and Cooperative Publish/Subscribe Scheme in Autonomous Vehicular Networks. IEEE Trans. Intell. Transp. 2024, 25, 2235–2252. [Google Scholar] [CrossRef]
- VOP Trenčín. Operating and Maintenance Manual: Light Armored Vehicle 4x4 Iveco M65E19WM 4x4—LMV with Circular Turn with Mounted NSV 12.7 Heavy Machine Gun [Návod na Obsluhu a Údržbu: Ľahké Obrnené Vozidlo 4x4 Iveco M65E19WM 4x4—LMV s Kruhovým Otočom s Lafetáciou Ťažkého Guľometu NSV 12,7]; VOP Trenčín, a.s.: Trenčín, Slovakia, 2011; 74p. [Google Scholar]
- PRAGA-Export. Light Armored Combat Vehicle Iveco M65E19WM 4x4 LOV 50B: Operation and Maintenance Manual of the Vehicle [Lehké Obrněné Vozidlo Bojové Iveco M65E19WM 4x4 LOV 50B: Příručka pro Obsluhu a Údržbu Vozidla]; PRAGA-Export s.r.o.: Prague, Czech Republic, 2010; 156p. [Google Scholar]
- Dropa, P.; Riečičiar, M.; Semrád, K.; Draganová, K. Numerical Simulation and Analytical Validation of the Planetary Gearbox. TEM J. 2025, 14. accepted. [Google Scholar]
Disclaimer/Publisher’s Note: The statements, opinions and data contained in all publications are solely those of the individual author(s) and contributor(s) and not of MDPI and/or the editor(s). MDPI and/or the editor(s) disclaim responsibility for any injury to people or property resulting from any ideas, methods, instructions or products referred to in the content. |
© 2025 by the authors. Licensee MDPI, Basel, Switzerland. This article is an open access article distributed under the terms and conditions of the Creative Commons Attribution (CC BY) license (https://creativecommons.org/licenses/by/4.0/).