Abstract
This study aims to identify personal, clinical, and acoustic predictors of therapy outcomes based on changes in Korean voice-related quality of life (K-VRQOL) scores, as well as to compare the predictive performance of traditional regression and machine learning models. A total of 102 participants undergoing voice therapy are retrospectively analyzed. Multiple regression analysis and four machine learning algorithms—random forest (RF), gradient boosting (GB), light gradient boosting machine (LightGBM), and extreme gradient boosting (XGBoost)—are applied to predict changes in K-VRQOL scores across the total, physical, and emotional domains. The Shapley additive explanations (SHAP) approach is used to evaluate the relative contribution of each variable to the prediction outcomes. Female gender and comorbidity status emerge as significant predictors in both the total and physical domains. Among the acoustic features, jitter, SFF, and MPT are closely associated with improvements in physical voice function. LightGBM demonstrates the best overall performance, particularly in the total domain (R2 = 32.54%), while GB excels in the physical domain. The emotional domain shows relatively low predictive power across the models. SHAP analysis reveals interpretable patterns, highlighting jitter and speaking fundamental frequency (SFF) as key contributors in high-performing models. Integrating statistical and machine learning approaches provides a robust framework for predicting and interpreting voice therapy outcomes. These findings support the use of explainable artificial intelligence (AI) to enhance clinical decision-making and pave the way for personalized voice rehabilitation strategies.
1. Introduction
In modern society, an individual’s quality of life (QOL) is determined not merely by survival or the presence of disease, but by a wide range of multidimensional factors such as psychological well-being, the quality of social relationships, job satisfaction, self-efficacy, and communication ability [1,2,3,4]. Among these, the voice plays a central role in human interaction as a primary means of communication. It is essential for emotional expression, information exchange, and social engagement. In particular, for individuals whose professions depend heavily on vocal use—such as teachers, broadcasters, counselors, and call center agents—vocal health is critically important. When vocal problems occur, they can result in more than inconvenience; they may lead to serious limitations in occupational functioning, emotional distress, and social withdrawal [5,6,7,8]. Due to these impacts, vocal health is increasingly being recognized not merely as a subcomponent of physical health, but as a crucial determinant of overall quality of life. Accordingly, there has been growing interest in the development and application of tools that can quantitatively assess the relationship between voice-related issues and QOL. One of the most widely adopted instruments for this purpose is the voice-related quality of life (VQOL) questionnaire, which measures subjective impairments and quality of life reduction caused by vocal dysfunction. This tool has been translated and culturally adapted for use in many countries [9,10].
In Korea, the Korean version of the voice-related quality of life (K-VRQOL) instrument was developed to reflect its linguistic and cultural contexts. It has been validated for use in clinical and research settings and is employed for the diagnosis of voice disorders, assessment of pre- and post-therapy outcomes, and monitoring of patients’ quality of life. Its standardized and user-friendly design makes it an effective tool for capturing patients’ subjective experiences and for guiding patient-centered care [11,12]. Despite its utility, however, empirical research on the determinants of K-VRQOL scores remains limited. Prior studies have largely focused on individual demographic or medical factors, such as sex, age, smoking status, alcohol consumption, presence of comorbidities, or history of surgery, and have often relied on small sample sizes and traditional univariate or multivariate statistical analyses [13,14]. Furthermore, objective acoustic parameters such as jitter, shimmer, and the speaking fundamental frequency (SFF), which provide valuable insight into vocal function, are frequently excluded due to the complexity of data collection and interpretation [15,16]. Additionally, conventional statistical methods have inherent limitations in modeling the complex and nonlinear interactions between predictors. For instance, the effects of smoking or vocal training on QOL may vary depending on individual conditions, yet these conditional or interaction effects are difficult to detect using traditional approaches [17,18]. To address such limitations, the application of artificial intelligence (AI) and machine learning (ML) techniques in health-related research has gained traction. These methods are capable of learning complex, nonlinear patterns in data and provide not only accurate predictions but also meaningful insights into the relative importance of various predictors [19].
In particular, explainable AI techniques such as Shapley additive explanations (SHAP) allow researchers and clinicians to understand how each variable contributes to model predictions in a transparent and interpretable manner. SHAP has emerged as a powerful tool for enhancing trust and understanding in AI-driven health research [17,20,21]. Nevertheless, studies that employ machine learning-based integrated analyses to predict K-VRQOL scores—and explain the results in clinically interpretable ways—are still scarce, both in Korea and internationally. Therefore, the present study aims to identify the key predictors that influence K-VRQOL scores through a comprehensive, multidimensional analytical framework. Specifically, this study incorporates a wide range of variables, including demographic and behavioral factors (e.g., sex, smoking and alcohol use, coffee consumption, voice use, presence of comorbidities, history of surgery, and vocal training experience), as well as objective acoustic measures (e.g., jitter, shimmer, and SFF). Employing both traditional statistical analysis and machine learning techniques, this study seeks to evaluate the statistical significance and predictive contribution of each variable. Furthermore, this study utilizes SHAP to visualize and interpret the importance of each factor in the prediction model.
This study offers several academic and practical contributions.
- First, it presents a holistic analytical framework that elucidates the complex relationship between voice and quality of life beyond fragmented or univariate approaches.
- Second, it demonstrates the use of machine learning and explainable AI to capture nonlinear interactions and assess the relative importance of predictors in an interpretable way.
- Third, the findings provide a scientifically grounded foundation for the early identification of at-risk individuals, the development of preventive strategies, and the implementation of effective interventions aimed at improving voice-related quality of life.
2. Related Works
Several prior studies have explored the relationship between vocal disorders and voice-related quality of life (V-RQOL), utilizing various populations, evaluation tools, and analytical methods [1,9,10,19,22,23,24].
Emshoff et al. [1] investigated the impact of temporomandibular disorder (TMD) on voice-related quality of life (V-RQOL) using a multidisciplinary assessment framework. Utilizing the Diagnostic Criteria for TMD (DC/TMD) Axis I, the authors examined correlations between V-RQOL scores and psychological as well as functional variables such as depression (measured using the Hospital Anxiety and Depression Scale, HADS) and verbal/emotional expression (measured using the Jaw Functional Limitation Scale, JFLS-VEE). Multiple linear regression analysis revealed that higher depression scores and greater limitations in emotional expression were significantly associated with a lower V-RQOL, independent of age, gender, or pain duration. These findings highlight the importance of psychological and articulatory factors in voice perception and suggest that voice problems in TMD patients may not be merely mechanical but also psychosocial in nature. This underscores the need for multidisciplinary therapeutic approaches. The present study builds on this by incorporating comorbidity and emotional variables alongside objective acoustic measures in a machine learning framework to evaluate voice-related quality of life.
Kim et al. [19] developed a machine learning model to predict the general health-related quality of life (QOL) among middle-aged South Korean adults using a large-scale, population-based cohort (N = 4048). They employed seven machine learning algorithms and addressed class imbalance using the synthetic minority oversampling technique (SMOTE). This study used the SF-12 survey to assess QOL, dividing it into physical (PCS), mental (MCS), and total QOL. Among the predictors, stress level and sleep quality consistently emerged as the most important factors across all outcome domains. The random forest algorithm achieved the best predictive performance, with an area under the curve (AUC) of up to 0.822. This research demonstrated the feasibility and effectiveness of applying machine learning for multidimensional QOL prediction. Although not specific to the voice, it reinforces the applicability of algorithmic approaches in modeling complex health-related quality indices. Our study extends this framework to the domain of voice-related QOL by incorporating both subjective assessments and objective vocal features within a similar machine learning paradigm.
Despotovic et al. [22] proposed a novel, non-invasive method for estimating respiratory quality of life (RQoL) using voice biomarkers. Using data from over 1900 participants in the Colive Voice project, the authors extracted sustained vowel phonation features and trained deep learning models to predict RQoL levels. They compared models based on clinical features alone, voice features alone, and a combination of the two, finding that multimodal models significantly outperformed unimodal ones (AUROC = 0.77). Their study demonstrated that acoustic signals derived from smartphones could reflect underlying respiratory health conditions such as asthma. This supports the growing trend toward digital phenotyping and personalized, scalable health monitoring. In the present study, this work inspires the integration of acoustic features such as jitter, shimmer, and SFF into models predicting K-VRQOL, thereby moving beyond self-reported measures toward a more objective, data-driven approach.
Schuman et al. [10] conducted a longitudinal analysis of patients with subglottic stenosis (SGS), assessing changes in their V-RQOL scores following different surgical interventions. Analyzing 130 procedures across 61 patients, the authors found that the improvement in airway caliber post-surgery was significantly correlated with gains in V-RQOL (β = 1.5, p = 0.02), regardless of the type, frequency, or interval of therapy. These findings suggest that the V-RQOL questionnaire is a sensitive tool for tracking functional improvements over time in the context of chronic airway diseases. The present research draws from this study’s strength in longitudinal V-RQOL measurement and extends it by examining predictors of quality of life at a single time point using broader variables and advanced modeling techniques.
Stojanovic and colleagues [23] examined the effects of dysphonia on children’s quality of life in Serbia using a pediatric adaptation of the V-RQOL questionnaire. Their study found that dysphonic children reported significantly lower physical and socio-emotional functioning. Acoustic data, including jitter and shimmer, were also collected and analyzed. Their findings suggest that early detection and intervention are essential, and that objective acoustic parameters can complement subjective assessments. Although pediatric in scope, their study affirms the importance of combining perceptual and objective data in voice-related QOL assessments—an approach central to the present work.
The foundational study by Hogikyan et al. [9] introduced and validated the V-RQOL instrument in the context of surgical intervention for unilateral vocal fold paralysis. Comparing three groups—surgically treated patients, untreated patients, and healthy controls—this study found that those undergoing type I thyroplasty reported significantly improved V-RQOL scores post-operatively, although still lower than the healthy controls. This research underscored the clinical utility of patient-reported outcomes in voice assessment, highlighting that objective vocal improvement must align with perceived quality of life gains. This early emphasis on patient-centered metrics laid the groundwork for the subsequent development of culturally adapted versions such as the K-VRQOL. Our study builds on this tradition by aiming to predict K-VRQOL scores using a combination of acoustic, behavioral, and demographic variables.
Yu et al. [24] conducted a large-scale study (N = 672) comparing the V-RQOL and voice activity and participation profile (VAPP) among teachers in China. They reported that teachers with voice disorders, especially females and those at the primary education level, had significantly lower V-RQOL scores. Hoarseness and foreign body sensations were common complaints, and common diagnoses included chronic laryngitis and vocal cord nodules. Their study also showed a strong correlation between the V-RQOL and VAPP, reinforcing the construct validity of the V-RQOL. This research demonstrates how occupational and gender factors influence voice-related QOL and supports the inclusion of behavioral and lifestyle variables in predictive modeling—an approach mirrored in the current study.
3. Materials and Methods
3.1. Database
This study retrospectively examined the clinical data of 304 patients diagnosed with voice disorders at the Department of Otorhinolaryngology, Nowon Eulji Medical Center, Eulji University, between March 2020 and January 2024. Ethical approval was obtained from the Institutional Review Board (IRB No. 2022-04-014), and all procedures adhered to research ethics standards. After excluding individuals who discontinued voice therapy or were lost to follow-up, a final cohort of 102 patients was included for analysis. For acoustic data collection, participants were instructed to sustain the vowel sound /a/ at a comfortable pitch and loudness, with a microphone positioned 5 cm from the mouth [25]. All recordings were conducted in a sound-treated room to minimize environmental noise and ensure consistent recording conditions. A high-quality condenser microphone was used for data acquisition, and calibration was performed prior to each recording to maintain signal consistency. Participants were seated in an upright position and asked to sustain phonation for at least 5 s to ensure signal stability for acoustic analysis. All recordings were supervised by experienced speech-language pathologists to ensure strict adherence to the protocol. The resulting voice samples were digitized at a sampling rate of 44.1 kHz and analyzed using the Multidimensional Voice Program (MDVP) software version 2.3 developed by Kay Elemetrics [26]. The acoustic data were further subjected to quality control, and recordings with excessive background noise, voice breaks, or irregular phonation were excluded from analysis.
Table 1 provides an overview of the dataset used in this study. The dataset comprises recordings of the sustained vowel /a/ from 63 female and 35 male participants, each diagnosed with 1 or more of over 19 distinct voice pathologies. In addition to acoustic recordings, the dataset includes demographic and clinical variables such as gender, smoking status, alcohol consumption, voice usage status, coffee consumption, comorbidities, surgical history, and voice training status (including the number of training sessions). Furthermore, it contains acoustic parameters measured both before and after voice disorder therapy, including fundamental frequency (F0), jitter, shimmer, SFF, noise-to-harmonics ratio (NHR), and maximum phonation time (MPT).

Table 1.
Overview of the dataset utilized in this study.
3.2. K-VRQOL Questionnaires
Subjective voice evaluations commonly utilize tools such as the Voice Handicap Index (VHI) and the V-RQOL questionnaire. In particular, the close relationship between health and quality of life highlights the importance of evaluating voice-related quality of life, as such assessments can capture the perceived impact of voice disorders across the personal, social, and occupational domains [26,27,28]. Kim et al. [11] translated the V-RQOL into Korean and validated the Korean version (K-VRQOL) with both individuals with voice disorders and the general adult population. Their study found that the item discrimination indices were statistically significant, and strong correlations were observed among individual items. Furthermore, the K-VRQOL scores were significantly higher among healthy adults compared with those with voice disorders, indicating that individuals with voice disorders experience greater discomfort and reduced quality of life due to their vocal problems. Based on these findings, the K-VRQOL was suggested as a useful tool for evaluating voice-related quality of life. It is concise and easy to administer, making it practical not only for assessment purposes but also for guiding therapy planning and monitoring therapeutic outcomes.
The V-RQOL is a subjective assessment tool developed by Hogikyan and Sethuraman [29]. In this study, the Korean adaptation of the V-RQOL by Kim et al. [11], known as the K-VRQOL, was used. Among its 10 items, the 10th item was modified to read, “I have become less outgoing (because of my voice)”. The K-VRQOL is a useful tool for evaluating the impact of voice disorders on an individual’s quality of life. It consists of two subdomains: emotional and physical. The variables associated with the emotional domain are items 4, 5, 8, and 10, whereas those associated with the physical domain are items 1, 2, 3, 6, 7, and 9. Responses are recorded on a 5-point Likert scale, where 1 indicates “no problem”, 2 “a slight problem”, 3 “a moderate problem”, 4 “a severe problem”, and 5 “as bad as it can be”. The raw scores range from 0 to 50 and are converted to standardized scores ranging from 0 to 100. A lower standardized score indicates a poorer voice-related quality of life, while a higher score reflects a minimal or no impact of voice problems on quality of life [9,11]. The details are provided in Table 2.
Table 2.
K-VRQOL [9,11].
3.3. Statistical Analysis
In this study, multiple regression analysis was employed to identify the factors influencing K-VRQOL. Multiple regression is a statistical technique that allows the simultaneous analysis of the relationship between a single continuous dependent variable and two or more independent variables [30]. One of its key advantages lies in its ability to assess the individual contribution of each predictor while controlling for the effects of other variables in the model. As an extension of simple linear regression, multiple regression is particularly suitable for clinical and social science research, where multiple interacting factors often influence the outcome of interest [31,32].
Each regression coefficient indicates the extent and direction (positive or negative) of the change in the dependent variable associated with a one-unit change in the corresponding independent variable. The goodness-of-fit of the model is evaluated using the coefficient of determination (R2) and the adjusted R2, while the overall significance of the model is assessed using an F-test, and the statistical significance of individual predictors is tested using t-tests. To ensure the reliability of the analysis, key statistical assumptions—such as the linearity, independence of errors, homoscedasticity, normality of residuals, and absence of multicollinearity—were examined prior to the interpretation of the results. In particular, multicollinearity, which can distort the interpretation of regression coefficients, was assessed using the variance inflation factor (VIF) and tolerance values [30,31,32].
Multiple regression analysis is widely used across various disciplines and is particularly valuable in studies that aim to explain or predict health-related quality of life. In this study, the independent variables included gender, smoking status, voice use status, voice training experience, and acoustic parameters measured before and after therapy (e.g., fundamental frequency, jitter, shimmer, NHR, SFF, and MPT). The analysis aimed to determine the significant predictors of K-VRQOL and provide a basis for clinical intervention and rehabilitation planning for individuals with voice disorders.
3.4. Machine Learning Models
In this study, four machine learning algorithms—random forest (RF), gradient boosting-based learning (GB), light gradient boosting machine (LightGBM), and extreme gradient boosting (XGBoost)—were applied to predict K-VRQOL and to identify its significant predictors. These algorithms were selected based on their ability to capture complex, nonlinear interactions among diverse features, including acoustic, clinical, and lifestyle-related variables. Unlike traditional statistical models, machine learning approaches offer greater flexibility and predictive accuracy, particularly in the presence of high-dimensional and heterogeneous data structures [33,34,35,36].
RF is an ensemble learning algorithm based on the Bagging technique, where multiple decision trees are trained independently on random subsets of the data and features. The final prediction is obtained by aggregating the outputs of individual trees, either by majority vote (classification) or averaging (regression). This approach reduces variance and prevents overfitting, thereby enhancing model stability. Moreover, RF provides measures of feature importance, which aids in the interpretability of the model [33]. In this study, RF was employed to account for potential interactions among predictors and to identify the most influential variables associated with K-VRQOL.
The GB algorithm is an ensemble learning technique that builds a strong predictive model by sequentially combining multiple weak learners, typically decision trees, while iteratively correcting residual errors using the gradient of the loss function. This approach enables the model to effectively capture complex nonlinear relationships and interactions among variables [34]. The algorithm was selected for its ability to efficiently handle complex and high-dimensional clinical data, accommodate missing values, and automatically identify nonlinear effects and variable interactions, which are common challenges in medical prediction studies.
LightGBM is a highly efficient gradient-boosting framework developed by Microsoft, designed for speed and scalability. It adopts a leaf-wise tree growth strategy, where the leaf that results in the greatest loss reduction is split first. This results in deeper and more accurate trees compared with level-wise methods. LightGBM also supports histogram-based learning, categorical feature handling, automatic missing value imputation, and parallel processing, making it suitable for high-dimensional and large-scale datasets [35]. Given the mixed types of features (e.g., acoustic, categorical, and clinical) used in this study, LightGBM was chosen for its ability to deliver fast computation and a high predictive performance.
XGBoost is an advanced implementation of gradient boosting algorithms. It incorporates L1 and L2 regularization to reduce overfitting, and supports several powerful features such as parallel training, early stopping, the automatic handling of missing values, and tree pruning. XGBoost is known for its superior predictive accuracy and has been widely adopted in data science competitions and real-world applications [36]. In this study, XGBoost was employed due to its robustness in handling complex feature interactions and its reliable performance even in relatively small datasets.
Although each algorithm differs in their architecture and learning strategy, they all provide strong predictive capabilities and interpretability suited to the objectives of this study. RF offers model stability and feature importance analysis; LightGBM ensures computational efficiency and handles high-dimensional data effectively; XGBoost supports fine-tuned model regularization and complex interaction modeling; and GB underpins the optimization process in boosting algorithms. By applying and comparing these four algorithms, this study aimed to identify the most effective machine learning approach for predicting K-VRQOL while balancing accuracy, interpretability, and computational efficiency. This multi-model approach strengthens the validity of the findings and ensures the robust identification of the key factors influencing voice-related quality of life.
3.5. Shapley Additive Explanations (SHAP)
In this study, SHAP was employed to enhance the interpretability of the machine learning model predictions. SHAP is a model explanation framework derived from cooperative game theory; specifically, the concept of Shapley values, which aims to fairly attribute the contribution of each feature to the prediction outcome. By quantifying the marginal contribution of each feature across all possible combinations of features, SHAP provides a consistent and theoretically grounded measure of feature importance [37].
The SHAP value for each feature represents the average contribution of that feature to the model’s prediction, accounting for all possible subsets of other features. This allows for both local (individual prediction-level) and global (dataset-level) interpretability. In particular, tree SHAP—an optimized algorithm for tree-based models such as RF, LightGBM, and XGBoost—enables the efficient and accurate computation of SHAP values. Additionally, SHAP offers a suite of visualization tools—including summary plots, force plots, and dependence plots—that aid in understanding both the magnitude and direction of each feature’s effect on the model output [38,39].
In the present study, SHAP was utilized to analyze and visualize the relative importance and directional impact of various features in predicting K-VRQOL scores. By applying SHAP values, this study identified which features most significantly influenced individual predictions, thereby improving the transparency of the machine learning models. Furthermore, SHAP analysis enabled a quantifiable interpretation of how pre- and post-therapy acoustic features contributed to quality-of-life outcomes. This provides valuable insights not only for understanding model behavior but also for supporting evidence-based clinical decision-making and developing personalized intervention strategies for individuals with voice disorders.
4. Results
4.1. Descriptive Analysis
Detailed frequency distributions of the demographic and clinical variables—such as gender, smoking status, alcohol consumption, voice usage status, coffee intake, the presence of comorbidities, surgical history, and voice training status (including the number of training sessions)—are available in [26].
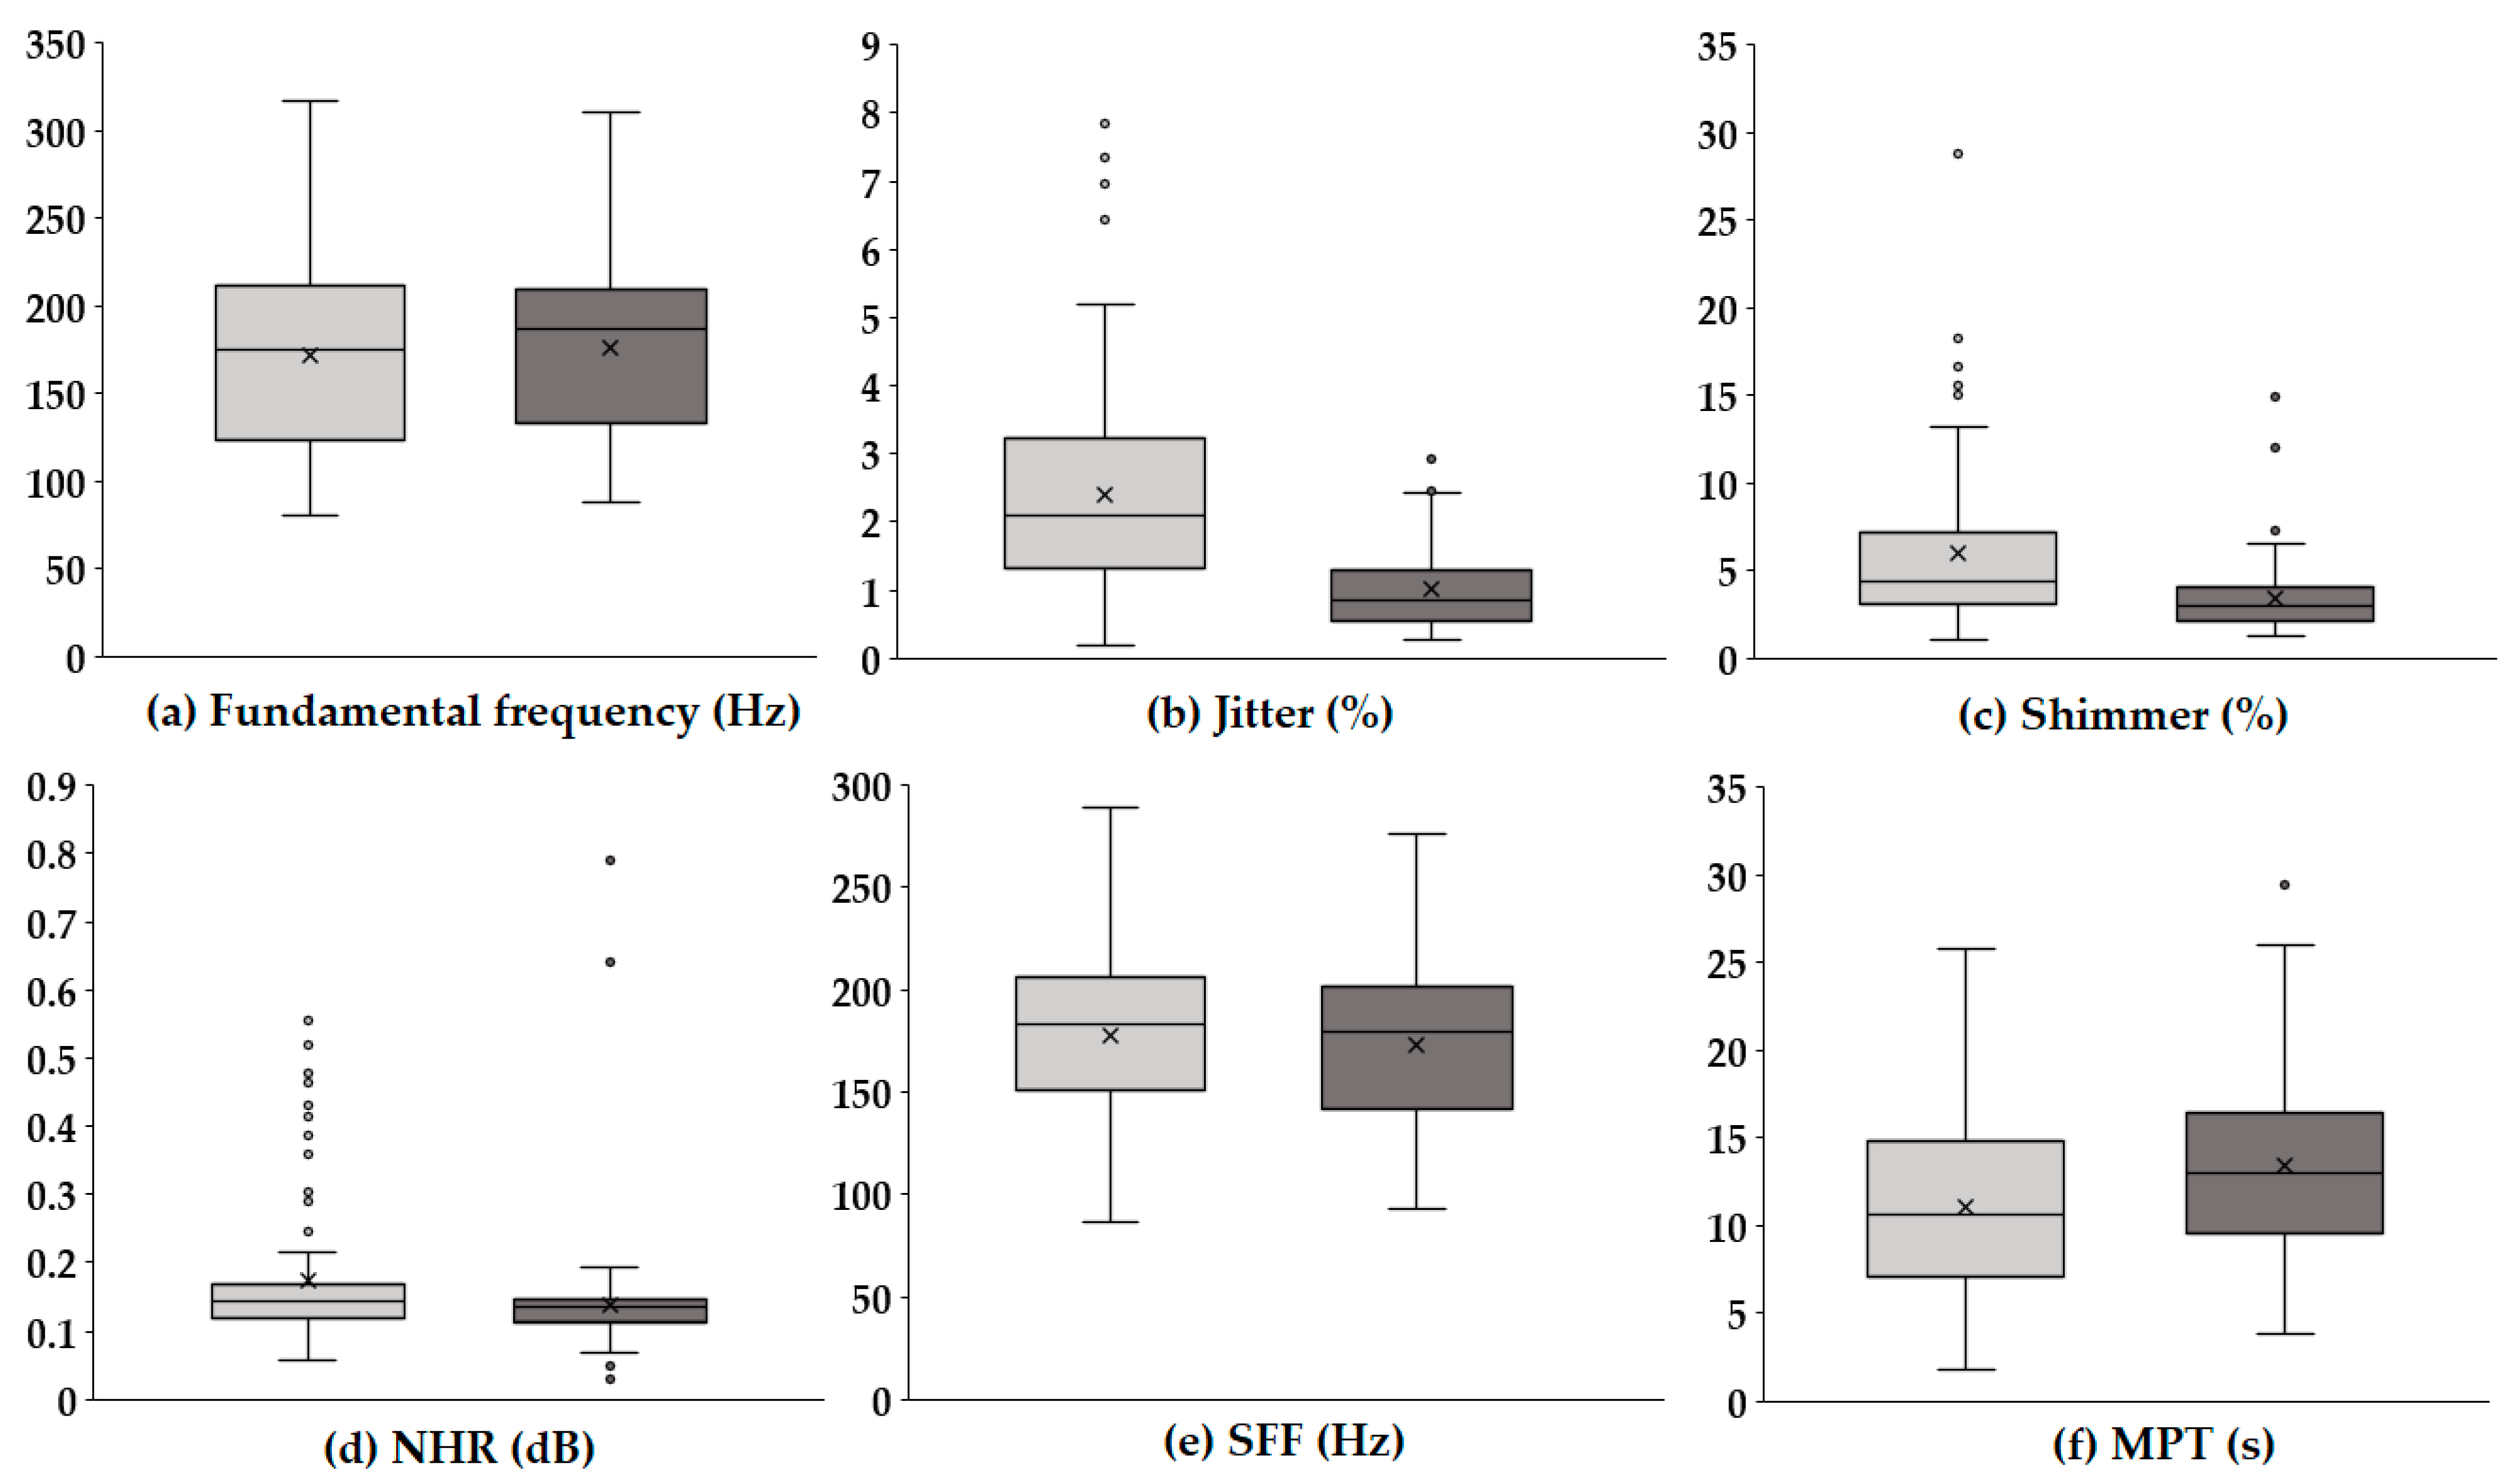
Figure 1 presents boxplots illustrating the changes in key acoustic parameters before and after voice therapy. In each panel, the light gray box represents the values prior to voice therapy, while the dark gray box indicates values following voice therapy.
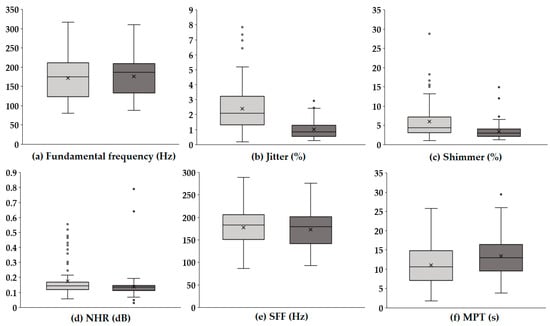
Figure 1.
Boxplots of acoustic parameters before and after voice therapy. The light gray boxes (left) represent pre-therapy values, while the dark gray boxes (right) represent post-therapy values. Each boxplot illustrates the distribution, median, and variability of the key acoustic measures, highlighting changes following voice therapy.
The F0 (Hz), which reflects the average rate of vocal fold vibration, showed no substantial difference between pre- and post-therapy conditions, with a similar distribution range observed. In contrast, jitter (%), representing cycle-to-cycle frequency variations, significantly decreased after therapy, suggesting improved vocal stability. A notable reduction was also observed in shimmer (%), which quantifies amplitude variability, indicating enhanced consistency in voice amplitude post-therapy. Similarly, the NHR (dB), a measure of breathiness in the voice signal, was lower following therapy, implying an improvement in voice clarity and quality. The SFF (Hz), or the average frequency used during speech, remained relatively stable, with only a slight decreasing trend. Meanwhile, the MPT (s) increased after therapy, reflecting improved respiratory support and efficiency of phonation. Overall, these results indicate that voice therapy led to marked improvements in vocal stability and quality, particularly through reductions in perturbation measures (jitter and shimmer) and noise components (NHR), as well as an enhancement in sustained phonation ability (MPT).
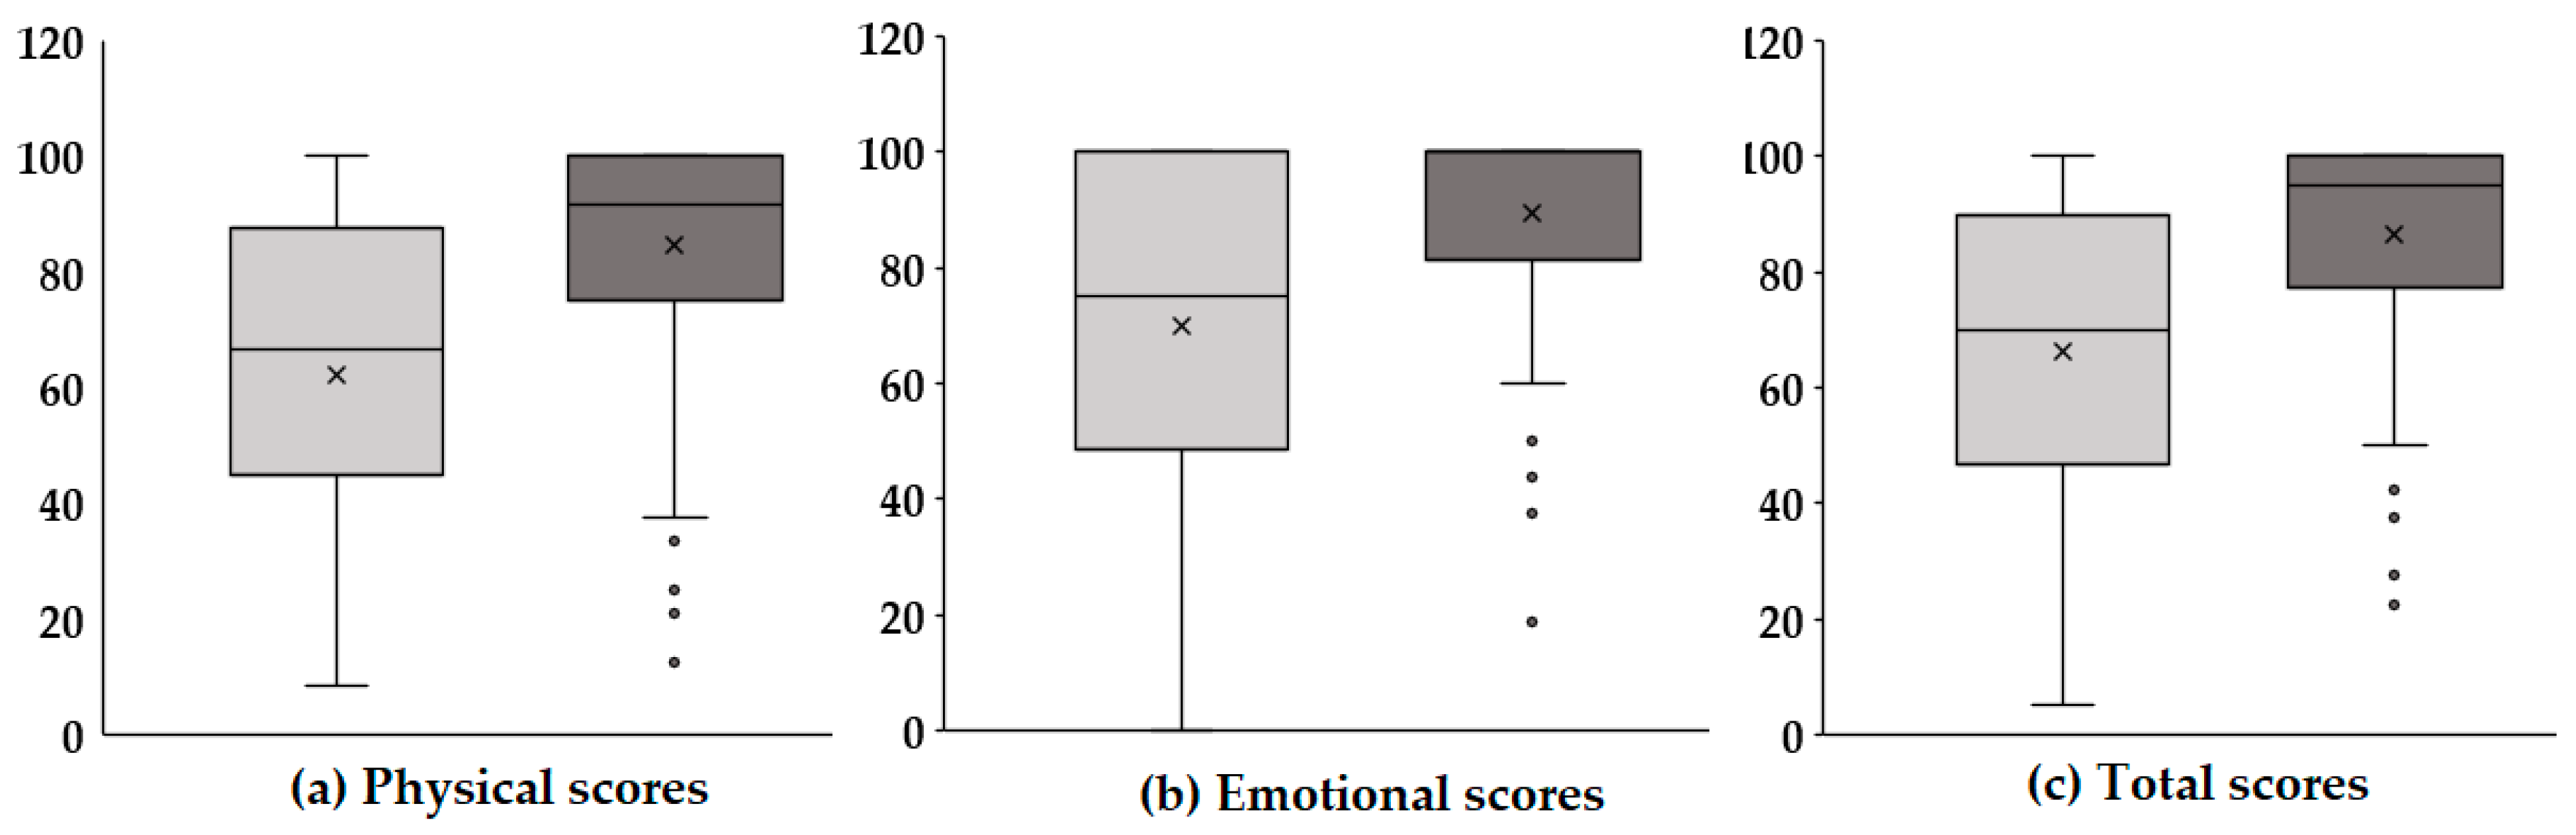
Figure 2 presents boxplots illustrating the changes in physical, emotional, and total scores before and after voice therapy. In each panel, the light gray box represents pre-therapy scores, while the dark gray box indicates post-therapy scores. Panel (a) displays the physical scores, which reflect functional aspects of the vocal mechanism and physical discomfort related to voice disorders. After therapy, there was a slight upward trend in these scores, suggesting that voice therapy may have contributed to improvements in vocal function and a reduction in physical strain associated with phonation. Although the increase was modest, it implies potential therapeutic benefits in the physical domain, warranting further statistical verification. Panel (b) shows the emotional scores, which assess the psychological and emotional burden caused by voice disorders, including anxiety, frustration, and social withdrawal. The post-therapy scores exhibited a more pronounced increase compared with the physical domain. This suggests that voice therapy had a notable positive impact on the emotional well-being of the participants. This improvement in emotional scores may be attributed to enhanced vocal function, leading to increased confidence in communication and reduced psychological distress. Panel (c) presents the total scores, which represent the combined impact across both the physical and emotional domains. A significant increase in total scores was observed after therapy, indicating a comprehensive improvement in voice-related quality of life. The changes in score distributions, as visualized through the boxplots, reinforce the therapeutic effect not only on the objective functional measures but also on the patients’ subjective experiences and perceptions. In summary, the results suggest that voice therapy provides multidimensional benefits. Beyond measurable acoustic improvements, it contributes to enhanced physical comfort, emotional stability, and overall quality of life in individuals with voice disorders.
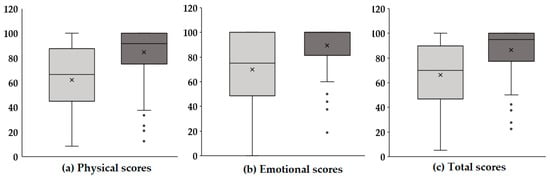
Figure 2.
Comparison of K-VRQOL scores pre- and post-voice therapy across physical (P), emotional (E), and total (T) domains.
4.2. Multiple Regression Analysis
To assess the efficacy of voice therapy based on changes in K-VRQOL scores, a multiple regression analysis was conducted. The independent variables included gender, smoking status, alcohol consumption, voice usage status, coffee consumption, presence of comorbidities, history of surgery, voice training experience, and acoustic parameters (Table 3). Gender was coded as 0 for males and 1 for females, and the remaining binary variables—such as smoking status, alcohol consumption, and others—were similarly coded (0 = no; 1 = yes). The dependent variable was defined as the difference in K-VRQOL scores before and after voice therapy, representing the degree of improvement in voice-related quality of life. Separate regression models were constructed for the total score, physical domain, and emotional domain to identify predictors associated with therapy-induced improvements.
Table 3.
Multiple regression coefficients of overall parameters in K-VRQOL.
Table 3 presents the results of multiple regression analyses examining the factors influencing the changes in K-VRQOL scores before and after voice therapy. The dependent variables are the differences in the total, physical, and emotional scores, and various demographic, clinical, and acoustic parameters were entered as predictors.
In terms of total K-VRQOL score changes, gender was a significant predictor (β = 0.347, p = 0.003), indicating that female participants exhibited greater improvements in overall voice-related quality of life following therapy. Additionally, the presence of comorbidities (β = 0.223, p = 0.025) was positively associated with a greater improvement, possibly suggesting higher baseline impairment leading to greater therapy responsiveness. Among the acoustic parameters, a significant negative association was observed for SFF (β = −0.260, p = 0.026), implying that a change in speaking fundamental frequency was linked to enhanced perceived voice-related quality of life. For the physical domain, gender again emerged as a strong predictor (β = 0.370, p < 0.001), along with comorbidity status (β = 0.265, p = 0.003). Notably, the acoustic parameters such as jitter (β = −0.214, p = 0.009), SFF (β = −0.293, p = 0.004), and MPT (β = 0.180, p = 0.041) were significantly associated with improvements in the physical aspects of voice-related quality of life. These results suggest that improved frequency stability and increased phonation duration contribute positively to physical voice function recovery. In the emotional domain, smoking status was significantly associated with emotional score improvement (β = 0.238, p = 0.048), indicating that smokers may experience greater emotional benefits from voice therapy, although the underlying mechanism warrants further investigation. Additionally, SFF again showed a significant negative association (β = −0.248, p = 0.047), highlighting its consistent relevance across domains. Across all models, the VIF values were below 10, suggesting that multicollinearity among the predictors was not a concern. These findings underscore the importance of both demographic/clinical characteristics (e.g., gender, comorbidity, smoking) and acoustic features (especially SFF, jitter, and MPT) in predicting therapy-related improvements in voice-related quality of life.
Table 4 summarizes the model fit statistics for the multiple regression analyses conducted on the total, physical, and emotional domains of the K-VRQOL. For the total domain, the model demonstrated a moderate level of explanatory power with an R2 of 0.378 and an adjusted R2 of 0.264 (p < 0.001), indicating that approximately 26.4% of the variance in the overall improvement in voice-related quality of life was explained by the selected predictors. In the physical domain, the model showed relatively strong explanatory power, with an R2 of 0.533 and an adjusted R2 of 0.447 (p < 0.001). This suggests that nearly 44.7% of the variance in the improvement in physical voice-related quality of life could be attributed to the independent variables included in the model. For the emotional domain, the model yielded a lower R2 value of 0.284 and an adjusted R2 of 0.153 (p = 0.014), indicating a modest level of model fit, with 15.3% of the variance in emotional improvement being explained by the predictors. Despite the lower adjusted R2, the model remained statistically significant. These findings suggest that the predictive power of the model varies across domains, with the physical domain being best explained by the included variables, followed by the total and emotional domains.
Table 4.
Model summary in K-VRQOL.
4.3. Performance Evaluation of Machine Learning Models
In this study, four machine learning regression models—RF, GB, LightGBM, and XGBoost—were employed to predict therapy-induced changes in K-VRQOL scores. Model performance was assessed through five-fold cross-validation to ensure generalizability and robustness. Each model was trained using predefined hyperparameter settings (Table 5), and their predictive performances were evaluated across the total, physical, and emotional domains (Table 6). LightGBM achieved the highest predictive accuracy in the total domain (32.54%), demonstrating the effectiveness of its balanced configuration, which included a shallow tree depth (max_depth = 3), a limited number of leaves (num_leaves = 5), and regularization techniques (reg_alpha = 0.5, reg_lambda = 1.0). Subsampling strategies (subsample = 0.8, colsample_bytree = 0.6) further enhanced its generalization ability. The model also exhibited consistent performance in the physical (30.20%) and emotional (15.45%) domains, indicating its robustness across multiple dimensions of the K-VRQOL. The gradient boosting model (GB), trained with a large number of estimators (n_estimators = 800) and anti-overfitting constraints (min_samples_leaf = 3, max_features = ‘sqrt’), showed the best performance in the physical domain (30.50%). This result suggests that the model effectively captured the physical improvements derived from voice therapy. However, its performance in the emotional domain was considerably lower (6.81%), indicating a limited sensitivity to emotional variability. The RF, characterized by a very shallow tree depth (max_depth = 1) and a small number of trees (n_estimators = 60), was generally limited in capturing complex patterns. Nonetheless, it achieved the highest performance in the emotional domain (17.33%), suggesting that simpler models may still capture meaningful variance in affective outcomes. Its performance in the total (21.82%) and physical (24.11%) domains remained moderate. The XGBoost model, configured with a very low learning rate (learning_rate = 0.01) and shallow trees (max_depth = 2), prioritized stability and generalization through strong regularization (reg_alpha = 0.7, reg_lambda = 1.0). While this approach resulted in a lower performance in the total (17.50%) and emotional (11.74%) domains, it achieved a notable performance in the physical domain (27.83%), demonstrating domain-specific effectiveness.
Table 5.
Information related to machine learning models.
Table 6.
Performance of machine learning models.
These findings highlight the importance of aligning model complexity and regularization strategies with the characteristics of each target domain. In the context of multidimensional constructs such as K-VRQOL, the selection and optimization of machine learning models should be carefully tailored to maximize domain-specific predictive performance.
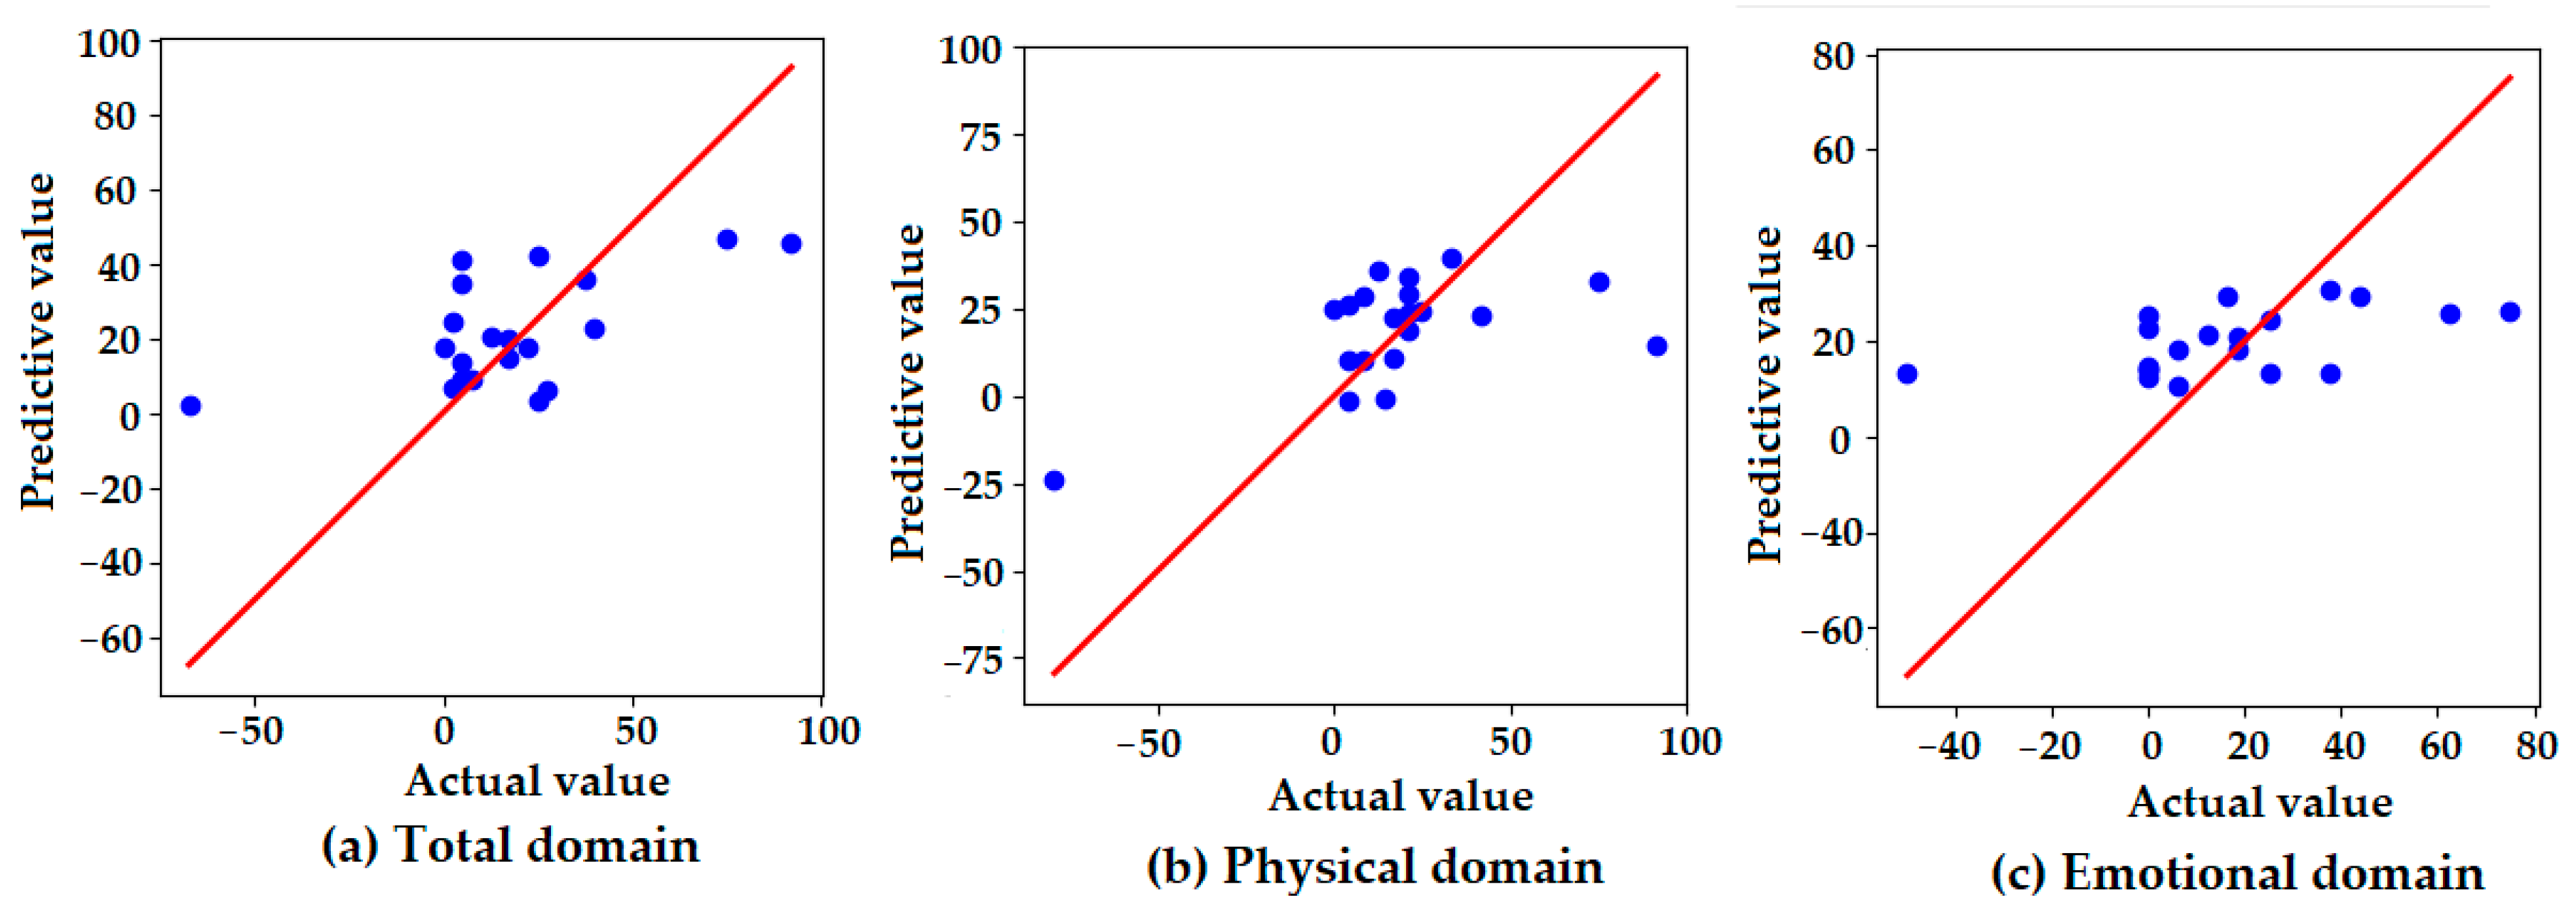
Figure 3 presents scatter plots comparing the actual and predicted values of the K-VRQOL scores across three domains: (a) total, (b) physical, and (c) emotional. The red diagonal line represents the line of perfect agreement (y = x), with closer proximity indicating higher prediction accuracy. In the total domain (a), the predicted values generally follow the distribution of the actual values, though some degree of overestimation and underestimation is observed. The dispersion around the reference line suggests moderate predictive accuracy, with several predictions deviating from the ideal. In the physical domain (b), the predicted values are tightly clustered around the ideal line, indicating that the model accurately captured physical improvements in voice-related quality of life. This finding is consistent with the model’s highest quantitative performance in this domain, as reported in Table 6. In contrast, the emotional domain (c) shows a relatively flat distribution of predicted values, regardless of actual value changes. This suggests that the model failed to effectively capture the variability in emotional outcomes, resulting in the lowest predictive performance among the three domains. These visual findings align with the numerical results in Table 6, reinforcing that the model demonstrated greater sensitivity to physical improvements than to emotional changes in the K-VRQOL scores.
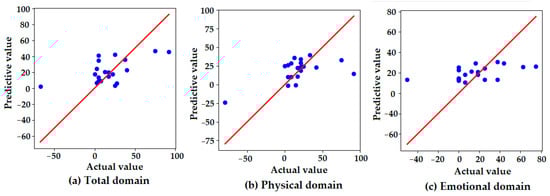
Figure 3.
Scatter plots of the actual versus predicted values for the K-VRQOL score improvements in the (a) total, (b) physical, and (c) emotional domains. Each point represents an individual case. The red diagonal line indicates the line of perfect prediction (y = x), where predicted values would exactly match actual observed improvements. The proximity of the points to this line reflects the predictive accuracy of the model in each domain.
4.4. Interpretability Analysis of Machine Learning Model Predictions
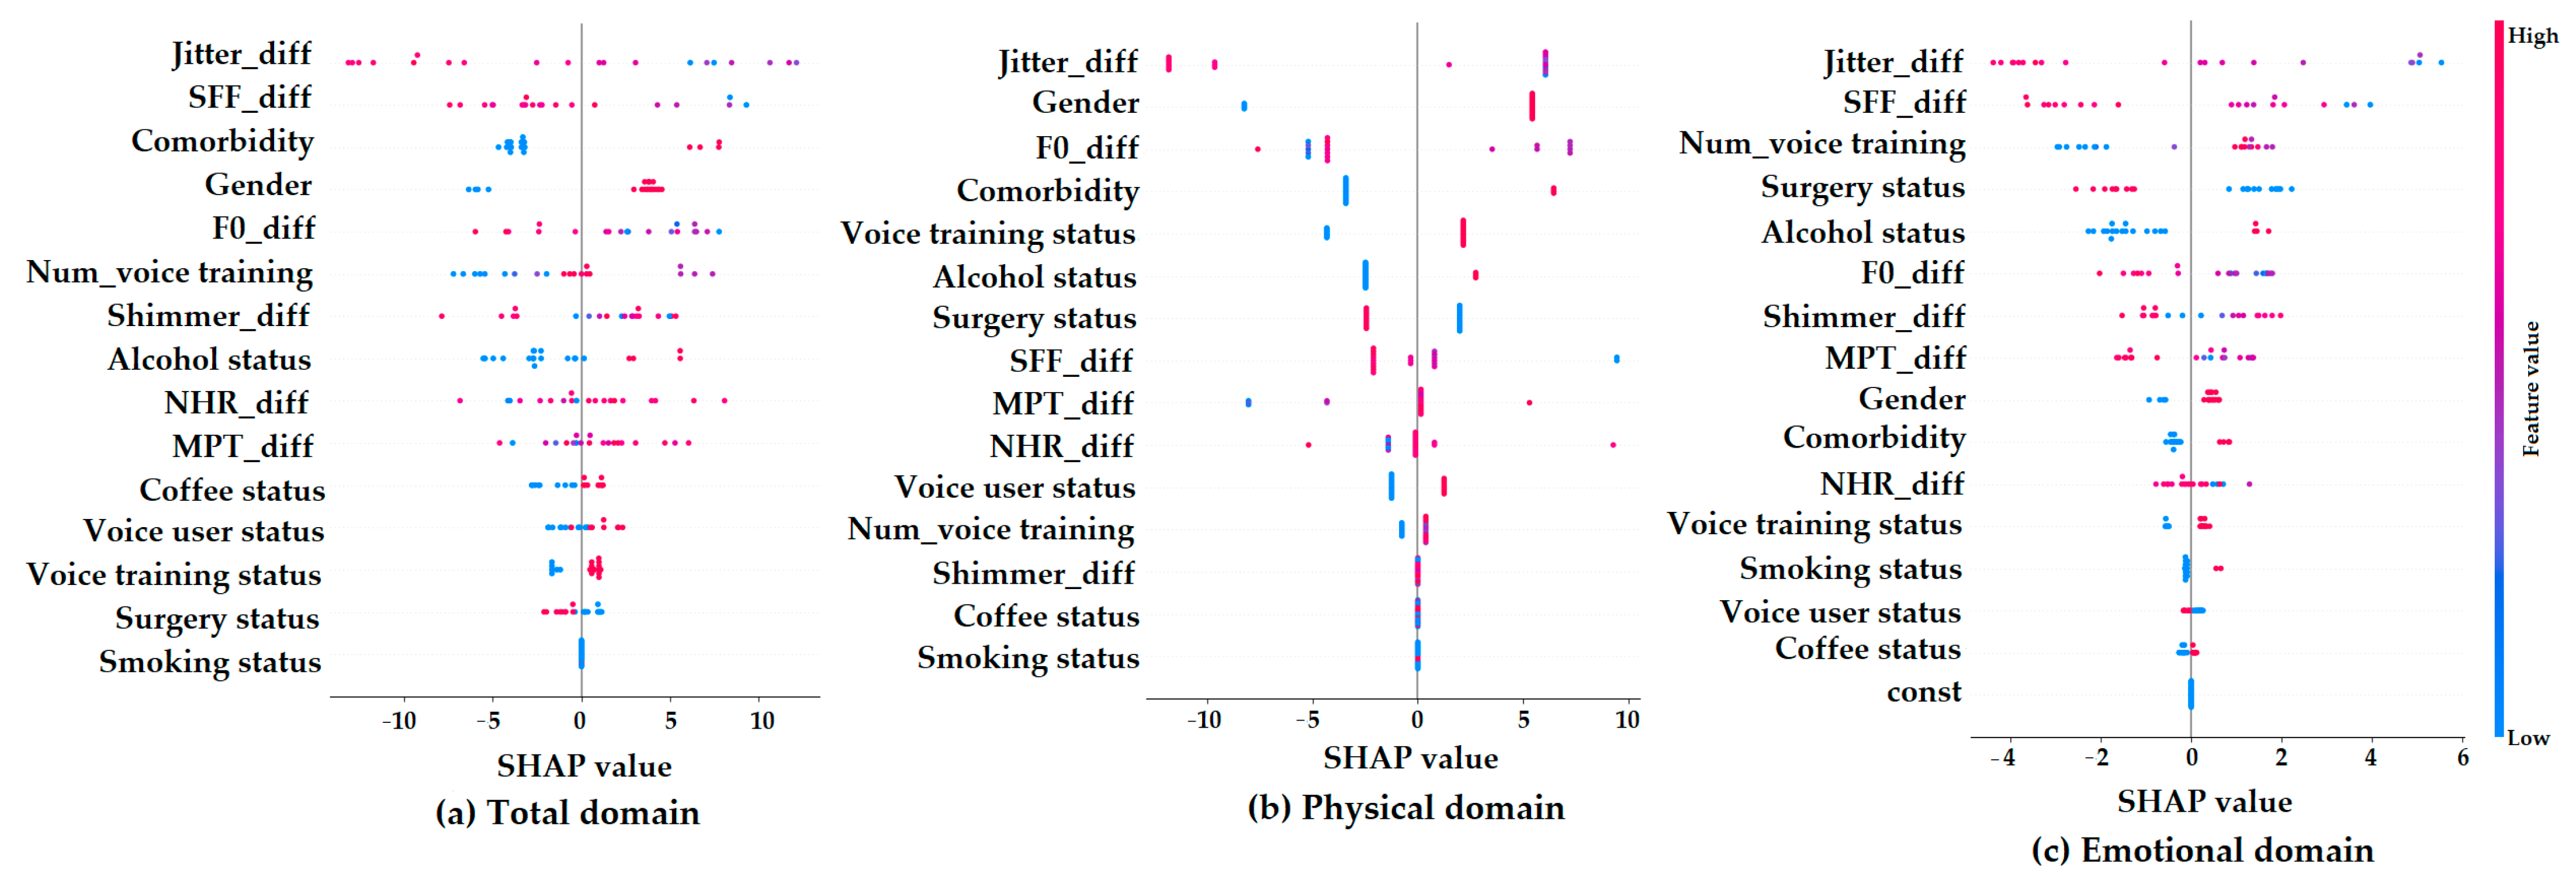
Figure 4 presents SHAP summary plots, which show how each feature contributes to the machine learning model’s predictions of K-VRQOL improvement in the (a) total, (b) physical, and (c) emotional domains. On each plot, the x-axis indicates the SHAP value, representing the degree to which a feature influences the model’s output. The color gradient shows the original value of each feature (with red indicating higher values and blue indicating lower values).
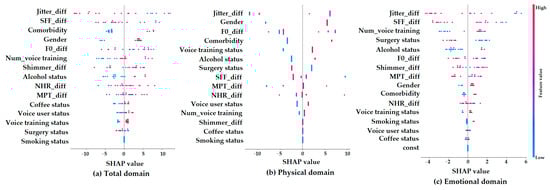
Figure 4.
SHAP summary plots for parameter contributions in predicting K-VRQOL outcomes across (a) total, (b) physical, and (c) emotional domains.
In the total domain (a), the features that most strongly influenced the model’s predictions were Jitter_diff, SFF_diff, comorbidity, gender, and F0_diff. Specifically, the lower values of Jitter_diff and SFF_diff, which reflect more stable and regular vocal signals, were associated with greater predicted improvements in quality of life. This suggests that improvements in vocal stability and clarity are important factors for better overall outcomes. Additionally, being female and having comorbidities were also linked to greater predicted improvements. For the physical domain (b), the most important predictors were Jitter_diff, gender, comorbidity, and voice training status. Among these, Jitter_diff had the greatest impact, highlighting the key role of acoustic stability in improving the physical aspects of voice-related quality of life. In contrast, the emotional domain (c) showed SHAP values that were more scattered and had a narrower range. This indicates that individual features had weaker and less consistent effects on the model’s predictions in this domain. While factors such as Jitter_diff, SFF_diff, the number of voice training sessions, surgery status, and alcohol status had some influence, their overall impact was limited and more difficult to interpret. This pattern suggests that predicting emotional improvements in voice-related quality of life is more complex and may depend on factors not included in the current model. Overall, these results indicate that acoustic variables are highly important for predicting outcomes in the total and physical domains of K-VRQOL, while emotional outcomes are likely influenced by more subjective and diverse factors that are not fully captured by the present analysis.
5. Discussion
This study evaluated changes in K-VRQOL before and after voice therapy and analyzed the personal, clinical, and acoustic predictors contributing to these changes using both multiple regression and machine learning-based predictive models. In addition to traditional statistical approaches, the integration of machine learning and SHAP interpretation techniques enhanced the interpretability and visualization of the predictive contribution of each variable.
The multiple regression analysis [30,31,32] identified gender and comorbidity status as consistent and significant predictors of improvement in both the total and physical domains. Specifically, female patients and those with comorbid conditions showed greater improvement in their K-VRQOL scores. These results are in line with previous findings, suggesting that differences in vocal sensitivity by gender and a higher baseline discomfort among those with comorbidities may influence patients’ perception of therapy gains. This underscores the importance of personalized counseling and intervention strategies that consider individual background characteristics. Among the acoustic variables, jitter, SFF, and MPT showed significant associations, particularly in the physical domain. These findings indicate that vocal periodicity, stability, and phonatory endurance are closely linked to the physical recovery of voice function after therapy. Specifically, jitter and SFF reflect fine frequency perturbation and spectral flatness, respectively, and their reduction implies improved vocal clarity and stability. Thus, these acoustic features may serve as sensitive biomarkers for tracking therapeutic outcomes. In contrast, the emotional domain demonstrated relatively lower explanatory power and predictive accuracy. Most predictors did not reach statistical significance, and model performance remained limited. Interestingly, smoking status was a significant predictor of emotional improvement. This may suggest that smokers have a lower baseline quality of life or different expectations, leading to a higher perceived benefit post-therapy. However, the underlying mechanisms warrant further investigation. The low predictive power in the emotional domain implies that psychosocial factors not captured by quantitative variables may play a larger role, highlighting the need for future models incorporating qualitative and psychosocial variables such as stress, social support, and prior counseling experience.
Machine learning approaches [33,34,35,36] demonstrated strengths in capturing nonlinear patterns not accounted for by regression models. Notably, LightGBM achieved the highest explanatory power for the total score (32.54%) and demonstrated balanced performance in the physical and emotional domains. This model’s flexibility—through sampling, feature selection, regularization, and complexity control—may have contributed to its strong performance. The gradient boosting model performed best in the physical domain (30.50%), suggesting that structural improvements in vocal function were effectively captured. Interestingly, random forest, despite its simplicity, showed a relatively high performance in the emotional domain (17.33%), possibly due to its robustness in identifying complex feature interactions without overfitting. As shown in Figure 3, a relatively low performance may be attributed to the experimental design, which would require a precise prediction of continuous K-VRQOL scores. In other words, a few extreme values in the K-VRQOL distribution disproportionately influenced the overall model performance. It is anticipated that reframing the prediction task as a classification problem—by categorizing the degree of improvement into two or three discrete classes—could yield more robust and interpretable results. SHAP analysis enhanced the interpretability of the model predictions. A visualization of the SHAP values revealed that variables such as Jitter_diff, SFF_diff, gender, and comorbidity were among the most influential contributors to improvements in the total and physical K-VRQOL scores. In contrast, the emotional domain showed more dispersed SHAP values [37,38,39], consistent with the lower explanatory power in that domain. These results highlight the potential of explainable AI techniques to enhance clinical credibility and acceptance by offering concrete insights into which variables drive prediction outcomes, rather than relying solely on accuracy metrics.
This study provides several important implications. First, it demonstrates that predictive models integrating objective acoustic features and subjective clinical factors can more precisely characterize therapeutic outcomes. Second, the integration of machine learning algorithms with SHAP-based interpretability complements traditional statistical approaches and offers valuable tools for developing individualized therapy strategies. The visualization of variable importance enables clinicians to make more intuitive, transparent, and data-driven clinical decisions. Nevertheless, several limitations should be acknowledged. The relatively small sample size (n = 102) may increase the potential risk of overfitting, particularly when employing complex machine learning algorithms such as XGBoost and LightGBM. Moreover, the retrospective nature of the analysis may limit the generalizability of the findings. In addition, the relatively low predictive performance observed in the emotional domain suggests the need to incorporate qualitative and psychosocial variables into future models. Finally, as this study evaluated outcomes based on a single time point, longitudinal designs will be essential to enhance the predictive validity and robustness of these models. Therefore, future studies involving larger, prospectively collected, and more diverse datasets are warranted to further validate and strengthen the generalizability of the predictive models. In conclusion, this study highlights the clinical utility and interpretability of combining statistical and machine learning approaches for predicting voice therapy outcomes and provides a foundation for advancing precision voice rehabilitation through explainable, evidence-based modeling strategies.
6. Conclusions
This study aimed to clarify how voice therapy influences patients’ quality of life by identifying key factors that predict changes in the Korean version of the voice-related quality of life (K-VRQOL) questionnaire scores before and after therapy. To achieve this, traditional regression analysis was combined with advanced machine learning methods, and SHAP analysis was applied to enhance both the interpretability and clinical relevance of the findings. Our results showed that being female and having comorbidities were consistent and significant predictors of improvement in both the total and physical domains of K-VRQOL. This highlights the important role that sociodemographic factors play in shaping perceived therapy outcomes. Additionally, acoustic features such as jitter, speaking fundamental frequency (SFF), and maximum phonation time (MPT) were strongly linked to improvements in physical vocal function, suggesting that greater vocal stability and regularity are critical for patients to perceive therapy as successful.
Among the machine learning models, LightGBM provided the most accurate predictions for both the total and physical domains, while the gradient boosting model also performed well in the physical domain. However, the prediction accuracy for the emotional domain was relatively low, and the influence of individual variables was inconsistent. This suggests that emotional outcomes are more complex and cannot be fully explained by physiological measures alone. A key strength of this study is the use of SHAP analysis, which enabled us to clearly visualize how each predictor contributed to the model’s decisions. This level of interpretability not only strengthens the reliability of AI-based predictions but also offers practical insights that can support clinicians in making informed decisions and counseling patients.
Despite certain limitations, including a relatively small sample size and its retrospective design from a single institution, this study provided empirical evidence supporting the integration of both objective acoustic and subjective clinical factors in evaluating the effectiveness of voice therapy. Future investigations should incorporate comprehensive psychometric analyses, including Cronbach’s alpha, for the K-VRQOL and its subdomains, as well as descriptive statistics (e.g., means, standard deviations), to more thoroughly assess the internal consistency and distributional properties of the measurement instruments. Moreover, subsequent studies should seek to validate these predictive models in larger, more diverse cohorts, utilize longitudinal data, and integrate additional psychosocial variables to enhance predictive accuracy. In summary, by combining statistical methodologies with machine learning techniques, the present study proposes a novel and clinically applicable framework for predicting and elucidating voice therapy outcomes. These findings offer a foundation for the development of more precise and individualized voice rehabilitation strategies in clinical practice.
Author Contributions
Data collection and analysis, J.H.P. and A.R.J.; conceptualization, J.-Y.L. and A.R.J.; methodology, J.-Y.L. and A.R.J.; software, J.-Y.L.; validation, J.-Y.L.; writing—original draft preparation, J.-Y.L. and J.-N.L.; writing—review and editing, J.-Y.L. and A.R.J.; visualization, J.-N.L.; funding acquisition, J.-Y.L. All authors have read and agreed to the published version of the manuscript.
Funding
This paper was supported by Eulji University in 2024 (2024-0114).
Institutional Review Board Statement
This study was conducted according to the guidelines of the Declaration of Helsinki and approved by the Institutional Review Board of Nowon Eulji Medical Center, Eulji University (IRB No. 2022-04-014).
Informed Consent Statement
Not applicable.
Data Availability Statement
Data were obtained from Nowon Eulji Medical Center and are available from Prof. Ah Ra Jung with the permission of Nowon Eulji Medical Center.
Conflicts of Interest
The authors declare no conflicts of interest.
References
- Emshoff, R.; Astl, M.; Giotakis, A.I.; Hupp, L.C.; Kolk, A. Factors Associated with Voice-Related Quality of Life among Patients with Temporomandibular Disorders. J. Appl. Oral Sci. 2024, 32, e20230296. [Google Scholar] [CrossRef] [PubMed]
- Judge, T.A.; Bono, J.E. Relationship of Core Self-Evaluations Traits—Self-Esteem, Generalized Self-Efficacy, Locus of Control, and Emotional Stability—With Job Satisfaction and Job Performance: A Meta-Analysis. J. Appl. Psychol. 2001, 86, 80–92. [Google Scholar] [CrossRef] [PubMed]
- Diener, E.; Chan, M.Y. Happy People Live Longer: Subjective Well-Being Contributes to Health and Longevity. Appl. Psychol. Health Well Being 2011, 3, 1–43. [Google Scholar] [CrossRef]
- Keyes, C.L.M. The Mental Health Continuum: From Languishing to Flourishing in Life. J. Health Soc. Behav. 2002, 43, 207–222. [Google Scholar] [CrossRef]
- Cantor Cutiva, L.C. Association between Occupational Voice Use and Occurrence of Voice Disorders: A Meta-Analysis. Areté 2018, 18, 1–10. [Google Scholar] [CrossRef]
- Dietrich, M.; Verdolini Abbott, K.; Gartner-Schmidt, J.; Rosen, C.A. Psychosocial Distress in Patients Presenting with Voice Concerns. J. Voice 2012, 26, 711–721. [Google Scholar]
- Hunter, E.J.; Cantor-Cutiva, L.C.; van Leer, E.; van Mersbergen, M.; Bottalico, P.; Nanjundeswaran, C.D. Quantifying the Occupational Voice Use of Teachers. J. Speech Lang. Hear. Res. 2024, 67, 123–135. [Google Scholar]
- Behlau, M.; Zambon, F.; Guerrieri, A.C.; Roy, N. Voice Problems of Group Fitness Instructors: Diagnosis, Treatment, and Recommendations. J. Voice 2014, 28, 316–327. [Google Scholar]
- Hogikyan, N.D.; Wodchis, W.P.; Terrell, J.E.; Bradford, C.R.; Esclamado, R.M. Voice-Related Quality of Life (V-RQOL) Following Type I Thyroplasty for Unilateral Vocal Fold Paralysis. J. Voice 2000, 14, 378–386. [Google Scholar] [CrossRef]
- Schuman, A.D.; Neevel, A.; Morrison, R.J.; Hogikyan, N.D.; Kupfer, R.A. Voice-Related Quality of Life Is Associated with Postoperative Change in Subglottic Stenosis. Laryngoscope 2021, 131, 360–365. [Google Scholar] [CrossRef]
- Kim, J.O.; Lim, S.E.; Park, S.Y.; Choi, S.H.; Choi, J.N.; Choi, H.S. Validity and Reliability of the Korean-Version of the Voice Handicap Index and Voice-Related Quality of Life. Speech Sci. 2007, 14, 111–125. [Google Scholar]
- Lee, Y.J.; Hwang, Y.J. Comparison of Self-Voice Assessment in Individuals with Voice Disorders and Listener Voice Assessment in Normal Individuals. Speech Sound Voice Sci. 2012, 4, 105–114. [Google Scholar]
- Lee, Y.; Kim, G.-H. Discriminative and Predictive Ability for Screening Korean Dysphonic Patients Using Self-Reported Questionnaires. Clin. Arch. Commun. Disord. 2020, 5, 132–244. [Google Scholar] [CrossRef]
- Kang, H.; Kim, S.; Yoo, J. Vocal Hygiene Habits and the Characteristics of Korean Voice-Related Quality of Life (K-VRQOL) Among Classical Singers. Phon. Speech Sci. 2018, 10, 49–59. [Google Scholar]
- Wertzner, H.F.; Schreiber, S.; Amaro, L. Analysis of Fundamental Frequency, Jitter, Shimmer and Vocal Parameters in Children with Phonological Disorders. Braz. J. Otorhinolaryngol. 2022, 88, 944–951. [Google Scholar]
- Lathadevi, H.T.; Guggarigoudar, S.P. Objective Acoustic Analysis and Comparison of Normal and Abnormal Voices. J. Clin. Diagn. Res. 2018, 12, MC01–MC04. [Google Scholar] [CrossRef]
- Rajula, H.S.R.; Verlato, G.; Manchia, M.; Antonucci, N.; Fanos, V. Comparison of Conventional Statistical Methods with Machine Learning in Medicine: Diagnosis, Drug Development, and Treatment. Medicina 2020, 56, 455. [Google Scholar] [CrossRef]
- Ho, F.K.; Cole, T.J. Non-linear Predictor-Outcome Associations in Clinical Research: Challenges and Solutions. BMJ Med. 2022, 2, e000396. [Google Scholar]
- Kim, J.; Jeong, K.; Lee, S.; Baek, Y. Machine-Learning Model Predicting Quality of Life Using Multifaceted Lifestyles in Middle-Aged South Korean Adults: A Cross-Sectional Study. BMC Public Health 2024, 24, 159. [Google Scholar] [CrossRef]
- Choi, J.-H.; Lee, K.-S.; Ahn, K.-H.; Jeong, W.Y. Explainable Model Using Shapley Additive Explanations Approach for Analyzing Wound Infections after Wide Resection in Patients with Soft Tissue Sarcomas. J. Clin. Med. 2023, 12, 3451. [Google Scholar]
- Salih, A.M.; Raisi-Estabragh, Z.; Galazzo, I.B.; Radeva, P.; Petersen, S.E.; Lekadir, K.; Menegaz, G. A Perspective on Explainable Artificial Intelligence Methods: SHAP and LIME. arXiv 2023, arXiv:2305.02012. [Google Scholar] [CrossRef]
- Despotovic, V.; Elbéji, A.; Fünfgeld, K.; Pizzimenti, M.; Ayadi, H.; Nazarov, P.V.; Fagherazzi, G. Digital Voice-Based Biomarker for Monitoring Respiratory Quality of Life: Findings from the Colive Voice Study. Biomed. Signal Process. Control. 2024, 96, 106555. [Google Scholar] [CrossRef]
- Stojanović, J.; Veselinović, M.; Jevtić, M.; Jovanović, M.; Nikolić, D.; Kuzmanović Pfićer, J.; Živković-Marinkov, E.; Relić, N. Assessment of Life Quality in Children with Dysphonia Using Modified Pediatric Voice-Related Quality of Life Questionnaire in Serbia. Children 2023, 10, 125. [Google Scholar] [CrossRef] [PubMed]
- Yu, L.; Lu, D.; Yang, H.; Zou, J.; Wang, H.; Zheng, M.; Hu, J. A Comparative and Correlative Study of the Voice-Related Quality of Life (V-RQOL) and the Voice Activity and Participation Profile (VAPP) for Voice-Related Quality of Life among Teachers with and without Voice Disorders. Medicine 2019, 98, e14491. [Google Scholar] [CrossRef] [PubMed]
- Lu, D.; Huang, M.; Cheng, I.K.; Dong, J.; Yang, H. Comparison and Correlation Between the Pediatric Voice Handicap Index and the Pediatric Voice-Related Quality-of-Life Questionnaires. Medicine 2018, 97, e11850. [Google Scholar] [CrossRef]
- Lee, J.-Y.; Park, J.H.; Lee, J.-N.; Jung, A.R. Personal and Clinical Predictors of Voice Therapy Outcomes: A Machine Learning Analysis Using the Voice Handicap Index. Appl. Sci. 2024, 14, 10376. [Google Scholar] [CrossRef]
- Wang, C.-C.; Liao, J.-S.; Lai, H.-C.; Lo, Y.-H. Correlations among the Mandarin Voice Handicap Index, Its Shortened Version, and the Voice-Related Quality of Life Measure for Laryngectomees. J. Chin. Med. Assoc. 2022, 85, 944–951. [Google Scholar] [CrossRef]
- Rasch, T.; Günther, E. Voice-Related Quality of Life in Organic and Functional Voice Disorders. Logop. Phoniatr. Vocol. 2005, 30, 9–13. [Google Scholar] [CrossRef]
- Hogikyan, N.D.; Sethuraman, G. Validation of an Instrument to Measure Voice-Related Quality of Life (V-RQOL). J. Voice 1999, 13, 557–569. [Google Scholar] [CrossRef]
- Uyanık, G.K.; Güler, N. A Study on Multiple Linear Regression Analysis. Procedia Soc. Behav. Sci. 2013, 106, 234–240. [Google Scholar] [CrossRef]
- Li, X.; Wang, Y.; Zhang, H.; Liu, Z. A Multiple Linear Regression Analysis Identifies Factors Associated with Quality of Life in Cancer Patients. Medicine 2023, 102, e33345. [Google Scholar]
- De Falco, I.; Esposito, M.; Cimitile, M.; De Pietro, G. Multiple Regression Model to Analyze the Total Length of Stay for Patients Undergoing Laparoscopic Appendectomy. BMC Med. Inform. Decis. Mak. 2022, 22, 84. [Google Scholar]
- Breiman, L. Random Forests. Mach. Learn. 2001, 45, 5–32. [Google Scholar] [CrossRef]
- Ruder, S. An Overview of Gradient Descent Optimization Algorithms. arXiv 2016, arXiv:1609.04747. [Google Scholar]
- Ke, G.; Meng, Q.; Finley, T.; Wang, T.; Chen, W.; Ma, W.; Ye, Q.; Liu, T.-Y. LightGBM: A Highly Efficient Gradient Boosting Decision Tree, Proceedings of the 31st International Conference on Neural Information Processing Systems, Long Beach, CA, USA, 4–9 December 2017; Curran Associates Inc.: Red Hook, NY, USA, 2017; pp. 3149–3157. [Google Scholar]
- Chen, T.; Guestrin, C. XGBoost: A Scalable Tree Boosting System, Proceedings of the 22nd ACM SIGKDD International Conference on Knowledge Discovery and Data Mining, San Francisco, CA, USA, 13–17 August 2016; ACM: New York, NY, USA, 2016; pp. 785–794. [Google Scholar]
- Lundberg, S.M.; Lee, S.-I. A Unified Approach to Interpreting Model Predictions. Adv. Neural Inf. Process. Syst. 2017, 30, 4765–4774. [Google Scholar]
- Štrumbelj, E.; Kononenko, I. Explaining Prediction Models and Individual Predictions with Feature Contributions. Knowl. Inf. Syst. 2014, 41, 647–665. [Google Scholar] [CrossRef]
- Van den Broeck, G.; Lykov, A.; Schleich, M.; Suciu, D. On the Tractability of SHAP Explanations. arXiv 2020, arXiv:2009.08634. [Google Scholar]
Disclaimer/Publisher’s Note: The statements, opinions and data contained in all publications are solely those of the individual author(s) and contributor(s) and not of MDPI and/or the editor(s). MDPI and/or the editor(s) disclaim responsibility for any injury to people or property resulting from any ideas, methods, instructions or products referred to in the content. |
© 2025 by the authors. Licensee MDPI, Basel, Switzerland. This article is an open access article distributed under the terms and conditions of the Creative Commons Attribution (CC BY) license (https://creativecommons.org/licenses/by/4.0/).