Article

The Capacity Configuration of a Cascade Small Hydropower-Pumped Storage–Wind–PV Complementary System

1
Guangxi Key Laboratory of Power System Optimization and Energy Technology, Guangxi University, Nanning 530004, China
2
State Grid YANGZHOU Power Supply Company, Yangzhou 225000, China
*
Author to whom correspondence should be addressed.
Appl. Sci. 2025, 15(13), 6989; https://doi.org/10.3390/app15136989
Submission received: 25 April 2025 / Revised: 16 June 2025 / Accepted: 18 June 2025 / Published: 20 June 2025

Abstract

:
Distributed renewable energy sources with significant output fluctuations can negatively impact the power grid stability when it is connected to the power grid. Therefore, it is necessary to develop a capacity configuration method that improves the output stability of highly uncertain energy sources such as wind and photovoltaic (PV) power by integrating pumped storage units. In response, this study proposes a capacity configuration method for a cascade small hydropower-pumped storage–wind–PV complementary system. The method utilizes the regulation capacity of cascade small hydropower plants and pumped storage units, in conjunction with the fluctuating characteristics of local distributed wind and PV, to perform power and energy time-series matching and determine the optimal capacity allocation for each type of renewable energy. Furthermore, an optimization and scheduling model for the cascade small hydropower-pumped storage–wind–PV complementary system is constructed to verify the effectiveness of the configuration under multiple scenarios. The results demonstrate that the proposed method reduces system energy deviation, improves the stability of power output and generation efficiency, and enhances the operational stability and economic performance of the system.

1. Introduction

Driven by policy incentives and increasing power demand, large-scale cascade small hydropower emerges as the times require. Its wide distribution and certain adjustment ability provide a foundation for the complementary utilization of small hydropower, wind, and PV resources within the watershed [1]. Similar to distributed wind and PV sources that exhibit high variability, small hydropower is also an intermittent energy source. Due to its limited regulation capacity, its generation is highly influenced by climatic conditions. During the summer wet season, abundant water flow often leads to uncontrolled, uncoordinated full-capacity generation. In contrast, during the winter dry season, reduced inflow significantly limits generation, resulting in low utilization of the units. Consequently, small hydropower output exhibits strong seasonal fluctuations, posing considerable challenges to system scheduling and operational stability [2]. Therefore, conducting collaborative optimization research on multi-energy complementary systems for uncertain clean energy sources such as wind, PV, and small hydropower is of significant importance for ensuring the stable operation of the power grid and maximizing the consumption of clean energy in the region.
In complementary systems of hydropower with renewable energy sources such as wind and PV, pumped storage is often used as an economical and clean energy storage method. By providing fast regulation capabilities, it helps mitigate the volatility of renewable energy, ensuring the safe and stable operation of the power system while enhancing the system’s ability to absorb wind, PV, and other renewable energy sources [3]. In reference [4], the flexible regulation characteristics of pumped storage plants are used to mitigate the output fluctuations of distributed generation sources. Reference [5] presents a multi-objective optimization scheduling model that integrates pumped storage plants, aiming to minimize coal consumption and pollutant emissions costs from thermal power units. The model is verified through practical grid case studies, showing significant improvements in system economy and stability. Reference [6] develops an optimization model that minimizes operating costs by leveraging the flexibility of pumped storage and thermal power units. This approach effectively alleviates the supply–demand imbalance caused by the “duck curve”, which refers to the sharp dip in midday electricity demand and a steep ramp-up in demand during the evening as PV generation decreases and people return home, resulting in significant fluctuations in the power grid. However, in practice, the construction of pure pumped storage plants faces significant technical and economic challenges due to regional constraints such as terrain, geology, and water resources.
But, in practical engineering, due to regional constraints such as terrain, geology, and water resources, the construction of pure pumped storage plants faces significant technical and economic challenges. In contrast to pure pumped storage plants, cascade hybrid pumped storage plants offer the following advantages:
  • In terms of technical difficulty and construction conditions, a cascade hybrid pumped storage plant can be built by adding units and transforming an existing hydropower station, which involves relatively small engineering work [7].
  • Compared to conventional cascade hydropower stations, the cascade hybrid pumped storage plant transitions from a single “peak shaving” mode to an integrated mode of both “peak shaving” and “valley filling”, where peak shaving refers to increasing electricity generation during peak demand periods to avoid grid overload and ensure supply meets demand, while valley filling involves storing excess energy during off-peak periods (typically at night or when renewable generation like PV is abundant) so that it can be released during peak demand periods [8]. This integrated mode enhances the regulation capacity during low-demand periods, thus efficiently balancing supply and demand.
  • Compared to traditional pure pumped storage plants, the cascade hybrid pumped storage plant benefits from water inflow from upstream hydropower stations, so its generation is no longer limited by the circulating water volume between the upper and lower reservoirs. This allows for increased output during peak electricity price periods, resulting in higher generation revenue [9].
Therefore, if eligible cascade small hydropower stations can be converted into cascade hybrid pumped storage plants, utilizing the storage function of their reservoirs to effectively integrate cascade small hydropower with distributed wind and PV, it can enhance the stability and economy of the regional power system.
Reasonably configuring the capacity of pumped storage units and various renewable energy sources is key to achieving the effective integration of cascade small hydropower, pumped hydro storage, and distributed wind and PV resources. The capacity configuration issues in multi-energy complementary systems can be roughly divided into two categories. One analyzes system costs to calculate the optimal capacity configuration scheme to maximize economic benefits. References [10,11,12] aim to minimize annual operation and maintenance costs. In Reference [13], the Bloch spherical quantum genetic algorithm was used to establish the objective function with the minimum cost of the energy storage system as the goal, and the capacity value required for the configuration was solved. Reference [14] studied how different economic sensitivity factors affect the configuration results to optimize the energy storage system configuration scheme.
The other focuses on analyzing the fluctuation characteristics of wind and PV output power and determining the optimal capacity allocation under the prerequisite of meeting a predefined fluctuation smoothing requirement. Reference [15] proposes the Ramping Behavior Analysis (RBAθ) model, which extracts the temporal characteristics and magnitude of wind ramp events, providing technical support for the management and scheduling of wind power variability. By forecasting wind power fluctuations, the system can optimize energy storage capacity in advance, reduce the impact of uncertainty, and ensure stable operation of the power system. Reference [16] applies the Fast Fourier Transform and wavelet packet methods to process the amplitude of grid-connected wind power. Low-frequency components with smaller fluctuation rates are integrated into the grid, while high-frequency signals are characterized using Gaussian distribution to obtain their probability density curves. Finally, capacity optimization is carried out based on a confidence level reference. Reference [17] adopts a spectral analysis method to process typical daily output data of distributed energy sources. By performing rolling calculations, the expected output under the optimal cut-off frequency is obtained, which is then used to determine the capacity configuration of the distributed energy system. Reference [18] employs an adaptive wavelet packet method to process wind power output and allocates internal energy storage power based on control instructions. The annual cost is used as the evaluation criterion to determine different instruction segmentation points, and the optimal segmentation point is identified to obtain the final capacity configuration. References [19,20] apply a first-order low-pass filtering algorithm to smooth the output power of renewable energy sources. Reference [21] employs wavelet packet decomposition to separate high- and low-frequency fluctuations and conducts economic modeling of the energy storage system. Reference [22] utilizes Discrete Fourier Transform (DFT) to decompose the unbalanced power. Reference [23] conducts spectral analysis of load profiles based on Hilbert spectral transform and empirical mode decomposition (EMD). While considering the charge–discharge constraints of energy storage, the system is divided into frequency bands and configured based on the principle of minimizing energy aliasing.
However, the research on the capacity configuration of multi-energy complementary systems involved in the above literature is mostly based on the complementarity of a single leading power station or traditional pure pumped storage plants with wind and PV resources. It lacks the transformation and utilization of existing weakly regulated cascade hydropower and the joint complementary capacity development of surrounding distributed wind–solar resources. The main challenges include the following:
  • Compared to traditional cascade hydropower, cascade hydropower stations that have been transformed into pumped storage plants gain the added ability of “valley filling”. However, the regulation capacity of small cascade hydropower stations is limited, so a key consideration is how to make full use of the limited regulation capacity for the capacity configuration of pumped storage units and renewable energy.
  • Compared to a single hydropower station or a pure pumped storage plant, the cascade hybrid pumped storage plant utilizes the existing upper and lower reservoirs of cascade hydropower stations. Therefore, the system’s mathematical model needs to account for more complex hydraulic interactions.
Based on the research ideas and challenges mentioned above, the main contributions of this paper are as follows:
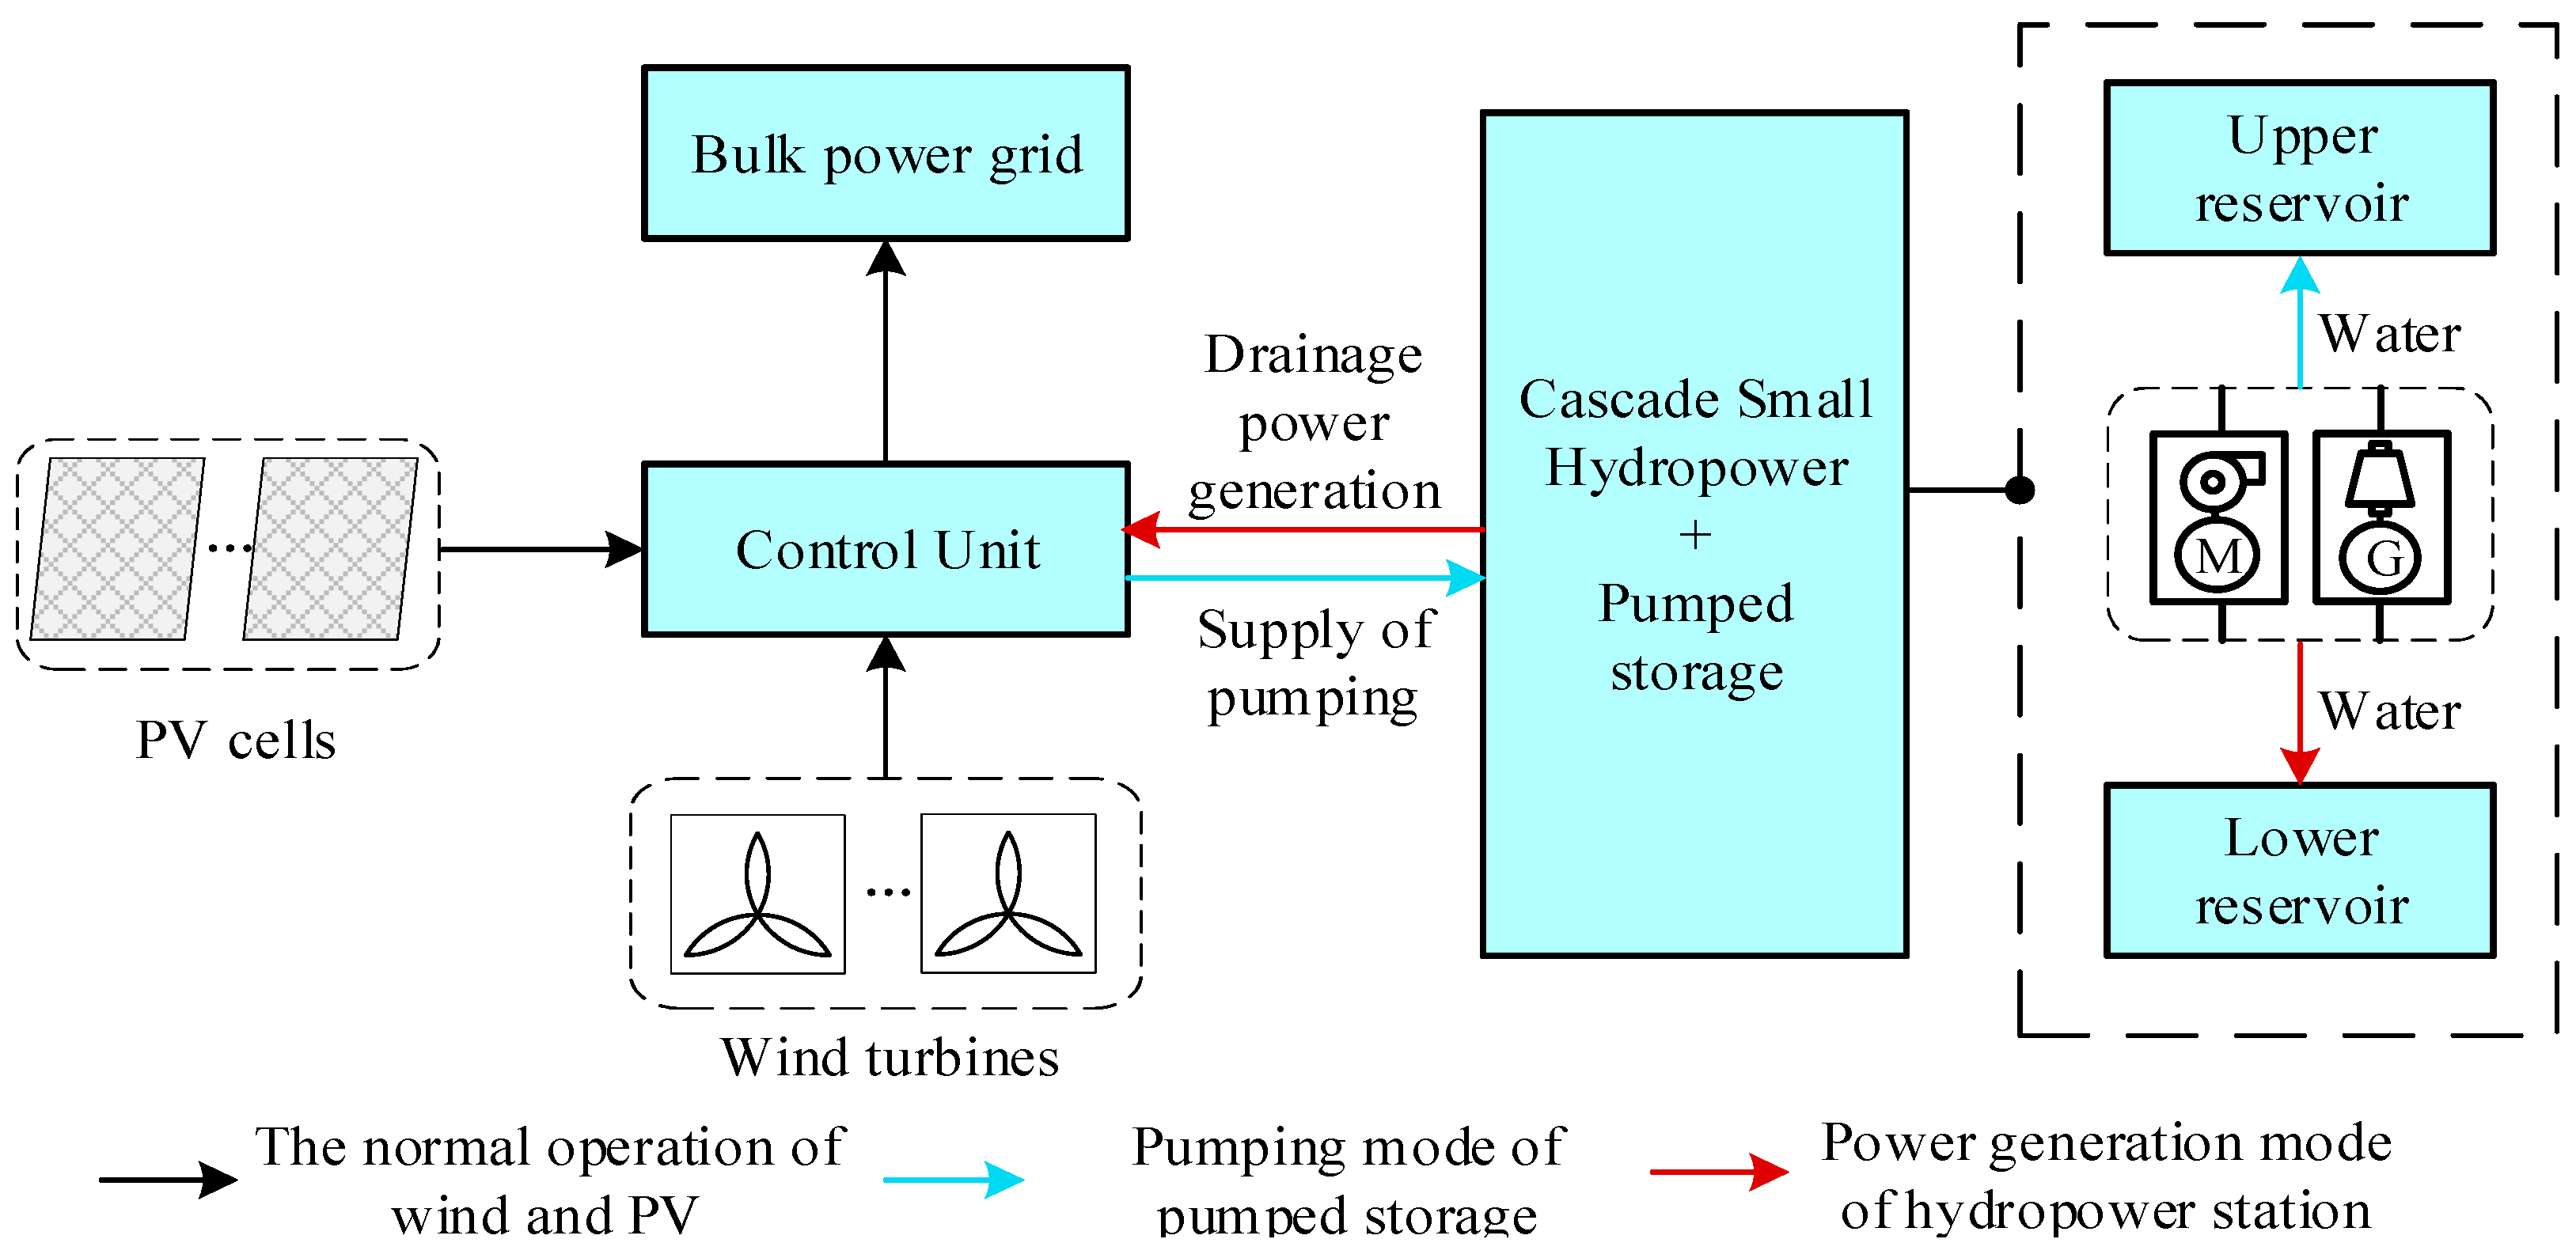
  • Based on the geographical conditions and reservoir types of cascade small hydropower, the paper proposes adapting the transformation of eligible small hydropower stations into pumped storage plants according to local conditions, enabling them to achieve complementarity between watershed hydropower and distributed wind and PV resources through the coordinated operation of cascade reservoirs, thereby constructing a cascade small hydropower-pumped storage–wind–PV complementary system.
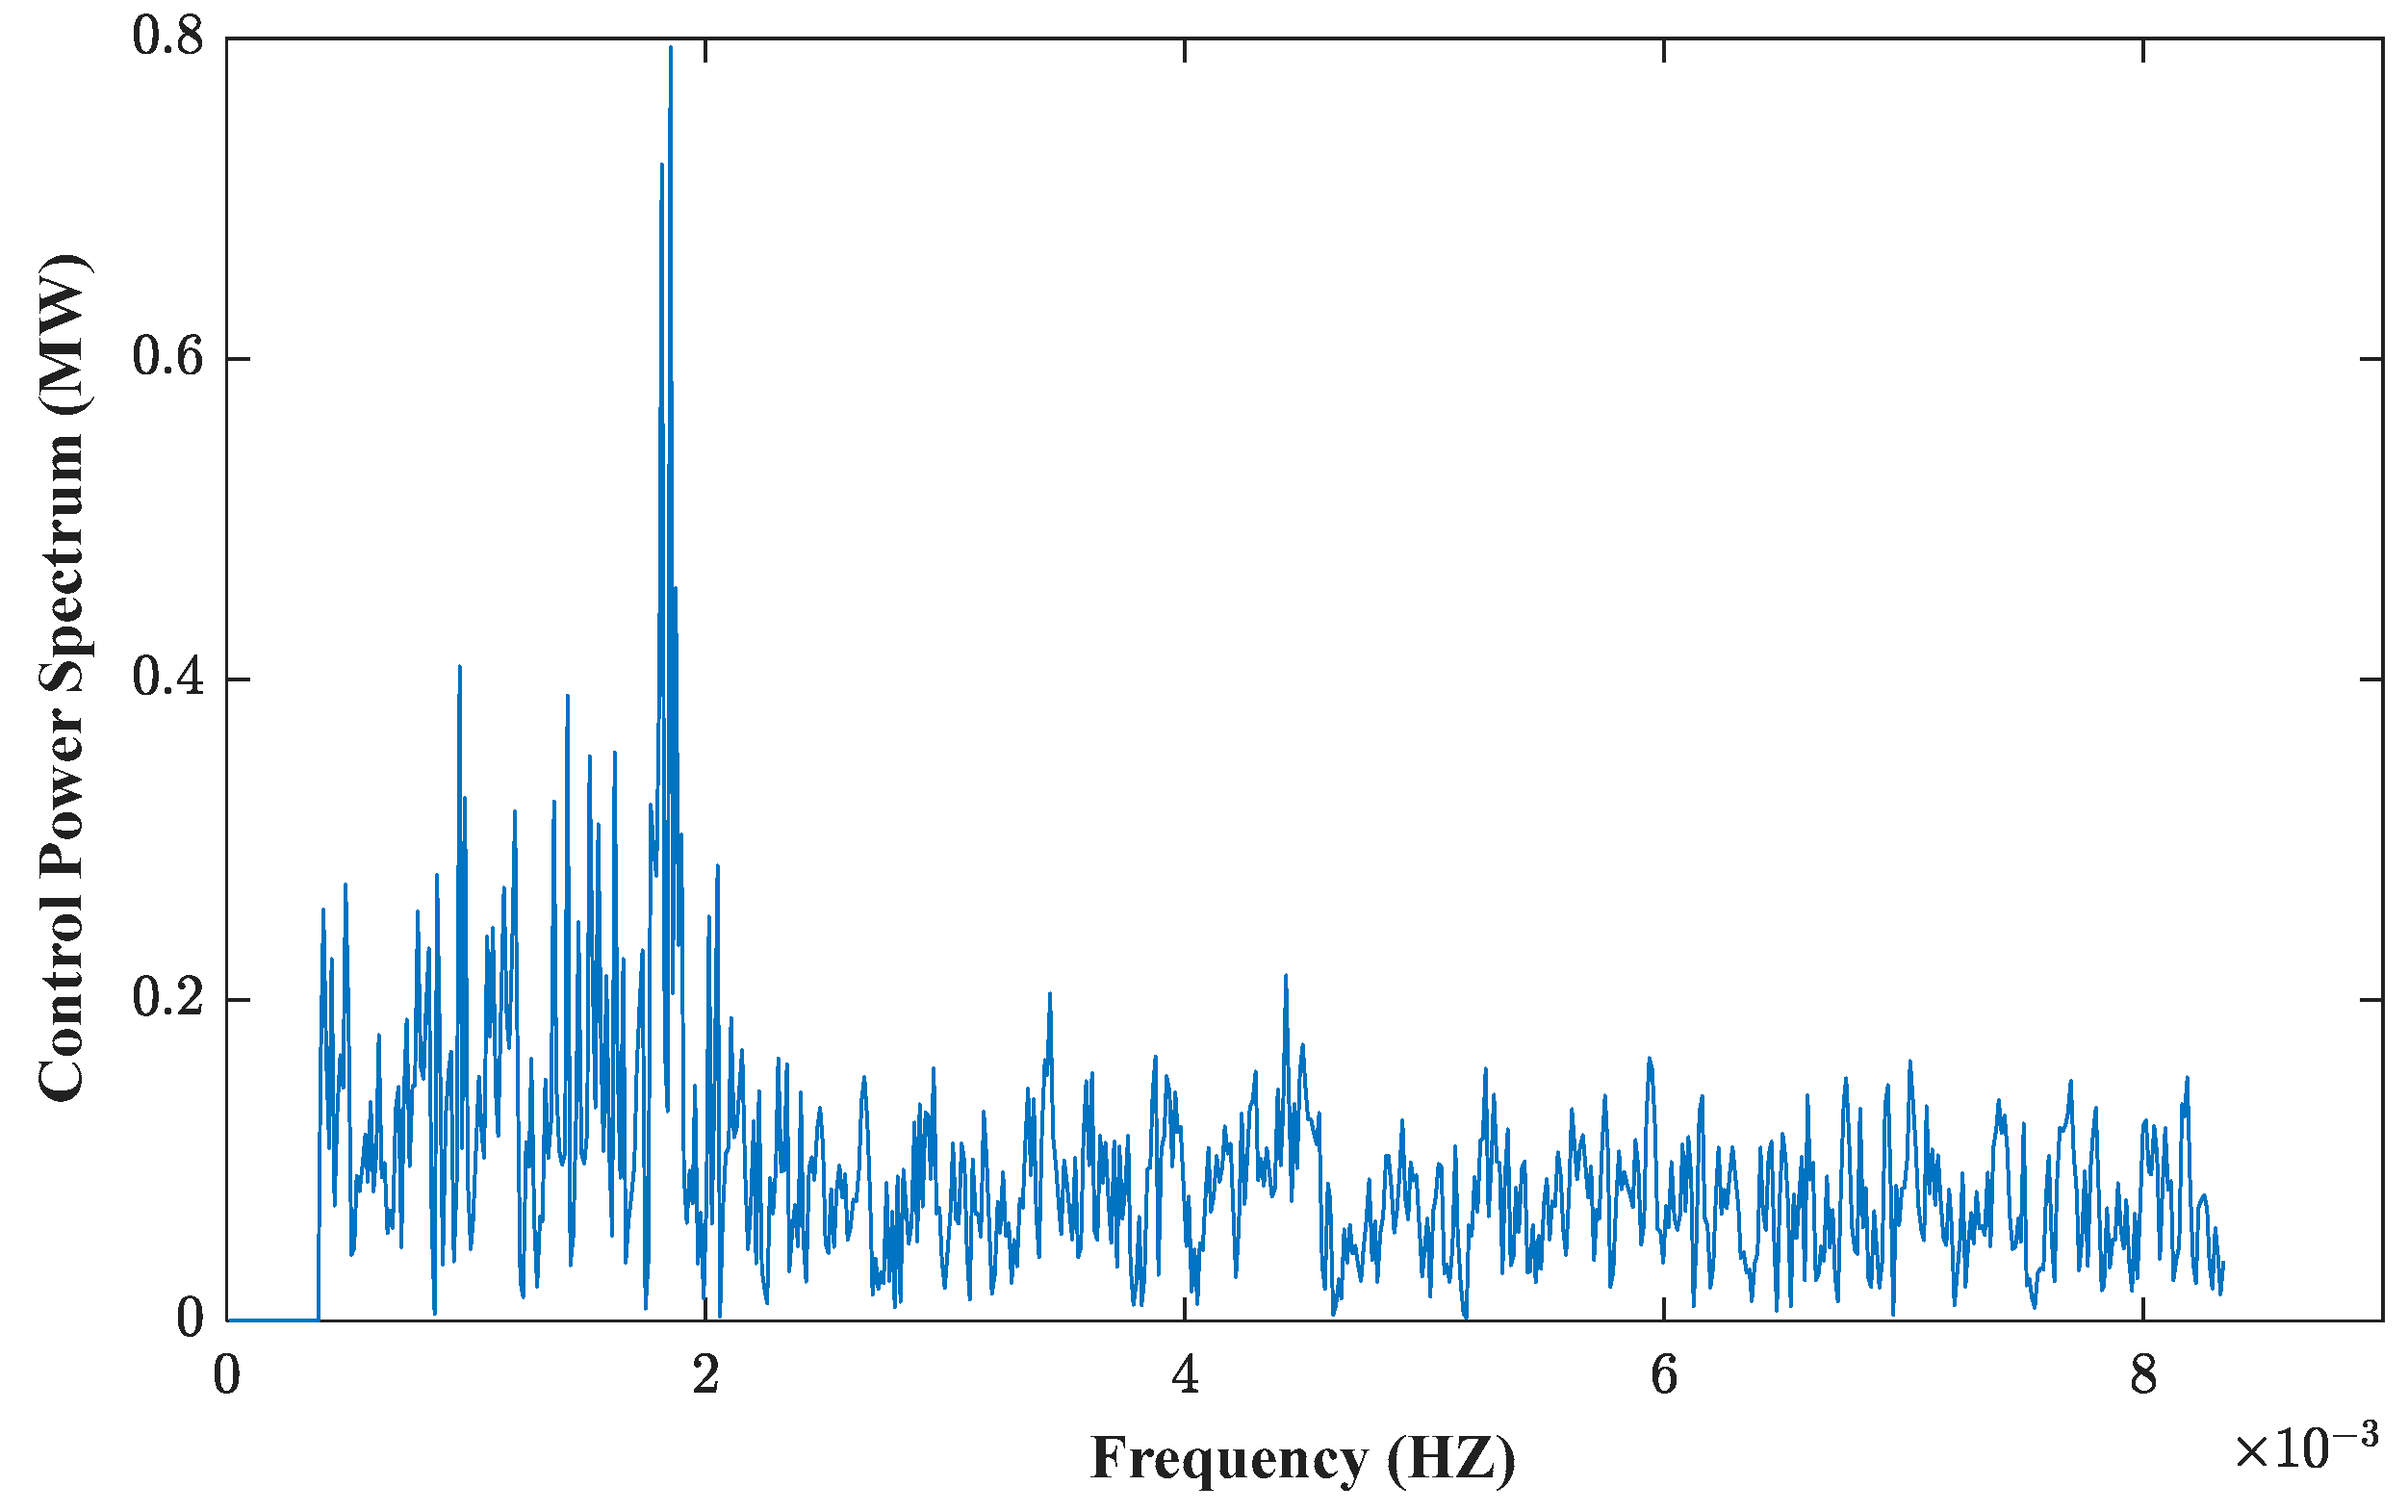
  • A capacity configuration method is proposed for the cascade hydropower–wind–PV-pumped storage complementary power generation system. The method determines the capacity of pumped storage units based on the maximum regulation capacity of cascade small hydropower after pumped storage transformation. Furthermore, spectral analysis is employed to achieve time-series matching between the pumped storage capacity and the power–energy fluctuation characteristics of distributed wind and PV sources, thereby satisfying the capacity demand for smoothing renewable energy volatility.
  • An optimized scheduling model for the cascade small hydropower-pumped storage–wind–PV complementary system is developed, considering the hydraulic–electricity coupling of cascade small hydropower, the output characteristics of wind and PV, and the operating constraints of pumped storage condition transitions. The model undergoes capacity verification under multiple scenarios, with the commercial solver Gurobi (version 9.5.2) employed for solution computation, demonstrating that after capacity configuration using the method proposed in this paper, the system’s stable and economic operation can be achieved.

2. System Combination Mechanism

The cascade development of small hydropower provides favorable conditions for pumped storage transformation. The reformed cascade small hydropower utilizes the peak–valley difference of the power grid to absorb the excess clean energy and capacity while generating conventional power. It flexibly executes a forward and reverse reciprocating process, converting water energy to electricity and vice versa, to achieve capacity balance within the power system and ensure the stable operation of the grid [24].
From the seasonal scale, summer and autumn are mostly wet periods, where the wind is weak, and the sunlight is strong; spring and winter are mostly low-water periods, where the wind is strong and the sunlight is weak. Wind power, PV, and hydropower complement each other [25]. From the intraday scale, wind is almost distributed throughout the day, while sunlight is only available during the day. Wind and solar resources can complement each other to some extent. Hydropower pumping and energy storage during periods of wind power and PV surplus, along with hydropower drainage and power generation during periods of wind power and PV shortage, smooth the daily power generation curve [26]. From the perspective of regulation scale, cascade small hydropower is closely coupled in terms of power and water flow. By reasonably scheduling the water storage and drainage of hydropower stations at all levels, continuous and stable power generation and energy storage can be achieved, which not only ensures the efficient utilization of water resources across the entire basin but also meets the requirements for regulating the fluctuations in wind power and PV [27].
The structure of the system is shown in Figure 1. The complementary power generation system consists of PV cells, wind turbines, and cascaded small hydropower stations equipped with pumped storage units. The system is connected to the bulk power grid via a control unit. During peak load periods, wind, PV, and small hydropower jointly supply electricity to the grid. In this process, the black arrows represent the normal operation paths of wind and PV, while the red arrows indicate the power generation path of hydropower stations. During low load periods, the cascade small hydropower system operates in a pumping mode (indicated by blue arrows) to store excess wind and PV output as potential energy in the form of water.
The right side of the figure illustrates the working principles of the hydropower and pumping units. In generation mode, the hydropower unit labeled “G” (generator) generates electricity using water released from the upper reservoir. In the pumping mode, the unit labeled “M” (motor) consumes electricity to pump water from the lower reservoir to the upper reservoir. Energy is thus stored and released through the cyclic transfer of water between the two reservoirs.

3. Analysis of Pumped Storage Transformation

Traditional cascade small hydropower stations are only equipped with hydro-generators and have small regulating capacities, so their hydropower water bodies’ energy-carrying effect and reversibility are often ignored. In other words, the adjacent upper and lower reservoirs of the two hydraulic connections of the cascade small hydropower have the potential to act as pumped storage reservoirs [28].

3.1. Ransformation Conditions

The essence of the site-specific pumped storage transformation of cascade small hydropower stations is the utilization of existing reservoirs as energy storage units. Compared to pure pumped storage power stations, retrofitting existing hydropower facilities for pumped storage alleviates some of the stringent geographical and engineering requirements. However, several objective constraints must still be carefully considered [29,30,31], including the geological conditions of the hydropower stations, the regulation capacity of the existing reservoirs, the water head, and the elevation-to-distance ratio between cascade hydropower stations; this ratio, defined as the vertical elevation difference divided by the horizontal distance, directly affects site selection feasibility and the effective utilization of water head.
The geological conditions should be selected as much as possible to facilitate the construction of water conveyance systems, powerhouses, and related facilities. It is necessary to refer to the geological conditions of the original conventional hydropower stations and select the hard rock mass with high seismic stability and complete structure to carry out the transformation of the pumped storage power station to avoid damage to the original conventional hydropower equipment during the transformation process.
The upper reservoir is given priority to regulation performance. The better the regulation performance, the higher the power generation benefit resulting from changes in water head and volume due to pumping and storage. However, most of the cascade small hydropower stations are daily regulating reservoirs, so it is necessary to heighten the dam to increase its regulating capacity. The site selection will be abandoned if there is no condition for increasing the regulation capacity.
The lower reservoir is given priority to the storage capacity. The storage capacity of the lower reservoir should be large enough to meet the demand of continuous pumping for 6 h with the full power of the pumped-storage unit to ensure that the upper reservoir of power generation does not cause excessive fluctuation of the lower reservoir water level when it is operated under pumping conditions.
The water head should not be too low. Because the transformation is based on the original conventional hydropower station, the adjustable storage capacity of the reservoir is basically determined, so the higher the water head, the greater the installed capacity of the reservoir, and the development value is relatively high; under the same output, the water flow required for the high head is small, the size of the equipment structure purchased in the construction process is also smaller, and the transformation investment and engineering quantity are reduced accordingly. Considering the natural drop limit of the upper/lower reservoir of the conventional cascade hydropower, where the maximum head generally does not exceed 250 m, selecting hydropower stations with a head between 50 m and 250 m for transformation is advisable.
The space–depth ratio should not be too large. Under normal conditions, the space–depth ratio of a pure pumped storage power station is generally not more than 12. Due to the limitation of the lower water head, the space–depth ratio of cascade small hydropower stations is slightly larger than that of pure pumped storage power stations. An excessive space–depth ratio will increase the length of construction cost of water diversion structures, so the space–depth ratio of transformable hydropower stations should be relatively small.

3.2. Transformation Methods

Under the premise of meeting the transformation conditions, the pumped storage transformation of cascade small hydropower stations can be divided into two main methods based on the regulation capacity of existing reservoirs: “integrated combination” and “upper reservoir combination”. The appropriate transformation method should be selected according to the existing reservoir type.
When two adjacent cascades, upper and lower reservoirs, have regulation capacity, the “integrated combination” can be used for transformation. In this method, the hydropower station’s upper and lower regulation capacity simultaneously serve as the upper and lower reservoirs for pumped storage, requiring only the addition of pumped storage units to complete the transformation. This approach fully utilizes existing reservoirs, with the hydraulic conditions of the upper and lower reservoirs and transmission equipment already in place. It only increases the unit’s capacity, and the project investment rises less.
When only the upper reservoir has the regulation capacity, but the downstream has the conditions for constructing the lower reservoir, the “upper reservoir combination” can be used for transformation. In general, this method uses the upper reservoir of the hydropower station as the upper reservoir of pumped storage, and it is necessary to build a new lower reservoir after the upper reservoir dam and add pumped storage units to complete the transformation. However, in reality, this method can determine whether the hydropower reservoir is the upper reservoir or the lower reservoir of the pumping reservoir according to the actual situation, and the engineering flexibility is higher.

3.3. Pumped Storage Unit Selection

The basis for installing pumped storage units is to expand the hydropower reversibility function while avoiding the influence on the original equipment as much as possible. There are two main types of pumped storage unit selection:
  • Install reversible pump turbine. The installed reversible pump turbine is generally used for pumping conditions and can also serve as a backup for the power generation of the original generator set. Because of its power generation function, it is necessary to build corresponding transmission lines, and replacing the original turbine will cause a waste of conventional units.
  • Install water pump. A water pump can only be installed for pumping conditions, using reverse power transmission through existing transmission lines without incurring the cost of new transmission lines. However, it can only fill the valley in the power grid, and the original generator set must cooperate with the peak regulation. Reference data from China’s Baishan Pumped Storage Project show that installing water pump reduces investment by approximately 10–20% compared to reversible pump turbine units [32].

4. Renewable Energy Capacity Configuration Method

In order to ensure the system’s safe and stable operation after access to renewable energy, the system utilizes the pumped storage and generation functionality of transformed cascade small hydropower to regulate wind power and PV fluctuations, ensuring real-time matching of generation with electricity demand. Therefore, the following principles should be taken into account in the capacity configuration of renewable energy in the system:
  • Maximize the utilization of the regulation capacity of cascade small hydropower and pumped storage units to increase power generation, reduce surplus water, and improve hydropower utilization efficiency.
  • According to the fluctuation characteristics of wind power and PV, time-series matching of power and electricity is performed to ensure that the control capacity meets the requirements of smoothing wind and PV output and that the system is continuously and stably generated.

4.1. Cascade Small Hydropower Regulation Capacity Calculation

Taking a single hydropower station as an example, the annual utilization hours are set as A, the annual utilization hours coefficient of a hydropower station in the wet period is a , and the annual utilization hours coefficient of a hydropower station in the low water period is b . The minimum technical output of a hydropower station in the wet season is P f , min , and the technical maximum production is P f , max . The minimum technical output of hydropower station in the low water period is P k , min , and the maximum technical output is P k , max , as shown in Table 1.
Then, the maximum regulation capacity of the i -th hydropower station is given by
m i = a A ( i ) × ( P ( i ) f , max P ( i ) f , min ) + b A ( i ) × ( P ( i ) k , max P ( i ) k , min ) / A ( i )
where A ( i ) is the annual utilization hours of the i -th hydropower station, h; P ( i ) is the technical output of the i -th hydropower station, MW; the technical output in the wet period is determined by the total installed capacity of the i -th hydropower station; the technical output in the low water period is determined by the single installed capacity of the i -th hydropower station.
The maximum regulation capacity M of cascade small hydropower stations is the sum of the maximum regulation capacity m i of each hydropower station:
M = i = 1 n m i
The installed pumped storage unit capacity m p must meet the maximum regulation capacity requirements of cascade small hydropower stations, that is
m p M

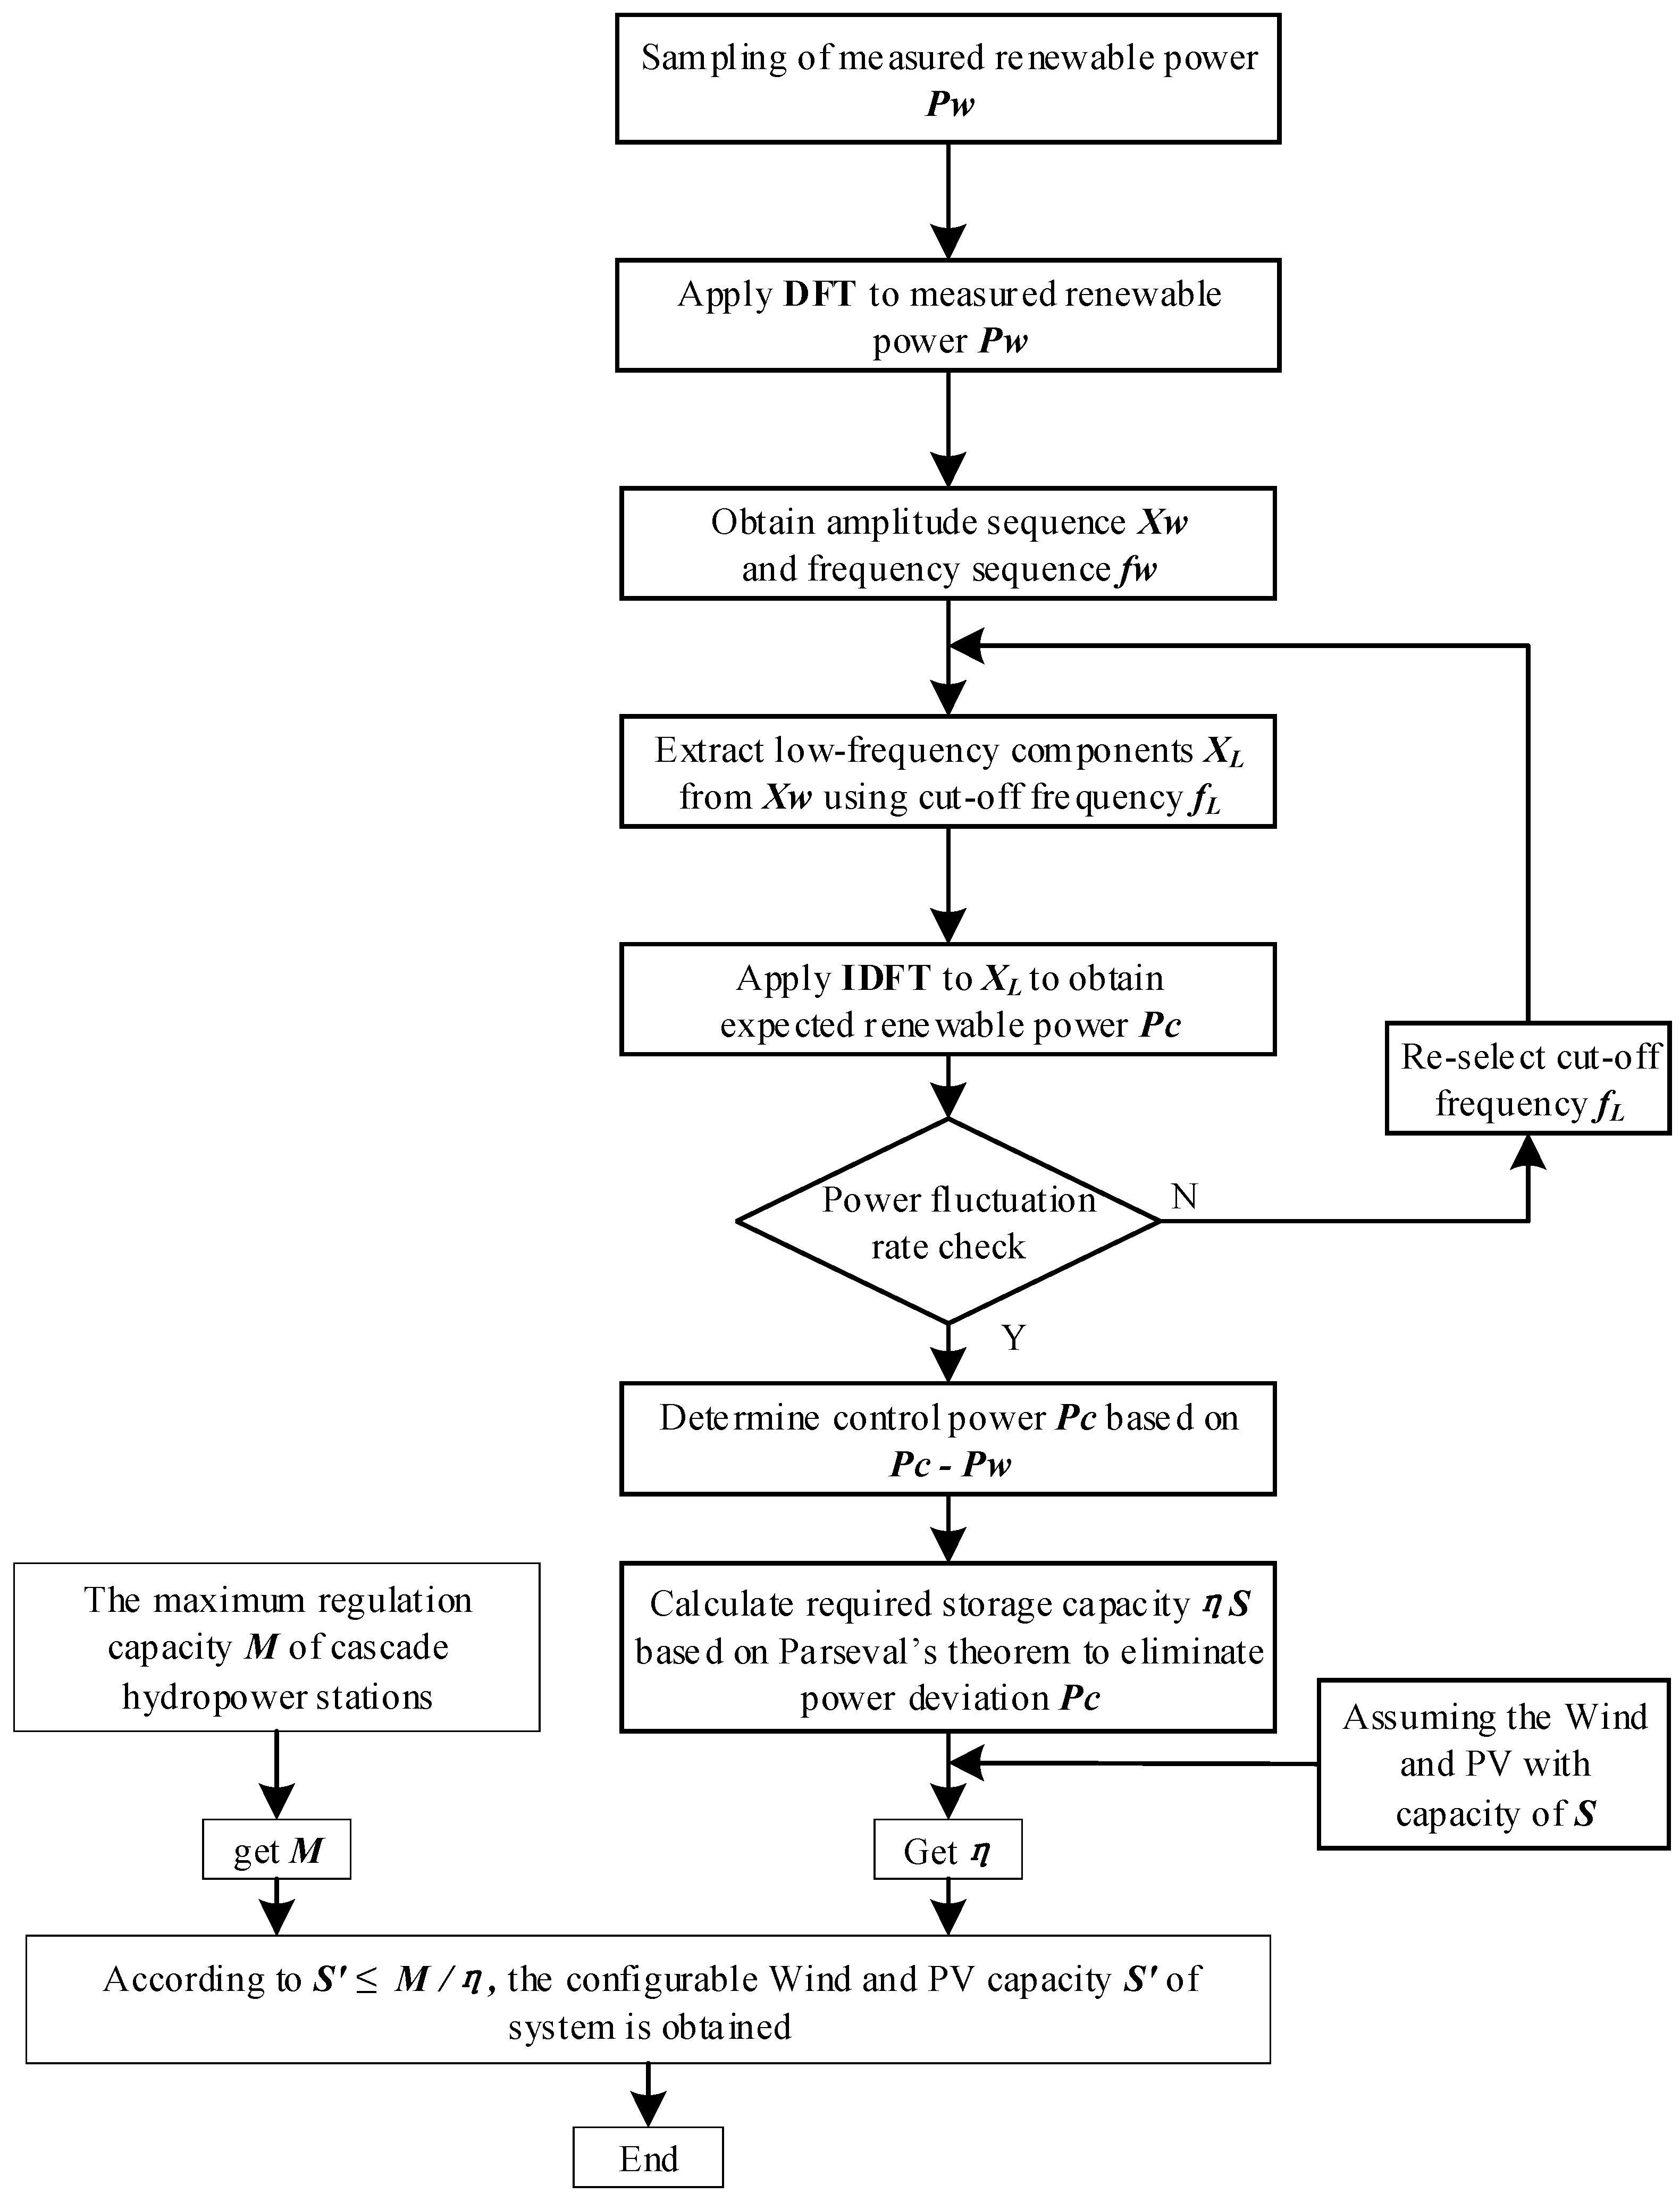
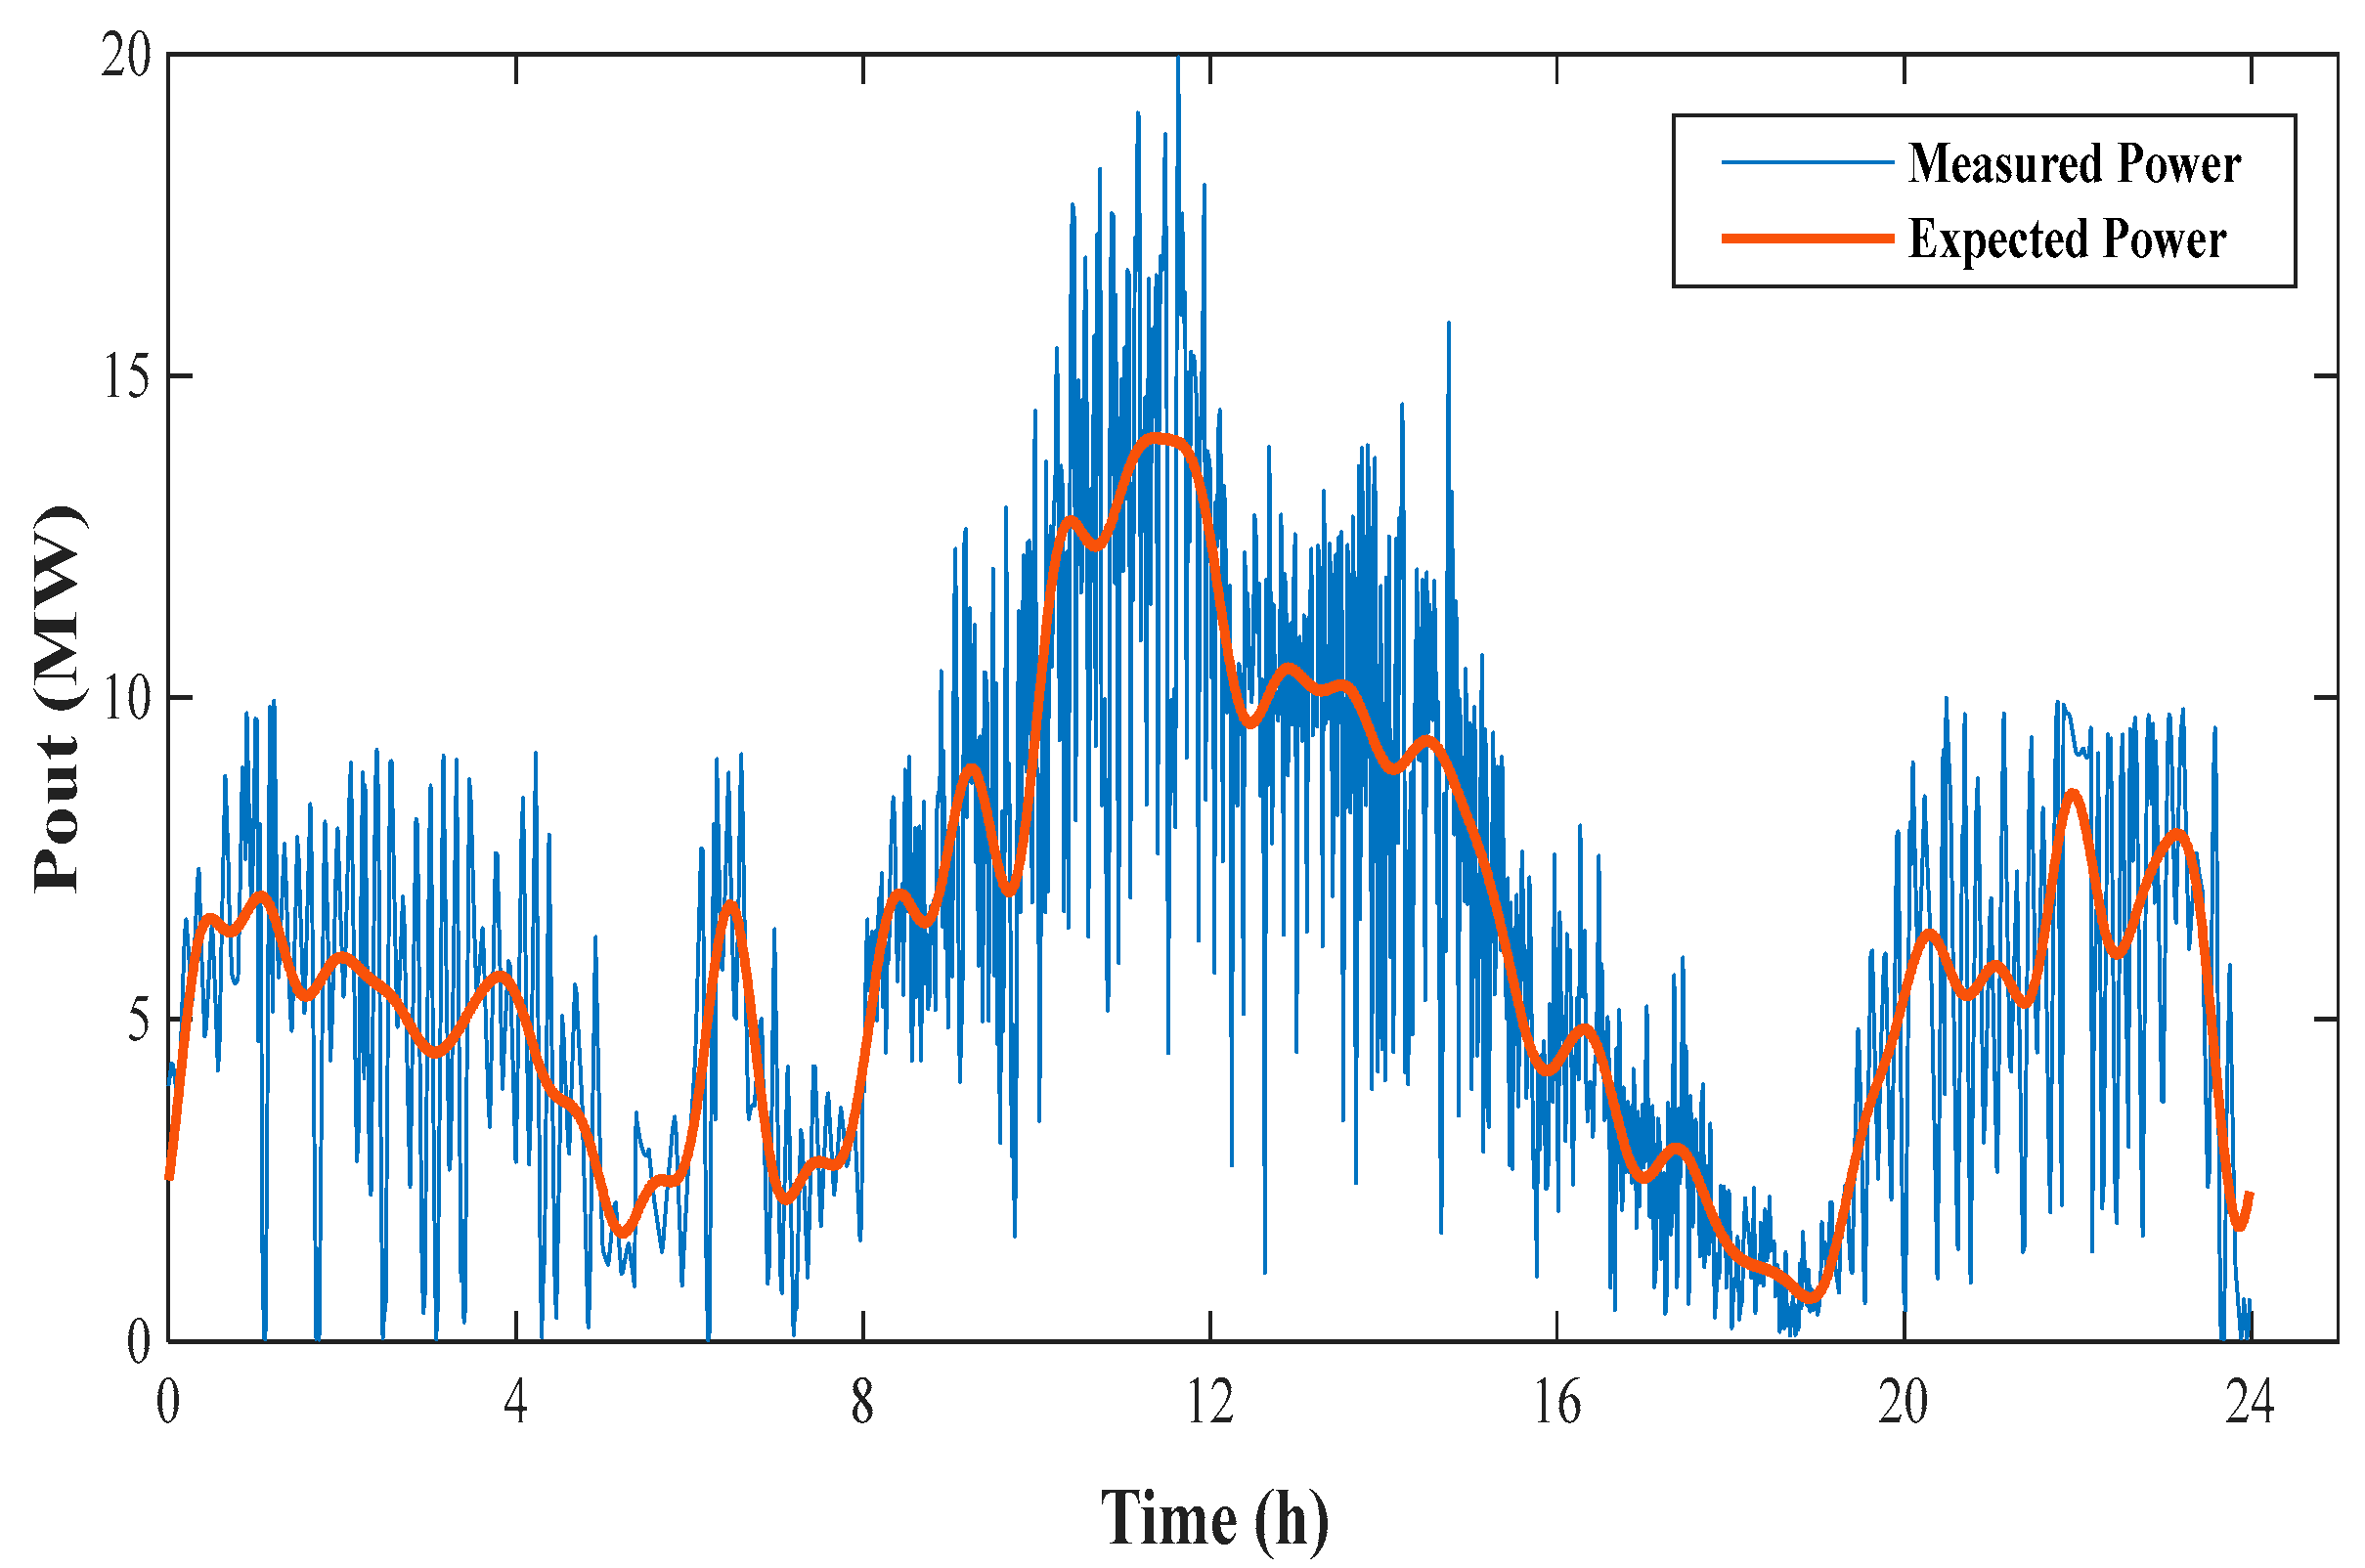
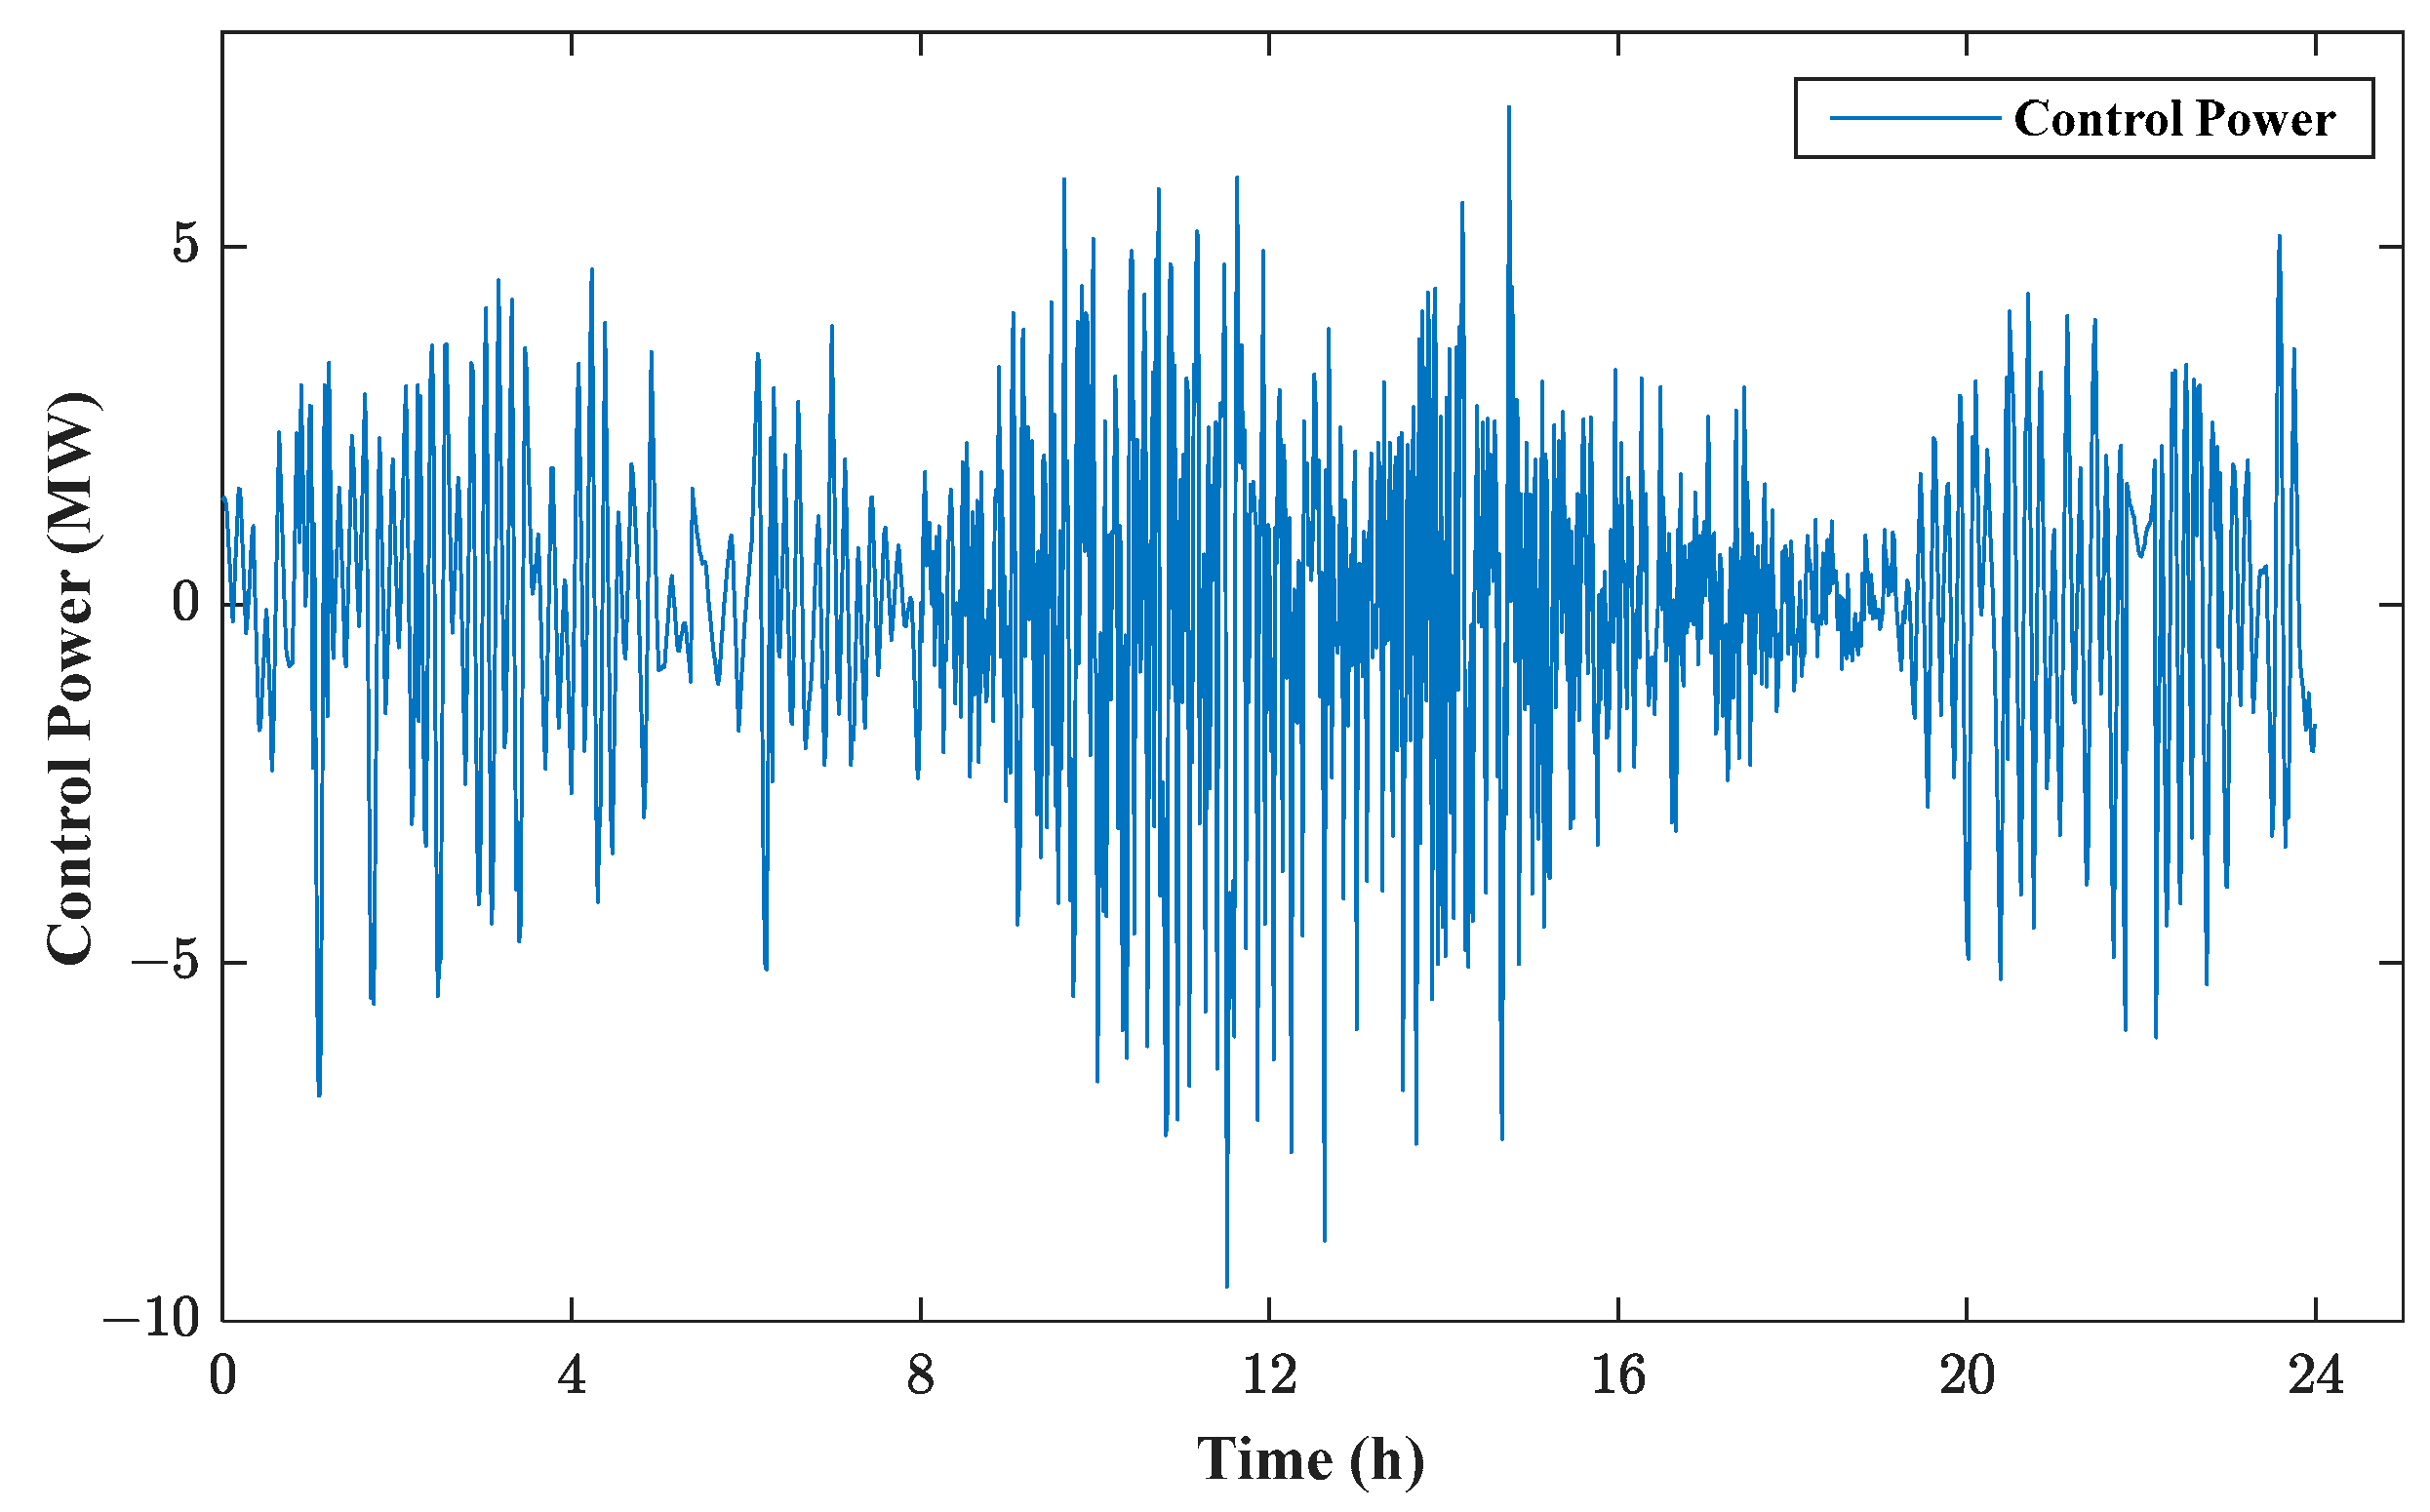
4.2. Wind and PV Power Fluctuation Rate Calculation

According to Nyquist’s Sampling Theorem, wind speed and light intensity, among other uncertainties, are sampled for a typical day to obtain the measured output power of the wind and PV for that day. Discrete Fourier Transform (DFT) can transform the time domain signal into the frequency domain signal, and its expression is as follows [33]:
Y ( n ) = k = 0 N 1 y k · e 2 π j n k N
where Y is the frequency domain signal; n is the signal sampling number in the frequency domain; y is a time domain signal; k is the signal sampling serial number in the time domain; N is the total number of samples in the time domain.
The measured output power sequence P w of the wind and light is subjected to DFT transformation, and the measured output power amplitude sequence X w of the wind and light and the corresponding frequency sequence f w are obtained. The expressions are
X w = [ X w [ 1 ] , , X w [ n ] , , X w [ N ] ] T f w = [ f w [ 1 ] , , f w [ n ] , , f w [ N ] ] T
where X w n is the amplitude corresponding to the n -th frequency; f w n is the n -th frequency in the measured sequence; N is the total number of samples.
In order to obtain the expected output power of the wind and PV, the low-frequency signals are intercepted from the sample amplitude sequence X w with the cut-off frequency f L and re-composed into the amplitude sequence. Based on the DFT characteristics and Nyquist’s Sampling Theorem, the amplitude sequence X L intercepted by the cut-off frequency f L is
X L = [ X L [ 1 ] , , X L [ n L ] , 0 , , X L [ N n L ] , X L [ N ] ] T
where X L n L is the amplitude corresponding to the cut-off frequency.
Inverse Discrete Fourier Transform (IDFT) is performed on the new sequence X L to obtain the expected power output of wind and PV. The IDFT expression is [34].
y k = k = 0 N 1 Y ( n ) · e 2 π j n k N
Wind and PV power exhibit significant volatility, so the expected output power of the wind and PV must comply with the specified range of power fluctuation rate to ensure the safety and stability of the power system operation. The power fluctuation rate in the period T r is expressed as follows:
F p r = P max t P min t P e × 100 % F p r , T r
where F p r is the active power fluctuation rate; F p r , T r is the maximum value of active power fluctuation rate; P e is the rated power, kW; P max t and P min t are the maximum and minimum output power during the period, kW.
The fluctuation index in Equation (8) is used to assess whether the expected power output of the wind and PV is within the fluctuation index. If it can be satisfied, the expected power output of wind and PV is P c . If it cannot be satisfied, the cut-off frequency f L must be recursively adjusted until the expected value P c satisfies the index.

4.3. Wind and PV Capacity Configuration Calculation

After calculating the maximum regulation capacity of the cascade small hydropower stations and the expected output power of wind and PV, it can be seen that the wind and PV capacity of the cascade small hydropower generation system can be configured after the transformation:
The wind and PV control power P b is determined by the difference between the expected value P c and the measured value P w :
P b = P c P w
Perform the DFT on P b to obtain the corresponding frequency domain signal. According to Parseval’s Theorem, the total energy of the signal in the frequency domain is equal to its total energy in the time domain [35]. Based on this theorem, the system’s regulation capacity for smoothing wind and PV power can be calculated as follows:
P ( f 1 , f 2 ) = f 1 f 2 Y ( f ) 2
where P ( f 1 , f 2 ) is the energy storage demand value in f 1 , f 2 , kW.
The total configurable wind and PV capacity S of cascade hydropower stations with the maximum regulation capacity of M is
S M / η
where η is the proportion of the regulation capacity of the system to smooth the wind and PV power in the total installed capacity. Assuming the wind and PV with capacity of S , then η is
η = P ( f 1 , f 2 ) / S
The specific flow of the capacity configuration of the cascade small hydropower-pumped storage–wind–PV complementary system is shown in Figure 2.

5. Optimization and Scheduling Model of the Complementary System

In order to verify the rationality of the above capacity configuration method, this paper establishes the optimization and scheduling model of the complementary system to minimize the deviation power of the complementary system in the daily cycle period. The safety and economy of the complementary system and the cascade small water–wind–PV system without pumped storage transformation are compared and analyzed based on different extreme scenarios of wind and PV output fluctuation.

5.1. Target Functions

After the capacity configuration, the complementary system has the smallest deviation power:
min E = t = 1 T P s ( t ) + P w ( t ) + i = 1 I ( P g ( i , t ) P p ( i , t ) ) P l ( t ) Δ t
where E is the total deviation power of the system, kWh; T is the total number of optimized periods, and t is the period variable; I is the total number of hydropower stations, and i is the number of hydropower stations; P s ( t ) is the output of the PV power station in the t -th period, kW; P w ( t ) is the output of the wind power in the t -th period, kW, P g ( i , t ) is the generating power of the i -th stage hydropower station in the t -th period, kW, P p ( i , t ) is the pumping power of the i -th stage hydropower station in the t -th period, kW, and P l ( t ) is the planned output in the t -th period, kW.

5.2. Power Generation and Environmental Benefits

In order to more intuitively compare the power generation benefits brought by the combined power generation of the complementary system, this paper uses the time-of-use electricity price mechanism to optimize the total power generation benefits of the complementary system, namely,
max B = t = 1 T C i , t ( P s ( t ) + P w ( t ) + i = 1 I P g ( i , t ) P p ( i , t ) ) Δ t
where B is the total power generation income of the system, CNY; C i , t is the time-of-use electricity price of the t -th period, CNY/kWh.

5.2.1. System Construction Cost

Since the wind turbines, PV panels, and cascade small hydropower stations have already been constructed, the construction cost of the system includes only the cost of pumped storage retrofitting and operation and maintenance expenses. The total life-cycle cost of the complementary system is calculated as follows:
C l c c = C i n v + C o m ( 1 + r ) T 1 ( 1 + r ) T r
where C l c c is the total life-cycle cost of the system, CNY; C i n v is the cost of the pumped storage retrofitting, CNY; C o m is the operation and maintenance cost of the system, CNY; r is the discount rate; T is the system life cycle, year.

5.2.2. System Benefit

Consider the direct or indirect environmental benefits of building the complementary system, including electricity sales revenues S e l e and carbon emission reductions S C O 2 :
S e l e = C r l o u t W o u t
S C O 2 = C C O 2 W o u t
where C r l o u t is the electricity sales price, CNY/kWh; W o u t is the electricity sold by the system, kWh; C C O 2 is the carbon emission factor of the power grid.

5.3. Equation Constraints

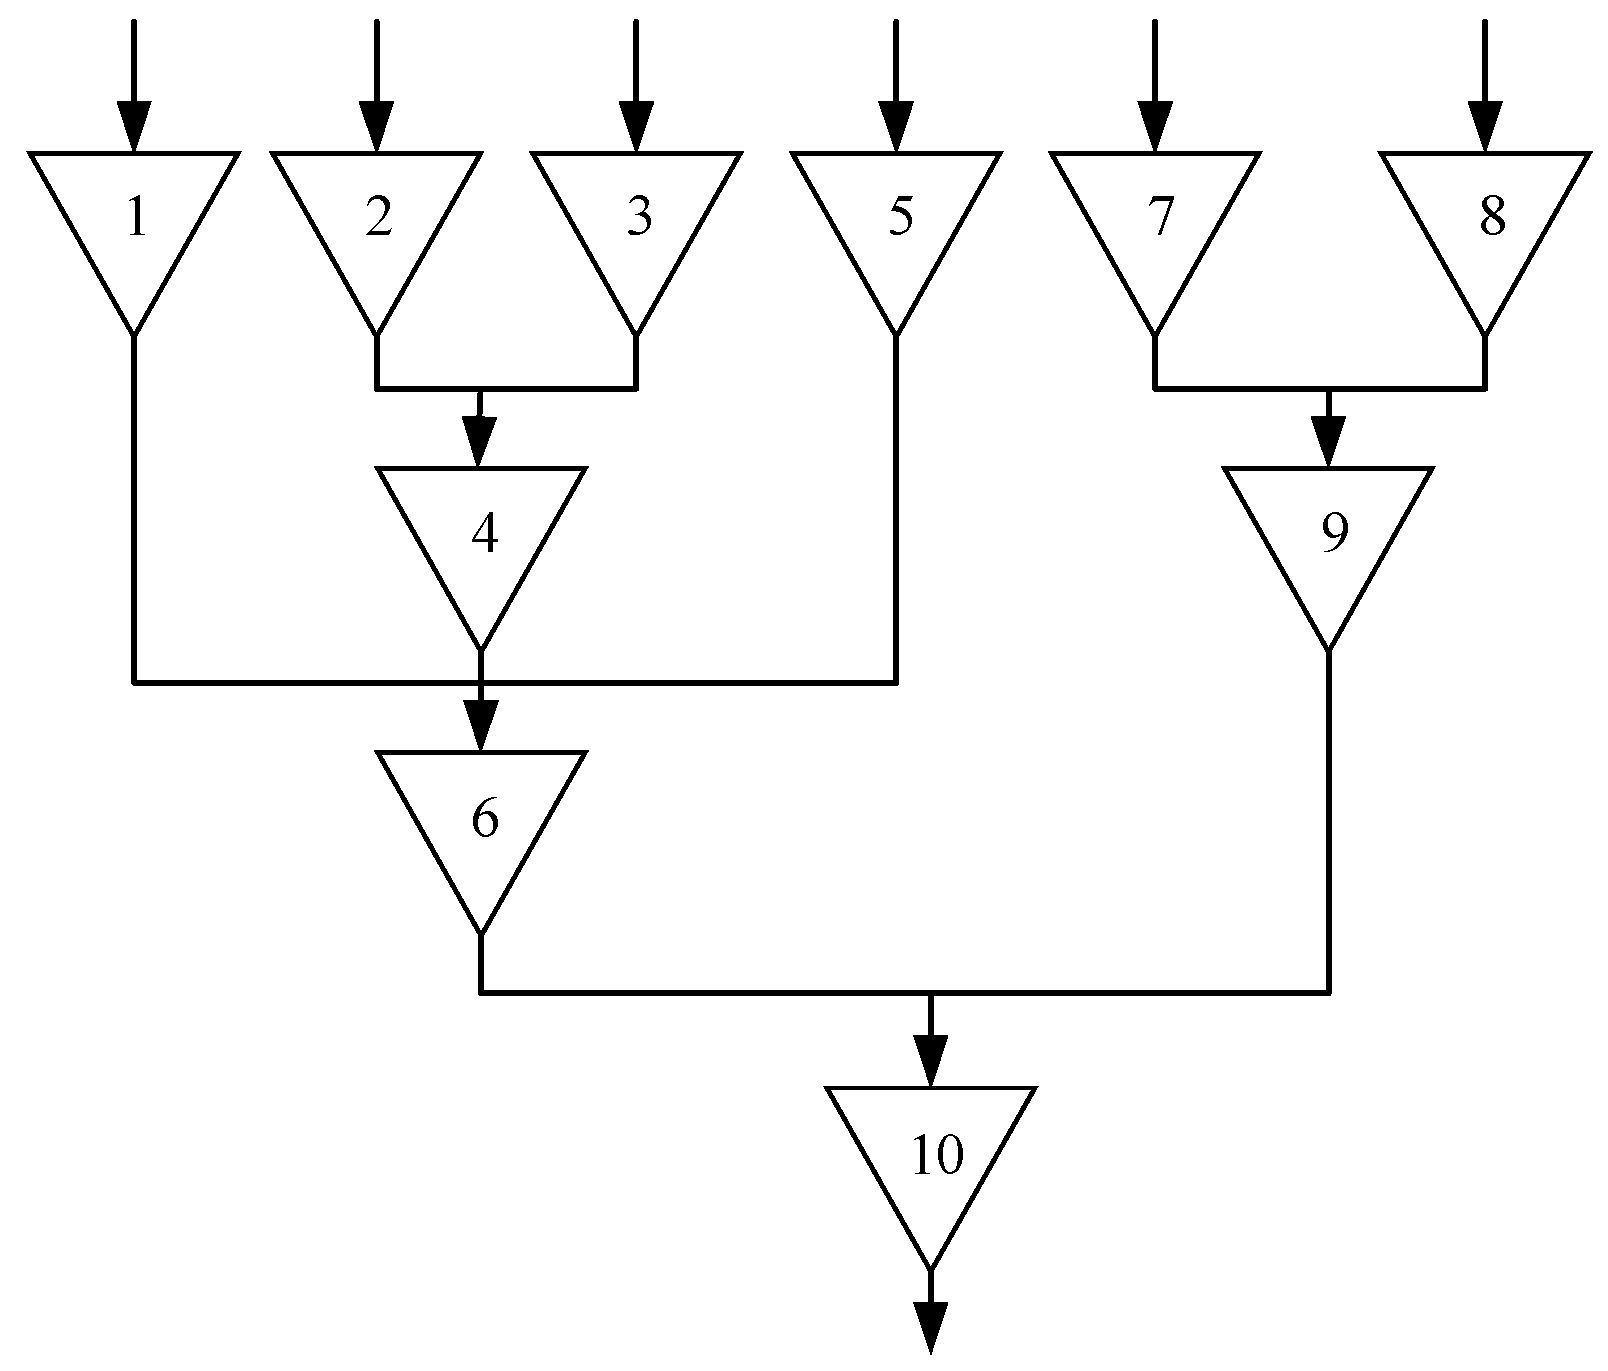
  • Water balance: Considering the flow balance between reservoirs, the flow into the lower reservoirs includes the discharge of the upstream reservoirs and the natural inflow of the interval. The reservoir capacity of the i -th hydropower station at the end of the t -th period is as follows:
    v ( i , t ) = v ( i , t 1 ) + I ( i , t ) [ s ( i , t ) + q ( i , t ) ] × Δ T + q p ( i , t ) × Δ T + k = 1 N u ( i ) [ s ( k , t ) + q ( k , t ) ] × Δ T
    where v ( i , t ) is the capacity of the i -th hydropower station at the end of the t -th period, 104  m 3 ; I ( i , t ) is the natural incoming water flow, m 3 / s ; s ( i , t ) is the abandoned water flow, m 3 / s ; q ( i , t ) is the power generation flow, m 3 / s ; q p ( i , t ) is the pumping water flow, m 3 / s ; N u ( i ) is the number of hydropower stations connected to the hydropower station upstream; s ( k , t ) is the abandoned water flow by upstream stations, m 3 / s ; q ( k , t ) is the power generation flow by upstream stations, m 3 / s ; Δ T is the conversion factor of flow and capacity, Δ T = 0.36 .
  • Capacity constraints:
    v ( i , 0 ) = v ( i ) b e g i n v ( i , T ) = v ( i ) e n d
    where v ( i ) b e g i n is the initial capacity of the i -th hydropower station, 104  m 3 ; v ( i ) e n d is the final capacity of the i -th hydropower station, 104  m 3 .
  • Water head constraints:
    h ( i , t ) = h f ( i , t ) h b ( i , t ) Δ h ( i , t )
    where h ( i , t ) is the water head of the i -th hydropower station in the t -th period, m; h f ( i , t ) is the pre-dam water level, m; h b ( i , t ) is the tailwater level, m; Δ h ( i , t ) is the head loss, m.
    The h f ( i , t ) can be calculated using the following equation:
    h f ( i , t ) = a 0 + a 1 v ( i , t ) + a 2 v 2 ( i , t )
    The pre-dam water level-storage capacity coefficient of the reservoir is a constant, a i , i = 0 , 1 , 2 , which is typically fitted using the corresponding data of actual hydropower station water levels and storage capacities.
    The h b ( i , t ) can be calculated using the following equation:
    h b ( i , t ) = b 0 + b 1 [ s ( i , t ) + q ( i , t ) ] + b 2 [ s ( i , t ) + q ( i , t ) ] 2
    The tailwater level-outflow coefficient of the reservoir is a constant, b i , i = 0 , 1 , 2 , which is typically fitted using the corresponding data of actual hydropower station tailwater levels and outflow.
  • Generating power:
    P g ( i , t ) = A η h ( i , t ) q g ( i , t )
    where A is the conversion coefficient of power and water; η is the efficiency of hydropower units.
  • Pumping power:
    P p ( i , t ) = q p ( i , t ) g h p ( i , t ) η p ( i )
    where h p ( i , t ) is the pumping head of the i -th pumping unit in the t -th period, m; η p ( i ) is the pumping operation efficiency of the i -th pumping unit, which typically ranges from 0.75 to 0.85. Since the value of η p ( i ) is less than 1, it reflects the existence of energy losses during pumping operations. g is the local gravity acceleration.
  • Complementary constraints of pumping/power generation: The system cannot be in the pumping and power generation modes at the same time:
    q g ( i , t ) q p ( i , t ) = 0
  • The relationship between wind power and wind speed is expressed as follows:
    P w ( t ) = 0 v v i n , v v o u t P E v v i n v r v i n v i n v v r P E v r v v o u t
    where P w ( t ) is the output of the wind power in the t -th period, kW; P E is the rated power output of the wind turbine generator, kW; v is the pmeasured wind speed, m/s; v i n is the cut-in wind speed, m/s; v o u t is the cut-out wind speed, m/s; v r is the rated wind speed, m/s.
  • The output power of the PV is inversely proportional to temperature and directly proportional to solar irradiance. The expression is given as follows:
    P s ( t ) = η S I ( 1 0.005 ( T 0 + 25 ) )
    where P s ( t ) is the output of the PV in the t -th period, kW; η is the solar energy conversion efficiency; S is the total surface area of the PV panels, m2, I is the solar irradiance, kW/m2; T 0 is the ambient temperature, °C.

5.4. Inequality Constraints

  • System power constraints:
    P g ¯ ( i ) P g ( i , t ) P g ¯ ( i ) P p ¯ ( i ) P p ( i , t ) P p ¯ ( i ) P s ¯ P s ( t ) P s ¯ P w ¯ P w ( t ) P w ¯
    where P g ¯ ( i ) , P g ¯ ( i ) are the upper and lower limits of generating power of the hydropower station, kW; P p ¯ ( i ) , P p ¯ ( i ) are the upper and lower limits of pumping power, kW; P s ¯ , P s ¯ are the upper and lower limits of PV power, kW; P w ¯ , P w ¯ are the upper and lower limits of wind power units, kW.
  • System power deviation constraint:
    P s ( t ) + P w ( t ) + i = 1 I ( P g ( i , t ) P p ( i , t ) ) P l ( t ) β P l ( t )
    where β denotes the power deviation coefficient, whose value is usually set according to real-world operational requirements. This constraint indicates that the system is subject to energy transmission limitations.
  • Water flow constraints:
    q g ¯ ( i ) q g ( i , t ) q g ¯ ( i ) q p ¯ i q p ( i , t ) q p ¯ i
    where q g ¯ ( i ) , q g ¯ ( i ) are the upper and lower limits of the power generation flow, m 3 / s ; q p ¯ i , q p ¯ i are the upper and lower limits of the pumping water flow, m 3 / s .
  • Adjustable capacity constraints:
    v c ( i , t ) = v ( i , t ) v d ( i , t ) v c ¯ ( i , t ) v c ( i , t ) v c ¯ ( i , t )
    where v c ( i , t ) is the adjustable capacity of the i -th hydropower station, 104  m 3 ; v d ( i , t ) is the minimum allowable storage capacity of the i -th hydropower station, 104  m 3 ; q p ¯ i , q p ¯ i are the upper and lower limits of the adjustable capacity, 104  m 3 .

6. Case Simulation

The study area is a cascade of small hydropower plants located within a certain watershed, with abundant wind resources and plentiful sunlight. The wind-related parameters are as follows: cut-in wind speed is 2.5 m/s, cut-out wind speed is 12 m/s, and rated wind speed is 8 m/s. The PV-related parameters are as follows: total irradiated area is 5.8 × 10⁴ m2, and the solar energy conversion efficiency is 0.2.
To reflect the hierarchical structure of cascaded small hydropower systems, a three-tier configuration was adopted in this study. Specifically, hydropower stations 1, 2, 3, 5, 7, and 8 are classified as first-tier upstream stations; stations 4, 6, and 9 are designated as second-tier midstream stations; and station 10 serves as the third-tier downstream station. The hydraulic coupling relationships among these stations are complex, which better represents the structural characteristics of cascaded small hydropower systems in real-world applications. The topological structure of the cascade of small hydropower plants in this watershed is shown in Figure 3. The numbers 1 to 10 in the figure represent the serial numbers of the small hydropower plants. The parameters of each hydropower station are shown in Table 2.

6.1. Cascade Small Hydropower-Pumped Storage Transformation and Capacity Calculation Results

According to the topology diagram of the cascade small hydropower plants, the No. 6 hydropower reservoir and No. 10 hydropower reservoir form a hydraulic cascade relationship between the upper and lower reservoirs; it can be seen from the reservoir capacity parameters that the regulating reservoir capacity of No. 6 can meet the regulation requirements of joint operation and independent operation of runoff daily regulation and energy storage peak regulation, which meets the requirements of the upper reservoir as pumped storage. The No. 10 reservoir capacity is the largest in the basin, which meets the requirements of the lower reservoir water storage, and both No. 6 and No. 10 have regulated storage capacity, so the “integrated combination” method is used to carry out pumped storage transformation of cascade small hydropower. In order to improve the utilization rate of the original generator set and not increase the reconstruction cost, a water pump is added to the No. 6 hydropower station as the pumped storage unit to complete the transformation.
The cascade small hydropower-pumped storage transformation aims to expand the pumped storage function while ensuring the basic function of water supply and power generation. Therefore, this paper matches the total power generation regulation capacity and total water pumping regulation capacity of the entire cascade of small hydropower plants as the primary basis for determining the capacity of the pumped storage unit. The calculation results of the maximum regulation capacity for each hydropower station are shown in Table 3.
According to the calculation results, the total regulation capacity of the cascade small hydropower plants is 15.7 MW. In order to supplement the pumping and regulating capacity of cascade small hydropower plants, the capacity of the installed pumped storage unit must be no less than the total regulation capacity. Therefore, the total capacity of the pumped storage unit installed at Hydropower Station No. 6 is 16 MW.

6.2. Wind and PV Capacity Configuration Results

In this paper, the historical incoming water flow data of the watershed are consulted, and the inflow scene in the average water period is selected. The inflow for the 10 cascade small hydropower stations is shown in Table 4.
The combination of light intensity and wind speed in the watershed is used as four different typical scenarios to check the capacity configuration results. The four scenarios consider the extreme cases of the maximum or minimum output value of wind power and PV alone. The stronger the volatility is, the more extreme the joint output value of wind power and PV is. The four scenarios have higher requirements for the operation safety of the system than other scenarios. The scene definition is shown in Table 5:
The sunny and windy scenes with the strongest volatility and the most extreme wind–PV joint output are selected as a typical day for sampling:
Assuming that the installed capacity of wind power and PV is 10 MW, 1440 sampling points are set up throughout the day, and the sampling interval is 1 min. According to the standard that the power fluctuation rate remains below 10% within 5 min, the corresponding expected output value of wind–PV is obtained by spectrum analysis. The measured power and the expected power curve are shown in Figure 4.
When the cut-off frequency fL = 3.9 × 10⁻⁴ Hz, the rate of power change in the expected output within 5 min is reduced to below 9.97%, which satisfies the requirement that the power fluctuation rate remains under 10%.
The control power of the wind–PV joint is shown in Figure 5, and the power spectrum is obtained by DFT, as shown in Figure 6.
According to Parseval’s Theorem, the capacity requirements of different frequency bands of wind and PV are calculated, respectively, and the adjustment capacity of wind and PV required to be configured accounts for 35.99% and 24.23% of their installed capacity, respectively. It can be seen that the cascade small hydropower with a regulation capacity of 16 MW can be configured with a wind turbine capacity of 44 MW and a PV cell capacity of 66 MW. The capacity configuration results are shown in Table 6.

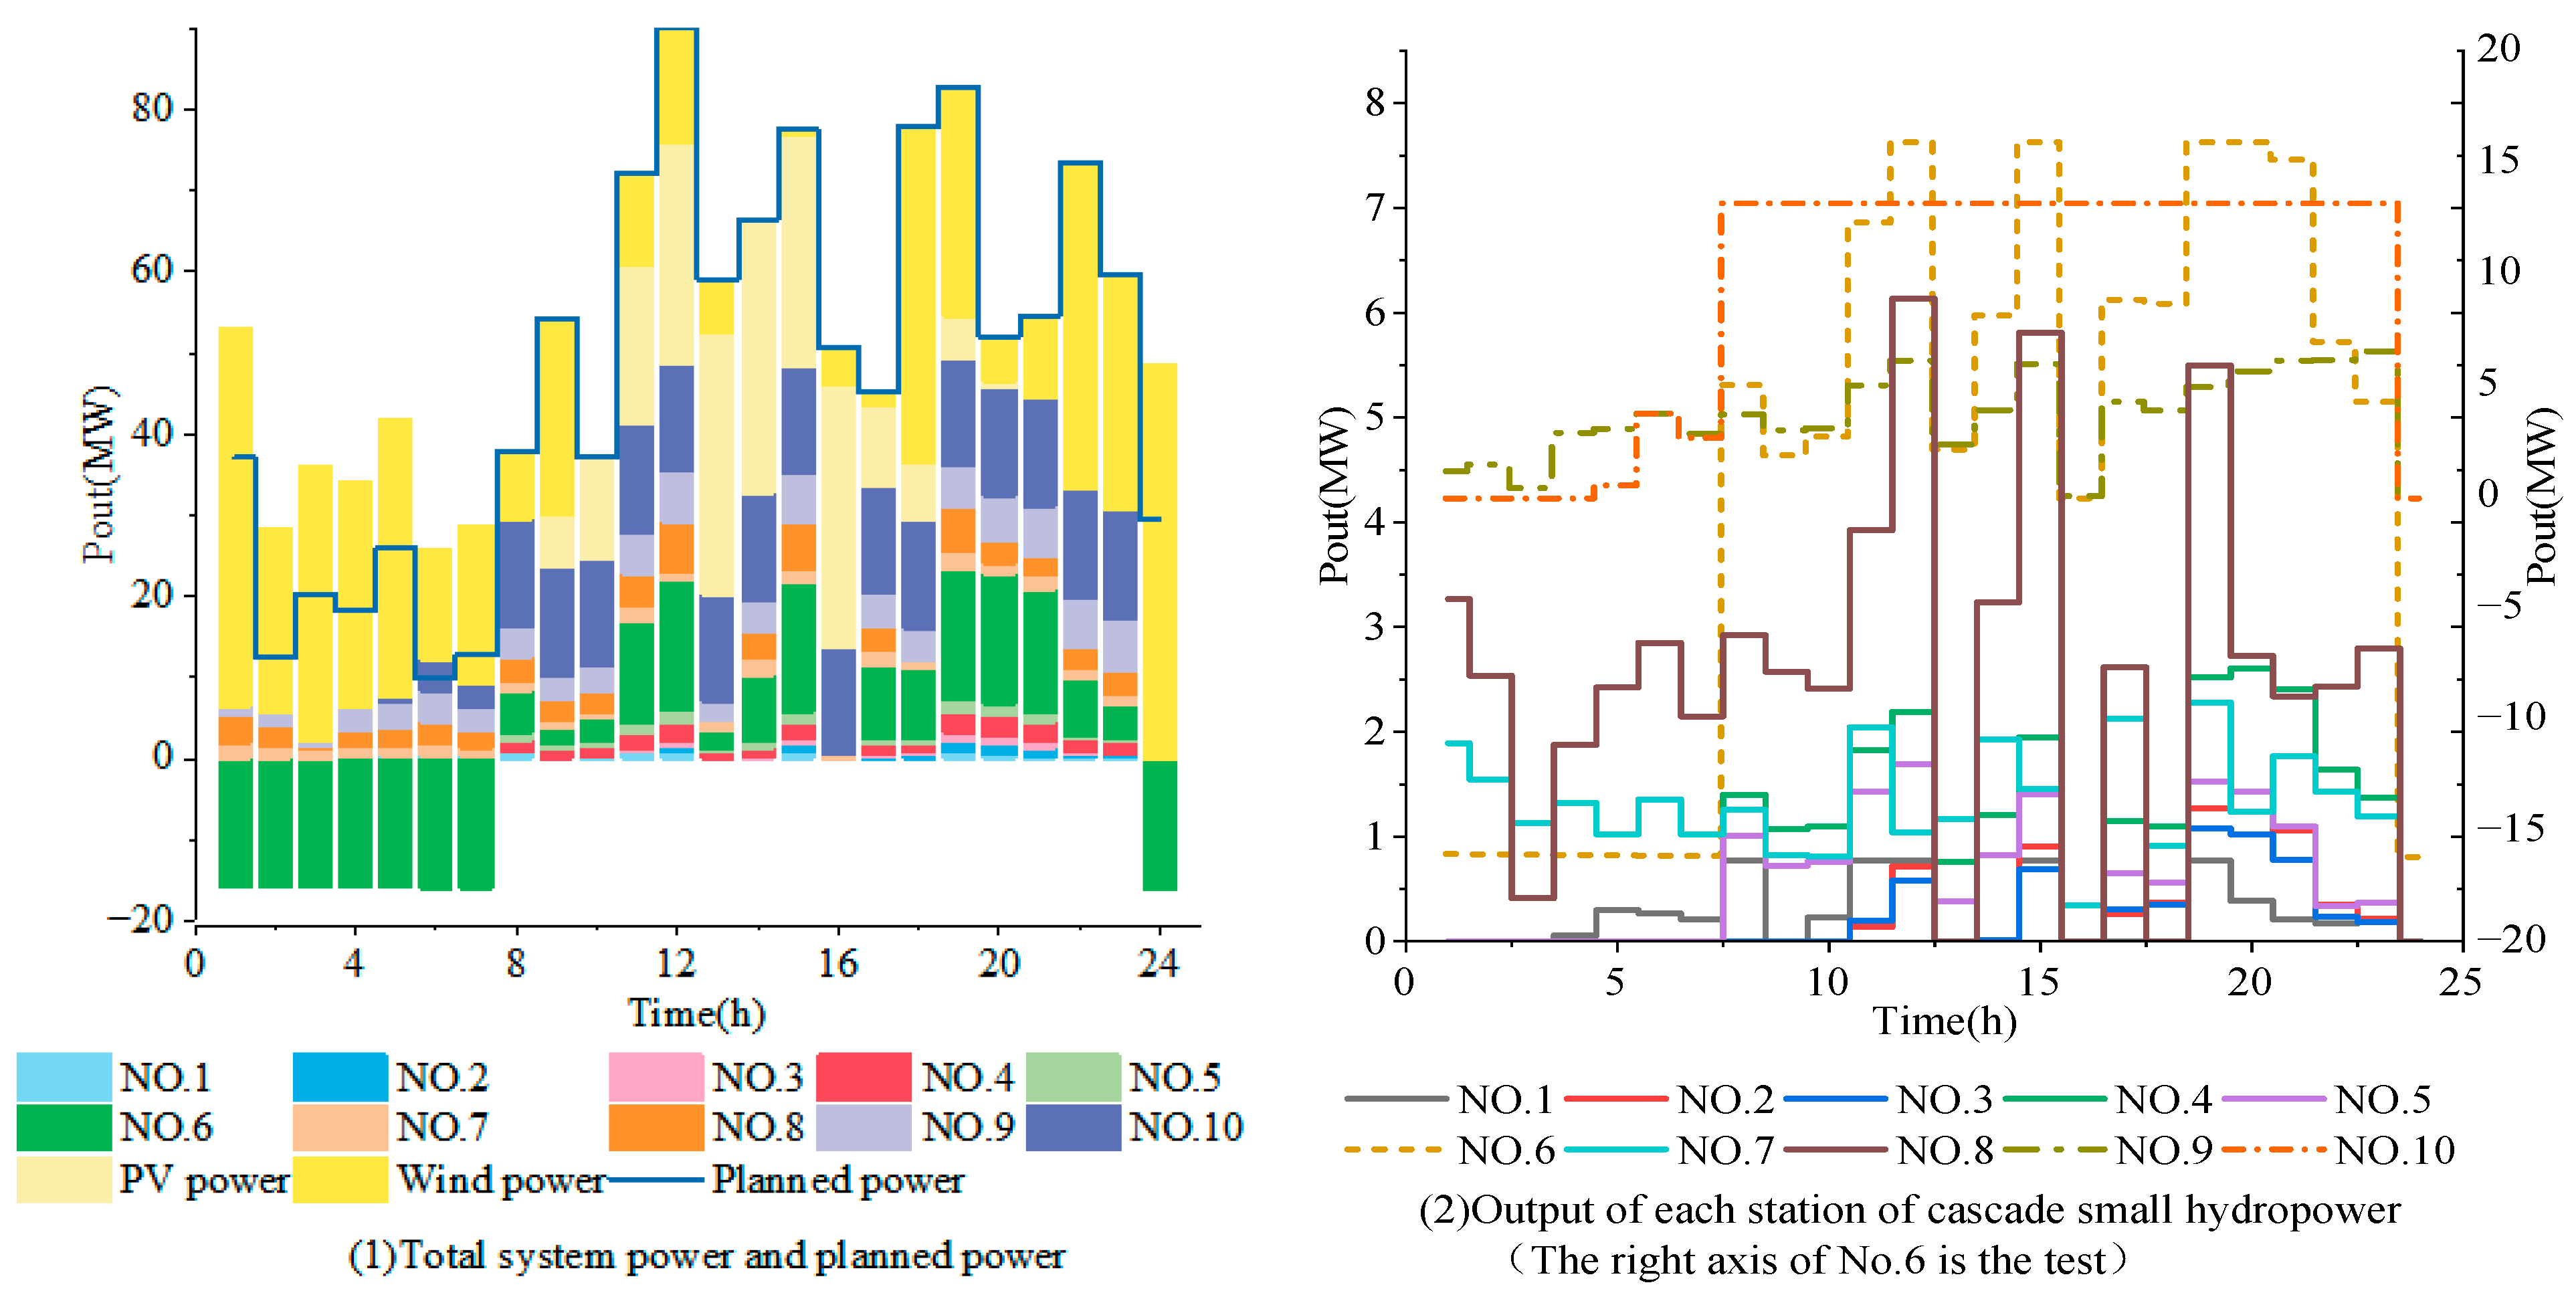
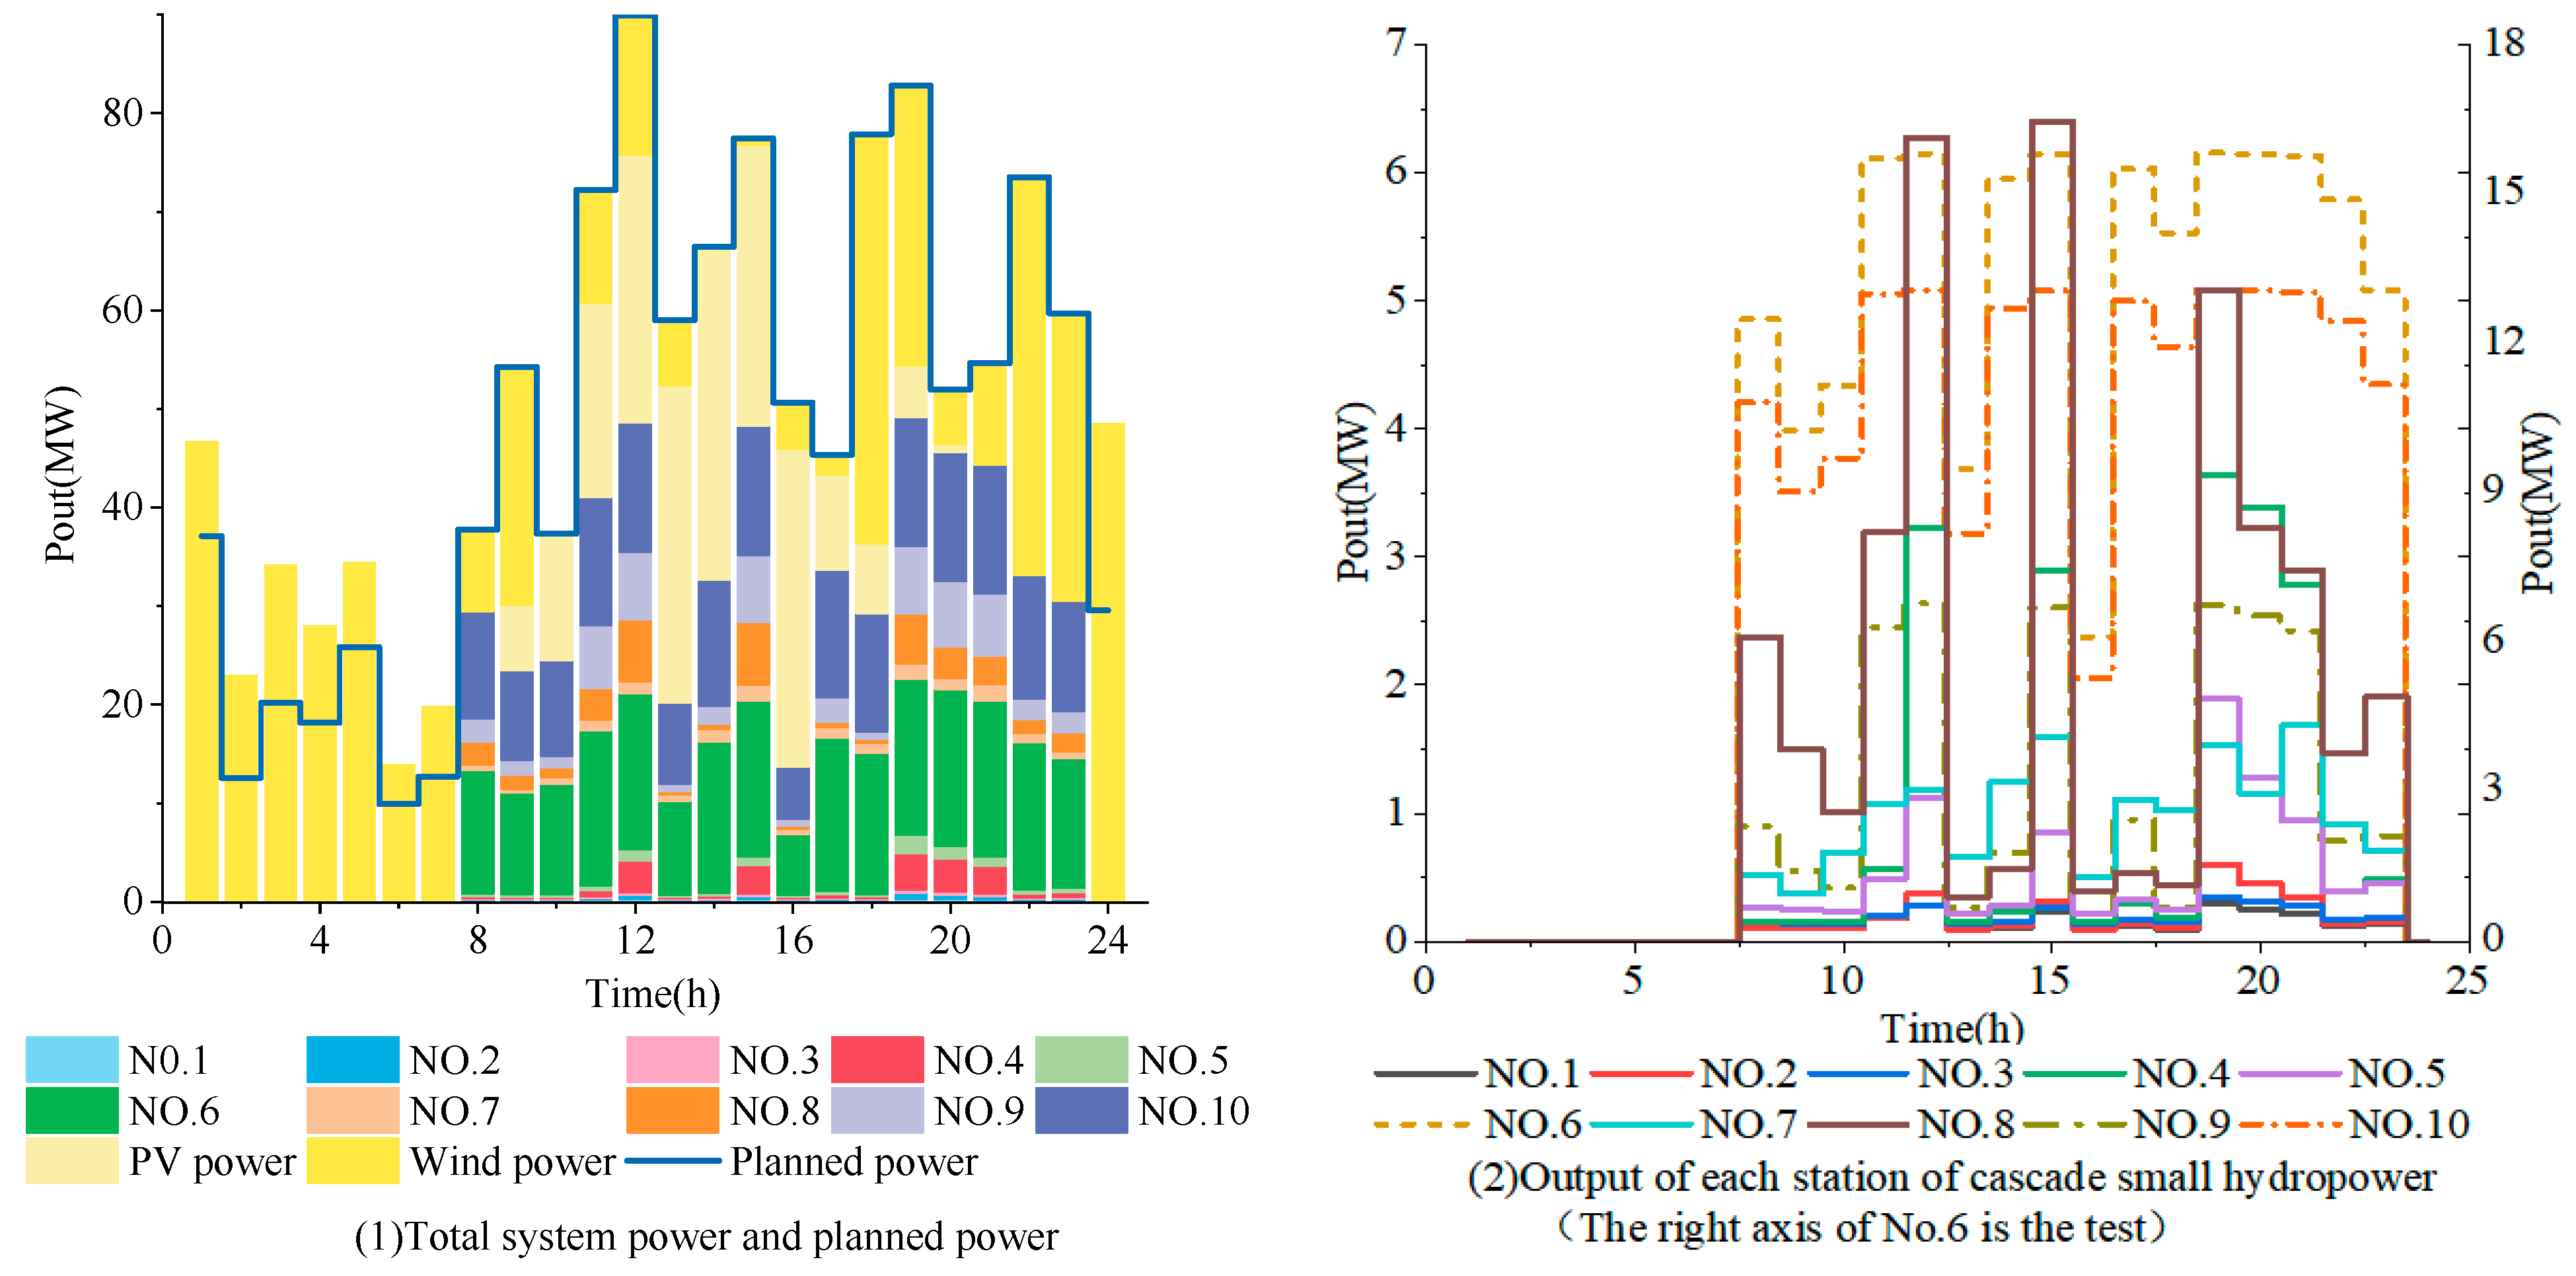
6.3. Complementary System Multi-Scenario Optimal Scheduling Results

Optimal scheduling of multi-scenarios to minimize the deviation power of the complementary system operation. As shown in Figure 7, after the pumped storage transformation, the cascade small hydropower station can operate flexibly and under control under the two working conditions of pumping and power generation according to the demand. The total output of the complementary system can be adjusted to match the planned output, resulting in a system deviation power of 0 MWh. This demonstrates that the complementary system is also capable of meeting the capacity requirements for smoothing wind and PV output fluctuations under other scenarios.

6.4. Comparative Analysis of Operation

The results of the operational scheduling of the complementary system without pumped storage transformation are shown in Figure 8.
If the system operates completely according to the planned values, there will be a large number of abandoned wind in the low period of wind power. At the same time, small hydropower has a large amount of surplus water, which causes different degrees of resource waste in the system under different scenarios. The results of the two forms of system operation in four scenarios are shown in Table 7.
It can be seen that adding a pumped storage unit improves the regulation performance of cascade small hydropower stations while enabling the small hydropower stations to perform “peak shaving and valley filling” thereby addressing the issue of fluctuations in wind and PV output.

6.5. Economic Benefit Analysis of Power Generation

A reasonable peak–valley feed-in tariff structure can fully stimulate the enthusiasm for peak regulation of water storage, thus alleviating the tension between the supply and demand of peak–load electricity. Due to the large tariff gap at different times, it is necessary to schedule the complementary system so that each power source can generate more power when the tariff is higher. The grid time-sharing tariff policy adopted in this paper is shown in Table 8.
With the objective of maximizing generation benefits in the complementary system, Table 9 compares the power generation revenues between pumped-storage retrofitted and non-retrofitted systems under four operational scenarios.
Compared with the system without pumped-storage retrofitting, the complementary system with pumped storage achieves an increase in power generation benefits by 5.13% to 6.22%. This improvement is attributed to the operation of pumped storage units following a “valley pumping–peak generation” strategy, which enables electricity price arbitrage. During low-price periods, excess wind and PV output is converted into stored water energy, which is then used to generate electricity during high-price periods to fill the power gap. This effectively redistributes the output of wind and PV resources, thereby enhancing the overall power generation benefits of the system.
Assuming a 10-year system life cycle and a discount rate of 8%, the initial construction cost of the system is shown in Table 10.
Assuming an even annual distribution of the four scenario types, the power generation benefits of the system are shown in Table 11.
The annual power generation of the complementary system is 5309.71 MWh, with a total income of CNY 218.936 million, and the overall operation economy is good. Carbon emission reduction is 281,500 tons, which has certain environmental significance.
The overall system benefits are calculated and presented in Table 12.
After the pumped storage retrofit, the total life-cycle cost of the system increased by CNY 2.1368 million. However, the total power generation revenue increased by CNY 116.709 million, making it possible to recover the investment and demonstrating strong overall economic performance.

7. Value of the Work and Findings

In the planning and scheduling of hybrid or distributed energy systems, the effective integration between predictive analytics and prescriptive analytics plays a vital role in enhancing operational stability and optimizing resource allocation. Predictive analytics focuses on quantifying and forecasting the output fluctuations of renewable energy sources such as wind and PV, while prescriptive analytics formulates optimal response strategies and capacity configuration schemes based on these forecasts. This paper proposes a method for configuring the capacities of pumped storage units, wind power, and PV generation based on the adjustable capacity of cascade small hydropower stations. Through spectral analysis, the power output fluctuations of renewable sources are decomposed and characterized in the frequency domain. By setting the fluctuation rate threshold to no more than 10%, the expected output power of renewable sources that meets the volatility constraint is derived. This spectral analysis process can be regarded as a form of predictive analytics, serving to identify and quantify the fluctuation characteristics of renewable power outputs.
Building upon this foundation, the expected output power of renewable energy sources is further integrated with the regulation capability of cascade small hydropower to construct an optimized scheduling model for the cascade hydropower–wind–PV-pumped storage complementary power generation system. This model is used to verify the effectiveness of capacity configuration under multiple scenarios, representing the core task of prescriptive analytics. This logical chain from prediction to decision-making significantly enhances the scientific rigor and adaptability of capacity planning.
This paper achieves a methodological integration from fluctuation analysis to capacity configuration optimization, reflecting the combined value of predictive and prescriptive analytics in the planning of renewable energy systems. The proposed approach carries important theoretical and practical significance for improving the operational stability and resource utilization efficiency of multi-energy complementary systems.
Similarly, the wind ramp event-based forecasting model proposed in Reference [1] also starts from the fluctuation characteristics of power output and provides predictive support for optimization models within prescriptive analytics. If integrated with capacity configuration strategies in future work, this model could further enhance the system’s robustness and proactive response capability against uncertainty disturbances.

8. Conclusions

In order to improve the power generation stability of multiple strong, uncertain power sources in remote areas, this paper analyzes the complementary characteristics of cascade small hydropower and distributed wind–PV resources. Based on this analysis, a site-specific approach is adopted to select cascade small hydropower for pumped storage transformation as the energy storage method. It also proposes research on the capacity configuration of a cascade small hydropower-pumped storage–wind–PV complementary system. Through simulation, the following conclusions are drawn.
  • Contributions of this study are as follows:
    (1)
    The capacity configuration method proposed in this study maximizes the utilization of existing cascaded small hydropower stations by allocating the capacity of pumped storage units based on the total available regulation capacity of the cascade system. In addition, the installed capacities of wind and PV power are determined using a spectral analysis approach, ensuring that the fluctuation rate of their combined output remains within 10%.
    (2)
    In terms of operational stability, the proposed system achieves deviation power of 0 MWh and water spillage of 0 m3 under all four typical day scenarios. In contrast, the system without pumped-storage retrofitting shows deviation power ranging from 40.58 MWh to 67.51 MWh and water spillage ranging from 626.4 × 10⁴ m3 to 928.4 × 10⁴ m3 under the same conditions. These results demonstrate that the proposed system can operate stably according to the scheduled output and significantly reduce wind, PV, and hydropower curtailment, thereby enhancing the system’s ability to accommodate renewable energy.
    (3)
    In terms of economic performance, the proposed system increases power generation revenue by 5.13% to 6.22%. Over a 10-year period, the total system revenue increases by CNY 116.709 million, demonstrating strong overall economic viability.
  • Inspiration for future study is as follows:
    (1)
    In this study, the capacity configuration was carried out under ideal forecasting conditions, without considering prediction errors in wind and PV output. However, in practical applications, forecasting errors are inevitable due to the stochastic nature of renewable energy sources. Therefore, conducting a sensitivity analysis on forecasting errors in future work will be beneficial for evaluating the robustness and adaptability of the system’s capacity configuration scheme.
    (2)
    In this study, the capacity configuration assumes that the system maintains constant efficiency throughout its entire operational life. However, in practical applications, the output power of PV modules gradually degrades over time, and wind turbine efficiency declines due to mechanical wear, blade erosion, and environmental factors. Therefore, incorporating these factors into the capacity configuration method in future work will contribute to improving the long-term validity and robustness of the proposed capacity sizing approach.
    (3)
    In this study, a fixed cut-off frequency was used in the frequency-domain analysis to separate the fluctuating components of renewable energy output. Therefore, future research could consider introducing an adaptive method for determining the optimal cut-off frequency based on system dynamic characteristics. This approach would improve the accuracy of power fluctuation smoothing and further enhance the responsiveness and overall performance of the capacity configuration strategy.

Author Contributions

Conceptualization, B.L. and S.L.; methodology, S.L.; software, S.L.; validation, B.L., S.L. and J.Z.; formal analysis, S.L.; investigation, S.L.; resources, B.L.; data curation, J.Z.; writing—original draft preparation, S.L.; writing—review and editing, J.Z.; visualization, S.L.; supervision, B.L.; project administration, P.L.; funding acquisition, B.L. and P.L. All authors have read and agreed to the published version of the manuscript.

Funding

This research was funded by the National Natural Science Foundation of China, grant number 52267006.

Institutional Review Board Statement

Not applicable.

Informed Consent Statement

Not applicable.

Data Availability Statement

The original contributions presented in this study are included in the article. Further inquiries can be directed to the corresponding author.

Conflicts of Interest

Author Jianing Zhao was employed by the company State Grid YANGZHOU Power Supply Company. The remaining authors declare that the research was conducted in the absence of any commercial or financial relationships that could be construed as a potential conflict of interest.

References

  1. Chen, Y.H. Technological Innovations and Future Prospectof Hydropower Development in Southwest China—A Case Study of Yalong River Hydropower Development. Hydropower Pumped Storage 2021, 7, 6–10+15. [Google Scholar]
  2. Wang, C.B.; Wang, J.B. Analysis and Discussion on Difficulties of Power Grid Regulation in Small Hydropower Enriched Area. Electrotech. Technol. 2019, 20, 68–69. [Google Scholar]
  3. Luo, Y.X.; Wang, Y.L.; Feng, Y. Variable-time Day-ahead Dispatching of High-proportion New Energy Grid-connected Joint System with Pumped Storage. Proc. CSU-EPSA 2024, 36, 115–121+132. [Google Scholar]
  4. Aihara, R.; Yokoyama, A.; Nomiyama, F.; Kosugi, N. Optimal operation scheduling of pumped storage hydro power plant in power system with a large penetration of photovoltaic generation using genetic algorithm. In Proceedings of the IEEE Trondhcim on Power Technology, Trondheim, Norway, 19–23 June 2011; pp. 1–8. [Google Scholar]
  5. Guo, Z.Z.; Ye, R.L.; Liu, R.Y.; Liu, J.N. Optimal scheduling strategy for renewable energy system with pumped storage station. Electr. Power Autom. Equip. 2018, 38, 7–14. [Google Scholar]
  6. Li, X.P.; Li, Y.; Liu, S.R.; Su, Y.H.; Wang, W.G.; Zhao, Q.X.; Xie, H.L. Research on Promotion of Renewable Energy Integration into Regional Power Grid by Variable Speed Pumped Storage Technology. New Energy 2021, 49, 52–58. [Google Scholar]
  7. Fang, M.; Chen, T.; Meng, K. Economic Analysis of Micro-Pumped Storage Stations Retrofitted from Small Hydropower Plants. Tech. Exch. 2023, 4, 27–29. [Google Scholar]
  8. Zhou, Y.; Zhu, Y.; Luo, Q.; Wei, Y.; Mei, Y.; Chang, F.-J. Optimizing pumped-storage power station operation for boosting power grid absorbability to renewable energy. Energy Convers. Manag. 2024, 299, 117827. [Google Scholar] [CrossRef]
  9. Liu, Y.X.; Luo, B.; Chen, Y.C.; Jia, B.; Liu, Z.W.; Zhou, C. Short-term Peak Shaving Model of Cascade Hybrid Pumped Storage Retrofitted from Conventional Hydropower. Power Syst. Technol. 2025, 49, 1217–1226. [Google Scholar]
  10. Huang, W.; Fu, Z.; Hua, L. Research on Optimal Capacity Configuration for Distributed Generation of Island Micro-Grid with Wind/Solar/Battery/Diesel Engine. In Proceedings of the 2018 2nd IEEE Conference on Energy Internet and Energy System Integration (EI2), Beijing, China, 20–22 October 2018. [Google Scholar]
  11. Wu, X.; Xu, K.; Wang, Z.; Gong, Y. Optimized capacity configuration of an integrated power system of wind, photovoltaic and energy storage device based on improved particles warm optimizer. In Proceedings of the 2017 IEEE Conference on Energy Internet and Energy System Integration (EI2), Beijing, China, 26–28 November 2017. [Google Scholar]
  12. Dou, X.B.; Yuan, J.; Wu, Z.J.; Ni, Y.M.; Pan, C.; Xiao, Y. Improved configuration optimization of PV-wind-storage- capacities for grid-connected microgrid. Electr. Power Autom. Equip. 2016, 36, 26–32. [Google Scholar]
  13. Ma, S.L.; Ma, H.M.; Jiang, X.P.; Duan, G.D.; Li, N. Capacity Configuration of the Hybrid Energy Storage System Basedon Bloch Spherical Quantum Genetic Algorithm. Proc. CSEE 2019, 35, 592–599. [Google Scholar]
  14. Liu, Y.Q.; Liang, C.; Yan, J.; Zhang, J. Optimal Configuration and Economic Study of Hybrid Energy Storage System in Wind and Solar Power Plants. Electr. Power 2020, 53, 143–150. [Google Scholar]
  15. Mishra, S.; Ören, E.; Bordin, C.; Wen, F.; Palu, I. Features extraction of wind ramp events from a virtual wind park. Energy Rep. 2020, 6, 237–249. [Google Scholar] [CrossRef]
  16. Wen, J.; Liu, J.C.; Wen, Z.N.; Li, J.H.; Li, C.X. Capacity Allocation Method for Wind-Solar-Hydro-Storage Complementary System Considering Time and Spatial Transfer Characteristics of Load. Electr. Power 2021, 54, 66–77. [Google Scholar]
  17. Shao, Z.F.; Zhang, D.Q. Capacity Configuration Optimization of Multi-energy Complementary Power System Based on Contract Load Curve. Power Syst. Technol. 2021, 45, 1757–1767. [Google Scholar]
  18. Ding, M.; Wu, J.; Zhang, J.J. Capacity Optimization Method of Hybrid Energy Storage System for Wind Power Smoothing. Acta Energiaesolaris Sin. 2019, 40, 593–599. [Google Scholar]
  19. Cao, C.; Ma, Y.; Chang, Y.; Guan, R.F. Capacity Allocation Method of Hybrid Energy Storage System Based on Empirical Mode Decomposition and Fuzzy Chance Constrained Programming. Distrib. Energy 2016, 1, 43–48. [Google Scholar]
  20. Li, J.H.; Gao, T.Y.; Zhao, B.; Yan, G.G.; Jiao, J. Inhibition of wind power fluctuations of battery energy storage system adaptive control strategy design. Energy Storage Sci. Technol. 2015, 4, 278–283. [Google Scholar]
  21. Makarov, Y.V.; Du, P.; Kintner-Meyer, M.C.W.; Jin, C.; Illian, H.F. Sizing Energy Storage to Accommodate High Penetration of Variable Energy Resources. IEEE Trans. Sustain. Energy 2012, 3, 34–40. [Google Scholar] [CrossRef]
  22. Jia, Y.B.; Zheng, J.; Chen, H.; Yan, Z.; Wang, J.H. Capacity Allocation Optimization of Energy Storage in Thermal-Storage Frequency Regulation Dispatch System Based on EEMD. Power Syst. Technol. 2018, 42, 2930–2937. [Google Scholar]
  23. Ren, K.; Jiang, W.; Yang, B.; Sang, B.Y.; Liu, Z.; Li, P.P. Optimal frequency division and capacity determination technology of hybrid energy storage system for suppressing intermittent load. Electr. Power Autom. Equip. 2021, 41, 81–87. [Google Scholar]
  24. Han, X.Y.; Ding, L.J.; Chen, G.; Liu, J.Y.; Lin, J. Key Technologies and Research Prospects for Cascaded Hydro Photovoltaic-Pumped Storage Hybrid Power Generation System. Trans. China Electrotech. Soc. 2020, 35, 2711–2722. [Google Scholar]
  25. Shao, C.; Li, Z.; Wu, H.; Yuan, Y.; Yang, Q. Energy management strategy of standalone hydro-photovoltaic-storage microgrid. In Proceedings of the 2021 International Conference on Power System Technology: Carbon Neutrality and New Type of Power System (POWERCON), Haikou, China, 8–9 December 2021; pp. 1136–1141. [Google Scholar]
  26. Braun-Cruz, C.C.; Tritico, H.M.; Beregula, R.L.; Girard, P.; Zeilhofer, P.; Ribeiro, L.d.S.; Fantin-Cruz, I. Evaluation of Hydrological Alterations at the Sub-Daily Scale Caused by a Small Hydroelectric Facility. Water 2021, 13, 206. [Google Scholar] [CrossRef]
  27. Zhu, Y.; Chen, S.; Ma, G.; Huang, W.; Han, X.; Ding, L. Regulation capability of small cascade hydropower stations for photovoltaic generation. J. Renew. Sustain. Energy 2020, 12, 053501. [Google Scholar] [CrossRef]
  28. Zhang, J.T.; Cheng, C.T.; Yu, S.; Shen, J.J.; Wu, X.Y.; Su, H.Y. Preliminary feasibility analysis for remaking the function of cascade hydropower stations to enhance hydropower flexibility: A case study in China. Energy 2022, 260, 123156. [Google Scholar] [CrossRef]
  29. Chen, H.Y.; Chen, T.F.; Qin, X.Y.; Lu, K.P. The Dynamic Characteristics of Pumped-Storage Power Station Underground Powerhouse Structure Research in GPSPS. Hydropower Pumped Storage 2017, 3, 28–31+44. [Google Scholar]
  30. Guo, A.; Chang, J.X.; Wang, Y.M.; Wang, X.B.; Sun, X.Q. Research on Capacity Computation of Cascade On-Stream Integral Pumped Storage Hydropower Plants I: Short-Term Peak Shaving and Gain of Cascade Development. J. Hydraul. Eng. 2024, 55, 768–779. [Google Scholar]
  31. Zhang, Z.P.; Zhao, W.Q.; Liu, J.; Wang, Z.W. Discussion on the Construction of Joint O-peration Pumped Storage Pump/Power Station in Cascade Hydropower Stations. Large Electr. Mach. Hydraul. Turbine 2023, 2, 57–64. [Google Scholar]
  32. Nasir, J.; Javed, A.; Ali, M.; Ullah, K.; Kazmi, S.A.A. Capacity optimization of pumped storage hydropower and its impact on an integrated conventional hydropower plant operation. Appl. Energy 2022, 323, 119561. [Google Scholar] [CrossRef]
  33. Xie, L.R.; Zheng, H.; Wei, C.W.; Hu, S.Y. Coordinated Control Strategy of Photovoltaic Hybrid Energy Storage Considering Prediction-Error Compensation and Fluctuation Suppression. Autom. Electr. Power Syst. 2021, 45, 130–138. [Google Scholar]
  34. Zhang, Q.; Ma, Y.; Li, G.L.; Ma, J.H.; Ding, J.J. Applications of Frequency Domain Decomposition and Deep Learning Algorithms in Short-term Load and Photovoltaic Power Forecasting. Proc. CSEE 2019, 39, 2221–2230. [Google Scholar]
  35. Li, B.; Li, X.C.; Bai, X.Q.; Li, W.M. A Research on the IL Control Strategy of Distribution Network in Electricity Market. Proc. CSEE 2018, 38, 6573–6582. [Google Scholar]
Figure 1. System structure diagram.
Applsci 15 06989 g001
Figure 2. Capacity configuration flow chart of cascade small hydropower-pumped storage–wind–PV complementary system.
Applsci 15 06989 g002
Figure 3. Cascade small hydro topological structure.
Applsci 15 06989 g003
Figure 4. Measured and expected power of wind–PV.
Applsci 15 06989 g004
Figure 5. Control power of wind–PV.
Applsci 15 06989 g005
Figure 6. Spectrum of control power.
Applsci 15 06989 g006
Figure 7. Output for systems with pumped storage.
Applsci 15 06989 g007
Figure 8. Output for systems without pumped storage.
Applsci 15 06989 g008
Table 1. Hydroelectric power station regulation capacity calculation table.
Water RegimenUtilization Hours (h)Minimum/Maximum Technical Output (MW)
Wet periodaA P f , min / P f , max
Low water periodbA P k , min / P k , max
Table 2. Table of reservoir capacity parameters for each hydropower station.
NumberVbegin
/(104 m3)
Vend
/(104 m3)
Vc min
/(104 m3)
Vc max
/(104 m3)
qmin
/(m3/s)
qmax
/(m3/s)
14040016016
27070036020
31501500116030
4145014500119050
5500500074087.8
6150015000844056.2
7323203067.6
8425425020084.8
92652650111077.6
106400640001140119.7
Table 3. Table of maximum regulation capacity of each hydroelectric power station.
NumberUtilization Hours (h)Minimum Technical Output
(MW)
Maximum Capacity
(MW)
Maximum Regulation Capacity
(MW)
Wet PeriodLow Water PeriodWet PeriodLow Water Period
12464.71056.31.120.161.60.416
22293.2982.81.120.161.60.416
32634.81129.21.120.161.60.416
42490.61067.42.80.441.040
53154.21351.85.040.727.21.872
63318.71422.311.20.8163.200
73733.81600.24.20.961.920
8403917315.60.882.080
92924.61253.45.040.727.21.872
103098.91328.17.8750.7511.252.475
Total regulation capacity (MW)15.7
Table 4. Incoming water flow each hydropower station.
TimeI1 (m3/s)I2 (m3/s)I3 (m3/s)I4 (m3/s)I5 (m3/s)I6 (m3/s)I7 (m3/s)I8 (m3/s)I9 (m3/s)I10 (m3/s)
14.264.329.760.004.260.0020.0424.500.000.00
24.774.869.760.004.770.0014.2027.810.000.00
33.524.889.880.003.520.0016.2128.800.000.00
45.272.805.600.005.270.0012.9316.000.000.00
56.153.857.600.006.150.009.9820.680.000.00
65.493.947.000.005.490.0013.2324.290.000.00
74.394.637.000.004.390.009.9818.310.000.00
84.254.067.000.004.250.008.6424.180.000.00
94.253.467.000.004.250.006.2922.690.000.00
104.653.947.000.004.650.0013.3720.570.000.00
113.853.597.000.003.850.0011.6623.910.000.00
124.704.677.000.004.700.0010.3520.830.000.00
134.603.387.000.004.600.0013.7320.560.000.00
144.703.177.000.004.700.0016.3719.880.000.00
154.394.758.130.004.390.0014.2626.000.000.00
165.272.757.000.005.270.0011.6625.000.000.00
176.152.757.000.006.150.0012.4710.120.000.00
184.393.946.100.004.390.0017.2820.000.000.00
193.523.386.100.003.520.0013.9710.800.000.00
204.702.816.100.004.700.0012.1023.320.000.00
214.393.946.100.004.390.0017.2820.000.000.00
223.523.386.100.003.520.0013.9720.800.000.00
233.853.597.000.003.850.0011.6623.910.000.00
243.524.889.880.003.520.0016.2123.800.000.00
Table 5. Scenario definition.
NameDefinitionVolatility
Cloudy and windyWind power output is the most, and PV output is the least.Relatively strong
Sunny and windyJoint output is the richest.Strongest
Cloudy and less windyJoint output is the most scarceWeakest
Sunny and less windyWind power output is the least, and PV output is the most.Relatively weak
Table 6. Capacity configuration results.
TypeCapacity/MW
The pumped storage unit installed in No. 6 hydropower station16
wind turbines44
PV cells66
Table 7. Comparison of operation results for systems with/without pumped storage.
ScenariosDeviation Power (MWh)Surplus Water (104 m3)
With Pumped StorageWithout Pumped StorageWith Pumped StorageWithout Pumped Storage
Cloudy and windy067.510626.4
Sunny and windy067.510767.8
Cloudy and less windy044.880709
Sunny and less windy040.580928.4
Table 8. Grid time-sharing tariffs.
Peak LoadFlat LoadValley Load
Periods10:00~15:00
18:00~21:00
7:00~10:00
15:00~18:00
21:00~23:00
23:00~7:00
Tariffs (CNY/kWh) *0.650.380.13
* All economic indicators in this study are reported in Chinese yuan (CNY) to align with the electricity price data and pricing policy framework investigated in China.
Table 9. Power generation benefits under different weather scenarios.
Scenarios Pumped-Storage Retrofitted System
(CNY 10,000)
Non-Retrofitted System
(CNY 10,000)
Increase in Revenue
(CNY 10,000)
Percentage Increase in Power Generation Benefits
Cloudy and windy54.7851.573.216.22%
Sunny and windy58.8155.633.185.71%
Cloudy and less windy59.7456.593.155.57%
Sunny and less windy66.6063.353.255.13%
Table 10. Initial construction cost.
CostsQuantityCapacity
(MW)
Unit Cost
(CNY 10,000)
Total Cost
(CNY 10,000)
Pumped storage retrofitting cost116160160
Operation and maintenance cost\\880
Table 11. Annual power and environmental benefits.
ScenariosPower Generation
(MWh)
Benefits
(CNY 10,000)
Increase in Revenue
(CNY 10,000)
Carbon Emission Reduction
(tons)
Cloudy and windy1284.7454.783.21750
Sunny and windy1348.4058.813.18780
Cloudy and less windy1290.6259.743.15750
Sunny and less windy1385.9566.603.25810
Total annual5309.7121,893.61167.09281,500
Table 12. Overall economic benefits.
TypePrice
(CNY 10,000)
Initial construction cost240
Total life-cycle cost213.68
Power generation benefit21,893.6
Total increase in revenue11,670.9
Disclaimer/Publisher’s Note: The statements, opinions and data contained in all publications are solely those of the individual author(s) and contributor(s) and not of MDPI and/or the editor(s). MDPI and/or the editor(s) disclaim responsibility for any injury to people or property resulting from any ideas, methods, instructions or products referred to in the content.

