Abstract
Compared to traditional temperature measurement methods, ultrasonic temperature measurement technology based on the principle of resonance offers advantages such as shorter section lengths, higher signal amplitude, and reduced signal attenuation. First, the type of sensor-sensitive element was determined, with a resonant design chosen to improve measurement performance; using magnetostrictive and resonant temperature measurement principles, the length, diameter, and resonator dimensions of the waveguide rod were designed, and a molybdenum–rhenium alloy (Mo-5%Re) material suitable for high-temperature environments was selected; COMSOL finite element simulation was used to simulate the propagation characteristics of acoustic signals in the waveguide rod, observing the distribution of sound pressure and energy attenuation, verifying the applicability of the model in high-temperature testing environments. Second, a resonant temperature sensor consistent with the simulation parameters was prepared using a molybdenum–rhenium alloy waveguide rod, and an ultrasonic resonant temperature-sensing system suitable for high-temperature environments up to 1800 °C was constructed using the molybdenum–rhenium alloy waveguide rod. The experiment used a tungsten–rhenium calibration furnace to perform static calibration of the sensor. The temperature range was set from room temperature to 1800 °C, with the temperature increased by 100 °C at a time, and it was maintained at each temperature point for 5 to 10 min to ensure thermal stability. This was conducted to verify the performance of the sensor and obtain the functional relationship between temperature and resonance frequency. Experimental results show that during the heating process, the average resonance frequency of the sensor decreased from 341.8 kHz to 310.37 kHz, with an average sensitivity of 17.66 Hz/°C. During the cooling process, the frequency increased from 309 kHz to 341.8 kHz, with an average sensitivity of 18.43 Hz/°C. After cooling to room temperature, the sensor’s resonant frequency returned to its initial value of 341.8 kHz, demonstrating excellent repeatability and thermal stability. This provides a reliable technical foundation for its application in actual high-temperature environments.
1. Introduction
There is significant demand for innovative approaches to high-temperature measurement within aerospace [1], liquid metal [2], and metallurgy fields, among others. The precise monitoring of internal temperature fields is critically important in such applications. Traditional thermocouple [3] and radiation [4] temperature measurement methods have limitations in high-temperature, high-pressure, and strong oxidation environments. Tungsten–rhenium thermocouples are easy to oxidatize above 1700 °C, affecting the accuracy of temperature measurement; platinum–rhodium thermocouples are oxidation-resistant, but the price of the material is high; radiation temperature measurement is susceptible to dust, emissivity, and measurement distance, and other factors interfere with the accuracy of the temperature measurement, meaning that it is difficult to meet the testing needs using traditional temperature-measurement methods. The ultrasonic temperature measurement [5,6] has gradually become the focus of attention in the industrial field due to its advantages of good stability in high-temperature environments, oxidation resistance, and a large temperature-measurement range.
Compared to conventional thermocouple and radiation thermometry methods, ultrasonic temperature sensing has increasingly gained attention in the industrial sector due to its superior stability, rapid response, and broad material compatibility, particularly under high-temperature conditions. Thermocouples are vulnerable to oxidation at high temperatures, which reduces measurement accuracy and increases material costs. Although radiation thermometry provides a rapid response, it is mainly suited to surface temperature measurements; its accuracy in assessing internal temperatures is limited, and it is highly susceptible to variations in emissivity [7] and environmental conditions.
Ultrasonic resonance temperature measurement is based on acoustic-wave transmission frequency for measurement, which is characterized by a small size, high resolution, frequency output, and less interference from environmental factors. In recent years, ultrasonic temperature measurement has made significant progress at home and abroad. In 1994, for instance, Sun Chongzheng [8] conducted research on ultrasonic temperature-measurement technology at Tsinghua University, demonstrating that, with a fixed propagation distance, temperature can be measured by observing the propagation time of ultrasonic pulses through a guide rod and molten aluminum using a pulse emission-reception method. The next year, Sun introduced an ultrasonic resonance temperature-measurement method for measuring liquid metal temperatures based on resonance frequencies. However, signal attenuation and undue echo noise posed challenges in terms of accuracy.
In 2019, Zhifeng Tang et al. achieved high sensitivity by optimizing coil designs, using spiral and folding coils to simulate and receive ultrasonic signals, in experiments at Zhejiang University. Combined with numerical simulation and coil-optimization design, the structural parameters of the transducer [9,10] were determined and the transducer was prepared with a thickness measurement error of less than 0.1 mm. In 2024, Mason John [11] and his team from the University of Utah developed a three-section nickel-chromium 625 cylindrical waveguide for placement in the combustion zone of a boiler. They successfully measured internal temperature distributions in real time by continuously collecting acoustic data and analyzing echo characteristics, effectively addressing the temperature-monitoring challenges of equipment operating in extreme environments over extended periods.
By integrating the magnetostrictive effect with a resonant sensor, the resonant sensing element can be coupled with the magnetostrictive transducer to design an optimized ultrasonic-guided-wave resonant temperature sensor. A high-voltage pulse signal excites the longitudinal mode [12] of the ultrasonic-guided wave, causing a sound wave to propagate within the sensor. The resonator’s frequency [13] is influenced by both material properties and environmental parameters, causing its natural frequency to vary with temperature. Temperature can be inferred by monitoring these frequency variations, enabling ultrasonic resonance-based temperature measurement in extreme environments. Ultrasonic measurement technology offers distinct advantages over traditional techniques for high-temperature applications, facilitating its widespread industrial application. To clearly illustrate the design process of the ultrasonic resonant temperature sensor adopted in this study, a schematic diagram of the system is presented, as shown in Figure 1. This diagram encompasses key steps including structural design, finite element-simulation analysis, device fabrication, and experimental testing, systematically reflecting the entire research and development process.
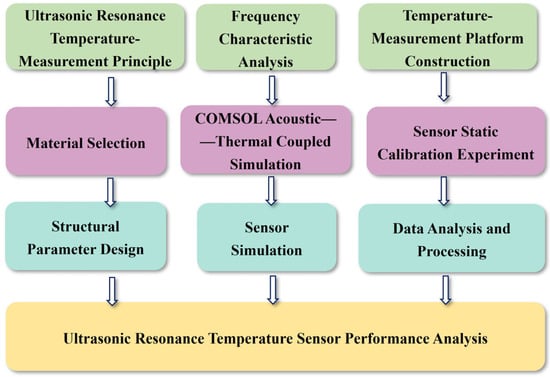
Figure 1.
Schematic diagram of ultrasonic resonant temperature-sensing system design.
2. Materials and Methods
2.1. IUltrasonic Guided Wave Resonance Measurement Principle
When an ultrasonic wave is excited by a magnetostrictive [14] transducer and propagates along a waveguide rod to a resonant region, phenomena such as reflection, superposition, and attenuation occur, forming an ultrasonic resonance echo signal. The signal comprises two components: a reflected wave and an attenuated wave. When the excitation signal frequency aligns with the natural frequency of the resonator, a zero-crossing [15] appears in the echo signal, indicating that the resonator has entered a resonant state and thus is initiating resonance. When the incidence is complete, the energy stored in the resonator is reflected back through the waveguide rod at the intrinsic frequency of the resonator with the energy attenuation [16] equation shown below:
where A0 represents the initial amplitude of the attenuated echo; An is the amplitude at the n-th cycle; and Q is the quality factor of the resonator.
When ultrasonic waves propagate in a waveguide rod, the change in temperature is actually detected by measuring the resonant frequency. The resonator, as the main temperature-sensitive component, is made of materials whose acoustic properties (e.g., speed of sound and modulus of elasticity) change with temperature, which in turn leads to a change in resonant frequency. These principles of ultrasonic guided wave resonance are illustrated in Figure 2.
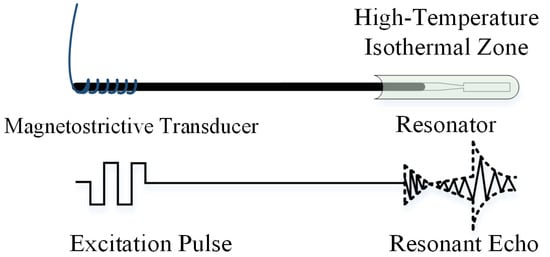
Figure 2.
Schematic diagram of resonance.
The relationship between the natural frequency of the resonator and sound velocity can be expressed as follows.
where f represents the natural frequency of the resonator; m is the mode order of the resonator; L is the length of the resonator; and C indicates the propagation velocity of sound waves in solid material.
When the length and mode of the resonator are constant, the natural frequency is directly related to the velocity at which sound waves travel through the material. There is a distinct functional relationship between the propagation speed of sound waves in a solid medium and the temperature of said medium.
where E denotes Young’s modulus; ρ represents the density of the solid medium; and T is the ambient temperature. As the measured ambient temperature increases, the Young’s modulus of the waveguide material decreases, while the density experiences a slight reduction, leading to a change in sound velocity.
Combining the above two equations, it can be seen that the change of ambient temperature causes the change of the Young’s modulus and density of the material, which directly affects the propagation speed of the sound wave in the material, and further affects the intrinsic frequency of the resonator. Therefore, by determining the variation rule of resonance frequency at different temperatures, the operating temperature of the measured environment can be deduced. In order to ensure the reliability of the experimental data and the accuracy of the temperature measurement, and to reduce the testing error, it is necessary to carry out repetitive tests under the same experimental conditions, to obtain the variation curve of the resonance frequency with the ambient temperature at different temperatures.
2.2. Material Selection and Parameter Design
The performance of resonant ultrasonic temperature sensors for temperature testing in high-temperature environments depends mainly on the physical properties of the selected waveguide material, including a high melting point, low coefficient of thermal expansion, good acoustic properties, and temperature sensitivity. The physical properties of common waveguide materials are shown in the following Table 1. When sound waves propagate through waveguide materials [17], the energy of their resonant echoes [18] is influenced by the properties of the sensitive materials. This underscores the importance of selecting appropriate materials to ensure the stability and reliability of sensors under extreme conditions.

Table 1.
Physical properties of waveguide materials.
Compared to single crystal waveguide materials such as sapphire [19] and spinel [20,21], metals and their alloys have good ductility and significant advantages in resonator processing, so metal alloys are usually chosen as waveguide materials. As a refractory metal, molybdenum has a melting point of about 2620 °C. However, pure molybdenum is susceptible to oxidation when exposed to high temperatures for a long period of time. To enhance its oxidation resistance, adding 5% rhenium to molybdenum effectively improves its mechanical properties and significantly enhances its stability in high-temperature environments. In addition, the molybdenum–rhenium alloy has good acoustic properties, and the acoustic-wave propagation process can effectively transmit ultrasonic signals [22]. Therefore, the molybdenum–rhenium alloy material was used to prepare ultrasonic temperature sensors. In order to ensure the accurate transmission of the signal, the end of the sensor away from the temperature field will be coupled with the magnetostrictive transducer when constructing the temperature-measurement system.
Ultrasonic resonant temperature sensors reflect temperature changes through changes in the resonant frequency produced by the propagation of sound waves. They use echo signals crossing the zero point to determine the resonant state, thereby converting temperature measurements into frequency measurements. The characteristics of the ultrasonic guided wave are influenced by the dimensions of the sensor. Therefore, in designing the sensor, it is essential to select appropriate dimensions—including length, diameter and resonator size—to minimize the impact of size on the ultrasonic guided wave and to enhance the accuracy of the temperature measurements.
- (1)
- Length of waveguide rod
Energy is lost from sound waves as they propagate, including the attenuation of acoustic pressure [23] and intensity. These attenuation rates can be expressed as follows:
where α represents the attenuation coefficient; P0 and I0 are the initial sound pressure and intensity, respectively; and P and I, respectively, denote the sound pressure and intensity at position x. Considering these attenuations, the length of the waveguide rods is appropriately controlled to avoid an increase in loss as the acoustic wave propagates through the rods. If the waveguide rod is too short, the transducer may be affected by external magnetic fields in high-temperature environments, compromising the stability of sound-wave transmission;
- (2)
- Diameter size
Changes in the waveguide rod’s diameter and frequency-impact sound-wave propagation, led to variations in group velocity (Cg) and phase velocity (Cp) as well as frequency dispersion [24]. The relationship between phase velocity and group velocity can be expressed by the following function:
where d2 represents the diameter of the waveguide rod and f denotes the guided wave frequency.
In the ultrasonic resonance temperature-measurement study, in order to deeply investigate the acoustic-wave-propagation characteristics of the molybdenum–rhenium alloy waveguide rods, the Pcdisp module in the MATLAB 2014 program for guided wave analysis written by F. Seco and A.R. Jiménz [25] was used to simulate the signal transmission, based on the physical properties listed in Table 1 and the input of the molybdenum–rhenium alloy material properties, including those such as Young’s modulus, Poisson’s ratio, density and so on, and also to set different diameters, frequency ranges, and modal selection. At the same time, the different diameters of the waveguide rods, frequency range, and mode selection were set. In view of the propagation of acoustic waves in the metal and its alloy, the degree of attenuation is mainly related to the frequency. In the low-frequency band below 1000 kHz, the acoustic-wave transmission distance is relatively far and the signal attenuation is small, which is conducive to obtaining stable test signals. The lower frequency of the waveguide size of the change in the sensitivity of the waveguide size is relatively low, effectively reducing the error due to the size of the waveguide;
- (3)
- Resonator size
In the design of resonant ultrasonic temperature sensors, the waveguide rod and the sensitive area section are integrated structures, which makes the relationship between the resonant frequency and the temperature different when the acoustic wave is transmitted to the sensitive elements with different structural parameters. In order to achieve optimized design and efficient processing, a half-wavelength resonator consisting of a combination of cones and cylinders was chosen in this study, and its structure is shown in Figure 3.
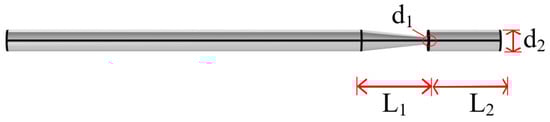
Figure 3.
Structure of the sensitive area.
The conical structure concentrates the ultrasonic signal, thereby effectively transferring the sound wave’s energy to the cylinder. According to Formula (1), when the frequency f is set to 140 kHz, the wavelength is 38 mm, the cone length L1 = λ/4, and the resonator length L2 = λ/2 to ensure that the resonator is effectively coupled to the waveguide rod and transmits sound waves properly.
In resonant ultrasonic temperature measurement, the quality factor Q [26] of the resonator is the key parameter, which is expressed as follows:
where ω is the energy stored in the echo, and Δω is the energy lost per cycle of the echo. Qc is the energy-loss coefficient, which indicates that in the m-th order mode, the energy loss of the resonator is determined solely by the Q factor. r is the impedance ratio between the cone and the resonator; ρ1 and ρ2 are the densities of the cone and the resonator, respectively; C1 and C2 are the propagation speeds of sound waves in the cone and resonator, respectively; and A1 and A2 are the cross-sectional areas of the cone and the resonator, respectively:
As the resonator is made of the same material as the waveguide rod, and both have the same density and acoustic wave-propagation speed, the diameter of the resonator’s conical end face (d1) can be determined based on the above Formulas (7) to (11), and these parameters can be used to realize the energy-focusing and temperature measurement and to improve the sensitivity and accuracy of the temperature-measurement system.
2.3. System Construction
The practical application of the proposed resonant sensor under ultra-high temperature conditions was investigated in the virtual environment of COMSOL finite element simulation [27] software to explore the impact of the resonator’s dimensions on the sensor’s performance. A 3D model was first constructed in SolidWorks and was then imported into COMSOL for further analysis. The molybdenum–rhenium alloy rod in the model was configured with a diameter of 2 mm. The resonator structure shown in Figure 3 was positioned 19 mm from the end of the waveguide to effectively observe the propagation of sound waves.
The ultrasonic resonant temperature-sensing system consists of a molybdenum–rhenium alloy waveguide rod, a magnetostrictive transducer, an oscilloscope, a resonator (serving as the sensitive element), a frequency meter, a tungsten–rhenium calibration furnace, and a pulse transceiver circuit. The schematic diagram of the constructed temperature measurement experimental system is shown in Figure 4. The machined ultrasonic resonator coupled with the magnetostrictive transducer was placed in the constant temperature area of the calibration furnace, and the temperature measurement system was adjusted by an oscilloscope and a frequency meter so that the acoustic wave transmitted inside it could generate resonance. The magnetostrictive transducer transmitted the acoustic signal and collected the ultrasonic resonance echo signal to record the resonance frequency at room temperature.
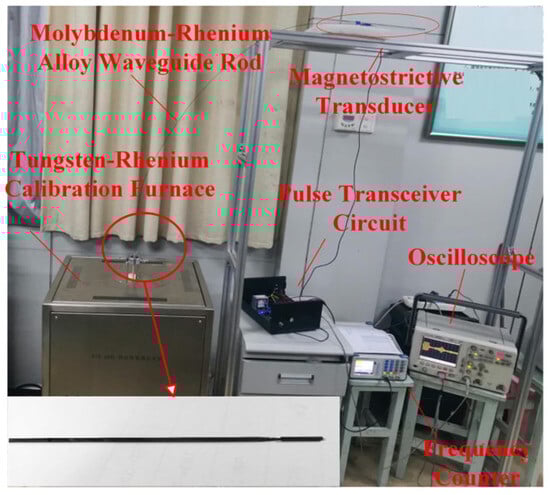
Figure 4.
Schematic diagram of ultrasonic resonant temperature-sensing system.
3. Results
3.1. Analysis of Group Velocity Dispersion Characteristics
Based on the above analysis, the group velocity dispersion curves [28] in the frequency range of (10–1000) kHz were plotted for waveguide rods with diameters of (1–5) mm, respectively, and the results are shown in Figure 5. The results are shown in Figure 2, which displays the three main guided wave modes investigated in this study: longitudinal (L), torsional (T), and flexural (F) modes. After comparative analysis, at the same frequency, the increase in the waveguide diameter makes the dispersion phenomenon more and more obvious.
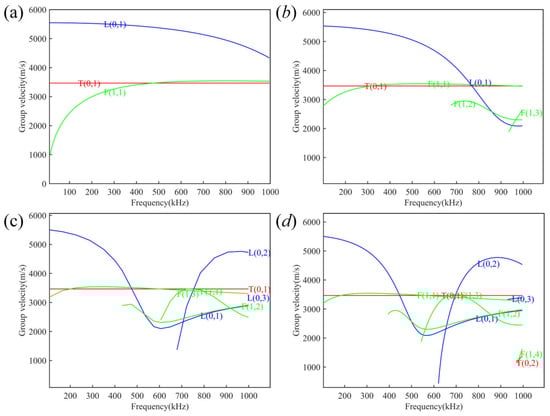
Figure 5.
Group velocity dispersion curves for diameters at (a) 1 mm; (b) 2 mm; (c) 3 mm; (d) 4 mm.
By observing the dispersion curves, it can be seen that the group velocity of the acoustic wave changes significantly with frequency when it propagates inside the waveguide rod. In the frequency range of (0–400) kHz, the propagation speed of the L (0,1) mode is significantly higher than that of the other modes, which enables the acoustic wave to reach the signal receiving end quickly, and which has an obvious advantage in signal-transmission efficiency. However, with the increase in frequency, the propagation speed shows a decreasing trend, while the dispersion phenomenon is obvious. The experimental results show that when the diameter of the waveguide rod is less than 3 mm and the frequency is lower than 400 kHz, the waveguide size and frequency effectively inhibit the interference between multimodal propagation [29] and reduce the effect of dispersion on the acoustic-wave propagation. Based on the analysis of the dispersion characteristics and experimental verification, an ultrasonic transducer with a frequency of 140 kHz was selected to excite the L (0,1) mode, and a waveguide rod with a diameter of 2 mm was used to investigate the acoustic-wave-propagation characteristics.
3.2. Simulation Experiment
The propagation process of ultrasonic waves in the waveguide rod over time was simulated by simulating the 3D model several times to ensure its normal operation. In order to more accurately simulate the propagation characteristics of the acoustic wave in the temperature field and in terms of the thermal effect it produces, the three modules of pressure acoustics, solid mechanics, and solid heat transfer were selected, and the boundary conditions and material properties were set, as shown in Table 1, so as to realize the multi-physics field coupling and solve the partial differential equations. In the solution process, in order to improve the simulation effect, the acoustic pressure was applied at the excitation end of the waveguide rod to simulate the generation of ultrasonic signals, and the functional relationship is shown in Equation (12); the waveform of its excitation function is shown in Figure 6.
where u(t) and Ts are the unit step function and signal duration, respectively. u(t) − u(t − Ts) represents a rectangular pulse signal.
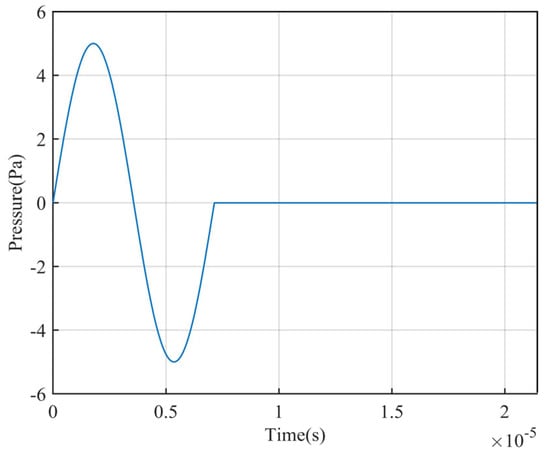
Figure 6.
Waveform of excitation function.
The simulation study of COMSOL-based thermometry model requires meshing, and the accuracy of its simulation results mainly depends on the mesh density or excitation frequency of the model. Therefore, the grid density of the resonance region was set to be less than 1/8 of the excitation wavelength. When the frequency was set to 140 kHz, the length of the resonator was 19 mm, and in respect of when the relevant physical properties of the molybdenum–rhenium alloy material were input, the sound-pressure distribution of the sound wave propagating in the resonator obtained from the simulation is shown in Figure 5 below. The results show that when the sound wave propagates to the resonator region, part of the wave is reflected and the other part continues to propagate forward along the waveguide rod. The interference between the reflected wave and the forward propagating wave results in a stable sound-pressure distribution in the resonator, which leads to the resonance phenomenon. As the sound wave propagates into the resonance region, the sound pressure value increases significantly (Figure 7a). Part of the wave is reflected (Figure 7b), and the sound pressure energy is attenuated during the propagation process. When the sound wave interacts with the resonance region, the reflection and attenuation phenomena become obvious. During the simulation, the acoustic wave propagation of the molybdenum–rhenium waveguide rod is affected by the material parameters, pressure acoustics, boundary conditions, and other factors.
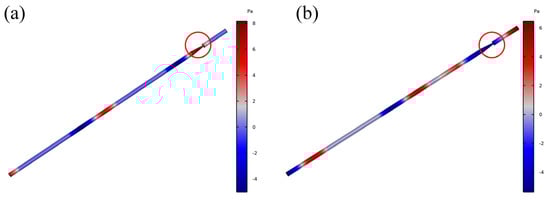
Figure 7.
Acoustic pressure propagation in the resonator: (a) 342 kHz, (b) 309 kHz.
The temperature-measurement system tests reveal a well-defined zero-crossing point in the resonant echo waveform, demonstrating that the simulation model faithfully reproduces the sensor’s operational performance under real working conditions. By comparing and analyzing this with the experimental data, the rationality of the design was verified, and the design parameters of the sensor were finally determined.
3.3. Calibration Experiment
After completing the construction of the temperature measurement system, the ultrasonic resonant temperature sensor with the same parameters as the simulation model was prepared, and its design parameters are shown in Table 2 below. In order to verify the performance, the assembled sensor was placed in the calibration furnace for static calibration experiments [30]. Before the calibration experiment, the temperature range of the calibration furnace was set from room temperature to 1800 °C, and the temperature was kept for 5–10 min after every 100 °C rise to make sure that the temperature field in the furnace was uniform, that the sensor maintained a stable working state, and that the temperature–frequency relationship curve of the sensor was obtained.
Table 2.
Ultrasonic resonant temperature-sensor design parameters.
During the process of temperature increase/decrease, the intrinsic frequency of the resonator changes according to the temperature change. The resonance phenomenon in the echo waveform was observed by adjusting the frequency meter, and data acquisition was performed. The resonance waveforms at different temperatures are shown in Figure 8. The resonance waveform amplitude gradually decreases with the increase in temperature, and there is a cross-zero phenomenon.
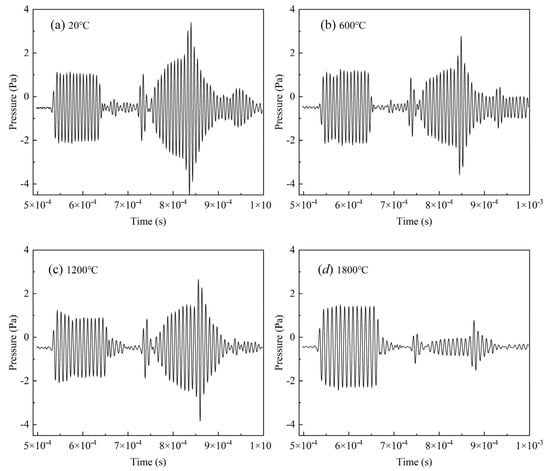
Figure 8.
Resonance waveforms at different temperatures.
The temperature-resonant frequency relationship curves obtained by polynomial fitting during the temperature increase/decrease process are shown in Figure 9 and Figure 10. The experiments show that when the molybdenum–rhenium alloy is used as the sensitive element for temperature measurement, a nonlinear relationship between frequency and temperature is presented. When the temperature changes in the range of room temperature to 1800 °C, the physical properties of the waveguide rods change accordingly, affecting the acoustic-wave-propagation speed. As the temperature increases, the propagation speed of sound waves in the medium gradually slows down, resulting in a lower resonator frequency. The average resonance frequency at room temperature is 341.8 kHz when warming up, while it decreases to 310.37 kHz at 1800 °C; the average resonance frequency at 1800 °C is 309 kHz when cooling down. Based on the relationship between the change of the resonance frequency and the change of the temperature, the average sensitivities are calculated to be 17.66 Hz/°C and 18.43 Hz/°C, respectively.
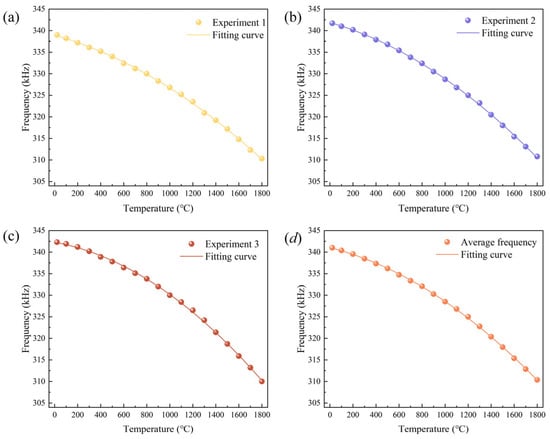
Figure 9.
Temperature–frequency curve during temperature rise.
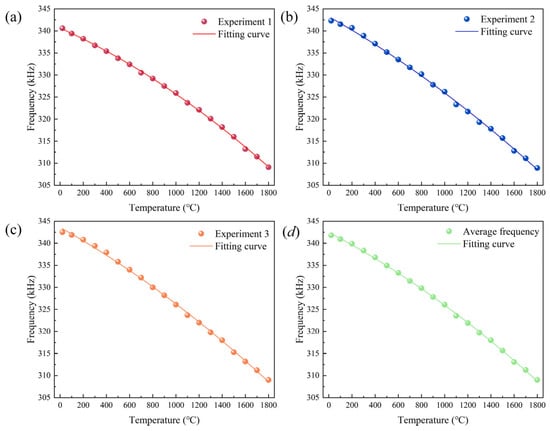
Figure 10.
Temperature–frequency curve during cooling.
By analyzing the frequency dispersion curves in Figure 5, it can be seen that in the frequency range of (300–400) kHz, the propagation velocity of acoustic waves in the waveguide changes due to the physical properties of the material, which exhibits an obvious dispersion effect and affects the frequency change. Further combined with the experimental results in Figure 9 and Figure 10, it can be seen that under different temperature conditions, the change of propagation velocity within the waveguide also varies with temperature, which affects the operating frequency of the resonator, resulting in a slightly smaller value of the resonant frequency at each temperature in the practical test.
Based on the resonance frequencies corresponding to different temperatures, a polynomial fitting was used to establish the functional relationship between the average resonance frequency of the resonator during a temperature rise and fall and the measured ambient temperature as follows:
where fw and fc are the resonant frequencies corresponding to the warming and cooling processes, respectively, and T is the measured medium temperature. By comparing the coefficients of the functional equation for the warming and cooling process, it was found that the frequency change trend is similar, but the influence of the material high temperature thermal effect leads to the difference between the two coefficients. For example, the maximum difference of resonant frequency in the warming/cooling process at 1100 °C is up to 3.23 kHz. The measured results in the experiment and the results of the standard sensor were analyzed, and the measurement error was 0.9%.
In Table 3, the resonant ultrasonic temperature sensor and the zonal ultrasonic temperature sensor are compared. Compared with the latter, the resonant ultrasonic temperature sensor has higher stability and sensitivity, stable physical properties, small long-term drift, and is suitable for continuous monitoring, but the resonant ultrasonic temperature sensor is a little more difficult to prepare than the zonal type. The difficulty of signal processing is average for both types of temperature sensors [31].
Table 3.
The comparison of ultrasonic temperature sensors.
In summary, the molybdenum–rhenium alloy temperature sensor designed based on the principle of ultrasonic resonance temperature measurement shows good stability and reliability in static test experiments. By analyzing the relationship curve of frequency versus temperature, it can be found that as the temperature rises, the Young’s modulus, density, and other parameters of the material change, leading to a reduction in the speed of sound-wave propagation and the resonance frequency gradually decreasing. From the experimental data, it can be seen that the resonance frequency in the low-temperature section fluctuates a lot in the warming experiment, and there is a certain deviation; while in the cooling experiment, the three fitting curves are highly overlapped, which indicates that the sensor has good repeatability and curve fitting in the calibration process.
After completing the static calibration experiment, in order to verify the temperature-measurement accuracy and stability of the ultrasonic resonant temperature sensor in different high-temperature environments, the sensor was placed in another high-temperature furnace for contrast testing, and the test results are shown in Figure 11. The average resonance frequency measured in the calibration experiment is 309.68 kHz, while the frequency measured in the contrast experiment is 305.3 kHz. The difference in resonance frequency at the same temperature point is (3.28–5.08) kHz in the temperature range from room temperature to 1800 °C. The reason for this deviation may be that the surface of the sensor material undergoes different degrees of oxidation in different test environments, resulting in different degrees of changes in the physical properties of the material, affecting the accuracy of the resonance frequency test. Despite the error, the sensor still shows good performance in the whole temperature range, which verifies the feasibility of temperature monitoring in high-temperature environments and meets the actual temperature-measurement requirements [32].
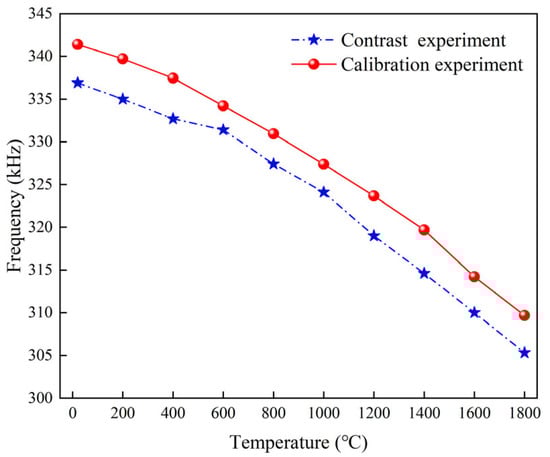
Figure 11.
Test results of different high-temperature environments.
4. Discussion
4.1. Conclusions
In this study, the molybdenum–rhenium alloy material with a high melting point, oxidation resistance, low coefficient of thermal expansion and easy-to-process resonance structure was selected as the research object, and was combined with the principle of ultrasonic temperature measurement. Subsequently, a resonant temperature sensor was designed. Through a combination of simulation and static calibration experiments, the ultrasonic resonant temperature-sensing system was verified, and the design parameters of the resonator in a high-temperature environment were determined. The experimental results show that, in the temperature range from room temperature to 1800 °C, the average resonant frequency at room temperature during the warming process is 341.8 kHz, which decreases to 310.37 kHz when the temperature is increased to 1800 °C; the average resonant frequency at 1800 °C during the cooling process is 309 kHz. Based on the variation relationship between the resonant frequency and the temperature, it was calculated that the average sensitivity is 17.66 Hz/°C and 18.43 Hz/°C, respectively. The frequency trends indicate that the acoustic properties of the materials (e.g., speed of sound and elastic modulus) vary with temperature, leading to significant changes in resonance frequency.
4.2. Future
Despite the errors in multiple warming and cooling tests, the transducer still maintains good repeatability, which can meet the needs of temperature measurement in high-temperature environments. In practical testing, due to factors such as the thermal expansion characteristics of waveguide materials and the temperature dependence of sound velocity, ultrasonic resonant temperature sensors typically exhibit a certain degree of nonlinearity within their temperature-measurement range. The sensitivity of the sensor generally varies with temperature across the full measurement range, meaning it is not constant. However, ultrasonic signal transmission is susceptible to temperature effects in high-temperature testing, resulting in transmission losses [33], and there are errors between the actual processing of the resonator and the design parameters. In the future, it will also be necessary to focus on solving the problem of signal loss generated in long-distance transmission and to optimize the fabrication process of the resonator structure in order to improve the accuracy and stability of the sensor.
Author Contributions
Conceptualization, H.L. and G.W.; Methodology, H.L. and Y.W.; Software, X.Y. and H.X.; Validation, H.L. and X.Y.; Writing—original draft, H.L.; Writing—review & editing, H.L. and X.Y.; Visualization, Y.W.; Supervision, H.L. and H.X.; Project administration, G.W.; Funding acquisition, H.L. All authors have read and agreed to the published version of the manuscript.
Funding
This research was funded by the National Natural Science Foundation of China Granted, grant number 62403440, the Aeronautical Science Foundation of China, grant number 202300340U0002, and the Fundamental Research Program of Shanxi Province, grant number 202203021212185.
Institutional Review Board Statement
Not applicable.
Informed Consent Statement
Not applicable.
Data Availability Statement
The data presented in this study are available upon. Request from the corresponding author.
Conflicts of Interest
The authors declare no conflicts of interest.
References
- Wen, S.; Ma, Y.; Zhou, T.; Sun, Z. Real-time estimation of thermal boundary conditions and internal temperature fields for thermal protection system of aerospace vehicle via temperature sequence. Int. Commun. Heat Mass 2023, 142, 106618. [Google Scholar] [CrossRef]
- Zhang, B.; Wei, Y.-J.; Liu, W.-Y.; Zhang, Y.-J.; Yao, Z.; Zhao, L.-H.; Xiong, J.-J. A liquid level measurement technique outside a sealed metal container based on ultrasonic impedance and echo energy. Sensors 2017, 17, 185. [Google Scholar] [CrossRef] [PubMed]
- Myrick, J.; Keyhani, M.; Frankel, J. Calibration of a plug-type gauge for measurement of surface heat flux and temperature using data from in-depth thermocouples. Exp. Therm. Fluid. Sci. 2019, 104, 302–316. [Google Scholar] [CrossRef]
- Liu, Y.; Zhang, X. Influence of participating media on the radiation thermometry for surface temperature measurement. J. Therm. Sci. 2005, 14, 368–373. [Google Scholar] [CrossRef]
- Wei, Y.; Gao, Y.; Xiao, Z.; Wang, G.; Tian, M.; Liang, H. Ultrasonic Al2O3 ceramic thermometry in high-temperature oxidation environment. Sensors 2016, 16, 1905. [Google Scholar] [CrossRef]
- Wang, T.; Zhang, J.; Yang, L.; Wang, G.; Zhang, N.; Wang, S.; Yin, Y.; Jia, Z.; Tao, X. Antioxidation and High-Resolution Ultrasonic Temperature Sensor Based on Cr3+:MgAl2O4 Single Crystal Fiber. Cryst. Growth Des. 2020, 20, 6763–6768. [Google Scholar] [CrossRef]
- Xin, C.-Y.; Du, X.; Guo, F.-Q.; Shen, S.-L. Radiation thermometry algorithms with emissivity constraint. Spectrosc. Spect. Anal. 2019, 39, 679. [Google Scholar]
- Sun, C.-Z. Ultrasonic Temperature Measurement Technology for Molten Metals. Auto. Instrum. 1994, 05, 37–42. [Google Scholar]
- Zhu, L.; Li, K.; Luo, Y.; Yu, D.; Wang, Z.; Wu, G.; Xie, J.; Tang, Z. Magnetostrictive properties and detection efficiency of TbDyFe/FeCo composite materials for nondestructive testing. J. Rare. Earth 2019, 37, 166–170. [Google Scholar] [CrossRef]
- Zhong, C.H.; Croxford, A.J.; Wilcox, P.D. Investigation of inductively coupled ultrasonic transducer system for NDE. IEEE Trans. Ultrason. Ferroelectr. Freq. Control 2013, 60, 1115–1125. [Google Scholar] [CrossRef]
- John, M.; Walton, K.; Kinder, D.; Dayton, M.A.; Skliar, M. Ultrasonic measurement of temperature distributions in extreme environments: Electrical power plants testing in utility-scale steam generators. Ultrasonics 2024, 138, 107205. [Google Scholar] [CrossRef]
- Manogharan, P.; Rajagopal, P.; Balasubramaniam, K. Longitudinal guided waves confined in radius filler regions of composite joints. J. Acoust. Soc. Am. 2016, 140, 334–343. [Google Scholar] [CrossRef] [PubMed]
- Xu, L.; Fu, X. A micro resonant gas sensor with adjustable natural frequency. IEEE Trans. Ind. Electron. 2020, 68, 5337–5345. [Google Scholar] [CrossRef]
- Qi, Q.; Li, J.; Mu, X.; Tang, Z.; Bao, X.; Zhang, P.; Gao, X.; Ding, Z. Microstructure evolution and magnetic properties of annealed magnetostrictive Fe81Al19 coatings and their ultrasonic guided wave transducing performance. Surf. Coat. Tech. 2019, 367, 19–29. [Google Scholar] [CrossRef]
- Shang, J.; Ma, J.; Zhu, X.; Song, H.; Zhou, P.; Hu, J.; Yuan, Z.; Huang, H.; Zhang, M. Finite element analysis of the zero-crossing temperature of a long Fabry–Perot cavity. Indian J. Phys. 2023, 97, 2523–2529. [Google Scholar] [CrossRef]
- Chen, A.; Yang, Z.; Zhao, X.; Anderson, S.; Zhang, X. Composite Acoustic Metamaterial for Broadband Low-Frequency Acoustic Attenuation. Phys. Rev. Appl. 2023, 20, 014011. [Google Scholar] [CrossRef]
- Foudzi, M.F.; Ihara, I. Development of Polygonal Buffer Rods for Ultrasonic Pulse-Echo Measurements. J. Phys. Conf. Ser. 2014, 520, 012025. [Google Scholar] [CrossRef]
- Álvarez-Arenas, G.T.; Camacho, J. Air-Coupled and Resonant Pulse-Echo Ultrasonic Technique. Sensors 2019, 19, 2221. [Google Scholar] [CrossRef]
- Liang, H.-J.; Wei, Y.-L.; Liu, L.; Xue, H.; Wang, G. Exploring Acoustic-Temperature Response Characteristics of Al2O3 Crystals in High-Temperature Electromagnetic Environments. IEEE Sens. J. 2025, 25, 4211–4217. [Google Scholar] [CrossRef]
- Wang, T.; Wang, H.; Zhang, J.; Lin, N.; Wang, G.; Jia, Z.; Zhao, X.; Tao, X. Design and Directional Growth of (Mg1-xZnx)(Al1-yCry)2O4 Single-Crystal Fibers for High-Sensitivity and High-Temperature Sensing Based on Lattice Doping Engineering and Acoustic Anisotropy. Adv. Funct. Mater. 2021, 31, 2103224. [Google Scholar] [CrossRef]
- Wang, T.; Zhang, J.; Yang, L.; Wang, G.; Wang, H.; Zhang, N.; Wang, S.; Yin, Y.; Jia, Z.; Tao, X. Fabrication and sensitivity optimization of garnet crystal-fiber ultrasonic temperature sensor. J. Mater. Chem. C 2020, 8, 3830–3837. [Google Scholar] [CrossRef]
- Yang, W.; Ye, J.; Bi, P.; Huang, B.; Chen, L.; Yi, Y. Mechanical properties of Mo-Re alloy based on first-principles and machine learning potential function. Mater. Today Commun. 2024, 38, 107796. [Google Scholar] [CrossRef]
- Chen, H.-X.; Lin, S.-Y. Nonlinear propagation and anomalous absorption of ultrasound in liquid. Acta. Phys. Sin. 2020, 69, 134301. [Google Scholar] [CrossRef]
- Chen, H.P.; Zhang, G.; Hu, W.; Nie, B.; Zhou, H.; Luo, W.; Li, H. Nondestructive determination of longitudinal rail stress from guided wave dispersion properties. Constr. Build. Mater. 2023, 408, 133618. [Google Scholar] [CrossRef]
- Seco, F.; Jimenez, R.A. Modal Analysis of the Piezoelectric Generation of Ultrasonic Guided Waves for Nondestructive Testing of Cylindrical Structures. Russ. J. Nondestruct. Test. 2007, 43, 683–691. [Google Scholar] [CrossRef]
- Miller, J.M.L.; Ansari, A.; Heinz, D.B.; Chen, Y.; Flader, I.B.; Shin, D.D.; Villanueva, L.G.; Kenny, T.W. Effective quality factor tuning mechanisms in micromechanical resonators. Appl. Phys. Rev. 2018, 5, 041307. [Google Scholar] [CrossRef]
- Guo, Z.; Yu, Z.; Wei, S.; Qi, G.; Li, Y.; Luan, Y. Three-dimensional finite element analysis for temperature filed of composite materials during the cure. Multidiscip. Model. Mater. Struct. 2022, 18, 43–53. [Google Scholar] [CrossRef]
- Veit, G.; Belanger, P. An ultrasonic guided wave excitation method at constant phase velocity using ultrasonic phased array probes. Ultrasonics 2020, 102, 106039. [Google Scholar] [CrossRef]
- Yang, X.; Wang, C.; Sun, A.; Ju, B.F. Multi-mode ultrasonic waves focusing in a variable focus technique for simultaneous sound-velocity and thickness measurement. Appl. Acoust. 2020, 159, 107090. [Google Scholar] [CrossRef]
- Li, Y.; Zhang, Z.; Hao, X.; Yin, W. A measurement system for time constant of thermocouple sensor based on high temperature furnace. Appl. Sci. 2018, 8, 2585. [Google Scholar] [CrossRef]
- Wang, G.; Liang, H.-J.; Wei, Y.-L.; Wang, X.-H.; Zhao, J.; Li, X. Research progress of ultrasonic temperature measurement technology in ultra-high temperature extreme environments. Metrol. Meas. Technol. 2024, 44, 1–13. [Google Scholar]
- Sivaprakasam, T.B.; Krishnamurthy, C.V.; Arunachalam, K. Non-contact in situ microwave material measurements for high temperature process monitoring. Rev. Sci. Instrum. 2019, 90, 034702. [Google Scholar] [CrossRef] [PubMed]
- Lyu, F.; Zhou, X.; Ding, Z.; Qiao, X.; Song, D. Application Research of Ultrasonic-Guided Wave Technology in Pipeline Corrosion Defect Detection: A Review. Coatings 2024, 14, 358. [Google Scholar] [CrossRef]
Disclaimer/Publisher’s Note: The statements, opinions and data contained in all publications are solely those of the individual author(s) and contributor(s) and not of MDPI and/or the editor(s). MDPI and/or the editor(s) disclaim responsibility for any injury to people or property resulting from any ideas, methods, instructions or products referred to in the content. |
© 2025 by the authors. Licensee MDPI, Basel, Switzerland. This article is an open access article distributed under the terms and conditions of the Creative Commons Attribution (CC BY) license (https://creativecommons.org/licenses/by/4.0/).