Abstract
Under the influence of extreme climatic conditions, landslide disasters occur frequently in the Loess Plateau due to complex geological structures, loose soil, and frequent intense rainfall. These events are often concealed, posing significant challenges for disaster prevention. High-resolution optical remote sensing combined with field surveys can improve identification accuracy; however, concerns persist regarding issues such as omission and misidentification during hazard identification and monitoring processes. To address these challenges, this study proposes an integrated remote-sensing identification approach, focusing specifically on the central region of Tianshui, a typical landslide-prone area within the Loess Plateau. Utilizing Sentinel-1 and JL1LF01A remote-sensing imagery collected from 2022 to 2023, we conducted ground deformation monitoring through the Small Baseline Subset Interferometric Synthetic Aperture Radar (SBAS-InSAR) technique. By integrating deformation results with optical imagery features indicative of potential landslide sites, a comprehensive identification method was developed to precisely detect potential landslide hazards. Verification of the identified sites was subsequently performed using the Google Earth platform, resulting in the establishment of a final dataset of potential landslide hazards within the study area. This outcome clearly demonstrates the high applicability and accuracy of the integrated remote-sensing identification method in the context of landslide hazard assessment. Furthermore, this research provides a solid scientific foundation for geological hazard identification efforts and plays a critical guiding role in disaster prevention and mitigation in Tianshui City, thereby enhancing the region’s capacity to withstand disaster risks and effectively safeguarding local lives and property.
1. Introduction
Landslides represent a common and highly destructive category of geological hazards, characterized by frequent occurrences and extensive impacts, thus becoming a critical focus in disaster prevention and mitigation [1]. Landslide hazards specifically refer to slopes with imminent potential for destabilization, resulting in disasters. Not all landslides, however, qualify as hazards; this designation applies only to landslides that threaten or cause damage to lives and property [2].
Notable landslide events, such as the catastrophic incident in Shuicheng, Guizhou Province, on 23 July 2019, resulting in 43 fatalities and nine missing persons [3], and another severe event in Liangshui Village, Tangfang Town, Zhenxiong County, Yunnan Province, on 22 January 2024, which caused 44 deaths [4], underscore the strong need for effective geological disaster prevention. Responding to escalating landslide threats, regions across China have systematically conducted hazard assessments and risk evaluations. Xu Qiang and colleagues proposed an integrated “Heaven-Air-Ground” three-tier monitoring system for the early detection of significant geological hazards, which has achieved national implementation and which has yielded notable results [5]. Yongxing Lu and others proposed a landslide-susceptibility prediction approach integrating optimized sampling with stacking ensemble learning, which significantly improved the quality of negative samples and which achieved a high prediction accuracy of 97.1%, offering an effective technical framework for regional landslide risk assessment [6]. Nevertheless, around 80% of catastrophic geological disasters still occur at unidentified hazard sites, indicating various undiscovered threats [2]. Consequently, the early detection and monitoring of landslide hazards remain pivotal and challenging areas in landslide disaster research.
Landslide hazards commonly occur in remote, upper slope areas characterized by complex terrain and dense vegetation cover, rendering traditional manual inspections and community-based monitoring inadequate for extensive, high-risk area evaluations [7]. Developing proactive detection methods, precise hazard identification techniques, and intelligent, systematic monitoring and early-warning systems constitutes a critical scientific challenge in landslide disaster mitigation. This emphasizes the necessity of transitioning from passive, post-disaster responses to proactive, pre-disaster identification and intervention strategies. However, existing monitoring methods, constrained by spatial coverage limitations and intensive human-resource requirements, are typically effective only in small-scale, localized scenarios, making continuous and regional-scale hazard identification and dynamic updating difficult to achieve [8,9].
Remote-sensing technology, notable for its high timeliness, spatial resolution, and broad coverage capabilities, provides innovative solutions for macro-scale landslide monitoring. Optical remote-sensing imagery excels in surface-feature extraction and has been widely applied in geological hazard assessments and environmental monitoring. However, optical imagery is frequently impeded by cloud coverage, variable lighting conditions, and meteorological factors, particularly limiting its efficacy in detecting subtle ground deformations [10]. In contrast, spaceborne Synthetic Aperture Radar (SAR) remote-sensing technology, capable of all-weather and day-night imaging, penetrates cloud coverage and vegetation effectively to precisely monitor ground deformation. Utilizing Interferometric SAR (InSAR), millimeter-level deformation can be observed, effectively detecting subtle movements indicative of potential landslide activities [11]. Consequently, SAR remote-sensing technology demonstrates significant potential and has become a critical tool in the early identification and continuous monitoring of landslide hazards.
The Loess Plateau in Northwest China features complex geological structures and thick loess deposits, characterized by high porosity, high moisture content, and low shear strength, resulting in poor soil stability and increased susceptibility to landslides triggered by rainfall, snowmelt, or seismic activity. Additionally, the region’s arid climate, sparse vegetation, and limited hydrological regulation intensify the potential for landslides, especially following abrupt rainfall events. Due to terrain constraints, populations and infrastructure predominantly cluster at slope bases in high-risk areas, exacerbating geological hazards due to intensified human activities [12,13,14,15]. However, most existing studies focus on single-sensor data or simple overlays of multi-source imagery, often lacking systematic integration frameworks that account for the spatiotemporal discrepancies and complementary characteristics among optical, SAR, and topographic data. Therefore, there remains a significant research gap in developing a unified and robust methodology for effectively integrating multi-source remote-sensing data to enhance the accuracy and reliability of landslide hazard identification.
Considering current technological capabilities and the critical need for landslide hazard identification, this study focuses on the central region of Tianshui City, a landslide-prone area on the Loess Plateau. Sentinel-1 C-band SAR satellite data were employed alongside the SBAS-InSAR technique to acquire ground deformation information. An integrated remote-sensing method identified potential hazard sites, and validation was performed on the Google Earth platform, generating a definitive dataset of landslide hazard points. This research provides a valuable reference for similar regions, enhancing China’s landslide hazard-identification capabilities and contributing essential guidance to disaster prevention and mitigation strategies on the Loess Plateau.
2. Study Area and Data
2.1. Study Area
Tianshui City is located in the southeastern part of Gansu Province, in the middle reaches of the Weihe River, at the junction of the Shaanxi, Gansu, and Sichuan Provinces. National Highways 310 and 316 pass through the city, and urban–rural roads are well-developed, providing convenient transportation [16]. Based on the spatial distribution characteristics of landslides within the city and the coverage conditions of SAR data, this study selects the central region of Tianshui City as the research area, with geographical coordinates ranging from 36°29′ N to 36°46′ N and from 105°51′ E to 105°22′ E. The study area primarily covers the northeastern part of Maiji District, the northern part of Qinzhou District, and the adjacent areas of Gangu County, Qingan County, and Qingshui County, with a total area of approximately 1406.05 km2. The geographical location of the study area is shown in Figure 1.
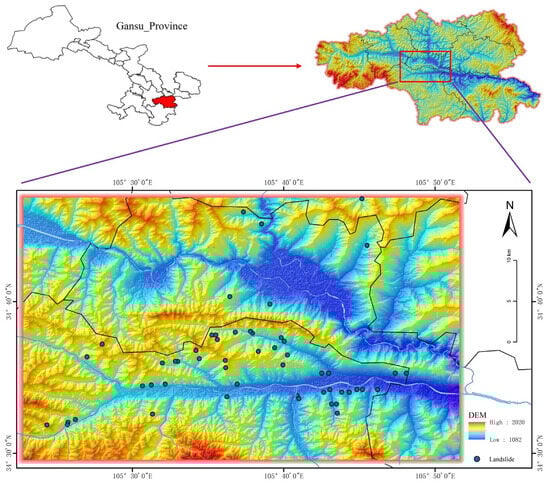
Figure 1.
Map of the study area. The red areas in the image represent high-altitude regions, while the blue areas indicate low-altitude regions. The color gradient from red to blue reflects the transition from higher to lower elevations. The blue dots mark locations where landslides have occurred historically.
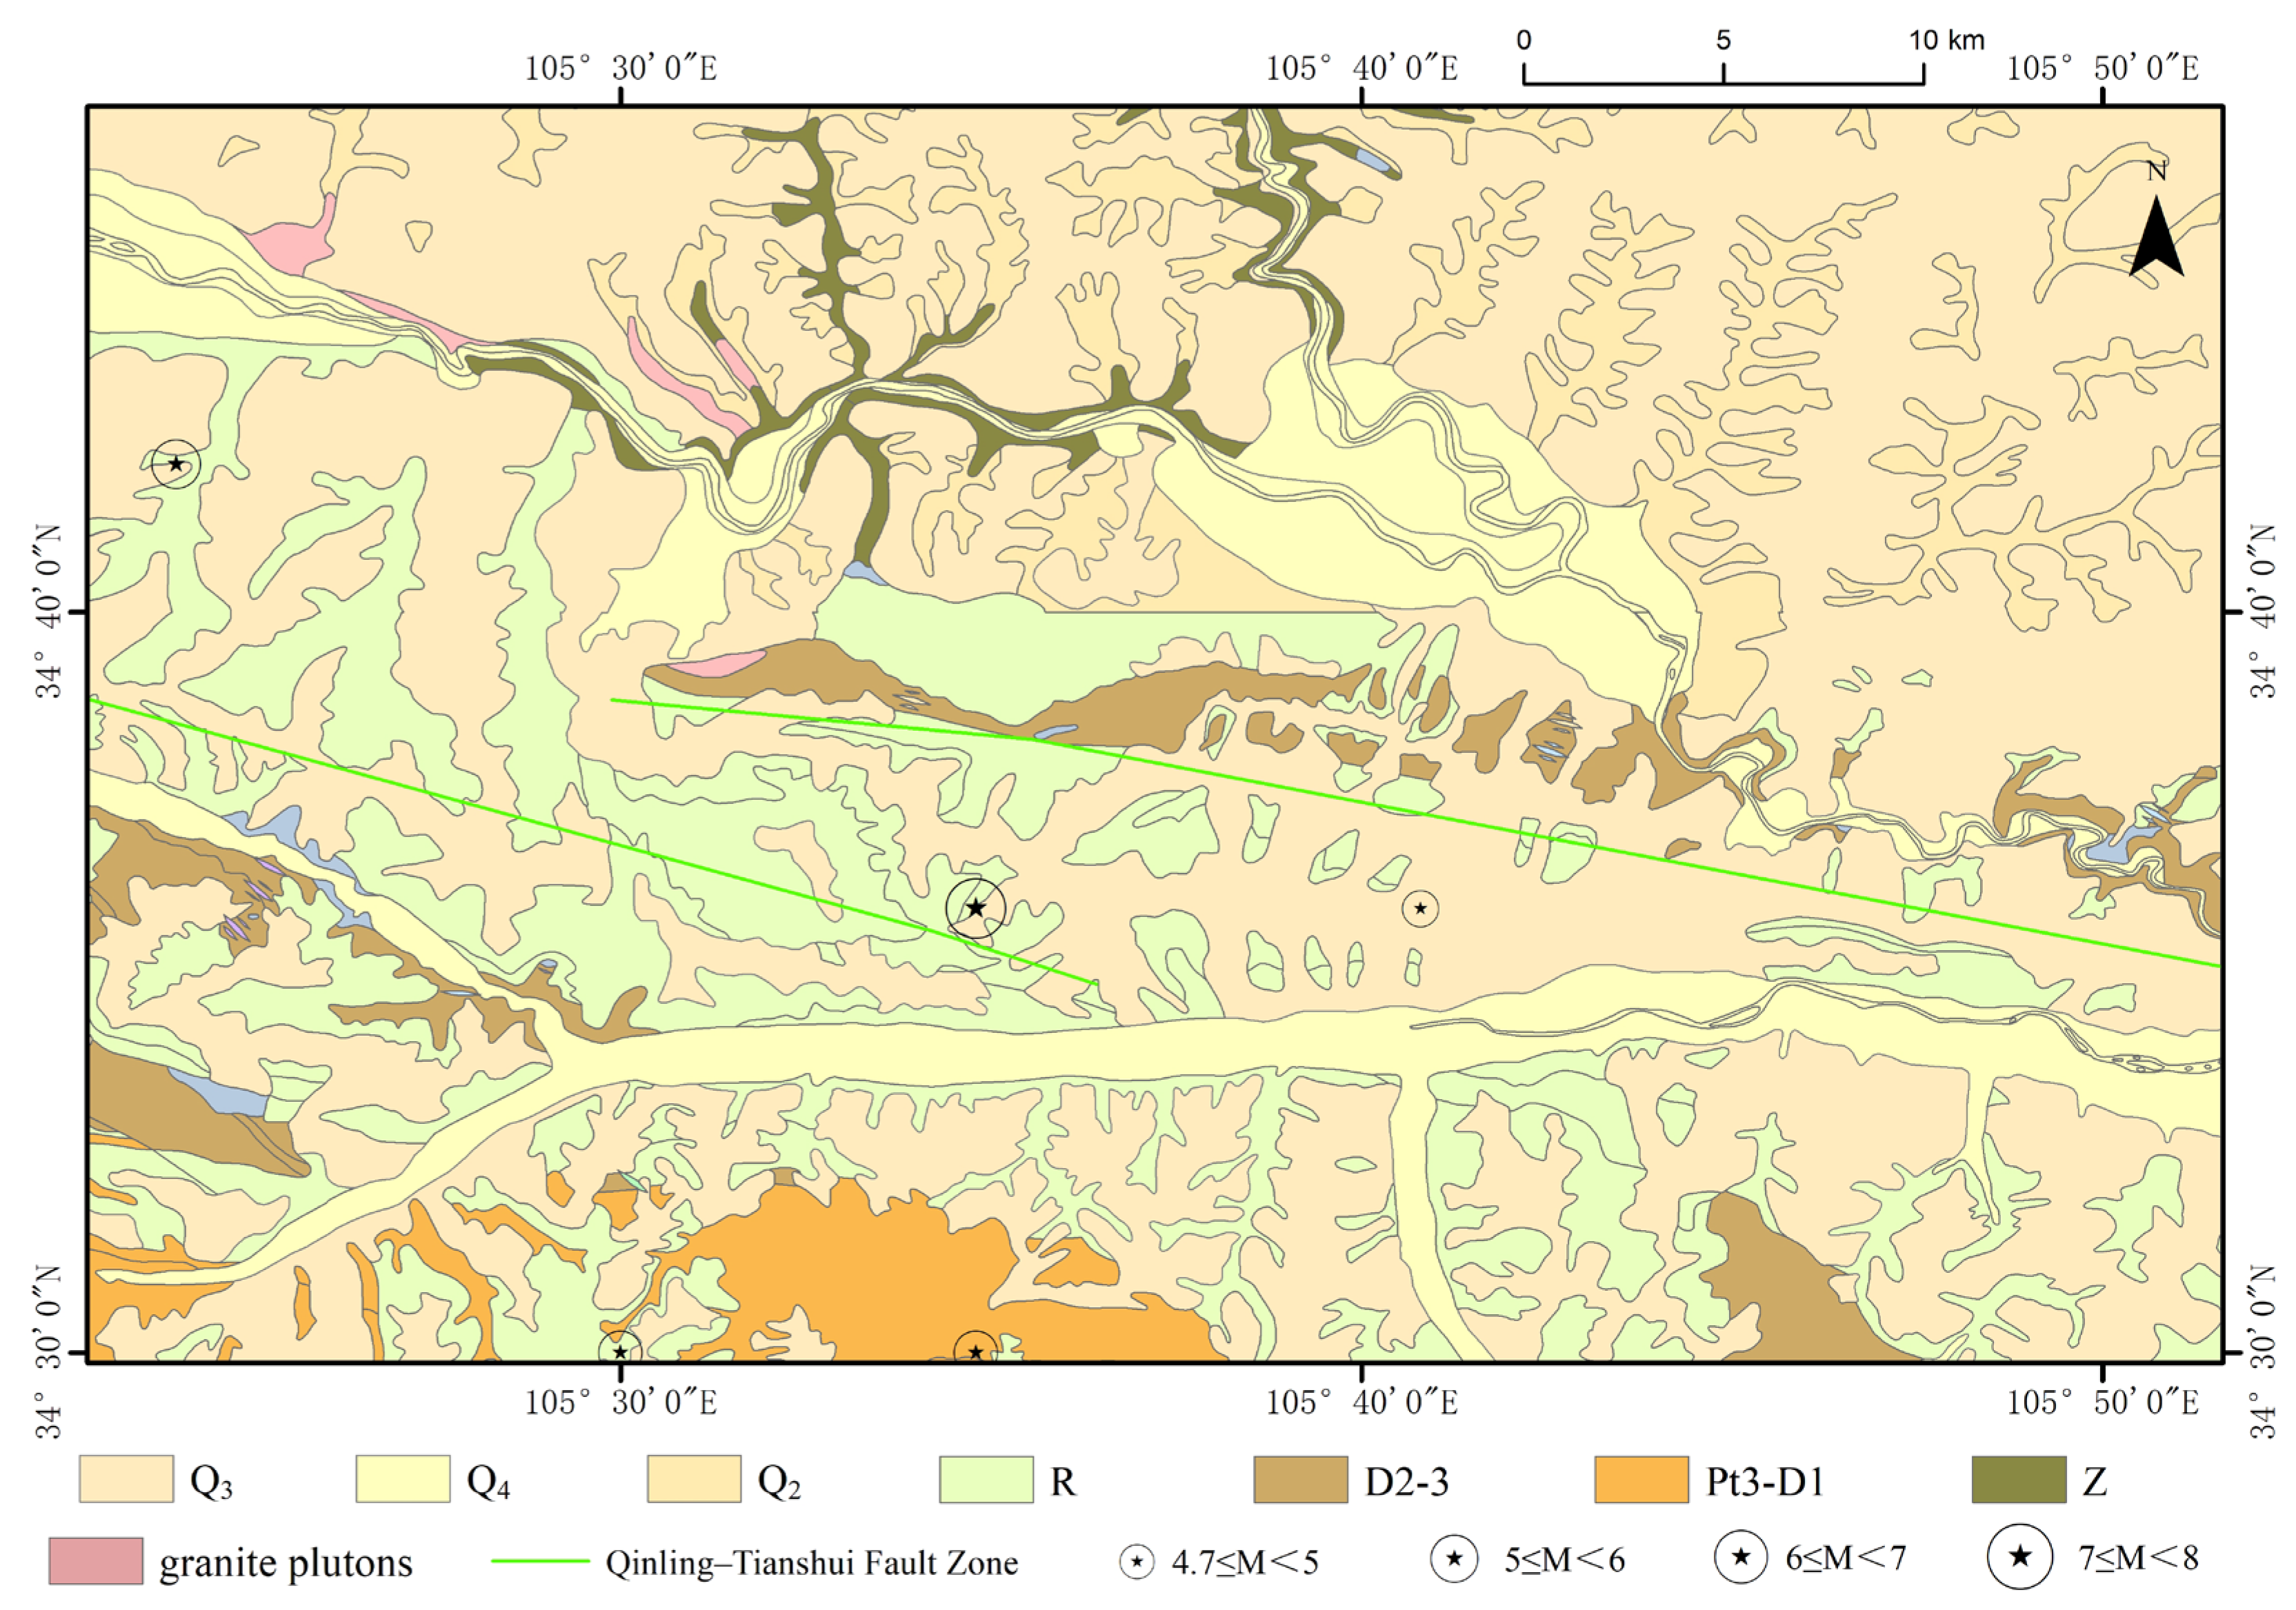
The study area is located in the transitional zone of the Longxi Loess Plateau, featuring significant terrain relief. Within the area, there are valley regions along the Weihe River and its tributary, the Jiahe River, presenting a typical mountain valley basin loess mound landform. As shown in Figure 2, the study area is situated at the complex intersection of the middle segment of the Yinchuan-Tianshui-Wudu belt in the Liupan Mountains’ north–south seismic zone and the central part of the Tianshui–Lanzhou belt along the northern margin of the Qinling Mountains’ east–west seismic zone [17,18,19]. This region has a complicated seismic background with frequent activities. Due to the geological structure mainly consisting of loess, the rock layers are predominantly composed of weak mudstone and loess-mixed deposits. These formations are loosely structured and widely distributed, making them prone to geological disasters. Due to geological conditions, Tianshui City has a fragile geological environment and is a high-risk area prone to frequent geological disasters, mainly including landslides, collapses, and debris flows. On 23 July 2013, the city experienced a severe rainstorm, which triggered widespread landslides disasters that posed a serious threat to the lives and property of local residents [20]. Geological hazards have become a major constraint on urban development, making disaster prevention and mitigation a challenging task.
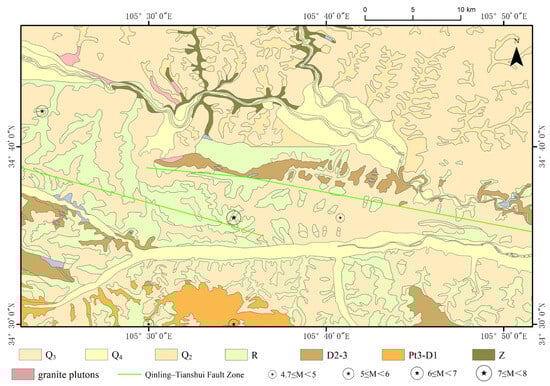
Figure 2.
1:200,000 geological map in study area.
2.2. Research Data and Processing
The remote-sensing data used in this study primarily include JL1LF01A and Sentinel-1 data. Additional geological data and known datasets will be described in subsequent sections. Table 1 provides descriptions of the main remote-sensing data.

Table 1.
Optical remote-sensing image data parameter information.
2.2.1. JL1KF01A Data
For the study area, a mosaic of high-resolution optical images from Jilin-1 Wide Field of View 01A with a resolution of 0.75 m was used. This mosaic image was obtained by merging and clipping data from December 2022. The preprocessing of optical remote-sensing images involved geometric correction, registration, orthorectification, image fusion, and mosaicking, followed by enhancement techniques including contrast adjustment, color transformation, and sharpening. The entire process used ground-control points uniformly selected from topographic maps at a scale of 1:50,000 as the reference. Jilin-1 satellite remote-sensing image data were provided by the Jilin-1 Network (https://www.jl1mall.com/ (accessed on 7 January 2025)).
2.2.2. Google Earth Platform
The Google Earth platform plays an important role in the interpretation and identification of geological disasters. Qi T et al. (2021) organized existing landslide data near the Langma–Baiya fault zone and the Bailongjiang fault zone in the Western Qinling Mountains and interpreted it using 1 m high-resolution optical images from the Google Earth platform, identifying 2765 landslides [17]. Field verification showed that this method has a high interpretation accuracy. Since the platform can visually and clearly display landslides, many researchers use it for interpretation. The Google Earth platform provides high-precision, multi-temporal optical imagery, which enables the comparative analysis of images from different time periods within the study timeframe to identify potential landslide hazards, thereby ensuring the quality of landslide inventory. In this study, due to the lack of sufficient field-monitoring data for on-site verification, the Google Earth platform was used to confirm and verify suspected geological disaster points from various image interpretation results, thereby enhancing the accuracy of identification.
2.2.3. Sentinel-1 Data
Sentinel-1 consists of two polar-orbiting satellites, Sentinel-1A and Sentinel-1B, both equipped with C-band SAR sensors for monitoring land and ocean surfaces. It has a 12-day repeat cycle and can operate in four imaging modes: SM (StripMap), IW (Interferometric Wide Swath), EW (Extra Wide Swath), and WV (Wave) [1].
Based on the terrain and geomorphic elements of Tianshui City, which has low vegetation coverage, C-band Sentinel-1 TOPS mode data are suitable for the multi-temporal monitoring of InSAR surface deformation across the entire area. Data from the period between 2022 and 2023 were selected, including 35 scenes of ascending orbit data and 116 scenes of descending orbit data. This study used SBAS-InSAR processing, selecting a 120-day temporal baseline for experiments. For experimental needs, SRTM 30M data were used as the reference DEM to eliminate topographic errors in InSAR processing, correct orbital errors, and combine precise orbital data [21,22].
2.2.4. DEM Data
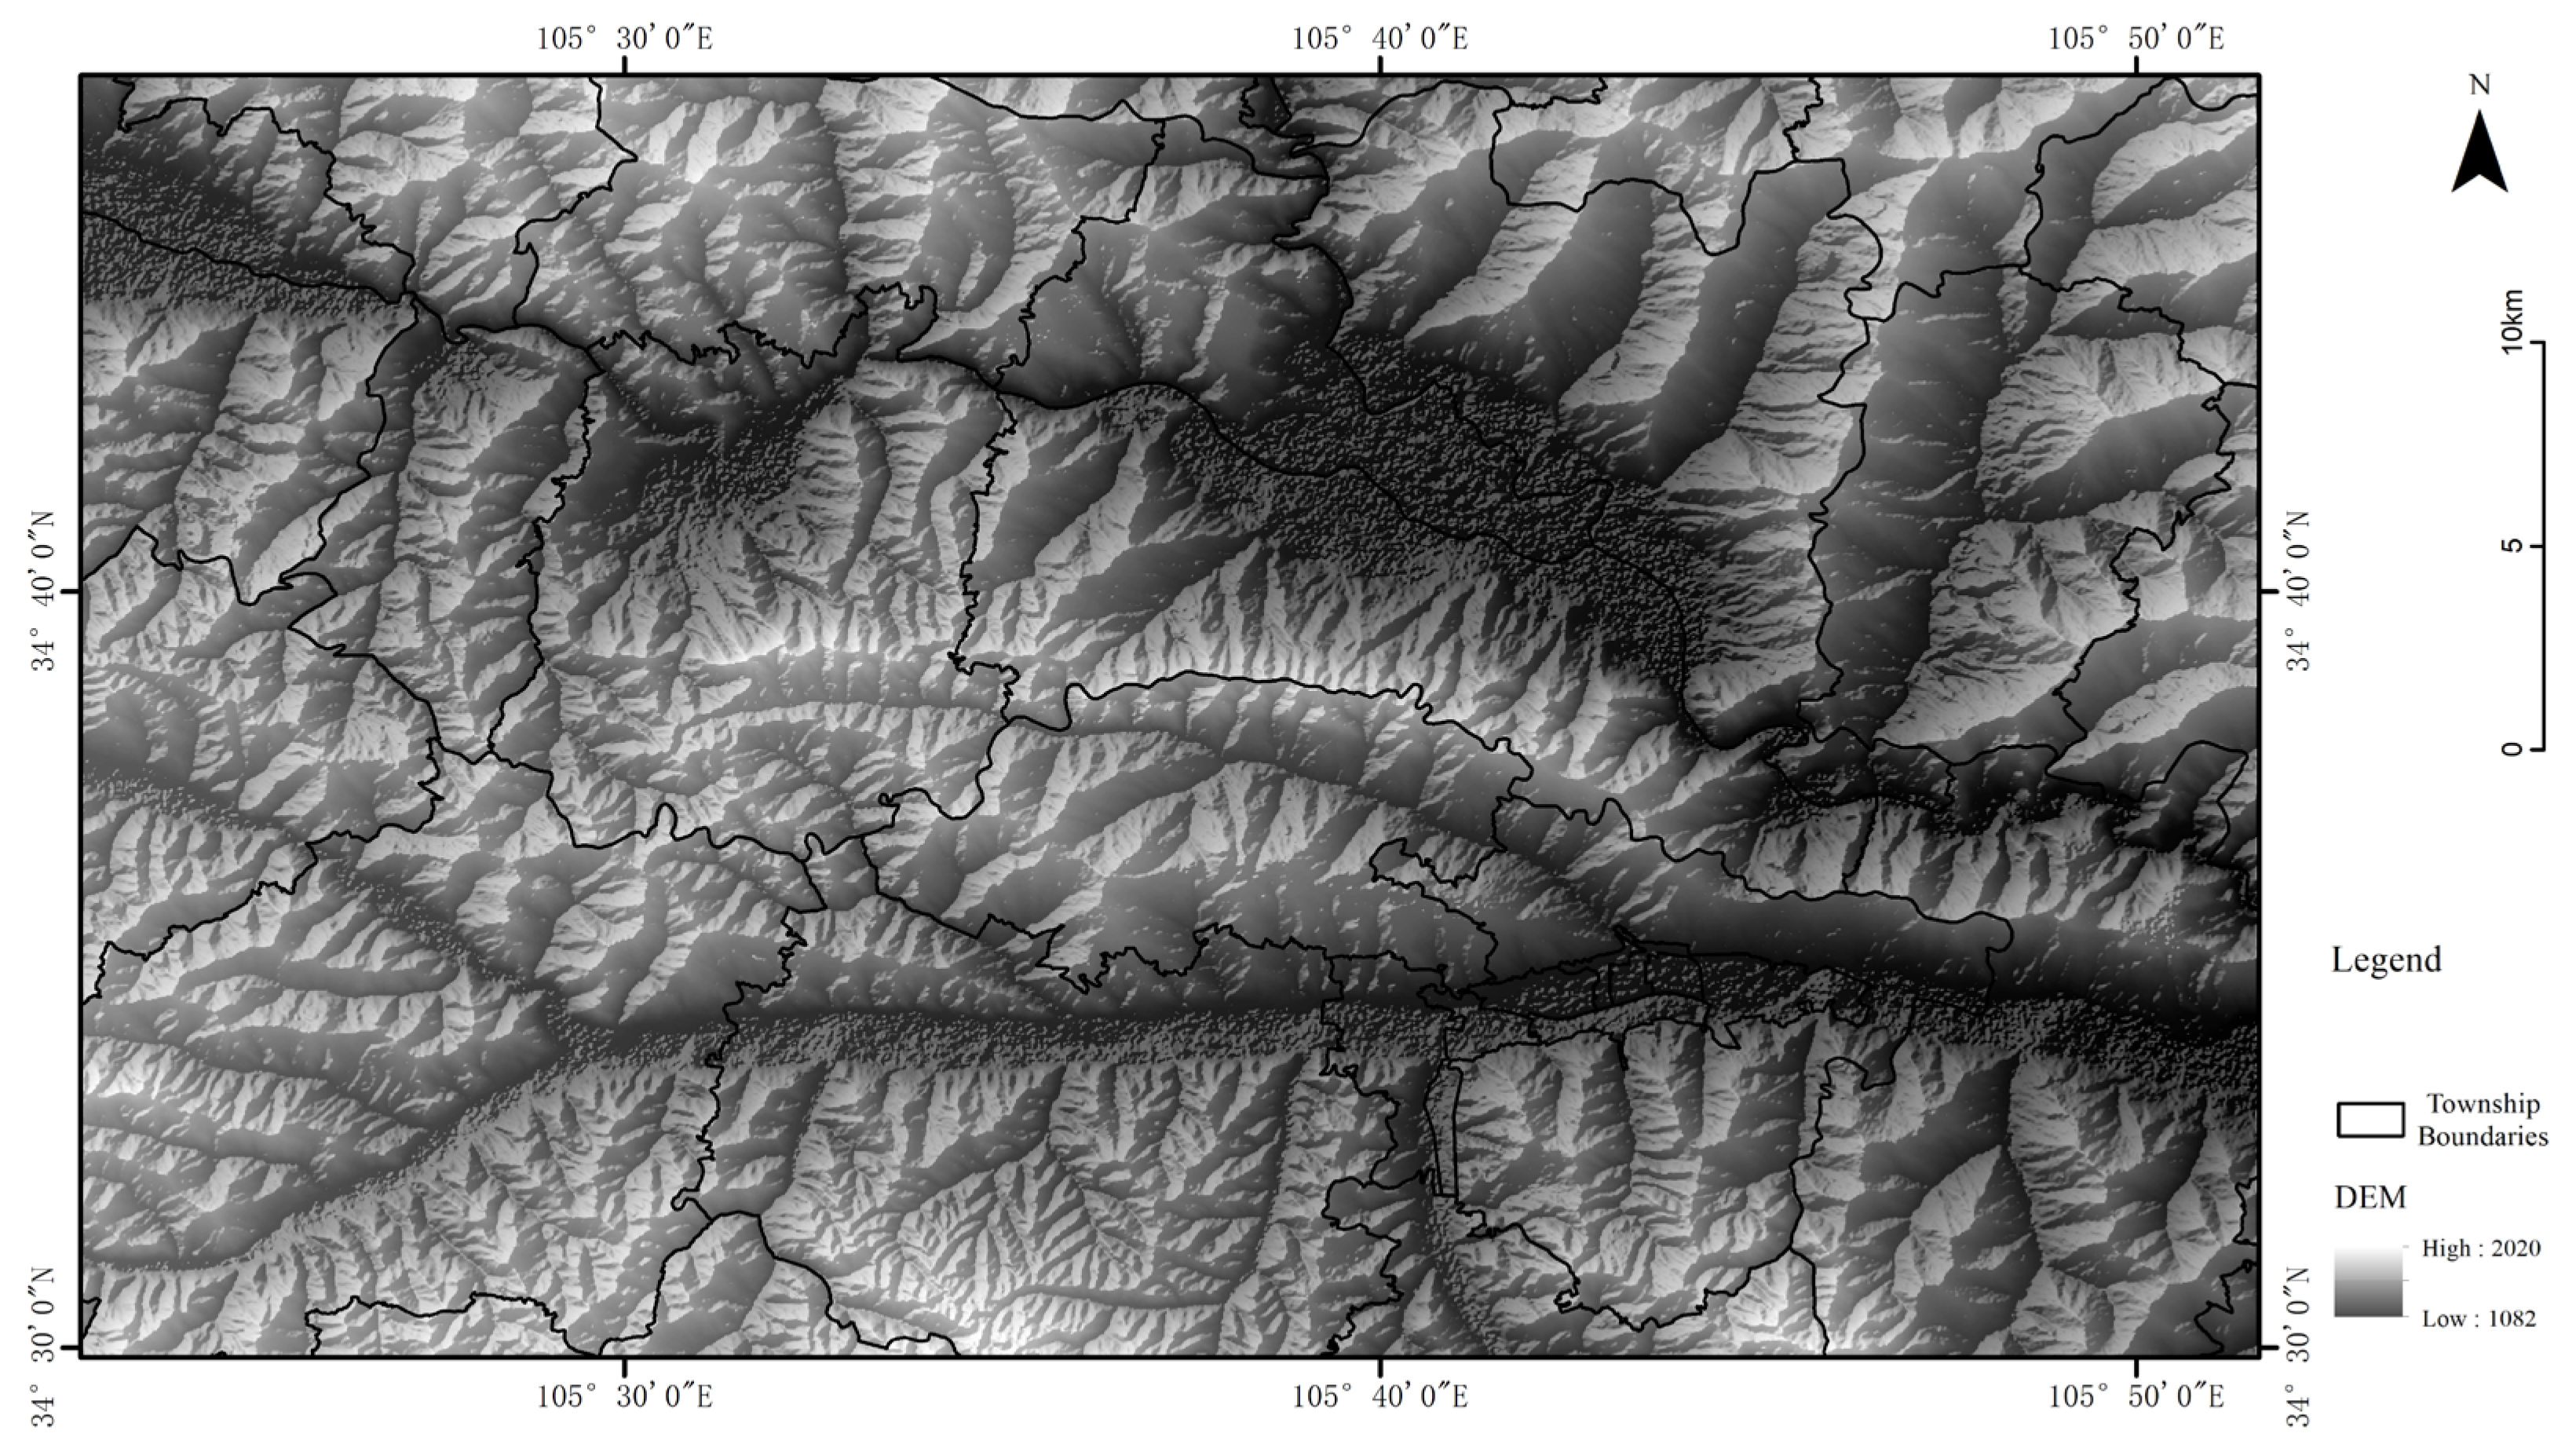
Digital Elevation Models (DEM) play a crucial role in InSAR processing and the identification of geological disaster points [10,23,24]. Geological disasters such as landslides and debris flows are strongly influenced by terrain features like elevation and slope. Many studies consider topographic features as primary factors in the susceptibility of geological disasters. The Shuttle Radar Topography Mission (SRTM) data provided by the USGS Earth Explorer platform (https://earthexplorer.usgs.gov/ (accessed on 6 December 2024)) have a spatial resolution of 30 m. Figure 3 below shows the DEM data of the study area, which contains the region’s topographic information.

Figure 3.
DEM Map of the study area.
2.2.5. Geological Data
Geological data constitute a fundamental component in identifying and mitigating geological hazards. These data integrate various influential factors, including hydrology, geotechnics, and climate interactions, serving as a crucial resource for geological hazard risk assessment and prediction [25,26]. The geological data utilized in this study were obtained from China’s 1:200,000 geological map database, covering critical nationwide geological attributes such as lithology, structural geology, and geomorphological features, thereby providing reliable foundational support for the accurate identification of geological hazards.
2.2.6. Landslide Inventory Data
The landslide inventory data were provided by the Institute of Geomechanics, Chinese Academy of Geological Sciences, and were stored in vector format (shp files) [16]. This dataset primarily includes historical landslide location information and associated attributes. The analysis of historical landslide data in the study area enables rapid understanding of loess’ landslide morphological characteristics, laying the groundwork for subsequent summarization and analysis of optical imagery features associated with potential landslide hazards.
3. Method
3.1. Research Objectives and Methodological Framework
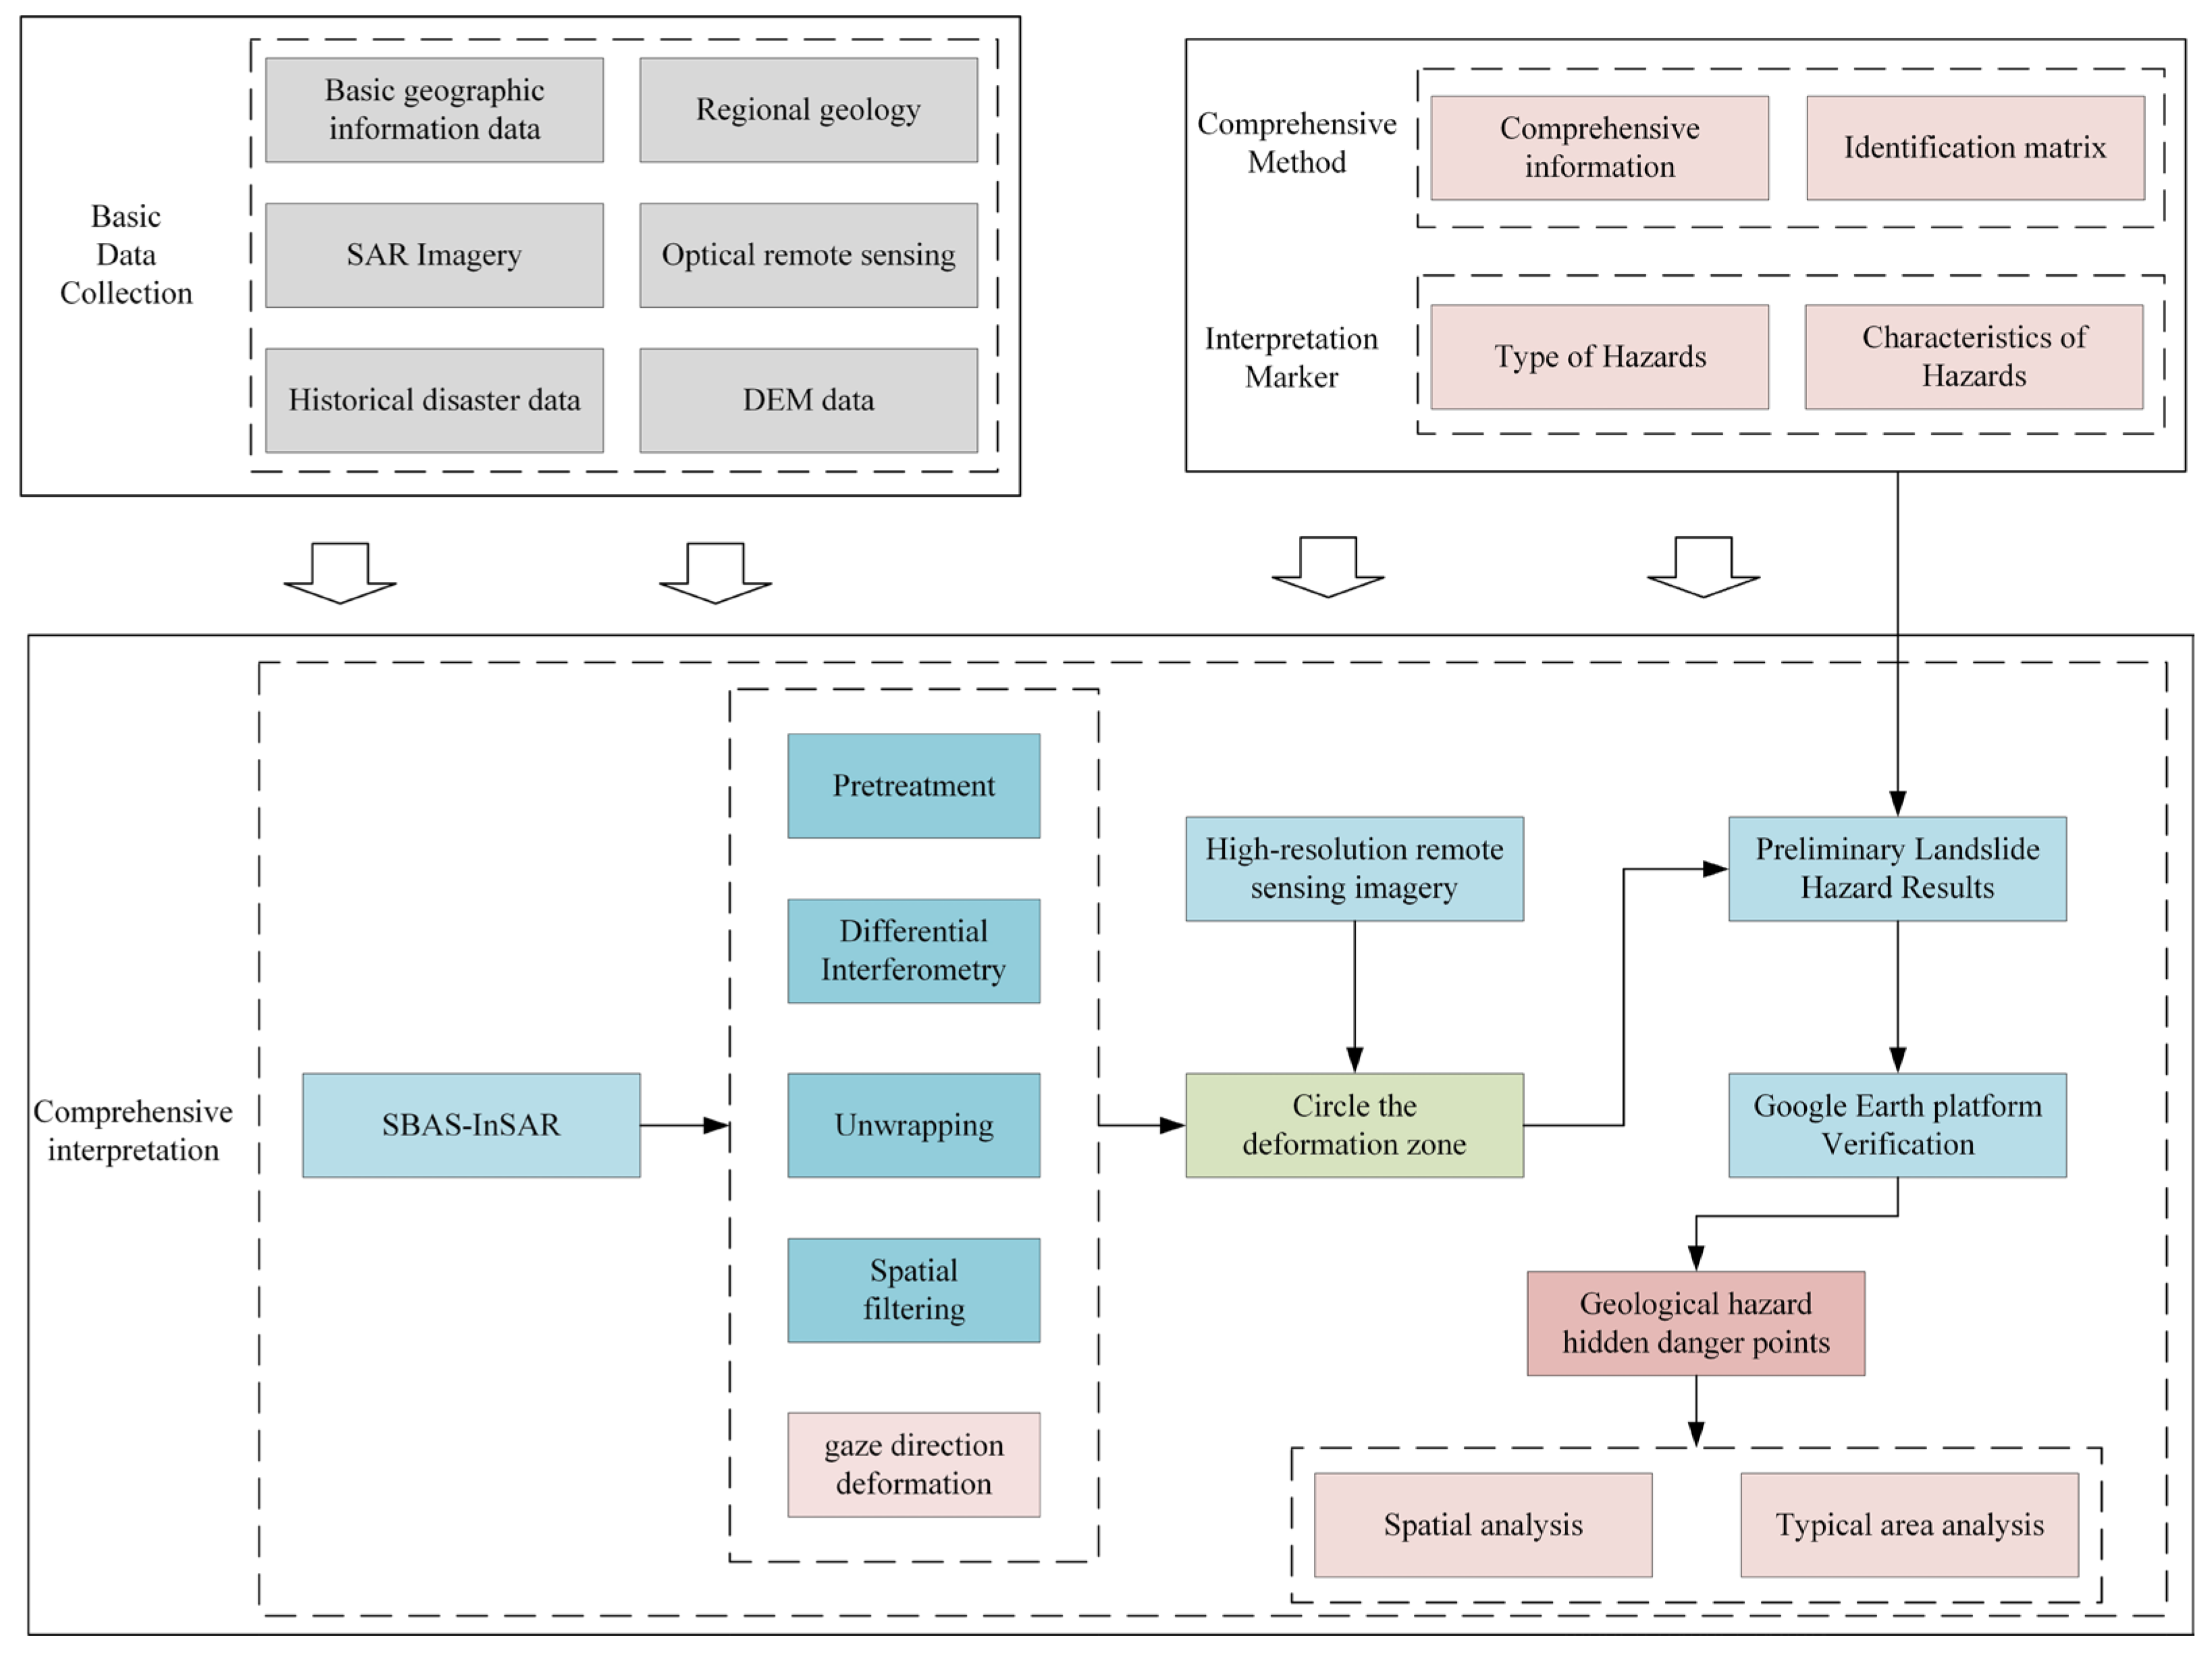
This study focuses on the identification and analysis of landslide hazards in loess regions by developing a systematic and integrated recognition methodology. Utilizing multi-source remote-sensing data and spatial-terrain information, the research undertook hazard identification, validation, and analysis. The primary research approach is outlined as follows (Figure 4):

Figure 4.
Research flow chart. Based on the collected fundamental data of the study area, a comprehensive landslide hazard identification method and interpretation marker were established. Initial potential landslide sites were identified using integrated techniques, verified via Google Earth, and subsequently analyzed through typical area analysis and spatial analysis.
- (1)
- Development of an integrated interpretation method and indicator library for loess landslide hazards. By examining the typical remote-sensing characteristics of loess landslide hazards, this study integrates optical remote-sensing imagery features with InSAR ground deformation monitoring results, combined with terrain characteristics such as slope gradients and proximity to rivers. This integration establishes a comprehensive interpretation framework for identifying loess landslide hazards. Additionally, an interpretation indicator library was created, clearly defining typical recognition characteristics of various landslide hazards in remote-sensing imagery and deformation data, thus providing essential technical support for subsequent interpretation tasks;
- (2)
- Implementation of ground deformation monitoring and extraction of deformation information. Using SBAS-InSAR technology, Sentinel-1 SAR imagery data from 2022 to 2023 were processed to derive regional cumulative surface deformation and deformation rate maps. These maps revealed surface displacement patterns, offering crucial evidence for the identification and evaluation of landslide hazards [27];
- (3)
- There was the comprehensive interpretation of landslide hazards to achieve preliminary identification results. Based on the developed integrated interpretation method, the ground deformation results from SBAS-InSAR and high-resolution optical remote-sensing imagery data were combined to systematically identify potential landslide hazard areas, resulting in a preliminary distribution map of landslide hazards;
- (4)
- There was the validation of identified landslide hazard points to enhance accuracy. The initially identified hazard points were imported into the Google Earth platform for visual verification and correction using high-resolution satellite imagery. The areas erroneously identified were further excluded, thereby retaining authentic and reliable hazard points. The selected typical deformation areas were analyzed in-depth to explore the evolutionary processes and spatial characteristics of landslide hazards, ultimately producing a definitive dataset of landslide hazards for the central Tianshui region;
- (5)
- There was spatial distribution analysis of landslide hazards to inform disaster prevention and mitigation strategies. Based on interpretation outcomes, spatial analytical methods were applied to statistically summarize the distribution characteristics of hazard points. The study investigates spatial associations between landslide hazards and various influencing factors, including topography, proximity to rivers, geological types, and human activity intensity. Further analyses identify mechanisms and primary controlling factors of landslide hazards, providing a scientific basis and decision-making support for landslide disaster prevention and risk management in the central Tianshui area.
3.2. SBAS-InSAR Technique
The basic principle of SBAS-InSAR is as follows. First, based on N + 1 registered SAR images, M differential interferograms are generated by setting appropriate combinations of the temporal and spatial baseline threshold [28,29,30,31,32]. Then, phase unwrapping is performed to obtain absolute phase values. For the differential interferogram(i) generated from two SAR images acquired at different times, and , the interferometric phase at any point can be expressed as
In the formula, are the radar line-of-sight cumulative surface deformations at the two acquisition times, respectively. After removing the topographic phase (), atmospheric delay phase (, and noise phase from the differential interferogram (), only the surface deformation phase remains in the equation. To ensure the obtained time series of surface deformations has physical meaning, the deformation phase is typically rewritten as the product of the average deformation rate between the two acquisition times and the time interval. Based on M unwrapped differential interferograms, this can be further expressed in matrix form:
In the formula, A represents a coefficient matrix of dimension M × N; denotes the error term. When all interferograms belong to the same subset, the least squares method can be used to solve Formula (2), thereby obtaining the surface deformation rate. On this basis, numerical integration of the solved deformation rate over various time periods can yield the time series deformation.
When interferograms are located in different subsets, the coefficient matrix becomes rank-deficient. In such cases, the Singular Value Decomposition (SVD) method is employed to compute the generalized inverse of , enabling the estimation of the minimum-norm solution for surface deformation rates.
SVD is preferred over QR factorization because it provides a full spectral decomposition , where the diagonal matrix contains singular values that reflect the intrinsic dimensional structure and allow identification of rank deficiencies. This makes SVD particularly effective for stabilizing solutions in ill-posed or underdetermined systems.
In contrast, QR factorization decomposes into an orthogonal and upper-triangular matrix (), which does not reveal singular value distribution and is therefore less suited for analyzing and compensating for rank deficiency in SBAS-InSAR time series inversion.
The SBAS-InSAR technique has two unique advantages in landslide deformation monitoring: (1) it generates redundant differential interferograms, which can effectively eliminate the influence of errors such as atmospheric delay effects and gross errors and (2) it can increase the temporal sampling rate of deformation time series, providing high spatial density monitoring results of landslide deformation. However, it also has the following shortcomings: a large number of redundant differential interferograms can increase the computational burden and the precision of the interferometric phase in low-coherence areas is relatively low [32,33].
3.3. Landslide Hazard Identification Method and Construction of Interpretation Feature Library
3.3.1. Comprehensive Method for Landslide Hazard Identification
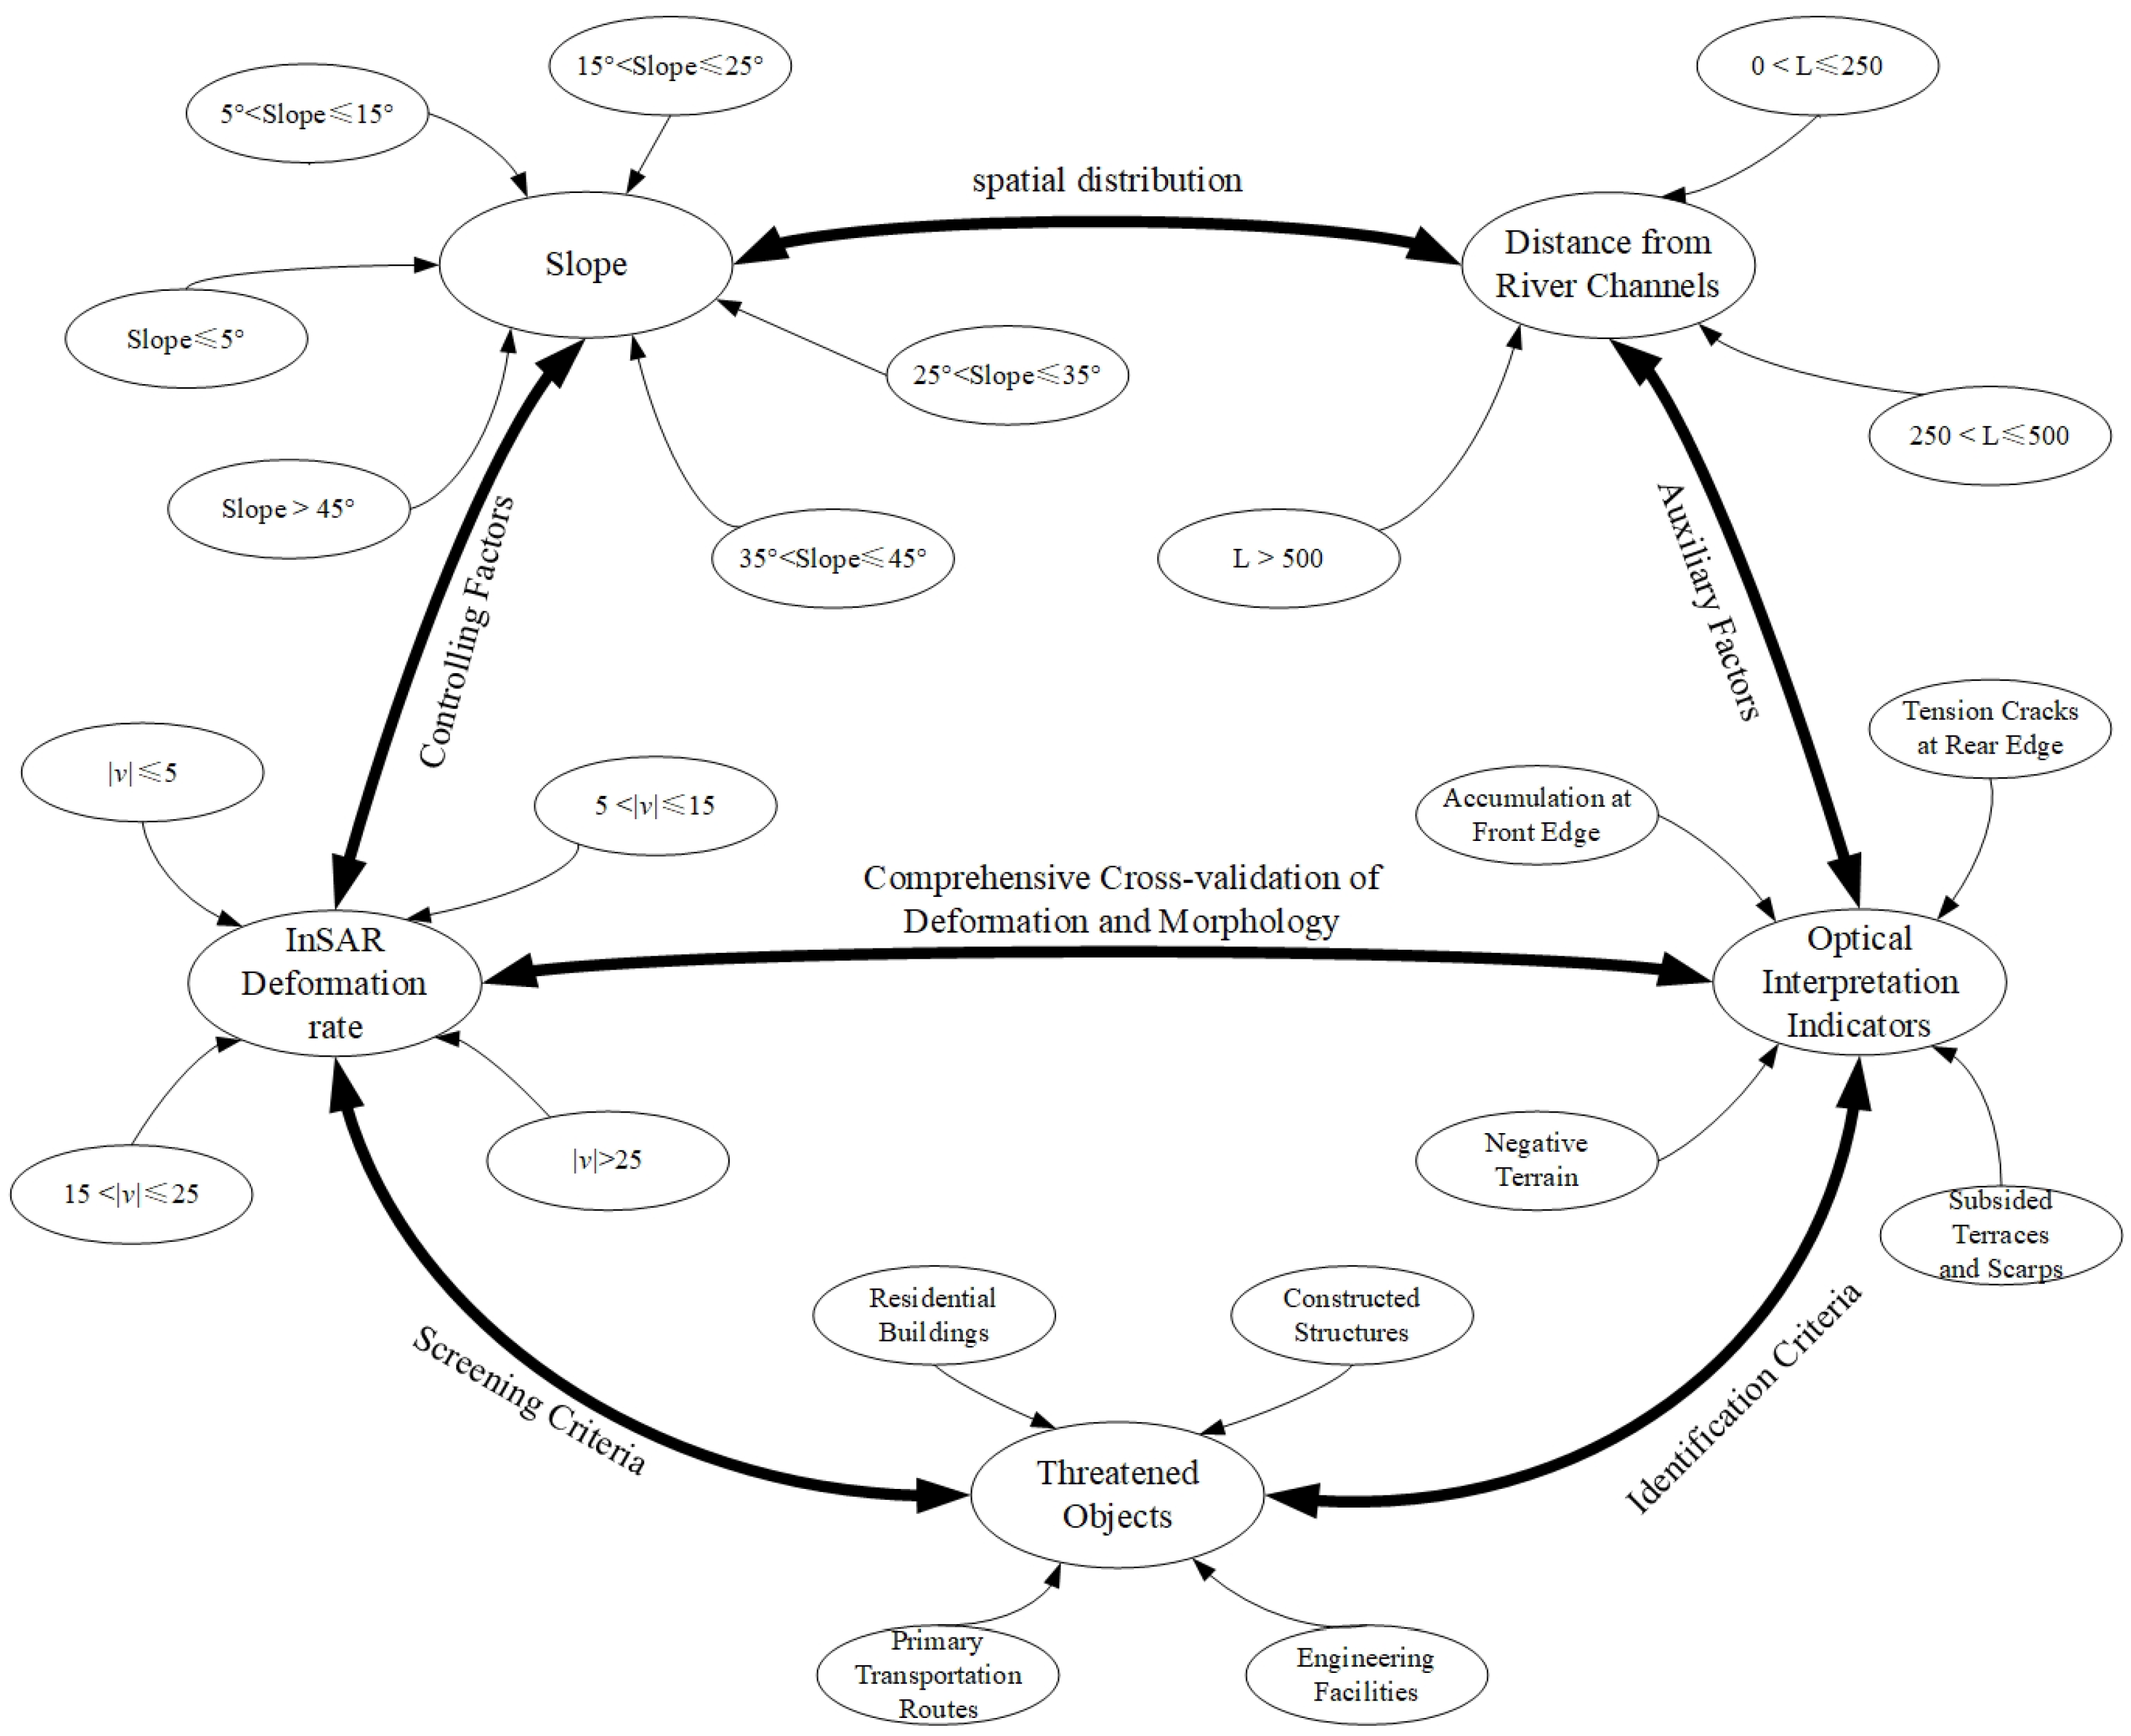
Traditional landslide hazard identification methods typically rely solely on ground deformation data derived from InSAR, which frequently result in missed detections and false identifications, reducing accuracy and increasing the burden of field verification. To address these issues, this study integrates terrain features, proximity to rivers, optical remote-sensing interpretation, and InSAR deformation monitoring results to comprehensively extract landslide deformation information, thereby enhancing identification accuracy (Figure 5).
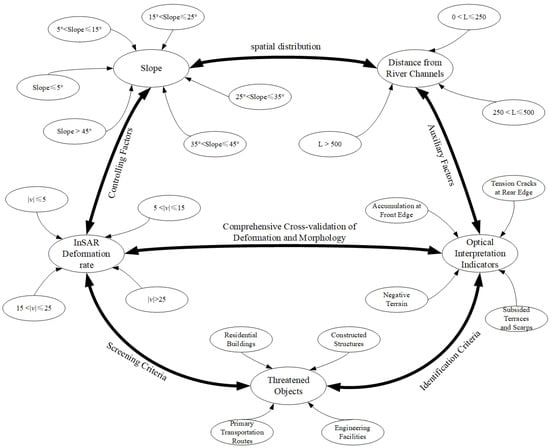
Figure 5.
Comprehensive identification relationship diagram of landslide hazards.
The detailed methodology of the comprehensive landslide hazard identification approach is as follows: (1) based on the absolute values of surface deformation rates obtained through InSAR monitoring, deformation levels are categorized into four classes: 0~5 mm/a indicating low deformation, 5~15 mm/a indicating moderate deformation, 15~25 mm/a indicating significant deformation, and >25 mm/a indicating severe deformation. (2) To further enhance identification accuracy, an interpretation index system based on optical remote-sensing imagery is established, focusing on landslide characteristics such as accumulations at the front edge, tension cracks at the rear edge, notable subsided terraces or scarps, and negative terrain features markedly inconsistent with surrounding areas. (3) Considering the correlation between gravitational potential energy required for landslide occurrence and slope gradient, the study area slopes are classified into six categories: 0°~5°, 5°~15°, 15°~25°, 25°~35°, 35°~45°, and >45°. Additionally, accounting for significant water erosion impacts in loess regions, distances from river valleys are categorized into three intervals: 0~250 m, 250~500 m, and >500 m, each corresponding to varying probabilities and potential scales of landslide hazards. (4) Threatened objects, including residential buildings, major transportation routes, and engineering facilities, are integrated into the analysis to determine whether identified areas should be explicitly designated as landslide hazard zones. Based on these relationships, a comprehensive landslide hazard identification matrix model was constructed (Table 2).
Table 2.
Comprehensive landslide identification matrix model.
3.3.2. Comprehensive Remote-Sensing Interpretation Indicator Library
Through the collection of typical landslide sites and potential hazard points around Tianshui City, this study systematically analyzed the integrated remote-sensing interpretation features of loess landslide hazards and constructed an interpretation indicator library accordingly. Table 3 summarizes the comprehensive remote-sensing interpretation characteristics of landslide hazards in the Tianshui area, including critical indicators such as InSAR deformation rates, optical remote-sensing identification features, terrain-slope gradients, and distances from river valleys.
Table 3.
Comprehensive remote-sensing interpretation of landslide hazards in the surrounding mountains of Tianshui City.
4. Result
4.1. InSAR Identification Results
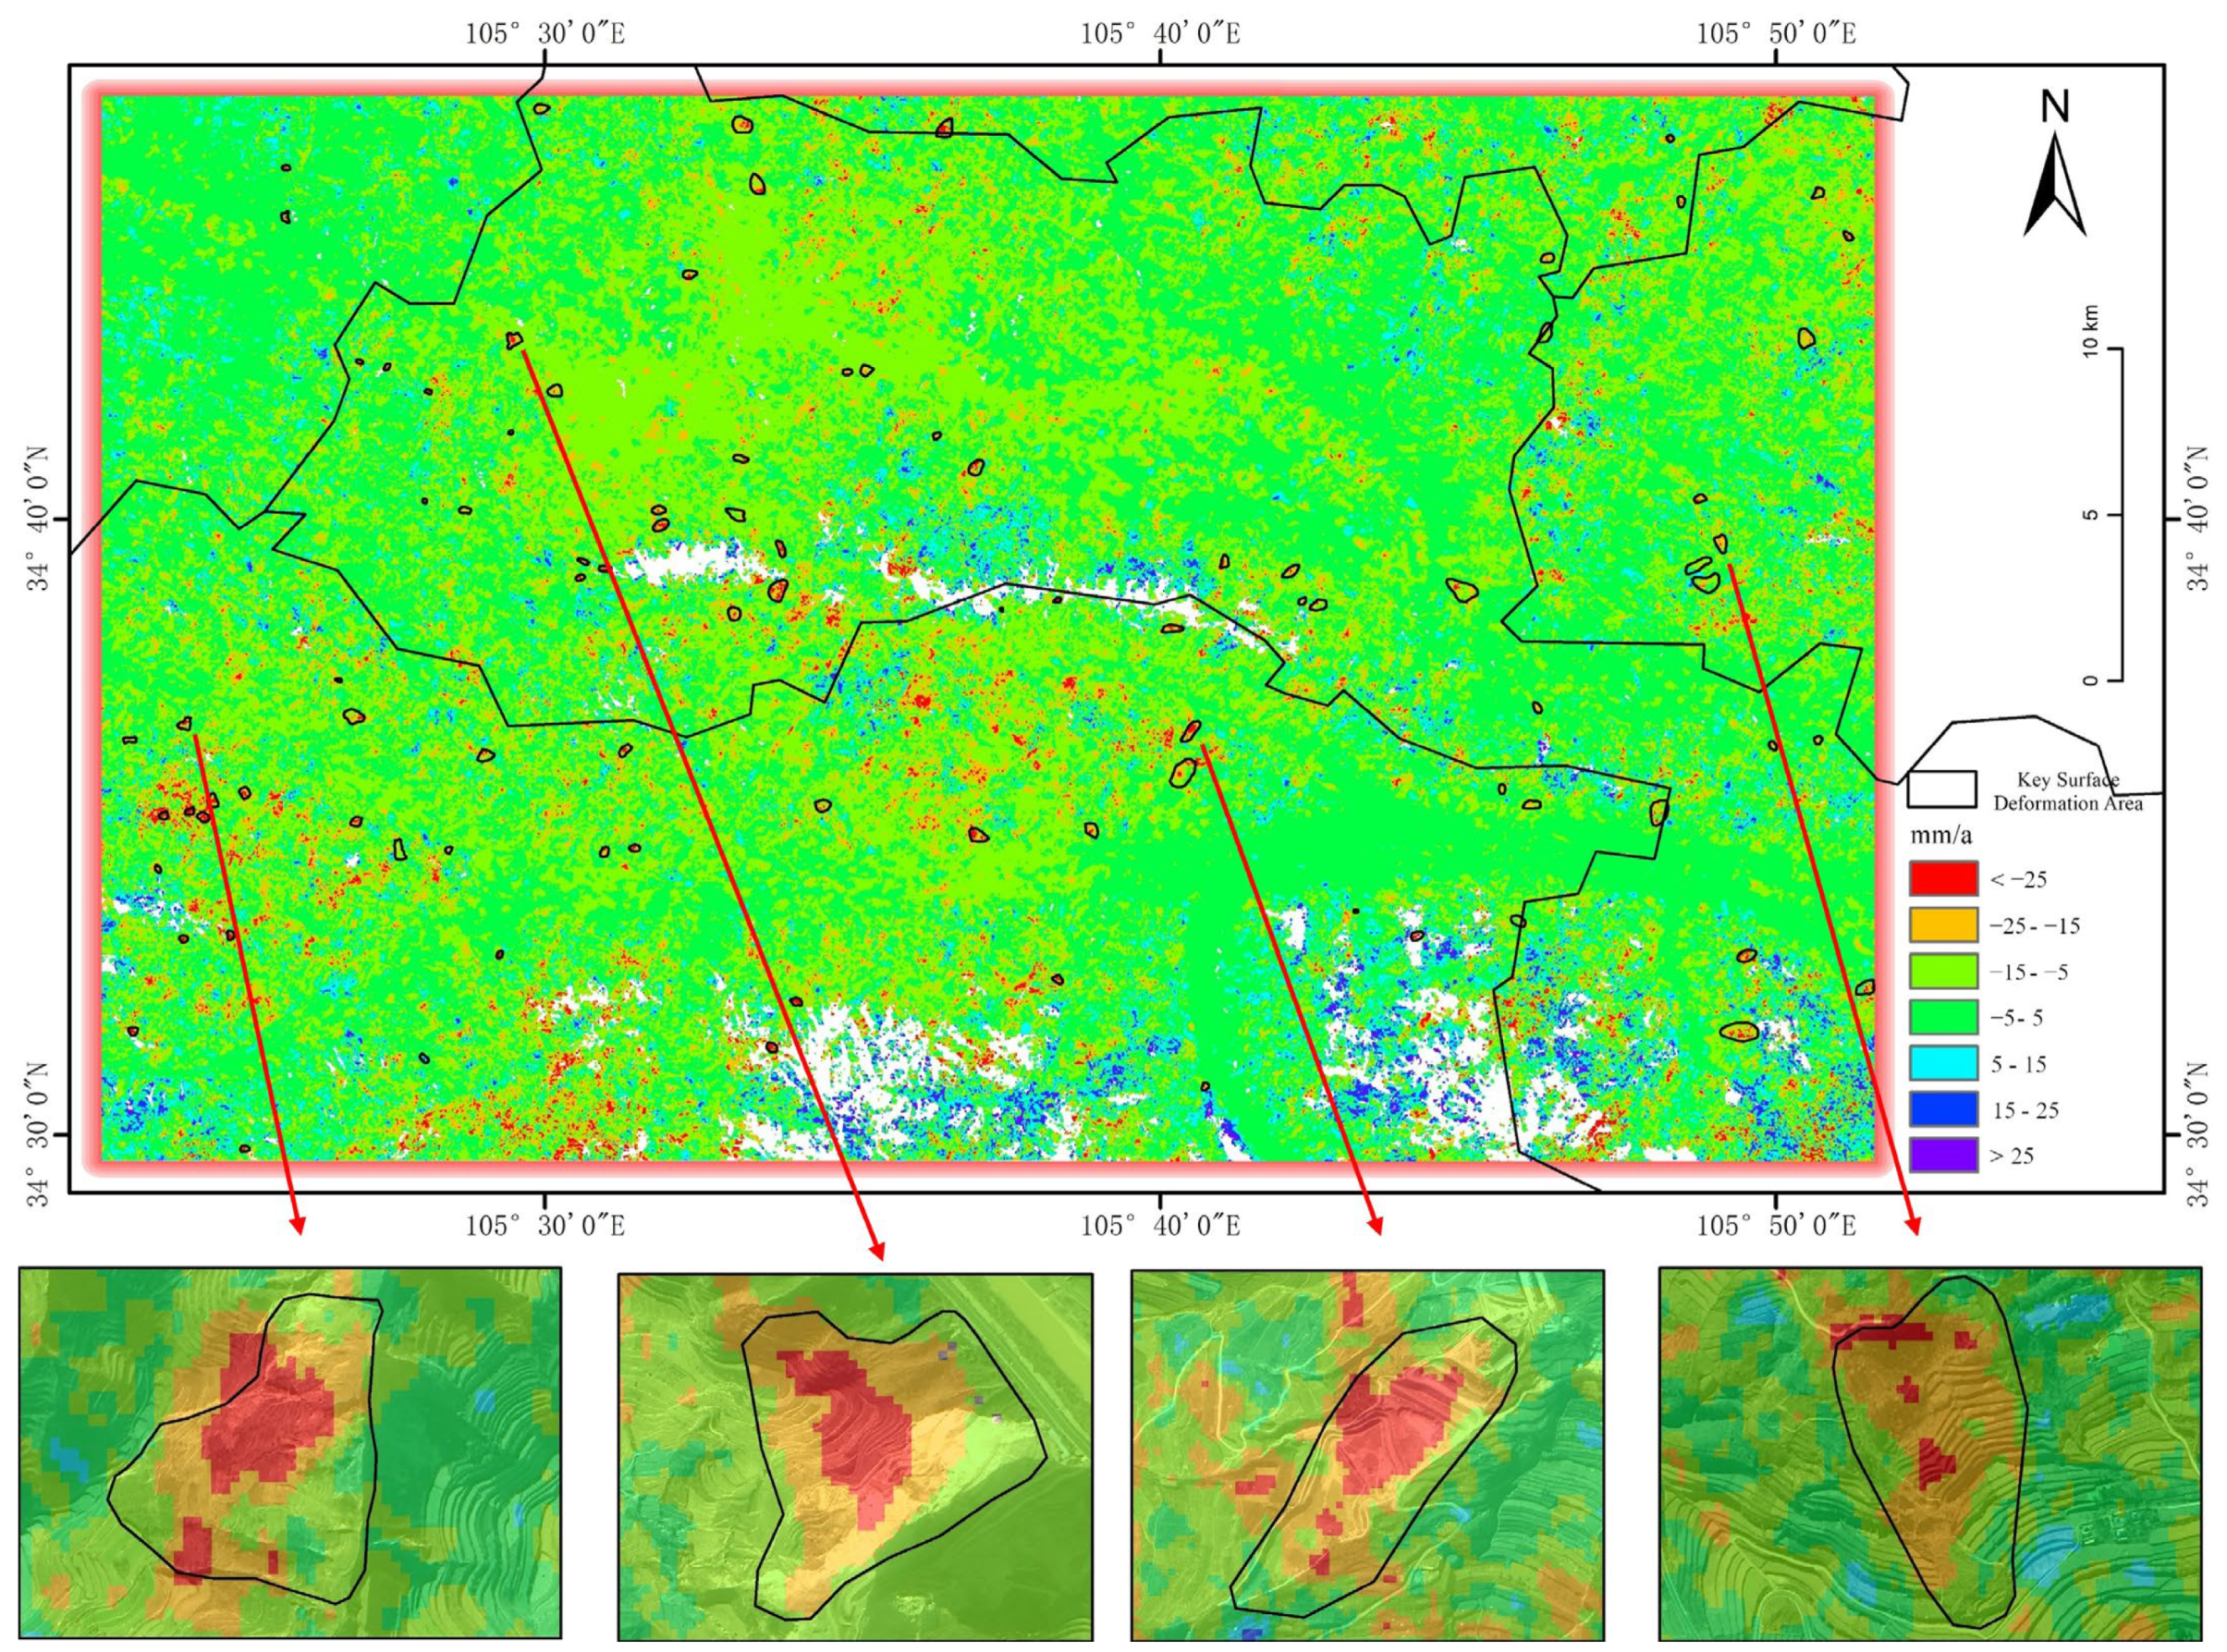
This study employed the SBAS-InSAR technique to conduct a temporal interferometric analysis of Sentinel-1 radar imagery collected over central Tianshui City from 2022 to 2023. The annual average ground deformation rates were extracted, with the ascending track deformation rates ranging from −93.68 mm/a to 88.12 mm/a and the descending track deformation rates ranging from −48.66 mm/a to 41.19 mm/a. Due to insufficient data density for high-precision temporal InSAR analysis, as only 35 ascending track images were acquired over the two-year period, the study primarily analyzed 21 ascending track images from 2023 to ensure the stability and reliability of the deformation-monitoring results. To enhance the accuracy of the identification outcomes, ascending and descending track deformation results were cross-validated [34,35,36]. Additionally, areas with uncertain interpretation results underwent auxiliary verification using the Google Earth platform, thus improving the overall accuracy and credibility of the interpretations.
The InSAR monitoring results indicate that significant deformation zones are concentrated in the northern mountainous areas of Maiji District, where a major landslide event occurred on 25 July 2013, marking it as a region prone to geological hazards in Tianshui City [20,25]. Existing geological studies reveal that major fault lines traverse near this region, with evident spatial coupling between fault activities and landslide occurrences. Consequently, this area, characterized by complex geological structures and significant landslide hazards, was identified as a priority zone for landslide risk assessments.
For deformation identification, temporal differential interferometric analysis was applied to obtain InSAR deformation rates from both the ascending and descending tracks. These deformation results were comprehensively analyzed alongside sub-meter resolution JL1 optical remote-sensing imagery and DEM data, examining the morphological characteristics and spatial distributions of deformation zones. The ascending track analysis identified 115 landslide-related interpretation points, while the descending track analysis identified 67 points, with 13 overlapping points identified by both tracks, totaling 169 potential landslides and landslide hazard regions. These interpretation points primarily encompass potential landslide hazard points, historical landslide sites, slope deformation areas, and slopes influenced by engineering activities. The results demonstrate uneven spatial distributions, predominantly located along riverbanks and near road embankments, potentially threatening critical infrastructure such as waterways, roads, buildings, and reservoirs, thereby providing essential data for subsequent field verification and disaster prevention efforts.
Given the absence of in situ monitoring stations in the study area for validation purposes, reliability assessments of InSAR identification were conducted via comparative analyses of ascending and descending track deformation results [1]. The findings confirm high conformity between identified engineering activity points in the third enlarged area of the ascending track imagery and actual project boundaries, validating interpretation accuracy. Furthermore, the second enlarged area in the descending track imagery, located in the overlap zone between two SAR image frames (frames: 473 and 479), demonstrated good consistency in deformation intensity and boundary delineations through cross-validation. These analyses collectively indicate that the InSAR ground deformation monitoring in this study achieved high accuracy, providing robust technical support for subsequent comprehensive landslide hazard identification research (Figure 6 and Figure 7).
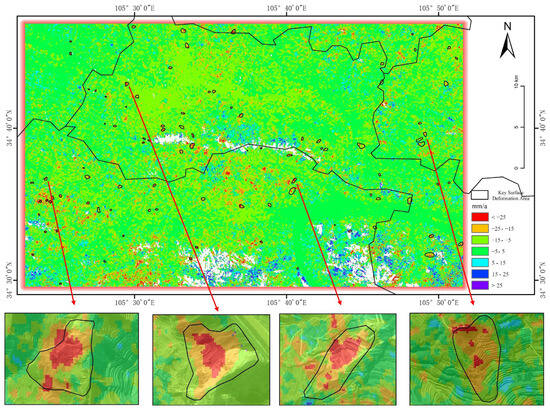
Figure 6.
Ascending-orbit SBAS-InSAR deformation map. The surface deformation velocity in the study area ranges from −93.68 mm/a to 88.12 mm/a. Four typical deformation zones are highlighted in the lower part of the map, involving potential landslide hazards and anthropogenic activities.
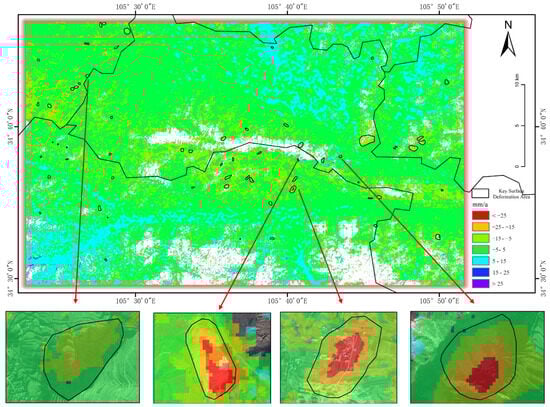
Figure 7.
Descending-orbit SBAS-InSAR deformation map. The surface deformation velocity in the study area ranges from −48.66 mm/a to 41.19 mm/a. Four typical deformation zones are marked in the lower part of the map, involving landslide-prone areas and engineering activities. Notably, Figure 2 presents deformation results derived from two different SAR data frames, which show generally consistent outcomes.
4.2. Comprehensive Analysis of Remote-Sensing Interpretation Results
Based on the comprehensive landslide hazard identification method proposed and integrated with the InSAR interpretation results, this study identified a total of 146 potential landslide hazard points. Subsequent validation using the Google Earth platform confirmed 127 of these points as actual landslide hazards, achieving an identification accuracy rate of 86.99%. Subsequently, an in-depth analysis was performed on these 127 confirmed hazard points from multiple perspectives.
Optical remote-sensing imagery, characterized by nadir viewing geometry and daytime imaging capabilities, can clearly and intuitively depict surface morphological features and environmental changes. In contrast, SAR data provide all-weather, high-precision observations with heightened sensitivity to subtle ground deformation, making them particularly effective for early landslide hazard detection. Thus, inherent differences inevitably exist in the identification results obtained from these two remote-sensing methodologies. To further analyze and validate these differences, this study utilized online platforms to conduct systematic comparative analyses and on-site verification. A focused analysis was conducted on spatial-distribution patterns, subtle ground-deformation characteristics, and the respective advantages and discrepancies inherent to optical remote-sensing and InSAR techniques, particularly emphasizing the detection of concealed landslide hazards within the study area. Furthermore, through comprehensive field investigations and remote-sensing interpretations, this study extensively summarized the spatial distribution patterns and developmental characteristics of the identified landslide hazard points.
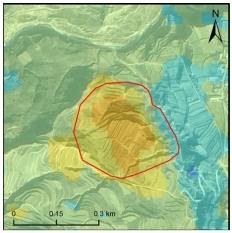
Through the above systematic analyses and cross-validation procedures, the differences between optical remote-sensing and InSAR identification results were classified into three typical scenarios, with their detailed characteristics systematically presented in Table 4.
Table 4.
Comparison chart of optical remote sensing, temporal InSAR, and platform verification.
- (1)
- General consistency between InSAR interpretation and optical remote-sensing results
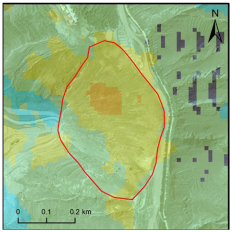
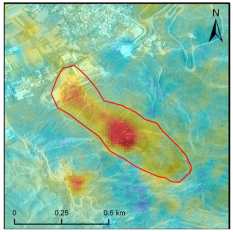
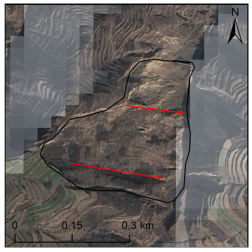
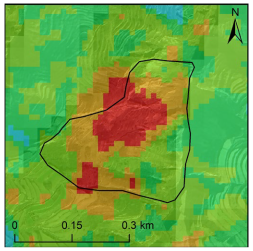
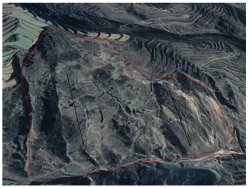
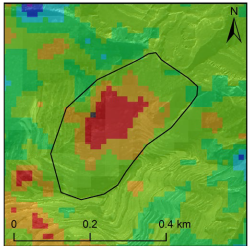
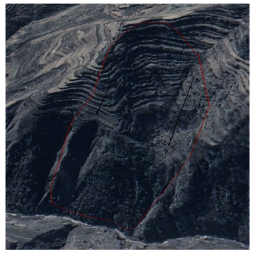
Among the identified landslide hazard points, 15 locations show general consistency between InSAR-derived deformation interpretation and the results of optical remote-sensing results. These two datasets exhibit a high degree of spatial overlap, and terrain–geological analysis further confirms their suitability for the research objectives. Landslide hazard point A was selected for detailed image analysis. By integrating InSAR deformation monitoring, optical remote-sensing interpretation, and validation using the online Google Earth platform, a comprehensive assessment of deformation characteristics, geological conditions, and slope stability was conducted.
Based on the InSAR deformation-monitoring results (Table 4(b)), the boundary of the landslide could be reliably delineated. The deformation in the middle section of the slope is particularly prominent, characterized by significant ground displacement. However, due to signal decorrelation effects in areas of dense vegetation or complex terrain, certain regions exhibit interpretation gaps. The monitoring data indicate a maximum deformation rate of −23.6 mm/a, suggesting the landslide is currently in a steady deformation phase. The optical remote-sensing imagery (Table 4(a)) clearly shows an active landslide with distinct boundaries and a sparsely vegetated or bare surface, indicating substantial surface disturbance and possible destructive sliding activity. Further validation using the Google Earth platform (Table 4(c)) confirmed that the landslide predominantly comprises loosely structured loess deposits, exhibiting low resistance to erosion and susceptibility to deformation triggered by rainfall infiltration or groundwater seepage. Combined with InSAR deformation analysis, it is concluded that the landslide is in a sub-stable condition, exhibiting continuous post-event creep deformation and potential for further activation.
This integrated analysis illustrates that combining optical remote-sensing and InSAR data effectively captures complementary aspects of landslide deformation characteristics, thereby providing robust scientific support for disaster risk assessment and management;
- (2)
- Partial agreement between InSAR interpretation and optical remote-sensing results
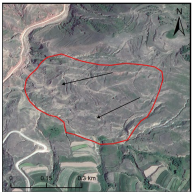
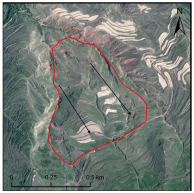
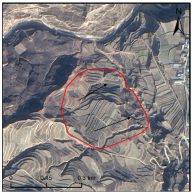
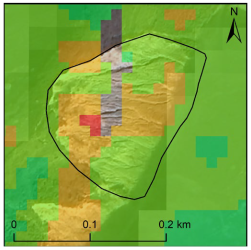
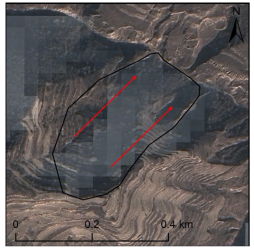
Among the identified hazard points, 24 exhibit partial consistency between the InSAR deformation results and the optical remote-sensing interpretations. Landslide hazard point B was selected for detailed analysis. According to InSAR deformation monitoring (Table 4(e)), this area shows extensive surface deformation, reaching a maximum deformation rate of −43.41 mm/a. However, SAR data limitations due to complex topography make it challenging to precisely delineate landslide boundaries; thus, optical remote-sensing data are necessary to clarify deformation extents and sliding characteristics. Through optical image interpretation (Table 4(d)), the basic boundaries of the potential landslide area are clearly defined. Within this area, vegetation is sparse and bare surfaces are exposed, indicating recent ground disturbance and surface instability. These are typical manifestations of active or developing landslide processes, with primary deformation activity appearing to be concentrated in a localized northern area. Additionally, primary deformation activity appears to be concentrated in a localized area in the north, corroborating the InSAR deformation monitoring results. Validation via online platform analysis (Table 4(f)) further confirmed clear sliding evidence at the toe of the landslide and intensified tension-induced deformation and ground cracking at its head, signifying ongoing geological instability. The combined results suggest the slope is approaching critical instability, and further sliding or localized failures may occur under external triggers such as rainfall, seismic events, or human disturbances.
Thus, the analysis of landslide hazard point B demonstrates that InSAR effectively detects extensive deformation areas and provides quantitative monitoring, while optical remote sensing excels in boundary delineation and surface morphological assessment. Integrating both methods enhances the precision in assessing landslide development stages and evolution trends, offering crucial scientific evidence for effective landslide hazard management;
- (3)
- Landslide hazard identified solely by InSAR results
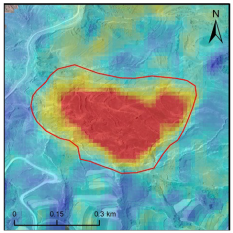
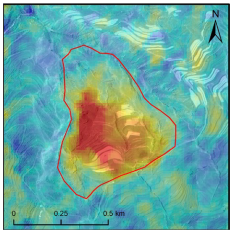
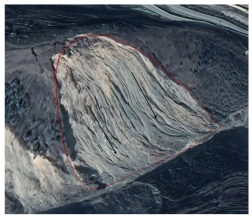
Among the interpreted hazard points, 88 locations were identified exclusively through InSAR deformation data, representing the most common yet challenging type to verify. Landslide hazard point C was chosen for detailed examination. InSAR analysis (Table 4(h)) revealed relatively clear boundaries with pronounced deformation in the central region, reaching maximum deformation rates of −40.88 mm/a, indicating ongoing steady-state deformation and potential instability. Optical remote-sensing imagery analysis (Table 4(g)) identified the hazard area along a steep riverbank. Several instances of riverbank instability and collapse have been observed in areas adjacent to the river. These geomorphological features indicate that the soil in this region is relatively loose, likely due to prolonged rainfall-induced erosion. Moreover, geological data analysis reveals that the area is underlain by weak lithologic strata, leading to a preliminary assessment that it is potentially susceptible to landslide hazards. Validation via the online platform (Table 4(i)) did not reveal direct, significant landslide indicators. This suggests that the area may be in the early stage of deformation accumulation, indicating its potential value as a target for early warning and monitoring.
Overall, hazard point C is currently in a creeping deformation stage, presenting identifiable landslide risk despite limited direct optical evidence. Continued monitoring is recommended to assess long-term deformation evolution and implement appropriate preventive measures;
- (4)
- Summary
Through detailed image analyses of landslide hazard points A, B, and C, integrating InSAR deformation monitoring results, optical remote-sensing interpretations, and online platform validation data, this study thoroughly investigated the deformation characteristics, geological conditions, and stability status of each hazard site. The analytical results indicate that InSAR technology demonstrates significant advantages in monitoring ground-deformation rates and identifying deformation areas, enabling the precise quantification of surface displacements and effectively revealing deformation trends. However, in certain areas, due to data decorrelation effects or gaps in interpretation, the accurate delineation of landslide boundaries can be challenging. Therefore, incorporating optical remote-sensing imagery allows clearer delineation of landslide boundaries, intuitive identification of surface-damage features, and provides high-resolution imagery of the deformation zones. This integrated approach facilitates more comprehensive and accurate identification and assessment of potential landslide hazards.
Collectively, the analyses of hazard points A, B, and C indicate that InSAR is particularly effective for monitoring gradual deformation and quantifying landslide movements, whereas optical remote sensing provides superior boundary delineation and morphological characterization. Single-method approaches exhibit inherent limitations; thus, combining both methodologies substantially improves landslide hazard identification and monitoring precision, increasing the reliability of geological hazard early warning systems. This comprehensive remote-sensing approach is scientifically robust, providing valuable technical support for future landslide prevention strategies, risk assessment, and proactive disaster management.
4.3. Time-Series Deformation Analysis of Typical Landslide Hazard Areas
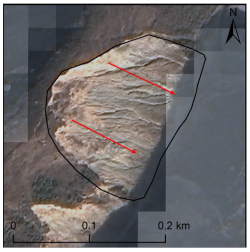
Based on the interpretation results from ascending and descending orbit SAR imagery, one representative landslide hazard site was selected from each dataset for time-series deformation analysis. Using InSAR-derived displacement data from multiple observation points, the temporal deformation characteristics of the hazard zones were evaluated.
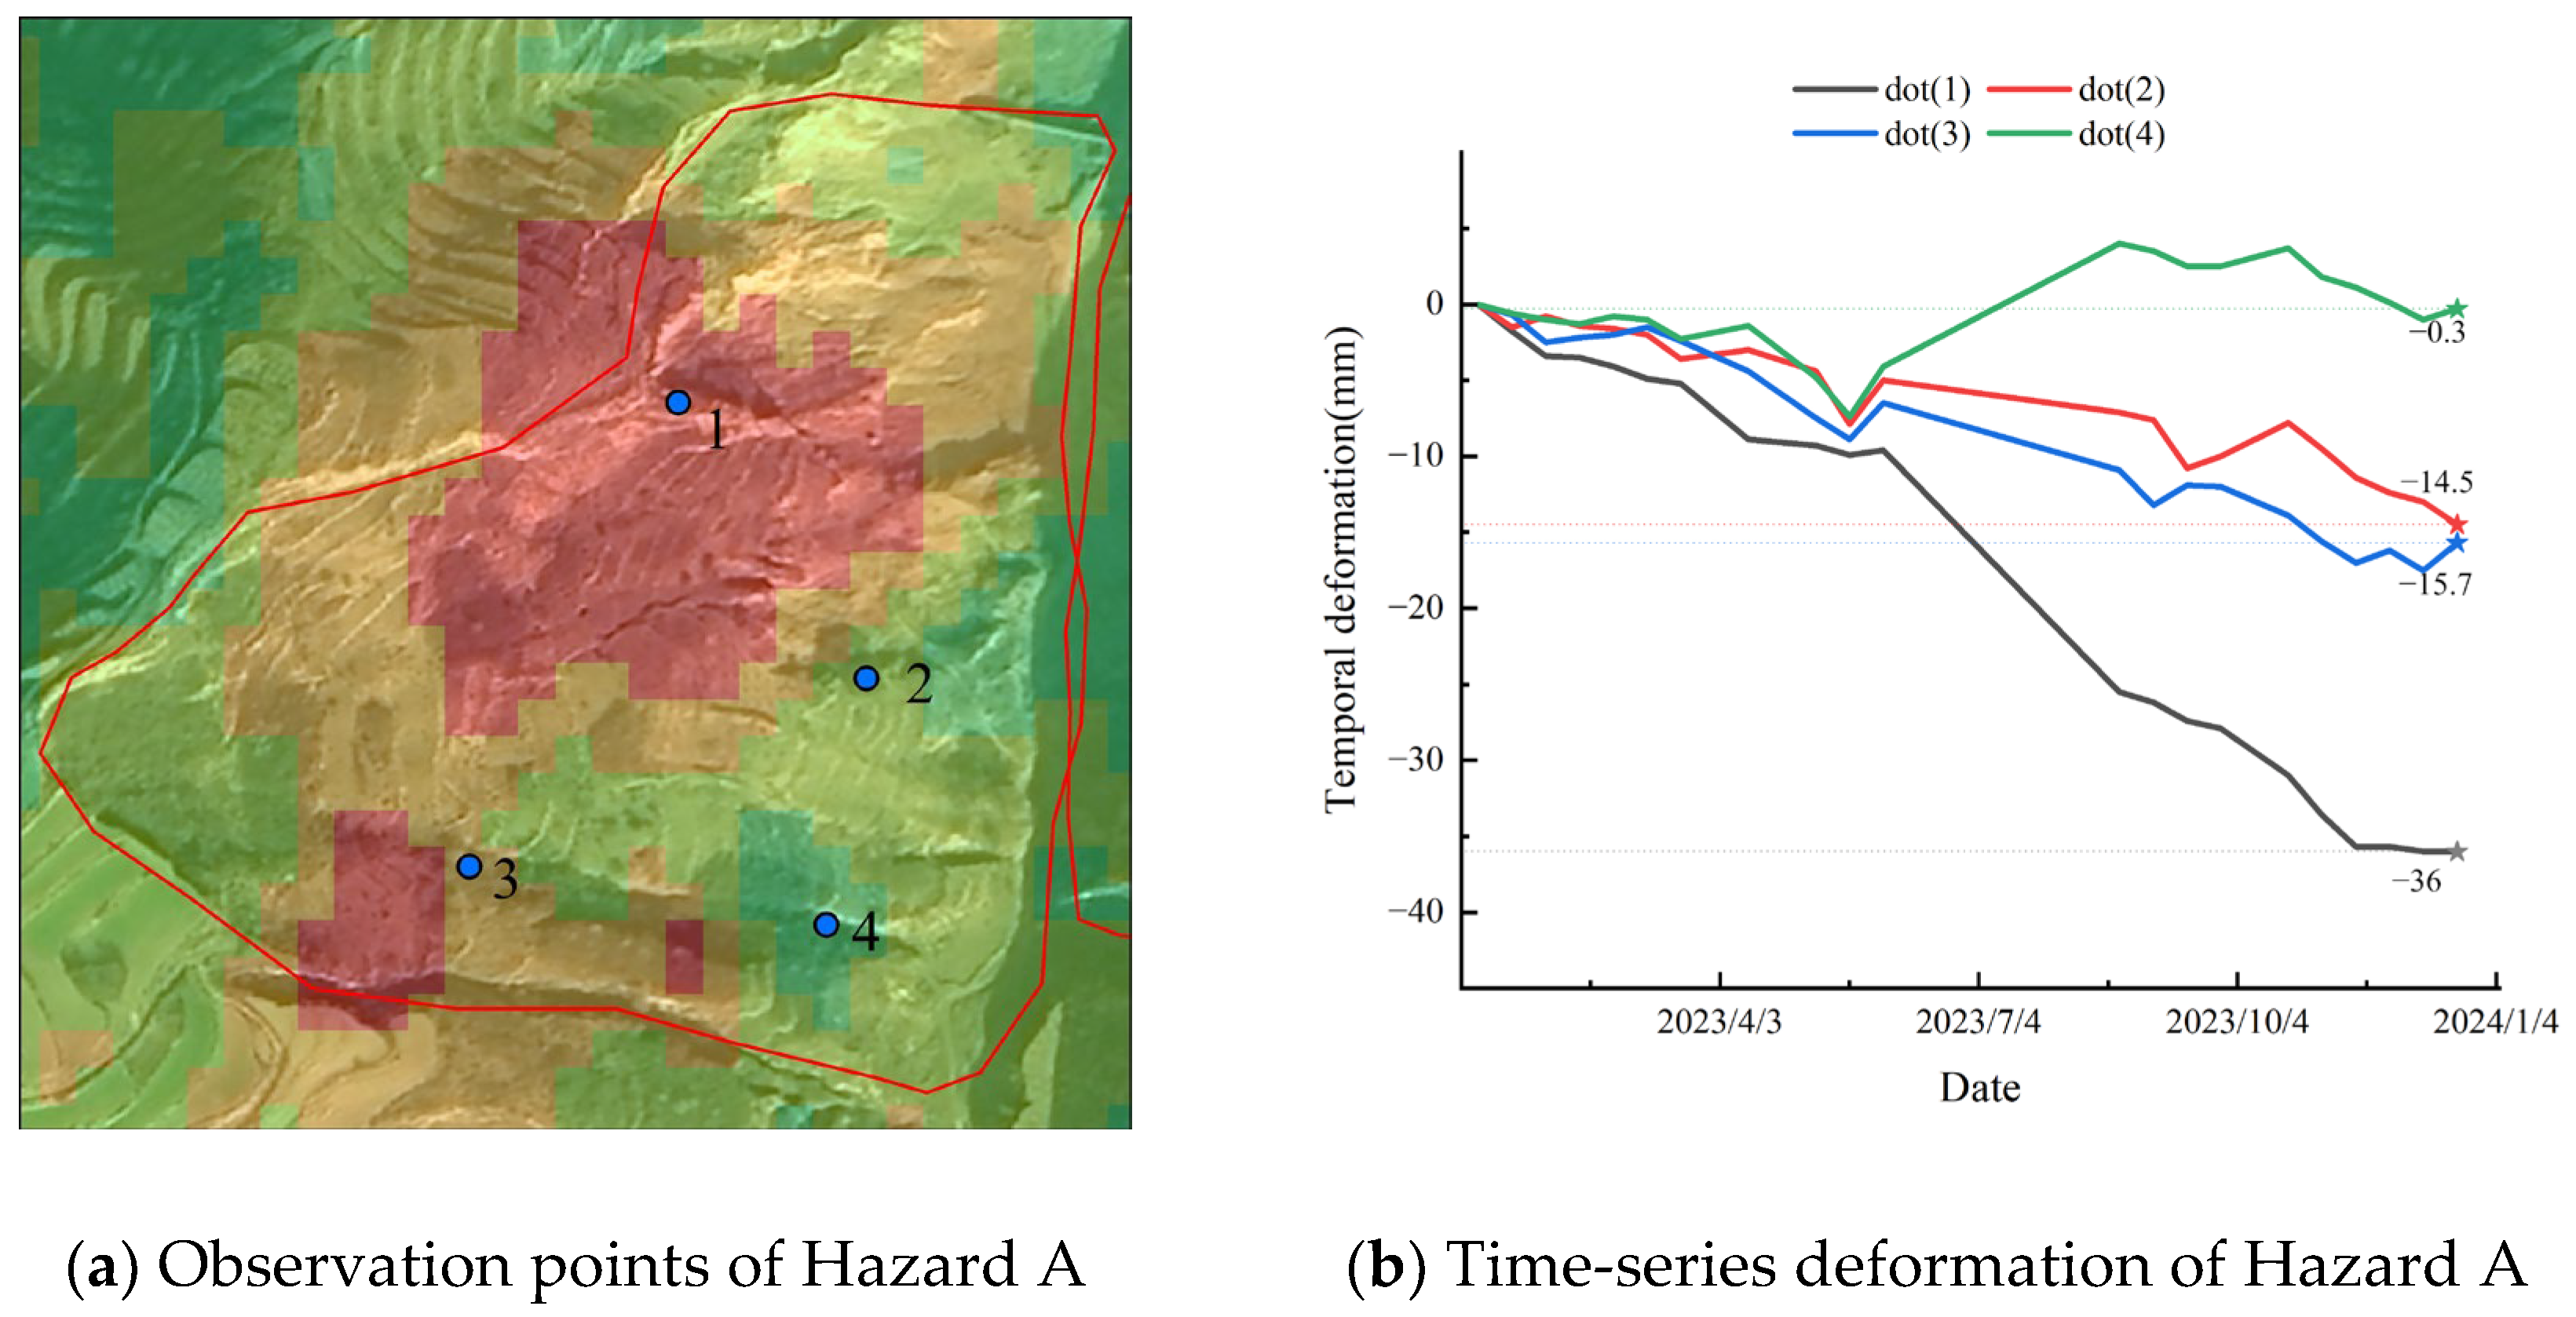
Landslide Hazard Point A was identified through the comprehensive interpretation of ascending orbit SAR data. Four deformation observation points were selected within this area for time-series analysis. As shown in Figure 8a,b, significant surface deformation occurred in the northern part of the delineated area during 2023, with the maximum cumulative displacement reaching −36 mm. Notably, visible landslide tension cracks were observed along the rear edge of the northern slope. In contrast, the southern portion exhibited minimal displacement and remained relatively stable throughout the year.
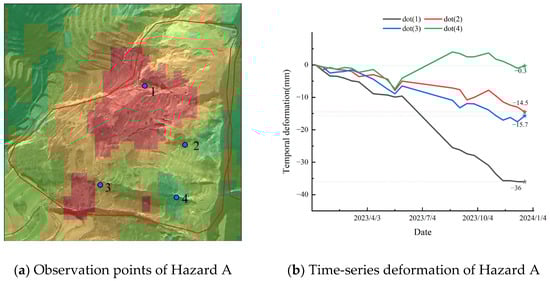
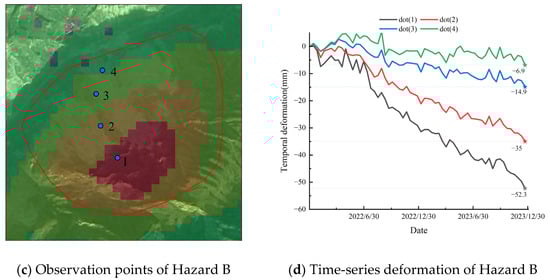
Figure 8.
Time series analysis of typical landslide hazards. In Figures (b,d), the colored lines correspond to the legend dot (1, 2, 3, 4), representing the cumulative displacement at different points.
Landslide Hazard Point B was interpreted from the descending orbit SAR data. Similarly, four deformation observation points were selected for time-series analysis in this region. The results indicate that, between 2022 and 2023, the rear edge of the landslide-prone area experienced substantially greater displacement than the frontal accumulation zone, with a maximum cumulative deformation of −52.3 mm. The deformation was observed to gradually propagate outward from the central portion of the rear edge. Given the continuous deformation trend, it is recommended that this area will be subject to regular monitoring and hazard reassessment, as illustrated in Figure 8c,d.
4.4. Spatial Characteristic Analysis of Landslide Hazards
To gain deeper insights into the spatial distribution characteristics of landslide hazards, this study utilized the ArcGIS spatial analysis platform to systematically examine the relationship between the identified landslide hazard points and key geo-environmental factors within the study area [37]. The main influencing factors analyzed include lithology, slope gradient, slope aspect, and distance to river channels.
- (1)
- Influence of Slope Gradient on Landslide Hazards
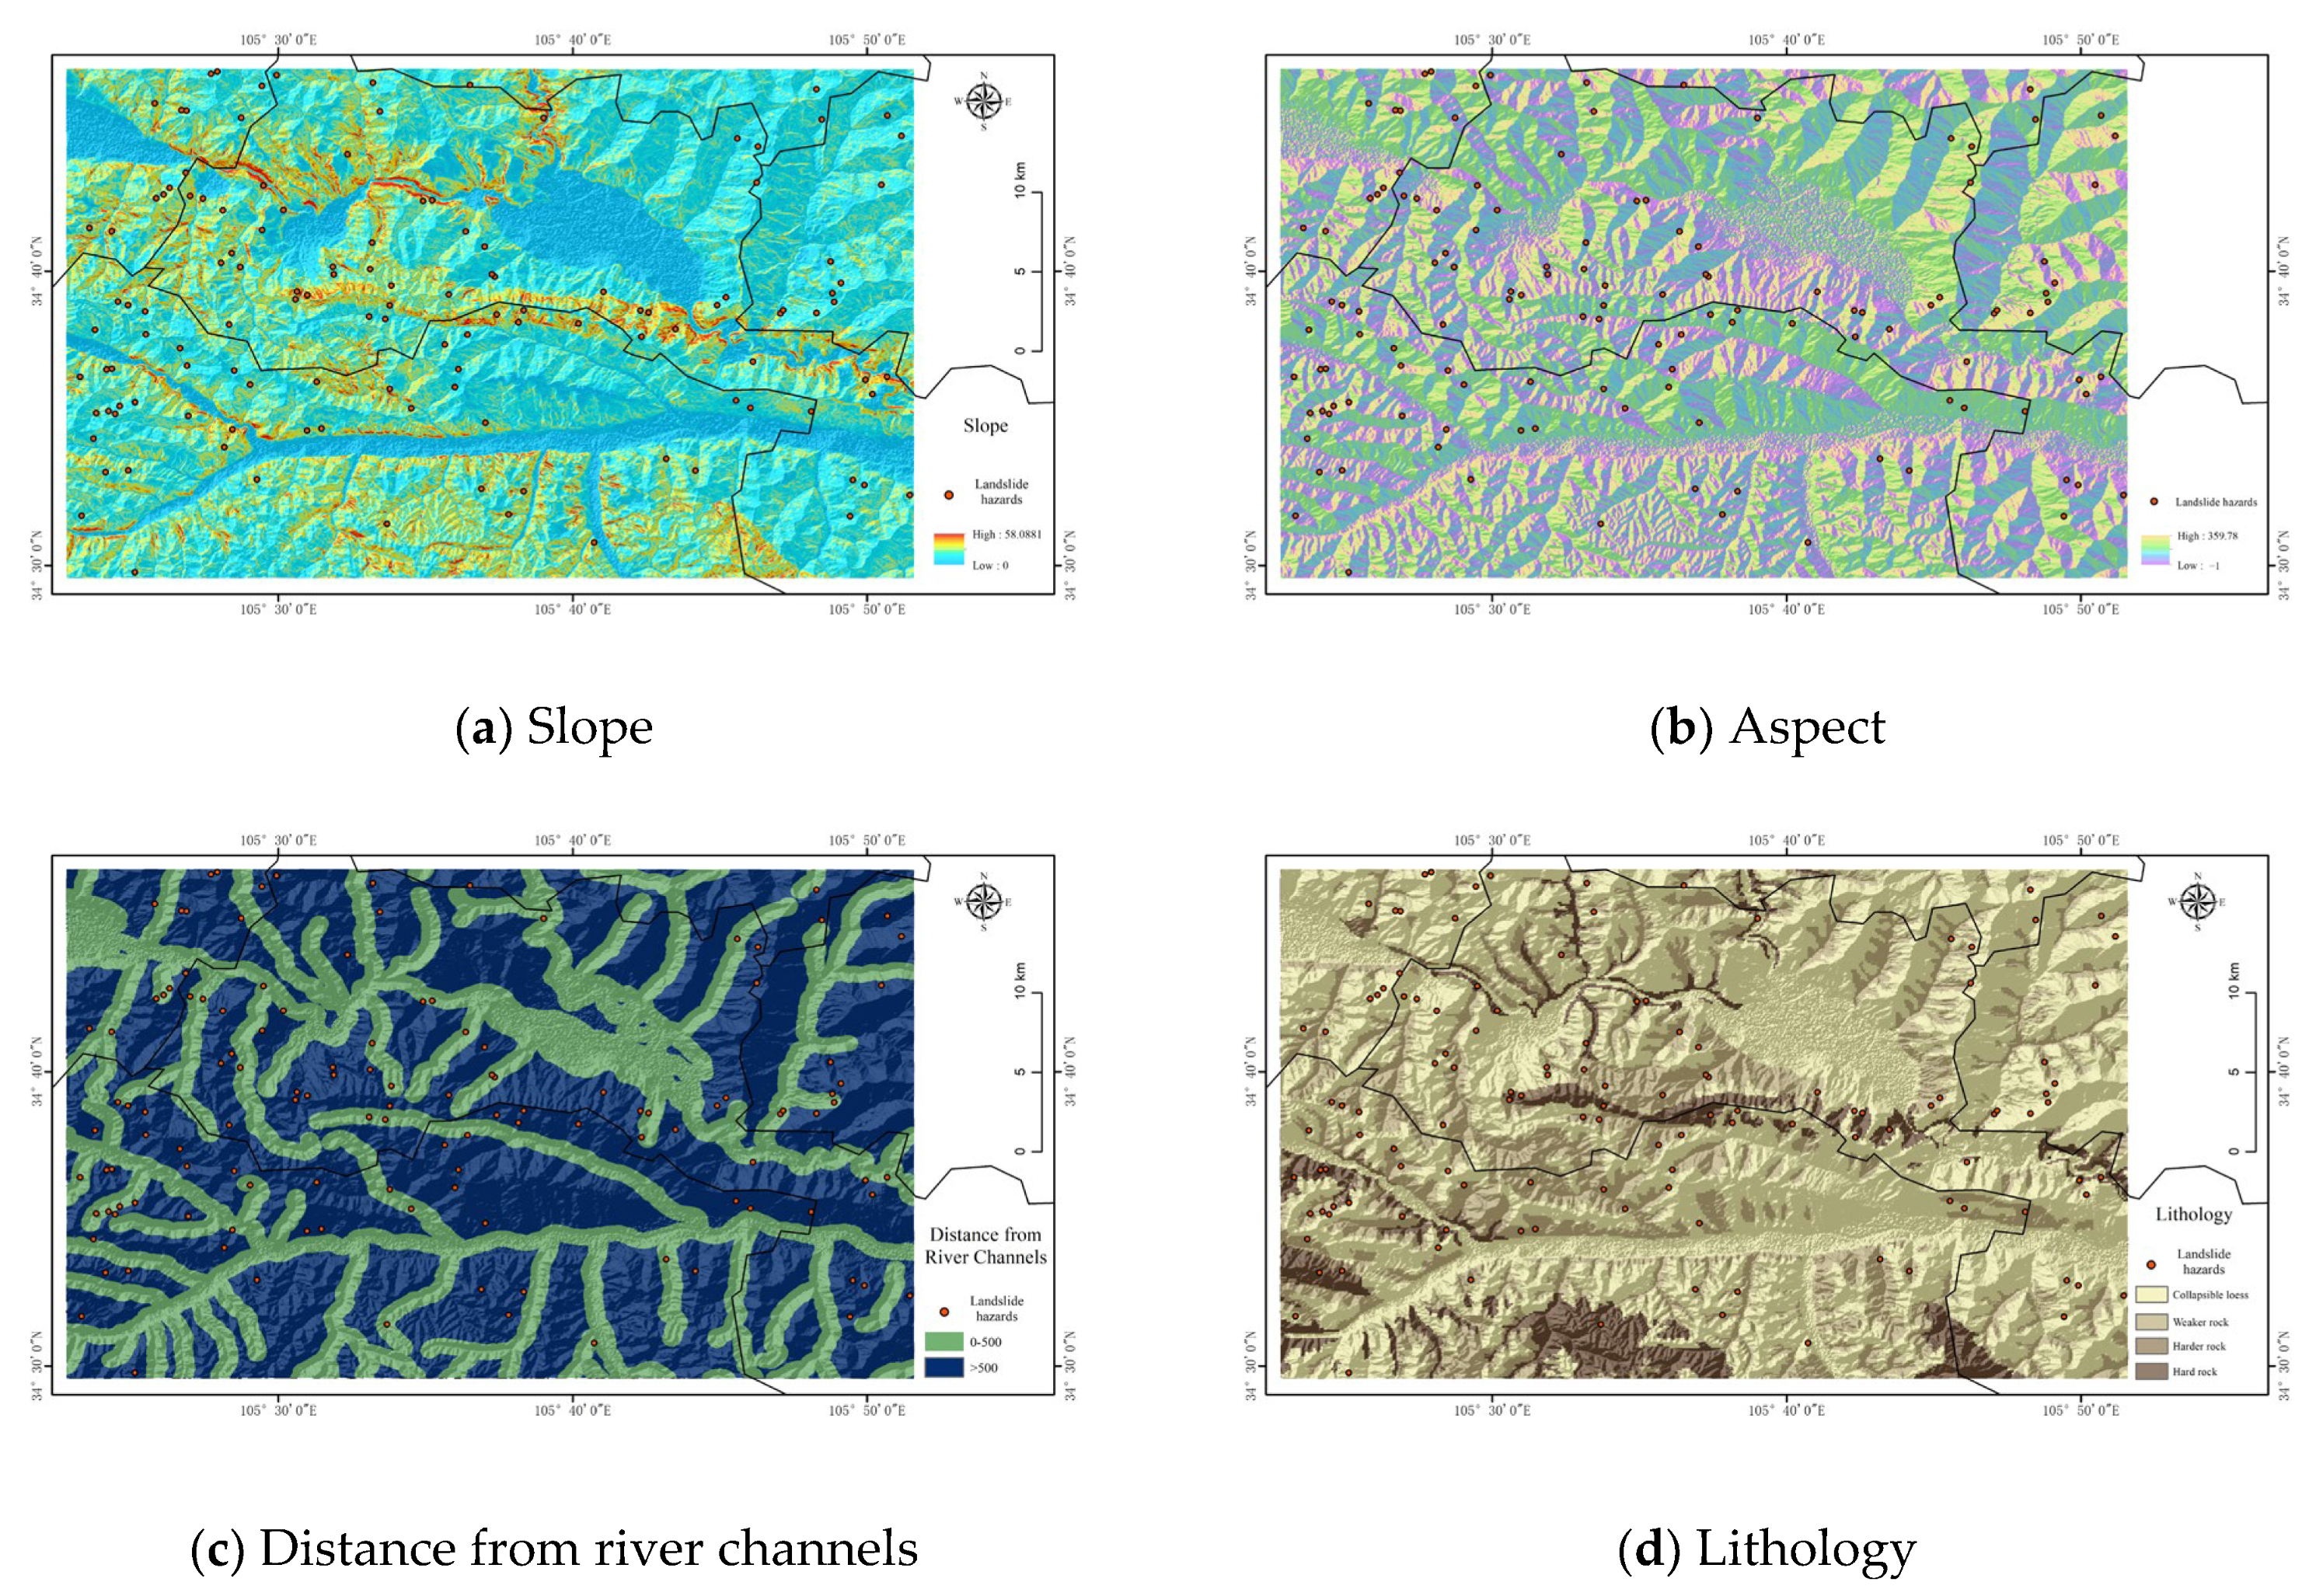
Slope gradient is a crucial topographic parameter reflecting terrain undulation and it plays a key role in landslide occurrence. The slope values were categorized into multiple intervals, and the results show that 118 landslide hazard points (accounting for 84.25% of the total) were identified within the slope range of 5°~25°. This indicates that gentle to moderate slopes are more prone to landslides, as they provide sufficient gravitational driving force while facilitating moisture retention, thereby reducing the shear strength of soil and triggering slope failures (Figure 9a);
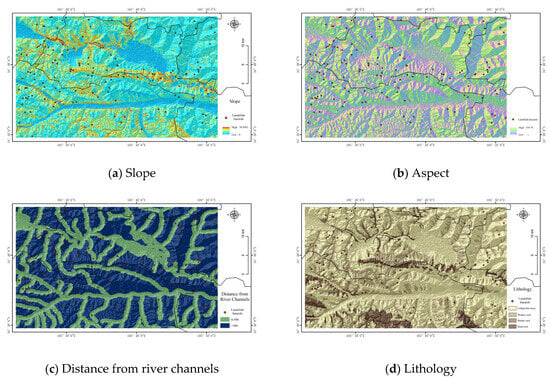
Figure 9.
Key geo-environmental factors. These factors are the primary contributors to landslide hazards and play an indispensable role in the spatial analysis of potential landslide occurrences.
- (2)
- Relationship Between Slope Aspect and Landslide Susceptibility
Slope aspect directly affects rainfall interception, solar radiation exposure, and vegetation growth, which in turn influence slope stability. In this study, slope aspect was classified into eight principal directional categories. Statistical analysis reveals that 71 landslide hazard points (58.28% of the total) are concentrated on north-facing slopes (north, northeast, and northwest). This suggests that these slopes, receiving less sunlight and exhibiting higher moisture content, are more susceptible to landslide initiation (Figure 9b);
- (3)
- Correlation Between Landslide Hazards and River Proximity
Rivers often exert an erosional force that destabilizes adjacent slopes. The distance from rivers was divided into two intervals, and 42 hazard points (33.07% of the total) were identified within 0–500 m of river channels. While most landslide hazards are not situated directly adjacent to rivers, fluvial erosion remains a critical factor, particularly during heavy summer rainfall, which increases the susceptibility of riverbanks to seepage and hydraulic scouring. (Figure 9c);
- (4)
- Lithological Control on Landslide Hazard Distribution
Lithology serves as a fundamental geological factor governing slope stability. In this study, the lithological units were classified into four types: collapsible loess, weak rock, moderately strong rock, and hard rock. Through spatial overlay analysis between hazard points and lithological classes, it was found that 63 hazard points (49.6% of the total) are located within areas of collapsible loess. This indicates that collapsible loess, due to its loose structure, water-induced softening, and low bearing capacity, is highly susceptible to slope failure. In contrast, hazard points are significantly less frequent in regions composed of stronger or harder rock, demonstrating higher slope stability (Figure 9d).
In summary, the spatial distribution of landslide hazards in the study area is strongly influenced by environmental sensitivity factors. As shown in Table 5, the potential landslide hazard points are primarily associated with collapsible loess, slopes ranging between 5° and 25°, north-facing aspects, and proximity to river channels and fault lines. The interaction of these factors contributes to the formation of typical landslide-prone zones within the region. The quantitative analysis of these key variables not only provides a theoretical basis for the identification of landslide hazard points but also offers scientific support for subsequent susceptibility assessments and the development of risk mitigation strategies.
Table 5.
Summary table of spatial characteristics of potential landslide hazard points.
5. Discussion
This study employed an integrated remote-sensing identification approach to systematically detect landslide hazards in the central region of Tianshui City. By collaboratively interpreting multi-source remote-sensing data, a total of 127 potential landslide hazard points were identified. Given that the study area is located in the Loess Plateau with highly variable terrain that lacks ground-based monitoring stations, the accuracy of the InSAR detection results may have been affected. To address this limitation, the study conducted cross-validation using ascending and descending SAR datasets, and further incorporated high-resolution optical imagery from Google Earth for auxiliary verification, ultimately ensuring the effective identification of landslide hazard points.
The results indicate that the integrated remote-sensing method not only improves the efficiency of landslide hazard identification but also significantly reduces interpretation errors. From the perspective of landslide-formation mechanisms, optical remote sensing relies primarily on geomorphological features and slope-failure indicators, typically identifying landslide deposits or previously occurred landslides that tend to be relatively stable or low in activity and thus more concealed. In contrast, InSAR technology detects subtle ground deformations over specific time intervals, allowing for the identification of slowly deforming potential landslide bodies and compensating for the limitations of optical imagery in early-stage detection. During the initial stage of landslide evolution, when surface disturbances are not yet clearly visible, optical imagery may fail to capture distinct features, and therefore cannot be solely relied upon to validate InSAR results. The two methods are complementary in their strengths. Therefore, in engineering construction and geohazard mitigation efforts in Tianshui, the combined application of InSAR and optical remote sensing is essential for improving both the comprehensiveness and accuracy of landslide hazard identification, providing a solid scientific foundation for informed decision-making and risk management.
6. Conclusions
Although multi-source remote-sensing techniques have been widely applied to landslide hazard identification, research on concealed landslide hazards in areas characterized by loess cover, complex terrain, and limited field data remains insufficient. To address this gap, this study focuses on the central region of Tianshui City, Gansu Province, and proposes a comprehensive remote-sensing identification approach that integrates InSAR-based deformation monitoring with optical remote-sensing interpretation. By comparing multi-source interpretation results and validating them using high-resolution Google Earth imagery, a total of 146 potential landslide hazard points were initially identified. After careful correction and validation, 127 points were confirmed, resulting in a relatively complete landslide hazard inventory.
The main findings of this study include: (1) using this integrated remote-sensing method, a total of 127 concealed landslide hazard points were confirmed, with a validation accuracy of 86.99% based on Google Earth imagery; (2) InSAR and optical remote-sensing techniques are complementary: InSAR is suitable for detecting slow-moving or latent landslides, while optical imagery excels at identifying morphological features of occurred landslides; (3) landslide hazards in the study area exhibit significant hydrological driving characteristics, primarily triggered by river erosion or intense rainfall, and are closely related to the widespread distribution of loose loess strata; and (4) the proposed method significantly improves both the accuracy and spatial coverage of hazard identification, effectively addressing the limitations of single-source remote sensing.
One limitation of this study lies in the absence of large-scale field monitoring data, which may hinder the identification of landslides in areas with dense vegetation or image shadows. Nevertheless, the general consistency between InSAR and optical remote-sensing results, supported by terrain and geological analysis, demonstrates the feasibility of this approach for early landslide identification and hazard assessment. The findings hold important engineering significance and provide technical support for early warning, disaster prevention, and spatial planning in landslide-prone areas of the Loess Plateau. Future work should further integrate deformation time-series analysis and real-time rainfall data to enhance the predictive capacity and intelligence level of landslide monitoring systems.
Author Contributions
Methodology, L.Z.; Validation, T.Y.; Investigation, Y.X.; Data curation, Y.Z.; Writing—original draft, J.M.; Writing—review & editing, Q.S. All authors have read and agreed to the published version of the manuscript.
Funding
This research was funded by China Ningxia Hui Autonomous Region key research and development project (Grant Number: 2024BEG01005). and Cooperation and Exchange Program of the Science and Technology Department of Shanxi Province (Grant Number: 202304041101051).
Data Availability Statement
The original contributions presented in this study are included in the article. Further inquiries can be directed to the corresponding author.
Conflicts of Interest
The authors declare no conflict of interest.
References
- Xu, Q.; Tang, M.; Xu, K.; Huang, X. Research on Space-Time Evolution Laws and Early Warning-Prediction of Landslides. Chin. J. Rock Mech. Eng. 2008, 27, 1104–1112. [Google Scholar]
- Xu, Q.; Lu, H.; Li, W.; Dong, X.; Guo, C. Types of Potential Landslide and Corresponding Identification Technologies. Geomat. Inf. Sci. Wuhan Univ. 2022, 47, 377–387. [Google Scholar] [CrossRef]
- Chen, Y.; He, X.; Xu, C.; Huang, Y.; Zhang, P.; Luo, Z.; Zhan, T. Development Characteristics and Causes of a Fatal Landslide Occurred in Shuicheng, Guizhou Province, China. ISPRS Int. J. Geo-Inf. 2022, 11, 119. [Google Scholar] [CrossRef]
- Wu, M.; Li, A.; Li, Z.; Chen, N.; Tian, S.; Hou, R.; Habumugisha, J.M.; Huang, N. Frost-Heaving May Triggered the Catastrophic Landslide in Zhenxiong on 22 January 2024. Landslides 2025, 22, 1153–1166. [Google Scholar] [CrossRef]
- Xu, Q.; Dong, X.; Li, W. Integrated Space-Air-Ground Early Detection, Monitoring and Warning System for Potential Catastrophic Geohazards. Geomat. Inf. Sci. Wuhan Univ. 2019, 44, 957–966. [Google Scholar] [CrossRef]
- Lu, Y.; Xu, H.; Wang, C.; Yan, G.; Huo, Z.; Peng, Z.; Liu, B.; Xu, C. A Novel Strategy Coupling Optimised Sampling with Heterogeneous Ensemble Machine-Learning to Predict Landslide Susceptibility. Remote Sens. 2024, 16, 3663. [Google Scholar] [CrossRef]
- Sun, Y.; Zhang, E.; Lu, H.; Wang, X.; Zhang, C. Research on “Point-Surface” Collaborative Recognition Technology of Comprehensive Remote Sensing for Hidden Landslide Hazards. Remote Sens. Nat. Resour. 2024, 34, 224–230. [Google Scholar]
- Zhang, L.; He, J.; Yang, Q.; Xiao, Y.; Yuan, Q. Data-Driven Multi-Source Remote Sensing Data Fusion: Progress and Challenges. Acta Geod. Cartogr. Sin. 2022, 51, 1317. [Google Scholar] [CrossRef]
- Jia, H.; Wang, Y.; Ge, D.; Deng, Y.; Wang, R. InSAR Study of Landslides: Early Detection, Three-Dimensional, and Long-Term Surface Displacement Estimation—A Case of Xiaojiang River Basin, China. Remote Sens. 2022, 14, 1759. [Google Scholar] [CrossRef]
- Yang, X.; Chen, D.; Dong, Y.; Xue, Y.; Qin, K. Identification of Potential Landslide in Jianzha County Based on InSAR and Deep Learning. Sci. Rep. 2024, 14, 21346. [Google Scholar] [CrossRef]
- Wu, M.; Luo, M.; Liu, S. Comprehensive Identification of Potential and Old Landslides Based on Optical Remote Sensing and InSAR Technologies: A Case Study in Northwestern Yunnan Province. Chin. J. Geol. Hazard Control 2022, 33, 84–93. [Google Scholar] [CrossRef]
- Dai, C.; Li, W.; Lu, H.; Zhang, S. Landslide Hazard Assessment Method Considering the Deformation Factor: A Case Study of Zhouqu, Gansu Province, Northwest China. Remote Sens. 2023, 15, 596. [Google Scholar] [CrossRef]
- Yao, J.; Yao, X.; Liu, X. Identification and Analysis of Active Landslide Disaster in Tianshui City Using InSAR Technology. Sci. Surv. Mapp. 2022, 47, 121–132. [Google Scholar] [CrossRef]
- Peng, J.; Wang, Q.; Zhuang, J.; Leng, Y.; Fan, Z.; Wang, S. Dynamic Formation Mechanism of Landslide Disaster on the Loess Plateau. J. Geomech. 2020, 26, 714–730. [Google Scholar] [CrossRef]
- Zhang, X.; Su, Q.; Zhao, C.; Zhu, Y.; Li, K.; Fan, J.; Bai, D. A Landslide Susceptibility Evaluation Method Using Bayesian Algorithm to Optimize XGBoost. Sci. Surv. Mapp. 2023, 48, 140–150. [Google Scholar] [CrossRef]
- Yan, T.; Zhang, J.; Zhu, Y.; Liu, H.; Zhu, H. Application of Incremental Learning in Landslide Susceptibility Assessment: A Case Study of Tianshui, Gansu Province. Geol. Bull. China 2024, 43, 630–640. [Google Scholar] [CrossRef]
- Qi, T.; Zhao, Y.; Meng, X.; Shi, W.; Qing, F.; Chen, G.; Zhang, Y.; Yue, D.; Guo, F. Distribution Modeling and Factor Correlation Analysis of Landslides in the Large Fault Zone of the Western Qinling Mountains: A Machine Learning Algorithm. Remote Sens. 2021, 13, 4990. [Google Scholar] [CrossRef]
- Tian, Y.; Yang, W.; Huang, X.; Liu, T.; Li, H.; Xiang, L.; Cheng, X. Distribution Characteristics and Inducing Factors of Loess Landslide in Maiji Mappable Unit, Tianshui. J. Geomech. 2016, 22, 25–38. [Google Scholar]
- Ling, X.; Zhu, Y.; Ming, D.; Chen, Y.; Zhang, L.; Du, T. Feature Engineering of Geohazard Susceptibility Analysis Based on the Random Forest Algorithm: Taking Tianshui City, Gansu Province, as an Example. Remote Sens. 2022, 14, 5658. [Google Scholar] [CrossRef]
- Shao, X.; Ma, S.; Xu, C.; Xu, Y. Insight into the Characteristics and Triggers of Loess Landslides during the 2013 Heavy Rainfall Event in the Tianshui Area, China. Remote Sens. 2023, 15, 4304. [Google Scholar] [CrossRef]
- Liu, X.; Zhao, C.; Zhang, Q.; Peng, J.; Zhu, W.; Lu, Z. Multi-Temporal Loess Landslide Inventory Mapping with C-, X- and L-Band SAR Datasets—A Case Study of Heifangtai Loess Landslides, China. Remote Sens. 2018, 10, 1756. [Google Scholar] [CrossRef]
- Zhang, R.; Zhao, X.; Dong, X.; Dai, K.; Deng, J.; Zhuo, G.; Yu, B.; Wu, T.; Xiang, J. Potential Landslide Identification in Baihetan Reservoir Area Based on C-/L-Band Synthetic Aperture Radar Data and Applicability Analysis. Remote Sens. 2024, 16, 1591. [Google Scholar] [CrossRef]
- Yang, Z.Y.; Han, I.Y.; Zheng, X.X.; Li, W.J.; Feng, L.; Wang, Y.; Yang, Y.P. Landslide Identification Using Remote Sensing Images and DEM Basedon Convolutional Neural Network: A Case Study of Loess Landslide. Remote Sens. Nat. Resour. 2022, 34, 224–230. [Google Scholar] [CrossRef]
- Ju, Y.; Xu, Q.; Jin, S.; Li, W.; Dong, X.; Guo, Q. Automatic Object Detection of Loess Landslide Based on Deep Learning. Geomat. Inf. Sci. Wuhan Univ. 2020, 45, 1747–1755. [Google Scholar] [CrossRef]
- Li, L.; Zhang, Y.; Hou, Y.; Han, B.; An, N.; Zhang, H.; Ma, Y. Identification and Hazard Analysis of Landslides Triggered by Earthquakes and Rainfall. Earthq. Res. Adv. 2024, 4, 100272. [Google Scholar] [CrossRef]
- Zhong, J.; Li, Q.; Zhang, J.; Luo, P.; Zhu, W. Risk Assessment of Geological Landslide Hazards Using D-InSAR and Remote Sensing. Remote Sens. 2024, 16, 345. [Google Scholar] [CrossRef]
- Zhang, J.; Zuo, X.; Zhu, D.; Li, Y.; Liu, X. Long-Term Monitoring of Landslide Activity in a Debris Flow Gully Using SBAS-InSAR: A Case Study of Shawan Gully, China. Remote Sens. 2025, 17, 1580. [Google Scholar] [CrossRef]
- Xue, Z.; Zhao, S.; Zhang, B. Study on Soil Freeze–Thaw and Surface Deformation Patterns in the Qilian Mountains Alpine Permafrost Region Using SBAS-InSAR Technique. Remote Sens. 2024, 16, 4595. [Google Scholar] [CrossRef]
- Guo, J.; Xi, W.; Yang, Z.; Shi, Z.; Huang, G.; Yang, Z.; Yang, D. Landslide Hazard Susceptibility Evaluation Based on SBAS-InSAR Technology and SSA-BP Neural Network Algorithm: A Case Study of Baihetan Reservoir Area. J. Mt. Sci. 2024, 21, 952–972. [Google Scholar] [CrossRef]
- Liu, M.; Yang, Z.; Xi, W.; Guo, J.; Yang, H. InSAR-Based Method for Deformation Monitoring of Landslide Source Area in Baihetan Reservoir, China. Front. Earth Sci. 2023, 11, 1253272. [Google Scholar] [CrossRef]
- Yang, Y.; Xu, Q.; Xie, L.; Xu, Q.; Hu, J.-C.; Chen, Q. Landslide Thickness Estimated from InSAR-Derived 2D Deformation: Application to the Xiongba Ancient Landslide, China. Remote Sens. 2024, 16, 4689. [Google Scholar] [CrossRef]
- Xu, Q.; Hu, J.; Cui, W.; Liu, S.; Hu, D.; Ning, F.; Li, M. Identification of Landslide Hazards of Beipanjiang Guangzhao Hydropower Station Based on Lutan-1 SAR Satellite. Bull. Surv. Mapp. 2025, 71–75, 132. [Google Scholar] [CrossRef]
- Shan, B.; Qi, J.; Tian, W.; Zhu, K.; Jin, T.; Yang, Q.; An, X.; Yang, G.; Hu, Q.; Cao, C. Early Identification of Geological Hazards Along the Power Transmission Line in Weinan Based on SBAS-InSAR. Appl. Sci. 2025, 15, 920. [Google Scholar] [CrossRef]
- Dai, M.; Li, H.; Long, B.; Wang, X. Quantitative Identification of Landslide Hazard in Mountainous Open-Pit Mining Areas Combined with Ascending and Descending Orbit InSAR Technology. Landslides 2024, 21, 2975–2991. [Google Scholar] [CrossRef]
- He, L.; Wu, X.; He, Z.; Xue, D.; Bai, W.; Kang, G.; Chen, X.; Zhang, Y. Landslide Identification and Deformation Monitoring Analysis in Xining City Based on the Time Series InSAR of Sentinel-1A with Ascending and Descending Orbits. Bull. Eng. Geol. Environ. 2024, 83, 255. [Google Scholar] [CrossRef]
- Wei, Z.; Li, Y.; Dong, J.; Cao, S.; Ma, W.; Wang, X.; Wang, H.; Tang, R.; Zhao, J.; Liu, X.; et al. The Identification and Influence Factor Analysis of Landslides Using SBAS-InSAR Technique: A Case Study of Hongya Village, China. Appl. Sci. 2024, 14, 8413. [Google Scholar] [CrossRef]
- Luu, C.; Ha, H.; Thong Tran, X.; Ha Vu, T.; Duy Bui, Q. Landslide Susceptibility and Building Exposure Assessment Using Machine Learning Models and Geospatial Analysis Techniques. Adv. Space Res. 2024, 74, 5489–5513. [Google Scholar] [CrossRef]


Disclaimer/Publisher’s Note: The statements, opinions and data contained in all publications are solely those of the individual author(s) and contributor(s) and not of MDPI and/or the editor(s). MDPI and/or the editor(s) disclaim responsibility for any injury to people or property resulting from any ideas, methods, instructions or products referred to in the content. |
© 2025 by the authors. Licensee MDPI, Basel, Switzerland. This article is an open access article distributed under the terms and conditions of the Creative Commons Attribution (CC BY) license (https://creativecommons.org/licenses/by/4.0/).