Article

Remote Real-Time Monitoring and Control of Small Wind Turbines Using Open-Source Hardware and Software

by
Jesus Clavijo-Camacho
*,
Gabriel Gomez-Ruiz
,
Reyes Sanchez-Herrera
and
Nicolas Magro
Research Centre CITES, University of Huelva, 21007 Huelva, Spain
*
Author to whom correspondence should be addressed.
Appl. Sci. 2025, 15(12), 6887; https://doi.org/10.3390/app15126887
Submission received: 6 May 2025 / Revised: 14 June 2025 / Accepted: 16 June 2025 / Published: 18 June 2025

Abstract

:
This paper presents a real-time remote-control platform for small wind turbines (SWTs) equipped with a permanent magnet synchronous generator (PMSG). The proposed system integrates a DC–DC boost converter controlled by an Arduino® microcontroller, a Raspberry Pi® hosting a WebSocket server, and a desktop application developed using MATLAB® App Designer (version R2024b). The platform enables seamless remote monitoring and control by allowing upper layers to select the turbine’s operating mode—either Maximum Power Point Tracking (MPPT) or Power Curtailment—based on real-time wind speed data transmitted via the WebSocket protocol. The communication architecture follows the IEC 61400-25 standard for wind power system communication, ensuring reliable and standardized data exchange. Experimental results demonstrate high accuracy in controlling the turbine’s operating points. The platform offers a user-friendly interface for real-time decision-making while ensuring robust and efficient system performance. This study highlights the potential of combining open-source hardware and software technologies to optimize SWT operations and improve their integration into distributed renewable energy systems. The proposed solution addresses the growing demand for cost-effective, flexible, and remote-control technologies in small-scale renewable energy applications.

1. Introduction

The global transition towards a sustainable energy system is a cornerstone of international efforts to combat climate change and reach net-zero emissions by 2050 [1]. Distributed generation (DG), characterized by small-scale energy systems located near consumption points, has emerged as a critical enabler of this transition [2,3]. Within the European Union (EU), ambitious policies such as the Renewable Energy Directive [4] and the Green Deal [5] have reinforced the adoption of DG, with member states targeting substantial increases in renewable energy shares in the electricity mix. These initiatives emphasize the role of distributed renewable systems, such as solar photovoltaics and small wind turbines (SWTs), in supporting grid decarbonization and enhancing energy resilience.
To meet the evolving requirements of modern power systems, DG units must not only generate clean energy but also contribute to ancillary services [6]. This includes capabilities such as voltage support [7], frequency regulation [8], and power reserve [9], traditionally dominated by large-scale generators. SWTs, equipped with advanced control systems, are increasingly viewed as viable contributors to ancillary services. By operating in Maximum Power Point Tracking (MPPT) mode or maintaining a power reserve, these systems can adapt dynamically to grid demands, thereby supporting grid stability and reliability [10,11,12].
However, the integration of SWTs into ancillary service frameworks presents significant challenges, particularly in terms of real-time monitoring, remote control, and operational flexibility. The small size and distributed nature of these systems often necessitate low-cost, scalable solutions that ensure seamless communication and precise control. Open-source technologies, such as Arduino® microcontrollers and Raspberry Pi® platforms, have emerged as promising candidates for addressing these challenges due to their affordability and versatility.
In this context, this study proposes a novel platform for the remote control of SWTs, enabling real-time adjustments to operating points based on grid requirements and environmental conditions. The platform incorporates an Arduino®-controlled DC–DC boost converter, a Raspberry Pi®-hosted WebSocket server for data transmission, and a desktop application developed using MATLAB®’s App Designer for user-friendly interaction. This approach bridges the gap between emerging DG regulatory requirements and the technological capabilities of small-scale renewable energy systems, offering a robust framework for their integration into modern power grids.

1.1. State of the Art

Recent years have seen extensive research into real-time Supervisory Control and Data Acquisition (SCADA) solutions for pilot plants in general [13], and SWTs under 100 kW in particular, especially when integrated into hybrid microgrids. Many groups have demonstrated low-cost, open-hardware platforms for remote monitoring and control of SWTs. For example, Bradney et al. [14] developed a multi-channel data acquisition system using Arduino® microcontrollers to capture the turbine’s performance with high speed and fidelity. Open-source controllers―such as Arduino® (Arduino SA, Lugano, Switzerland), Raspberry Pi® (Raspberry Pi Foundation, Cambridge, UK), and ESP8266-based nodes (Espressif Systems, Shanghai, China)—are widely used in small wind installations to interface with sensors (e.g., wind speed, voltage, current, vibration) and actuators (e.g., pitch control, braking systems). Chaudhari [15] retrofitted a wind–solar–diesel–battery microgrid with a Raspberry Pi®-based Internet of Thing (IoT) gateway that continuously logs wind turbine data and publishes it to a cloud dashboard. Similarly, Ermeey et al. [16] developed a vertical-axis wind turbine monitoring system using an Arduino® with a web-based digital dashboard, enabling real-time monitoring of power output and generator conditions over the internet. These open platforms [17] offer significantly lower implementation costs while providing the flexibility to integrate custom control algorithms and communication protocols. To enable remote, real-time operation, researchers have adopted lightweight IoT communication protocols [18]. MQTT (Message Queuing Telemetry Transport) has been used to collect and transmit sensor data from SWTs to remote servers with minimal bandwidth usage. Sasikala et al. [19] implemented an MQTT-based fault monitoring system on an Arduino® Uno for a small turbine, achieving prompt cloud-based detection of anomalies. Recent contributions have also explored advanced time-frequency learning architectures for condition monitoring under time-varying speeds, such as Time–Frequency Self-Similarity Enhancement Network (TFSSEN) [20] and CTNet [21], reinforcing the role of data-driven Condition Monitoring Systems in SWT fault diagnosis.
Other works employ modern web standards. Wiens et al. [22] present an open-source digital twin platform for wind turbines that uses an HTTP/WebSocket API to enable full-duplex, millisecond-level data exchange and control—illustrating the potential of WebSocket technology for interactive turbine management. These internet-enabled systems allow operators to supervise turbine status and send control commands (e.g., start/stop or set-points) remotely in real time. Notably, Li et al. [23] report an IoT-based supervisory system for a doubly-fed induction generator (DFIG) wind turbine, in which real-time measurements are sent to an online controller that dynamically adjusts settings to ride through grid voltage dips. This underscores that, beyond monitoring, remote IoT frameworks are now closing the loop by actively controlling SWT operations to enhance stability and performance. Another research area is the integration of SWTs into hybrid microgrids alongside solar PV, battery banks, and even hydrogen storage [24,25]. These microgrids require coordinated control of multiple sources, often achieved through distributed controllers networked via IoT [26]. Open-source hardware has also demonstrated its capabilities in this context: Cabrera et al. [27] combined an industrial power analyzer with Arduino®-based sensor nodes to monitor a laboratory microgrid (including a 3-kW wind turbine) in real time. In Truong et al.’s [28] experimental microgrid, a SWT and PV array are co-managed by an IoT monitoring program, which balances power flows to a battery and a hydrogen electrolyze. Advanced energy management strategies are implemented on these platforms to maximize renewable utilization—Wang et al. [29] use Model Predictive Control (MPC) to govern a wind–PV–hydrogen microgrid, with the controller receiving telemetry and remotely dispatching setpoints. To maintain system stability, researchers have also explored real-time power curtailment techniques for SWTs in microgrids. Aourir and Locment [10] introduced a “limited power-point tracking” algorithm on a microcontroller to intentionally hold a small turbine slightly below its maximum power output when the battery is full or the DC link is over voltage. This IoT-based curtailment approach, similar to soft-stall control, was experimentally validated using a DC microgrid testbed [30,31]. Likewise, Senanayaka et al. [32] demonstrated a Digital Signal Processor (DSP)-based soft-stall control that automatically feathers a small turbine’s blades at high winds, coordinated through a remote interface. Overall, the literature shows a clear trend toward internet-connected, open-architecture control of small wind systems. Since 2015, the literature has reported successful deployments of web-SCADA and IoT solutions for SWTs in smart grids. These range from small-scale prototypes―e.g., an Arduino®-driven 5 kW test turbine with Wi-Fi data logging―to multi-turbine “wind farm” simulations using wireless sensor networks. The consensus is that such approaches greatly enhance operational awareness, fault diagnosis, and even energy optimization for distributed wind [33]. As an example, a recent open-access implementation by Escudero-Quintero et al. [34] provided a flexible hardware/software toolkit for microgrid research, allowing students to remotely operate a wind/PV off-grid system via a web interface. The maturity of these technologies is further evidenced by field deployments; real-world community microgrids have been outfitted with open-source SCADA for autonomous wind/PV management [35].
A comparative summary of representative technologies—including commercial SCADA platforms, wireless protocols, and custom embedded systems—is provided in Table 1. The proposed system demonstrates unique advantages in modularity, responsiveness, and user-level control flexibility.
To contextualize the contribution of the proposed platform, it is worth highlighting several general limitations observed in existing solutions. First, commercial SCADA systems and Programmable Logic Controller (PLC)-based architecture typically function as “black boxes,” providing little flexibility for user-level customization of control logic or communication protocols, and they often involve high licensing and software development costs. This limits their applicability in experimental or rapidly evolving setups. Second, wireless-based alternatives (e.g., ZigBee, ESP32 with Wi-Fi) are susceptible to signal degradation or communication instability in electromagnetically noisy environments, such as industrial settings. In contrast, the proposed system leverages a wired Local Area Network (LAN), which enhances communication robustness, reduces latency, and ensures deterministic performance—key advantages for supervisory control and real-time signal processing in distributed renewable energy systems.

1.2. Work Contributions

Compared with previous studies, the contributions of this work are summarized below:
  • Development of a complete open-source control and communication system based on Arduino®, Raspberry Pi®, and a WebSocket–MATLAB® interface;
  • Implementation of a custom Printed Circuit Board (PCB) for real-time measurement of voltage, current, and wind speed in SWTs;
  • Full experimental validation of the proposed platform on a functional prototype, with all components integrated and tested;
  • The use of open-source hardware, standard communication protocols, and detailed experimental descriptions ensures high reproducibility of the entire platform.

1.3. Paper Organization

The rest of the paper is organized as follows: Section 2 presents the theoretical framework, detailing the fundamental equations and components that define the energy conversion process in the small wind turbine system. Section 3 describes the measurement, control, and communication architecture, including the custom-designed hardware components, data acquisition, and communication protocols. Section 4 outlines the experimental setup, detailing the laboratory implementation of the monitoring and control platform. Section 5 presents the results from in-lab system testing, followed by a discussion of the experimental outcomes. Finally, Section 6 concludes the paper, summarizing the key findings and highlighting future research directions.

2. Theoretical Framework

This section presents the fundamental equations and components that define the energy conversion process in the proposed small wind energy system. The modelling includes: (i) aerodynamic power extraction by the wind turbine, (ii) AC-to-DC conversion via a passive rectifier, (iii) power regulation through a DC–DC boost converter, and (iv) energy buffering using a Battery Energy Storage System (BESS). The objective is to establish a mathematical and functional description of each stage involved in the transformation of wind energy into regulated electrical power, enabling both maximum power tracking and controlled curtailment.
A schematic overview of the full power conversion system—including the wind turbine, rectifier, boost converter, and battery—is shown in Figure 1.

2.1. Wind Turbine and Generator

The wind turbine extracts kinetic energy from the wind and transforms it into mechanical energy through the rotation of its blades. This mechanical energy is then converted into electrical power by the generator. The power available in the wind P w that crosses the swept area A of the turbine rotor can be described by the following equation:
P w = 1 2 ρ A v 3
where ρ is the air density and v is the wind speed. However, due to aerodynamic limitations, only a portion of this power can be harnessed by the turbine. The actual power extracted P t is determined by the power coefficient C p , which is a function of the tip-speed ratio λ :
P t = 1 2 ρ A v 3 C p ( λ , β )
β is the pitch angle and the tip–speed ratio λ is defined as:
λ = ω R v
where ω is the angular speed of the rotor and R is the radius of the rotor area. In small-scale wind turbines, the pitch angle is typically fixed, so depends solely on λ , reaching its maximum value C p , m a x when the turbine operates at the optimal tip–speed ratio λ o p t . In this scenario, the mechanical torque T t applied to the shaft is:
T t = P t 3 ω
Assuming a direct-drive configuration, the turbine rotor is mechanically coupled to a Permanent Magnet Synchronous Generator (PMSG). The PMSG generates a back-electromotive force proportional to the shaft speed, as expressed by:
E A = K e · ω
where K e is the electromotive force constant. Under steady-state operation and neglecting losses, the electrical power output P e at the generator terminals is approximately equal to the mechanical power P t . In the equivalent electrical circuit of the PMSG per phase [36], it can be seen that the internal voltage source E A is in series with the stator resistance R s and synchronous reactance X s :
V = E a I · ( R s + j X s )
This simplified model links wind speed to electrical power generation, laying the groundwork for control via a DC–DC boost converter, which dynamically adjusts the electrical load to optimize or limit power output.

2.2. Rectifier

The PMSG in SWTs typically delivers a three-phase AC voltage that must be converted to DC before further processing, due to its variable frequency. In the proposed system, this conversion is achieved using a passive three-phase full-bridge rectifier composed of six diodes.
The rectifier outputs a pulsating DC voltage whose average value depends on the generator’s rotational speed. Assuming a balanced and sinusoidal generator voltage with peak line-to-line voltage V L L p e a k , the ideal output voltage of the rectifier can be approximated as:
V D C = 3 3 π V L L p e a k 1.654 V L L p e a k
This rectified voltage is directly proportional to the rotor speed, given the nature of the PMSG. As wind speed varies, so does the output voltage, which in turn defines the operating point of the subsequent boost converter.
Although passive rectification does not allow for power factor correction or bidirectional power flow, it offers high efficiency, low cost, and reliability—features that are well suited for low-to-medium power small wind applications. Additionally, the simplicity of the passive rectifier ensures compatibility with open-source hardware controllers and reduces the complexity of the overall system.
To smooth the voltage ripple at the rectifier output and ensure stable operation of the DC–DC converter, a high-value electrolytic capacitor is placed at the rectifier’s output. The capacitor value is selected based on the expected current draw, the line frequency, and the acceptable voltage ripple. For a three-phase full-wave rectifier with capacitive filtering, the peak-to-peak output voltage ripple V can be approximated by the following equation:
V = I l o a d f C
where I l o a d is the output (load) current, f is the line frequency (for full-wave rectification, the ripple frequency is 2 f , and C is the capacitance value.
This equation shows that increasing the capacitance or ripple frequency reduces the ripple voltage, which is crucial for ensuring stable downstream DC–DC conversion.

2.3. DC–DC Boost Converter and Operation Point

DC–DC boost converter is used to regulate the electrical power output by adjusting the load seen by the SWT. This topology enables the turbine to operate at variable wind speeds while maintaining control over the electrical load, which is essential for both maximum power extraction and power limitation scenarios. The basic operation of the boost converter involves two switching states: when the switch is closed, energy is stored in the inductor; when the switch is opened, the inductor transfers its energy to the output capacitor and load, resulting in a higher output voltage than the input. The ideal steady-state relationship between input and output voltage is given by:
V o u t = V i n 1 D
where V i n is the input voltage (from the rectifier), V o u t is the regulated output voltage, and D is the duty cycle of the switching signal. By adjusting D , the converter modifies the electrical conditions seen by the generator, effectively shifting the operating point of the turbine. A feedback control algorithm implemented on an Arduino® microcontroller continuously regulates this duty cycle based on real-time voltage and current measurements. This allows the system to either:
  • Follow the MPPT trajectory by imposing the optimal voltage corresponding to the best tip–speed ratio, or;
  • Apply Power Curtailment, intentionally limiting output to match grid demands or storage constraints.
This converter therefore acts as the central actuator in the turbine’s energy management system, enabling flexible and dynamic integration of wind energy into microgrids or standalone setups. Its ability to respond rapidly to control references ensures stable operation across a wide range of wind conditions.

2.4. Battery Energy Storage System

To stabilize the DC voltage at the output of the boost converter and to support energy management strategies such as power curtailment or peak shaving, a BESS is integrated into the proposed wind energy platform.
The BESS acts as a dynamic load or source, depending on the power balance between the wind turbine and the consumption or grid requirements. During periods of excess wind power, the battery stores energy by absorbing the surplus; conversely, in low-wind or curtailed conditions, it can supply energy to maintain system stability.
To evaluate the performance and aging of the battery system, two key metrics are monitored [25]:
  • State of Charge (SOC): indicates the instantaneous energy level relative to the battery’s nominal capacity. It is calculated as:
    S O C t = S O C 0 + 1 C n o m 0 t ( I c h a r g e τ I d i s c h a r g e τ ) d τ
    where C n o m is the nominal capacity of the battery, and I c h a r g e and I d i s c h a r g e are the respective charge and discharge currents over time τ ;
  • State of Health (SOH): reflects the battery’s ability to retain capacity compared to its nominal value and is defined as:
    S O H = C a c t u a l C n o m × 100
    where C a c t u a l is the currently available maximum capacity.
The inclusion of the BESS in the system architecture provides flexibility for future studies on energy dispatch strategies, hybrid microgrid integration, and enhanced wind power quality control.

3. Measurement, Control, and Communication Architecture

The architecture developed for remote monitoring and control of the SWT is structured into two core components: a custom-designed hardware platform and a layered software system that manages measurement, control, and communication tasks. The system integrates embedded hardware with open-source tools to support real-time data acquisition, supervisory control, and user interaction.
Figure 2 presents an overview of the system’s communication and control structure [37]. It shows how the architecture follows a client-server model, in which a local embedded controller (server) installed at the wind turbine site manages low-level measurements and control actions, while a remote application (client) handles supervision and command dispatch.
The embedded controller consists of an Arduino® MEGA microcontroller for analog signal acquisition and control output generation, and a Raspberry Pi® single-board computer that handles protocol translation and communication with the user interface. These devices are interconnected via universal asynchronous receiver-transmitter (UART) and operate in coordination to perform data acquisition, boost converter control, and wind speed measurement.
At the software level, the system employs a WebSocket-based communication protocol to enable bidirectional, low-latency interaction between the embedded controller and the MATLAB®-based user interface. Data is continuously exchanged using standardized information models inspired by the IEC 61400-25 framework, which defines the semantics for wind power system communication.
This architecture enables seamless integration between physical sensors, control logic, and user supervision, while maintaining modularity and scalability for future enhancements.

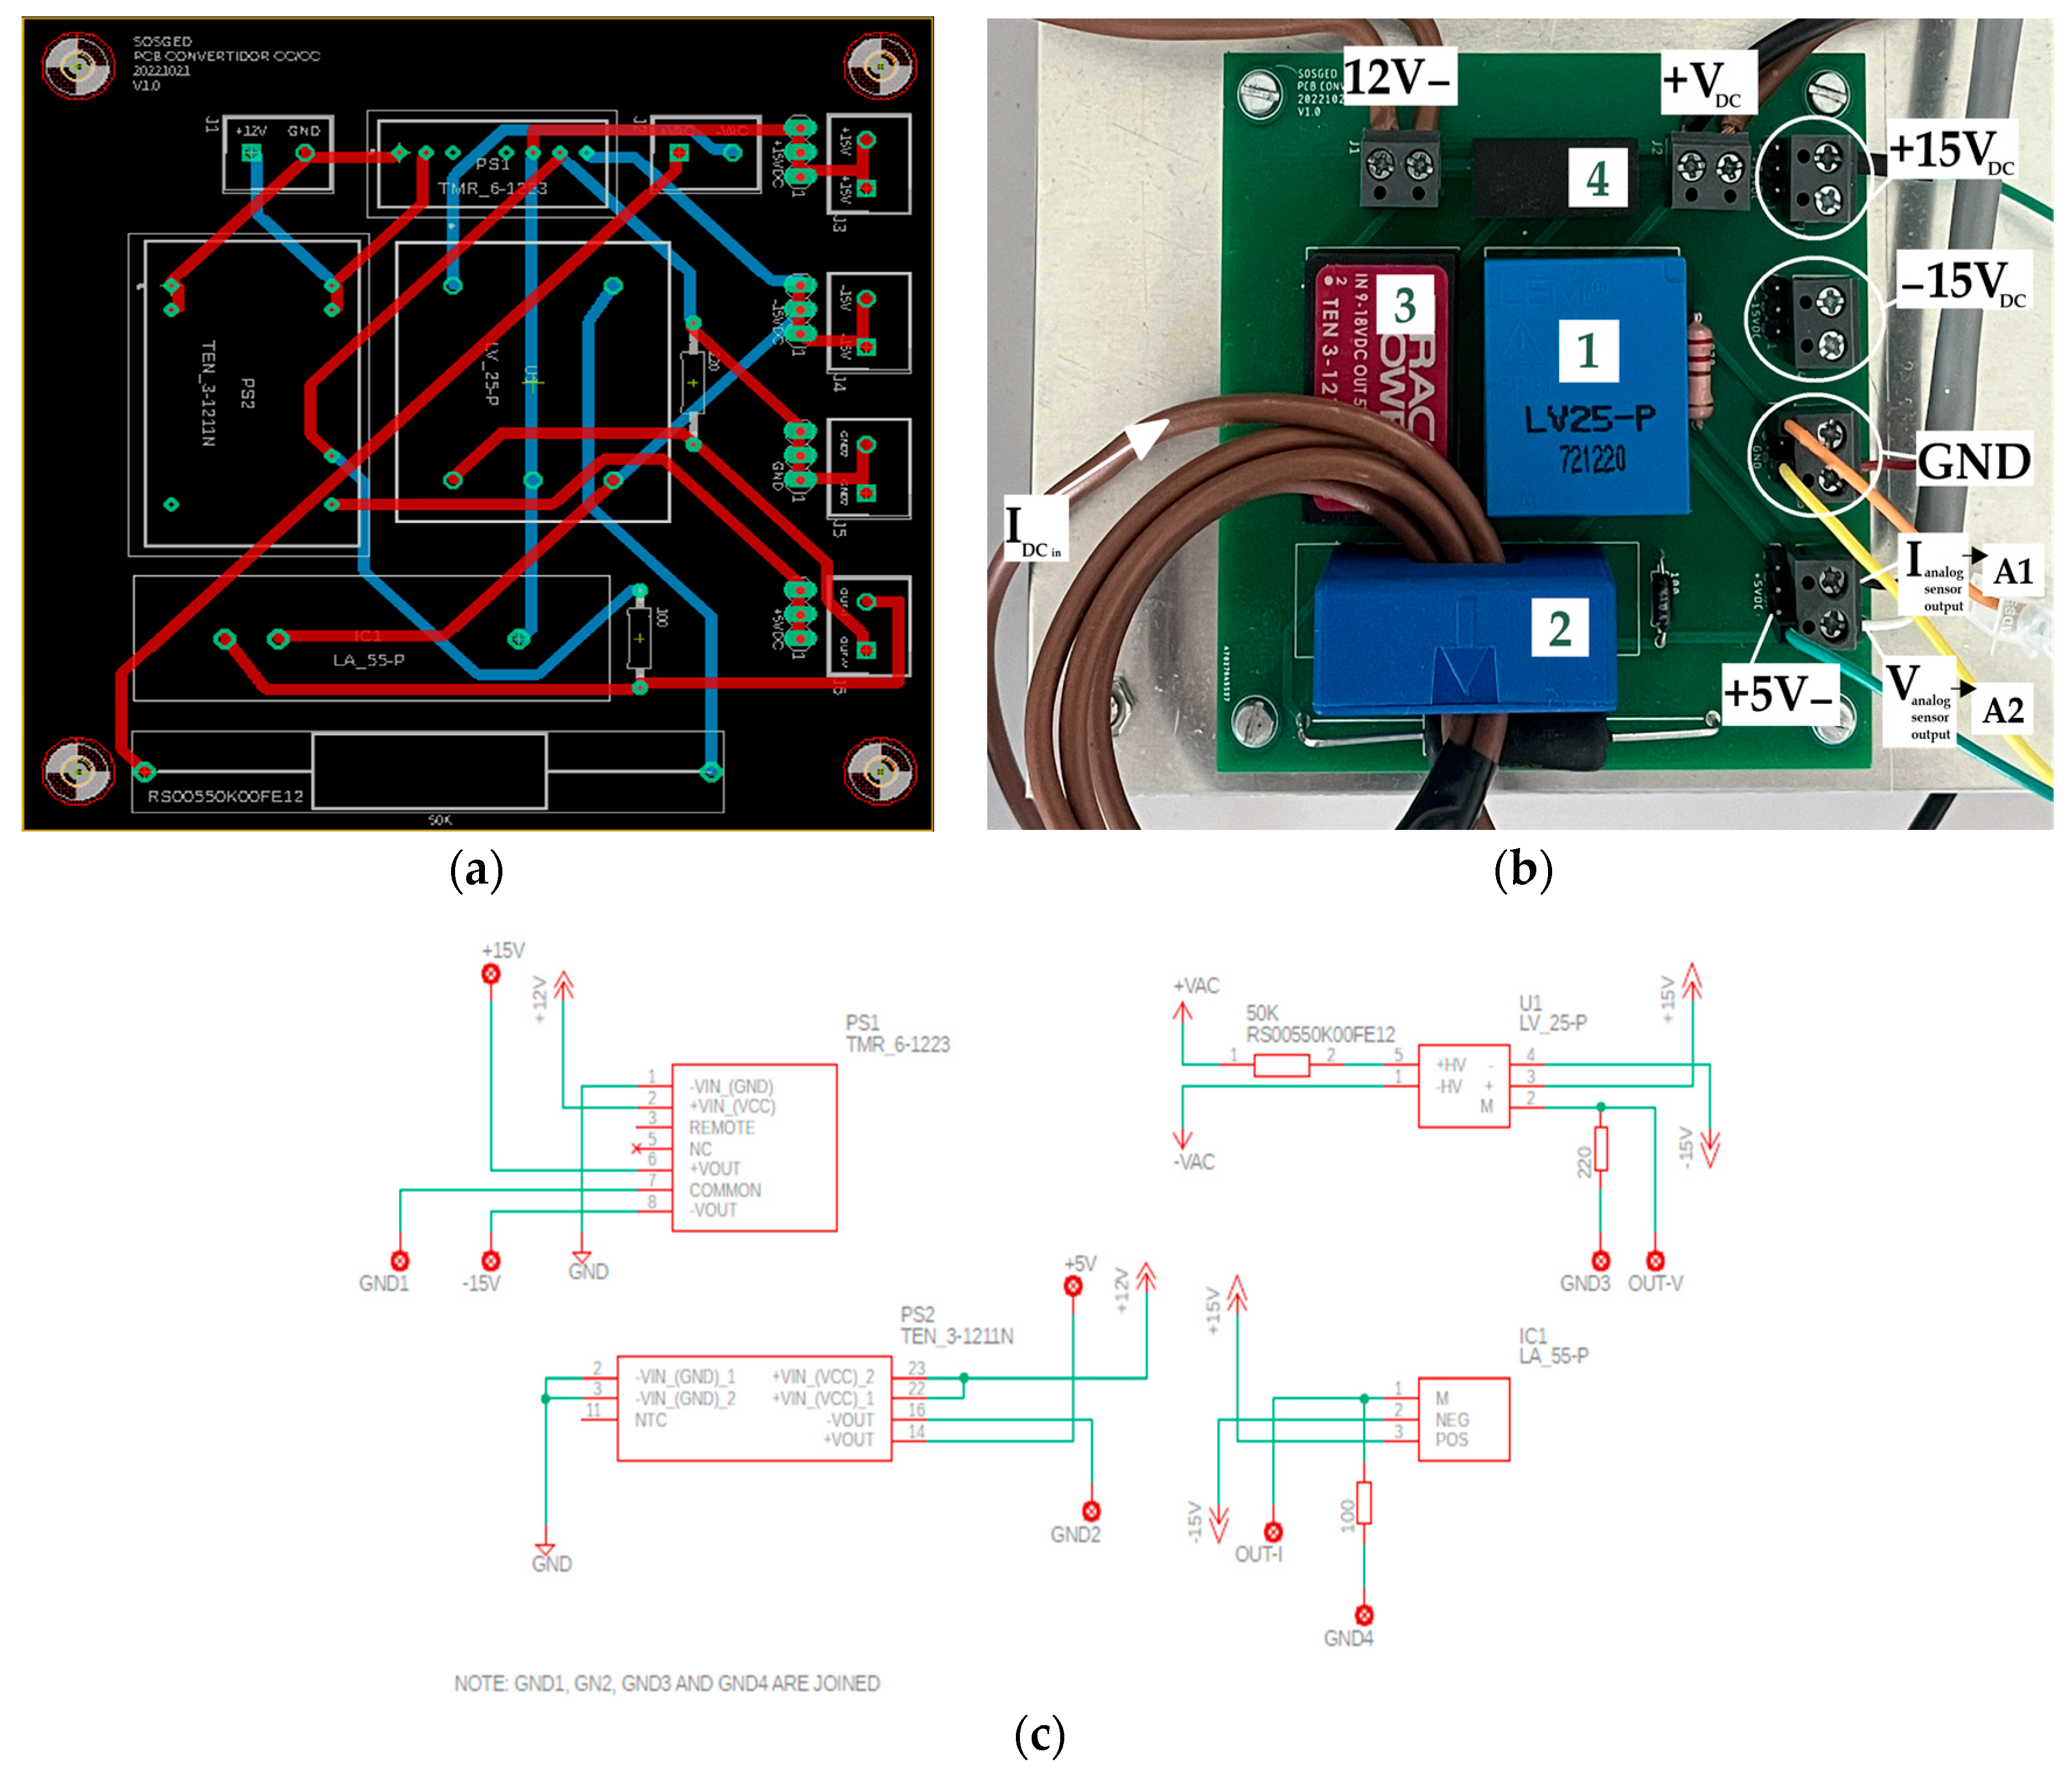
3.1. Custom-Designed Hardware Components

The physical implementation of the proposed system relies on a set of custom-designed hardware components integrated through open-source embedded platforms. As shown in Figure 2, the hardware subsystem includes dedicated sensors for electrical and environmental monitoring, a microcontroller for data acquisition and control, and an embedded system for high-level communication.
At the core of the measurement and control layer is the Arduino® MEGA 2560 (Arduino SA, Lugano, Switzerland), which acts as the main microcontroller. It acquires analog signals from the custom voltage and current sensing board and the wind speed sensor, and it also generates the Pulse Width Modulation (PWM) control signal used to drive the DC–DC boost converter. These operations are performed in real time, enabling dynamic regulation of the turbine’s power output.
Measurement and control data is transmitted to a Raspberry Pi® 3 Model B+ (Raspberry Pi Foundation, Cambridge, UK) via UART serial communication. The Raspberry Pi® functions as the embedded host system, handling communication with the supervisory interface and relaying commands received from the user.
The Arduino® MEGA 2560 was specifically selected due to its ability to handle multiple analog sensor inputs and generate precise PWM control signals, while maintaining deterministic timing crucial for energy regulation. The Raspberry Pi® 3 Model B+ was chosen for its multitasking capabilities, Python support, and built-in connectivity, making it ideal for implementing lightweight, asynchronous communication services on resource-constrained systems. While these specific models were used in the proposed platform, the overall system design remains compatible with alternative microcontrollers and single-board computers that meet minimum requirements for analog acquisition, PWM generation, and basic network communication.

3.1.1. Voltage and Current Measurement Board

To accurately monitor the electrical power generated by the SWT after AC–DC conversion, a custom-designed PCB was developed for real-time acquisition of voltage and current. The board integrates high-precision transducers and isolated power supplies and is responsible for interfacing the analog signals to the data acquisition system controlled by the Arduino® MEGA. In contrast to commercial general-purpose modules, the board was designed to match the specific operating ranges of small wind turbines, while maintaining a compact layout and using cost-effective, easily sourced components. This approach facilitates replicability in academic and experimental contexts, making it suitable for low-cost research platforms.
Figure 3 shows the complete design of the custom PCB, including the layout (a), the physical implementation with labeled components and signal terminals (b), and the electrical schematic used for sensor and power supply integration (c). The board receives DC current and voltage from the rectifier, processes them via galvanically isolated transducers, and outputs scaled analog signals labeled A1 and A2 for acquisition by the microcontroller.
The PCB includes a voltage transducer (LEM® LV 25-P, LEM International SA, Geneva, Switzerland) [38] and a non-invasive current transducer (LEM® LA 55-P, LEM International SA, Geneva, Switzerland) [39], both manufactured by LEM® International SA. These sensors are powered by isolated DC–DC converters to ensure galvanic isolation and signal integrity, minimizing noise coupling into the analog measurement chain. The outputs of the sensors are scaled analog voltages, fed directly to the analog input pins of the microcontroller for digitization.
As shown in the schematic (Figure 3c), the LV 25-P voltage transducer is connected through a high-impedance input resistor to limit primary current and define the voltage scaling range. The board includes two isolated DC–DC converters (PS1 and PS2) that provide ±15 V and +5 V supplies to power the transducers independently from the main controller, preserving electrical isolation and avoiding ground loops. All grounds (GND1–GND4) are internally referenced to ensure consistent signal behavior across the measurement chain.
A detailed list of the components used in the design of the measurement board is provided in Table 2.
A1 and A2 signals are acquired by the Arduino® analog-to-digital converter (ADC) and used in the control algorithm running on the microcontroller. Power terminals on the PCB provide the necessary ±15 V and +5 V for the correct operation of the transducers and associated circuitry as well as to power the boost converter. The sensors’ outputs require calibration to maintain accurate measurements. This is done by applying known reference voltages and currents, adjusting the sensor outputs to match expected values. Small resistors are used in the calibration circuit to compensate for any initial offsets in the sensor readings, improving the precision of the voltage and current measurements.

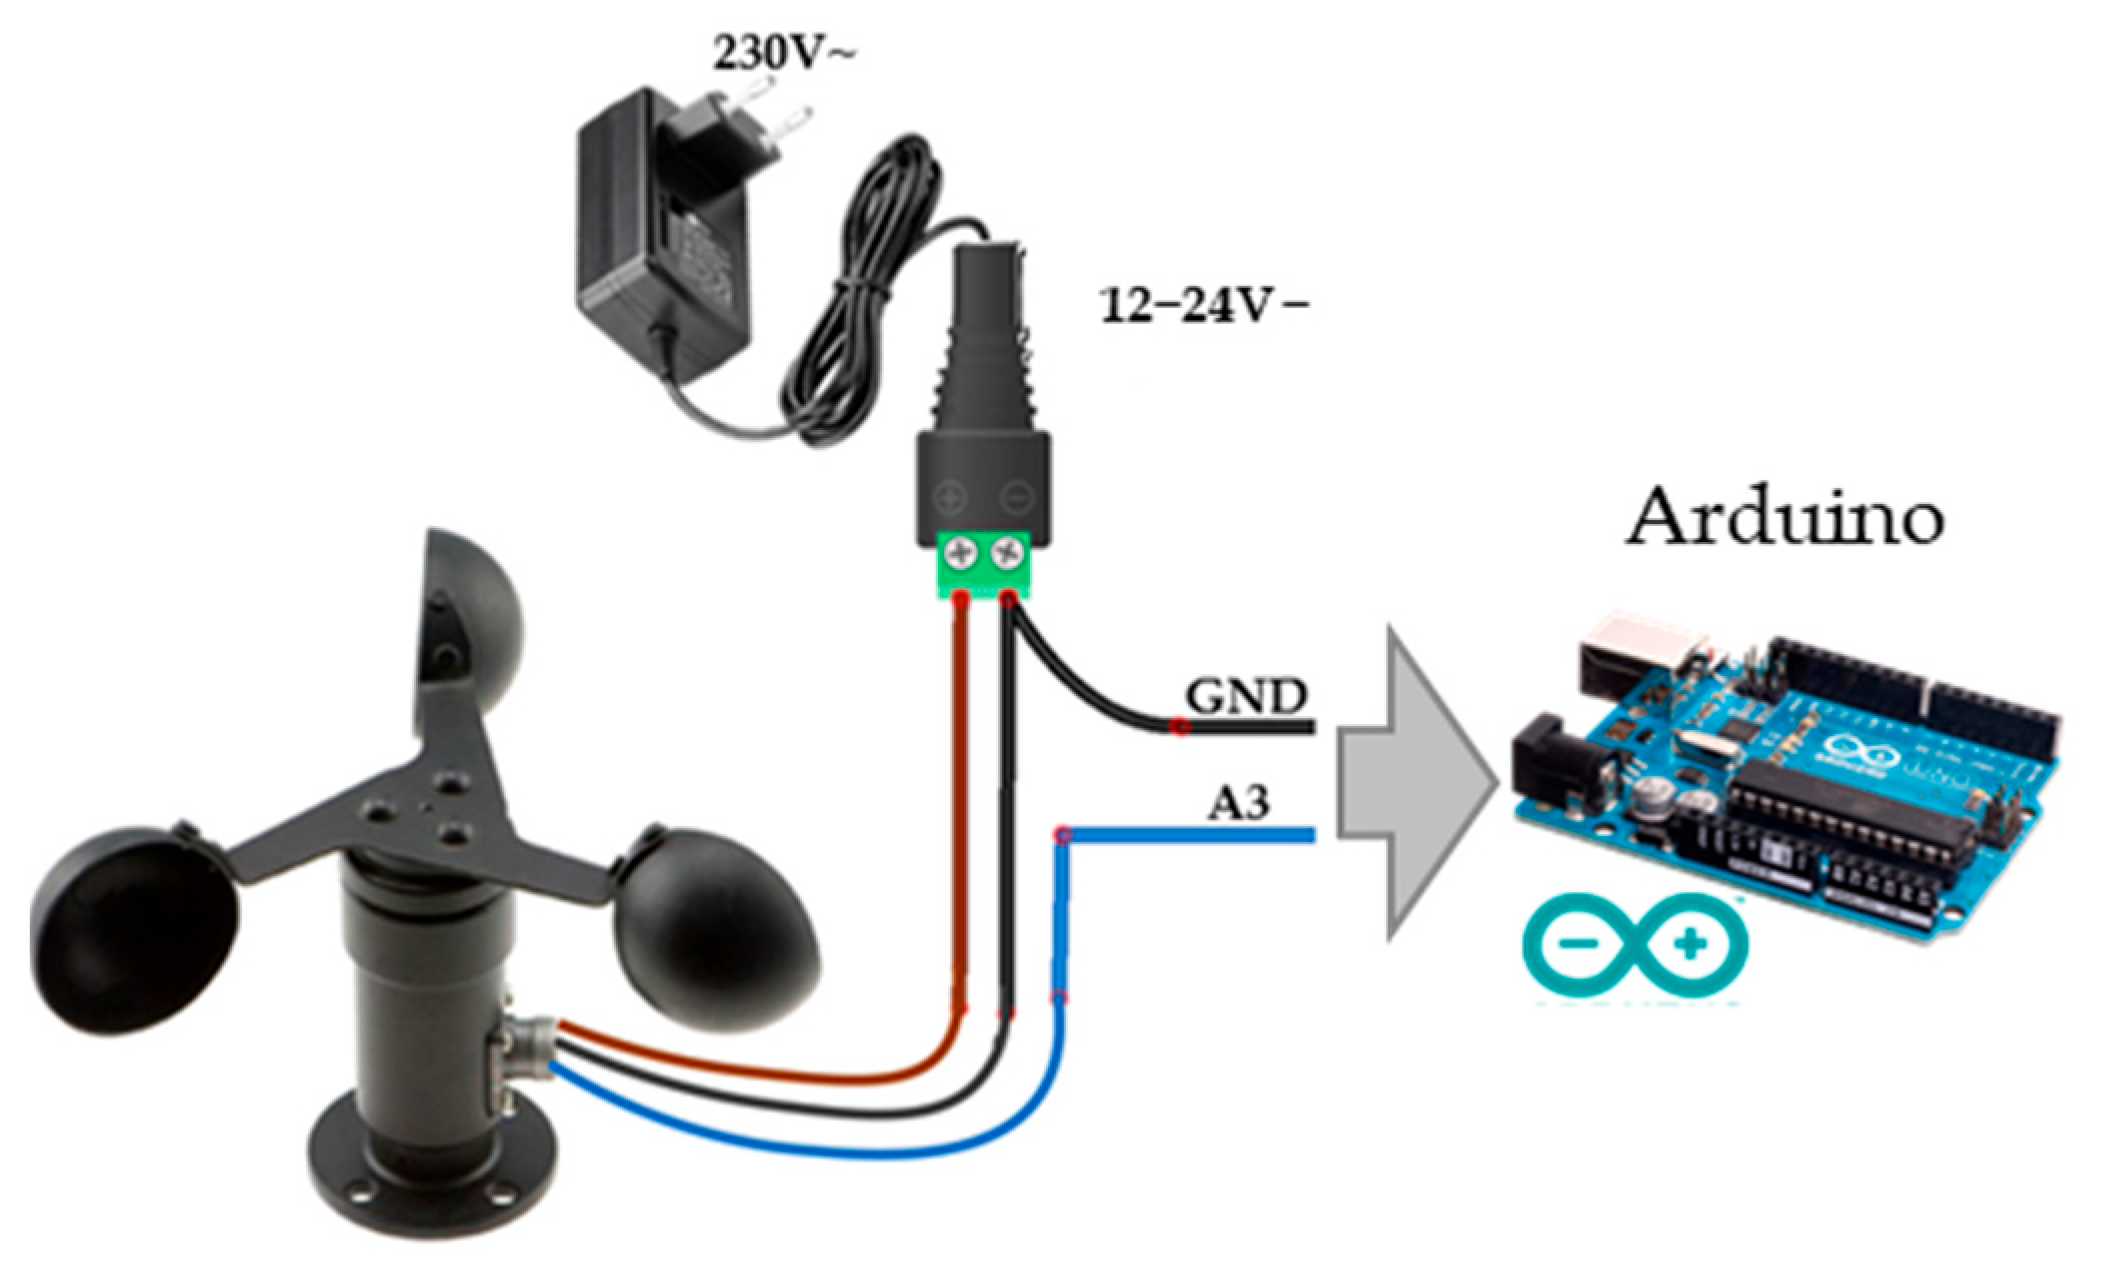
3.1.2. Wind Speed Measurement

The anemometer employed in this system is a three-cup, analog-output sensor designed to measure wind speed by converting the rotational velocity of its cups into a proportional voltage signal. This sensor operates within a supply voltage range of 12–24 V DC and outputs an analog voltage between 0 and 5 V, corresponding to wind speeds from 0 to 32.4 m/s. The uncertainty of the sensor is ±0.3 m/s over the entire range of wind velocities for the measuring range (0 to 32.4 m/s), allowing for reasonably precise measurements in SWT applications.
To interface the anemometer with the Arduino® microcontroller, the sensor’s analog signal output is connected to the Arduino®’s analog input pin A3 (as shown in Figure 4). The sensor is powered using an external 12 V DC supply, with its ground (GND) tied to both the Arduino® and power supply grounds, ensuring a common reference point. The sensor’s signal wire (typically blue) is connected directly to the analog input pin without the need for additional signal conditioning, because the Arduino®’s analog input range is compatible with the sensor’s output voltage.
Calibration of the sensor involves determining the minimum voltage output when the anemometer is stationary. In practice, this value may not be exactly 0 V due to sensor characteristics and environmental factors. In fact, a measured minimum voltage of approximately 0.054 V has been observed under no-wind conditions. This offset voltage is subtracted from subsequent readings to ensure accurate wind speed calculations.
The wind speed (v) in meters per second (m/s) is calculated from the analog voltage (V) using a linear mapping based on the sensor’s specifications:
v = V V m i n V m a x V m i n × v m a x
where:
  • V is the measured analog voltage;
  • V min is the offset voltage under no-wind conditions (e.g., 0.054 V);
  • V max is the maximum output voltage of the sensor (5 V);
  • v max is the sensor’s maximum wind speed range (32.4 m/s).
This linear relationship approximates the sensor’s behavior based on manufacturer specifications, although minor deviations from ideal linearity may occur due to sensor tolerances and environmental factors. Nonetheless, the resulting uncertainty remains acceptable for typical SWT monitoring and control tasks. The output voltage is sampled using the Arduino®’s 10-bit analog-to-digital converter (ADC), which provides digital values from 0 to 1023. Therefore, the raw ADC value is first converted into a voltage using:
V = A D C v a l u e × V r e f 1023
where V r e f is the reference voltage of the analog pin, typically 5 V in standard Arduino® boards. This calculated voltage is then used in the wind speed equation. To improve accuracy and filter out high-frequency noise, a moving average of multiple samples is typically applied. This approach enhances stability in the measured wind speed, particularly under turbulent or gusty conditions.
Figure 4 illustrates the physical connection of the anemometer to the data acquisition system. The analog signal wire is connected to pin A3, and power is supplied via a regulated 12 V input. Ground reference is shared across the sensor, power source, and analog interface to ensure accurate signal referencing. The diagram simplifies the setup for reproduction and clearly illustrates the signal path to pin A3, along with the power and ground wiring required for proper sensor operation.

3.2. Software and Communication

Following the description of the hardware components, this section details the software structure and communication protocols that govern the real-time monitoring and control functionalities of the developed SWT platform. The system is organized into three functional layers that manage data acquisition, communication, and supervisory control tasks, ensuring robust and low-latency performance.
The software architecture is distributed across the three main hardware components: the Arduino® Mega microcontroller (measurement and actuation), the Raspberry Pi® 3 Model B+ (communication and data management), and the PC-based MATLAB® application (user interface and supervisory control).

3.2.1. Measurement and Data Acquisition Layer: Arduino®

The Arduino® MEGA 2560 acts as the core microcontroller responsible for low-level data acquisition and real-time control in the system. It continuously monitors three key analog variables: DC voltage, DC current, and wind speed. These signals are sampled using the board’s integrated 10-bit analog-to-digital converters (ADCs) at a fixed rate of 1 kHz, providing sufficient temporal resolution for the relatively slow dynamics of small wind systems.
Each analog input is mapped to a dedicated ADC channel. The measured values are scaled according to sensor characteristics (e.g., transducer gain and offset), digitized, and temporarily stored in internal variables. The wind speed sensor, which delivers an analog voltage proportional to rotational speed, is processed in the same acquisition loop using similar ADC-based sampling.
To ensure consistent and reliable communication with the embedded host system (Raspberry Pi®), the Arduino® organizes the acquired sensor data into structured UART frames. Each frame includes:
  • A start delimiter (0x02) to indicate the beginning of a new message;
  • A sequence of encoded sensor readings in hexadecimal format;
  • A checksum value for basic error detection; and
  • An end delimiter (0x03) to mark the end of the transmission.
The UART link is configured at 9600 bps with an 8N1 format (8 data bits, no parity, 1 stop bit), balancing communication speed and reliability. The serial transmission is handled in a non-blocking loop that runs continuously in parallel with the acquisition and control routines.
In addition to measurement tasks, the Arduino® generates a PWM signal that serves as the control input to the DC–DC boost converter. Although the specific control strategy (e.g., MPPT or power limitation) depends on the application context, the duty cycle of this signal is dynamically adjusted based on sensor feedback and commands received from the supervisory system.

3.2.2. Communication and Data Management Layer: Raspberry Pi®

The Raspberry Pi® 3 Model B+ operates as the embedded host system responsible for managing the communication between the Arduino®-based measurement/control layer and the MATLAB®-based supervisory application [40]. Its role is to ensure reliable, low-latency transmission of measurement data and control commands over a TCP/IP network using the WebSocket protocol. This system is programmed and executed in Python, using the latest version of Python 3.x [41].
To achieve asynchronous and isolated handling of data streams, the Raspberry Pi® executes a master script (maestro.py) that launches two independent processes in parallel—one for data acquisition (process1.py) and another for control command handling (process2.py). This multiprocessing approach prevents resource contention and improves system responsiveness.
  • Data Acquisition Server—process1.py
This process handles the reception and forwarding of measurement data. It initializes an UART serial connection with the Arduino® (configured at 9600 bps) and sets up a WebSocket server on port 8081. Upon establishing a client connection, it continuously reads up to 32 bytes from the UART buffer. If additional bytes remain in the buffer (in_waiting), these are appended to complete the full message.
Once the complete data packet is received, it is transmitted directly to the client (the MATLAB® app) via WebSocket. A basic acknowledgment mechanism ensures that the next reading cycle begins only after the previous packet is confirmed as received, avoiding data overlapping or congestion.
  • Control Command Server—process2.py
This process is dedicated to receiving commands from the client and relaying them to the Arduino®. It opens a WebSocket server on port 8080 and listens for incoming messages. When a control command is received (e.g., setpoint update, mode switch), it is converted into an ASCII byte string and sent over the same UART interface to the Arduino®. After transmission, a confirmation message is returned to the client to complete the cycle.
This separation of concerns between data acquisition and control allows for full-duplex communication and increases the system’s tolerance to high-frequency messaging or command bursts.
  • Process Management—maestro.py
The multitasking behavior is managed by a master script that defines and initiates both processes using Python’s multiprocessing module. Once launched, both child processes run indefinitely, each handling their respective WebSocket service.
The internal logic of this process management scheme is outlined in Algorithm 1, which presents the pseudocode implementation of the master script and its associated communication servers.
Algorithm 1: Pseudocode—Process Management and Communication Logic
maestro.py
(Process Manager)
----------------------
Define list of subprocesses: [process1.py, process2.py]
For each process in list:
  -Create a new worker process
  -Assign target: run process as Python script
Start all worker processes in parallel
Wait for processes to run continuously (blocking)
process1.py
(Measurement Data Server)
-------------------------------
Initialize UART port (9600 bps, timeout 2.5 s)
Start WebSocket server on port 8081
On client connection:
 Loop indefinitely:
  -Read up to 32 bytes from UART buffer
  -If more data is available:
  -Read remaining bytes (in waiting)
  -Concatenate full message
  -Send raw data to client via WebSocket
  -Wait for client acknowledgment before next cycle
process2.py
(Control Command Server)
-------------------------------
Start WebSocket server on port 8080
On client connection:
 Loop indefinitely:
  -Wait for command from client via WebSocket
  -Convert string command to ASCII bytes
  -Open UART port (9600 bps)
  -Send command to Arduino®
  -Send confirmation back to client
Under normal conditions, the total system latency—from signal acquisition on the Arduino® to data visualization on the MATLAB® app—remains under 200 ms, supporting effective real-time control. A timeout supervision is implemented to monitor UART activity: if no valid frame is received within two seconds, a warning is raised to notify potential communication failure.

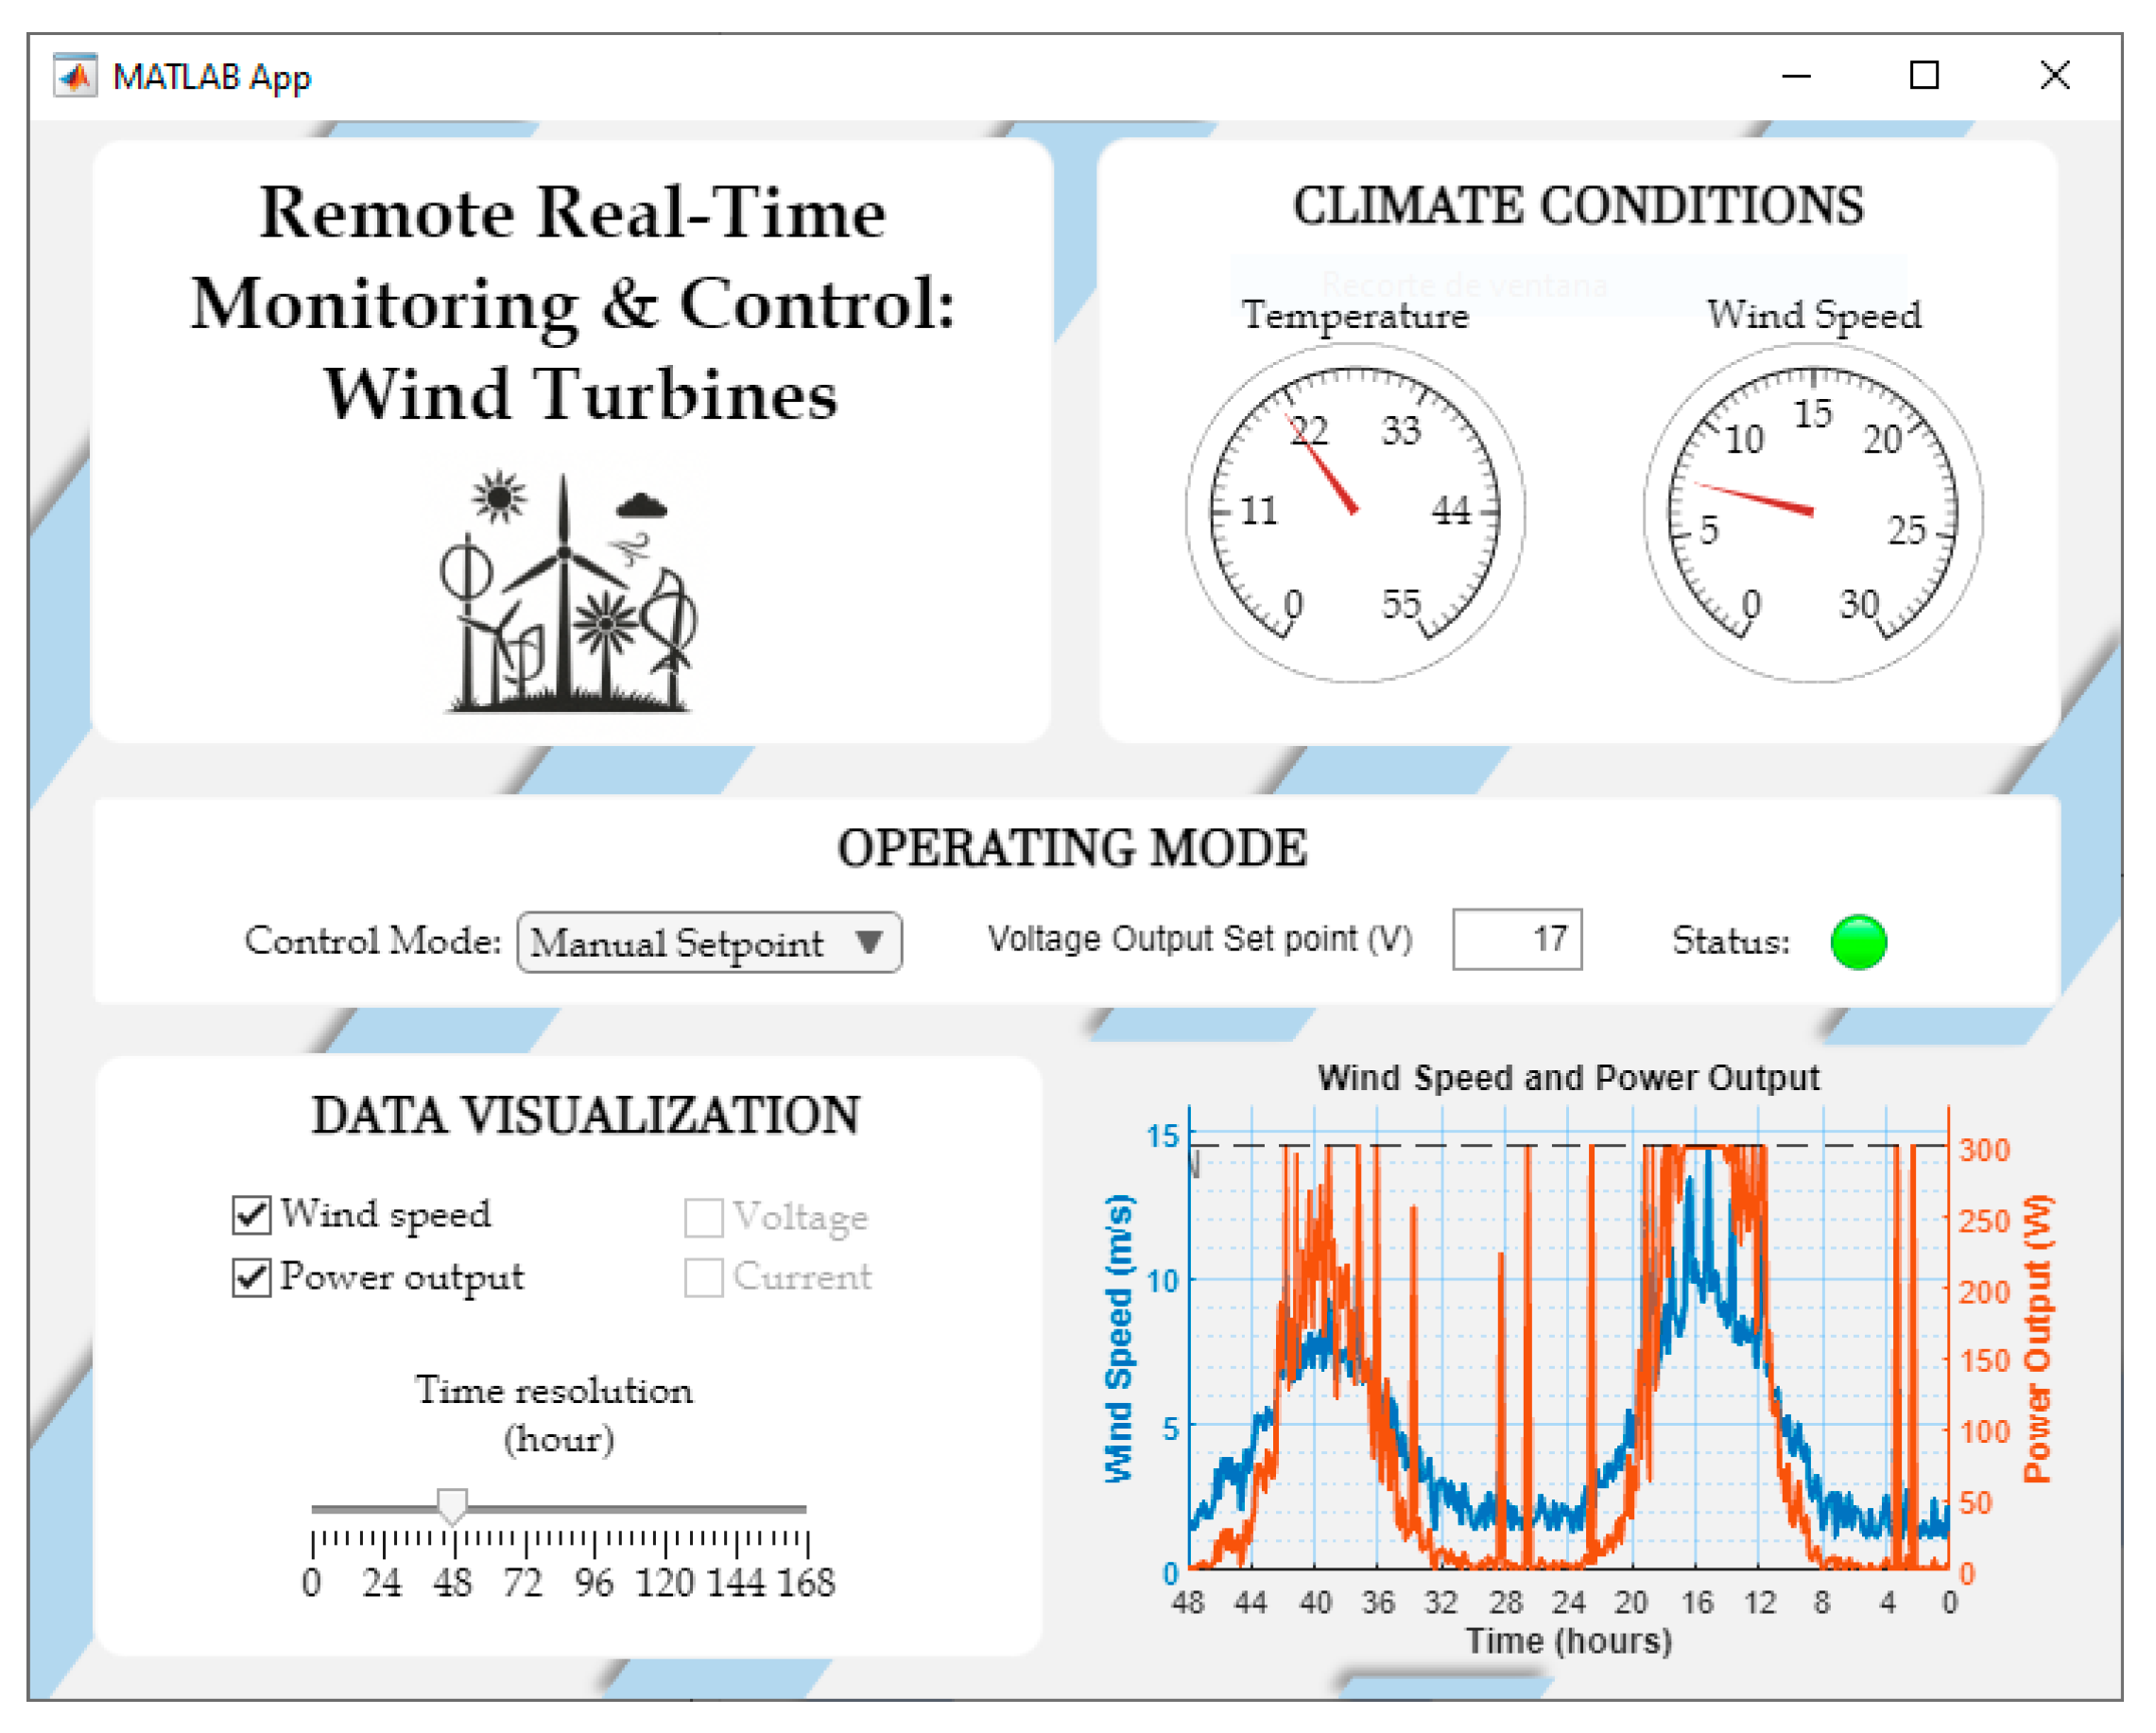
3.2.3. Supervisory Control and Monitoring Layer: MATLAB® App

The MATLAB® app acts as the graphical user interface (GUI) for monitoring the SWT system in real time. Developed using MATLAB® App Designer, it provides a unified platform for visualizing operational data and sending control commands remotely.
Although MATLAB® was used in this study due to its availability at the authors’ institution and its ease of development, the communication platform presented in this work is fully compatible with open-source alternatives such as GNU Octave [42].
Upon initialization, the application establishes two persistent WebSocket connections with the Raspberry Pi®:
  • One to receive real-time measurement data (port 8081);
  • Another to send control commands (port 8080).
These connections are created using a MATLAB®’s WebSocket library [43], enabling full-duplex communication between the app and the embedded system. Incoming messages are handled via event-driven callbacks that decode the data and update the graphical elements of the interface, such as gauges, indicators, and dynamic plots displaying wind speed, generator voltage, current, and power output.
User actions—such as selecting control modes, toggling MPPT strategies, or adjusting voltage setpoints—are processed by the app and sent as ASCII-encoded commands over the control WebSocket. The Raspberry Pi® then forwards these to the Arduino® for immediate actuation via UART.
To ensure robustness, the app continuously monitors connection status. In case of brief disconnections (e.g., network issues or system restarts), the app attempts automatic reconnection to restore communication without user intervention. This behavior provides resilience and responsiveness, essential for experimental and supervisory control environments.
Figure 5 shows the current user interface of the MATLAB® app, designed specifically for the remote monitoring and control of the SWT platform.
The internal communication logic of the app is outlined in Algorithm 2, which summarizes the WebSocket-based data and command flow used in the application.
Algorithm 2: Pseudocode—MATLAB® App WebSocket Communication Logic
Initialize WebSocket connection to the Raspberry Pi at IP ”XXX.XXX.X.XXX" with port 8081 for receiving data from the DC–DC converter.
Initialize WebSocket connection to the Raspberry Pi at IP “XXX.XXX.X.XXX” with port 8080 for sending control commands to the converter.
Periodically check for incoming data from the converter via WebSocket:
   - If data is received:
       - Parse the incoming data frame to identify and extract key parameters.
       - Convert raw sensor data into physical units using predefined scaling factors.
       - Update the app with real-time values: power, current, temperature, voltage, and wind speed.
On user command, send control signals to the converter via WebSocket:
   - Switch the operating mode (MPPT or Power Curtailment) and send corresponding control commands.
   - If Power Curtailment is selected, send power reserve settings to the converter.
Ensure periodic update of operational parameters and maintain communication integrity between the system and the converter by continuously processing data every few seconds.

3.2.4. System Data Flow

The complete communication process within the platform is structured into four primary stages, ensuring robust interaction between sensing, control, and supervision layers:
  • The Arduino® continuously acquires voltage, current, and wind speed measurements, structuring the information into UART frames and transmitting them to the Raspberry Pi® via serial communication;
  • Upon receiving the UART data, the Raspberry Pi® parses the frames, formats the content into JavaScript Object Notation structures, and broadcasts it through a WebSocket server (port 8081), enabling real-time data availability to external clients;
  • The MATLAB® app, acting as a WebSocket client, subscribes to the data stream, dynamically updates the graphical user interface, and enables the operator to send control commands based on system conditions;
  • Commands sent by the user are transmitted from the MATLAB® app to the Raspberry Pi® via WebSocket (port 8080), which are then forwarded through UART to the Arduino®. These commands trigger control actions such as modifying the PWM signal to the boost converter or toggling operating modes.
This layered communication architecture promotes modularity, fault isolation, and system scalability, laying the groundwork for future enhancements such as multi-turbine supervision, implementation of adaptive MPPT algorithms, or seamless integration with cloud-based SCADA and analytics platforms.

4. Experimental Setup

This section details the full-scale laboratory implementation of the proposed monitoring and control platform, including the integration of the wind turbine, power conversion stages, and energy storage system. The setup enables controlled testing under variable wind conditions, ensuring the reproducibility and validation of the system described in Section 3.

4.1. Wind Turbine

The experimental setup employs a Rutland FM910-4 small-scale horizontal-axis wind turbine (MARLEC, Corby, UK), designed specifically for low-power applications, shown in Figure 6. The turbine is mounted indoors, where it is subjected to wind generated by a variable-speed centrifugal fan. The fan’s speed is controlled through a frequency inverter, allowing precise adjustments to the wind velocity and enabling the simulation of different environmental conditions for repeatable testing.
The wind turbine is equipped with a PMSG and a fixed-pitch rotor. Under favorable wind conditions, the turbine can reach up to 200 W of electrical output. The cut-in speed of the turbine is around 3 m/s, and the cut-out speed is 20 m/s, which aligns with typical values for small wind turbine systems. Mechanical energy from the rotor is converted into AC electrical power, which is subsequently processed by the rectification and power conversion stages described in the following sections.

4.2. Power Electronics

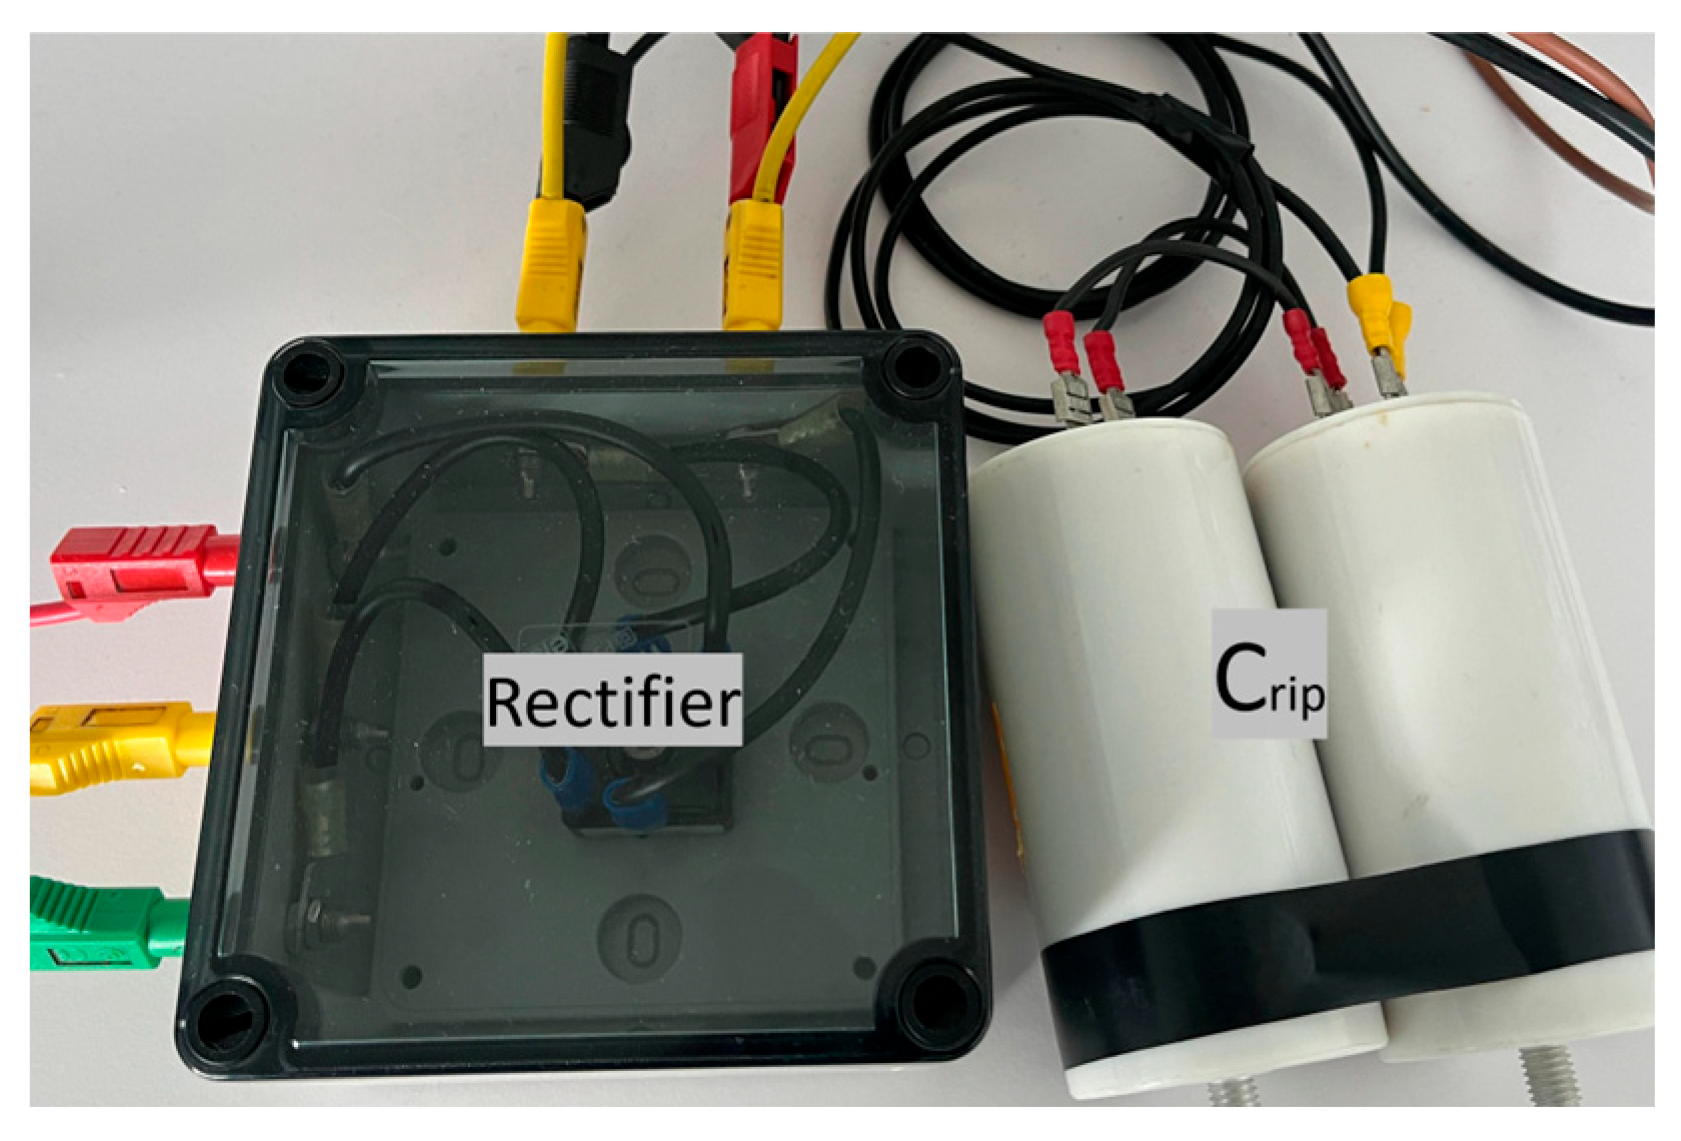
4.2.1. AC–DC Rectification and Filtering

The output of the wind turbine’s three-phase AC generator is first rectified using a full-wave diode bridge rectifier, which converts the AC signal into DC. A smoothing capacitor is placed at the rectifier’s output to mitigate the voltage ripple, ensuring that the input to the subsequent DC–DC boost converter remains stable and minimizes fluctuations that could negatively impact control precision. In Figure 7, both components can be observed. This configuration is critical for maintaining reliable performance during dynamic wind changes, where voltage stability is essential.

4.2.2. DC–DC Boost Converter
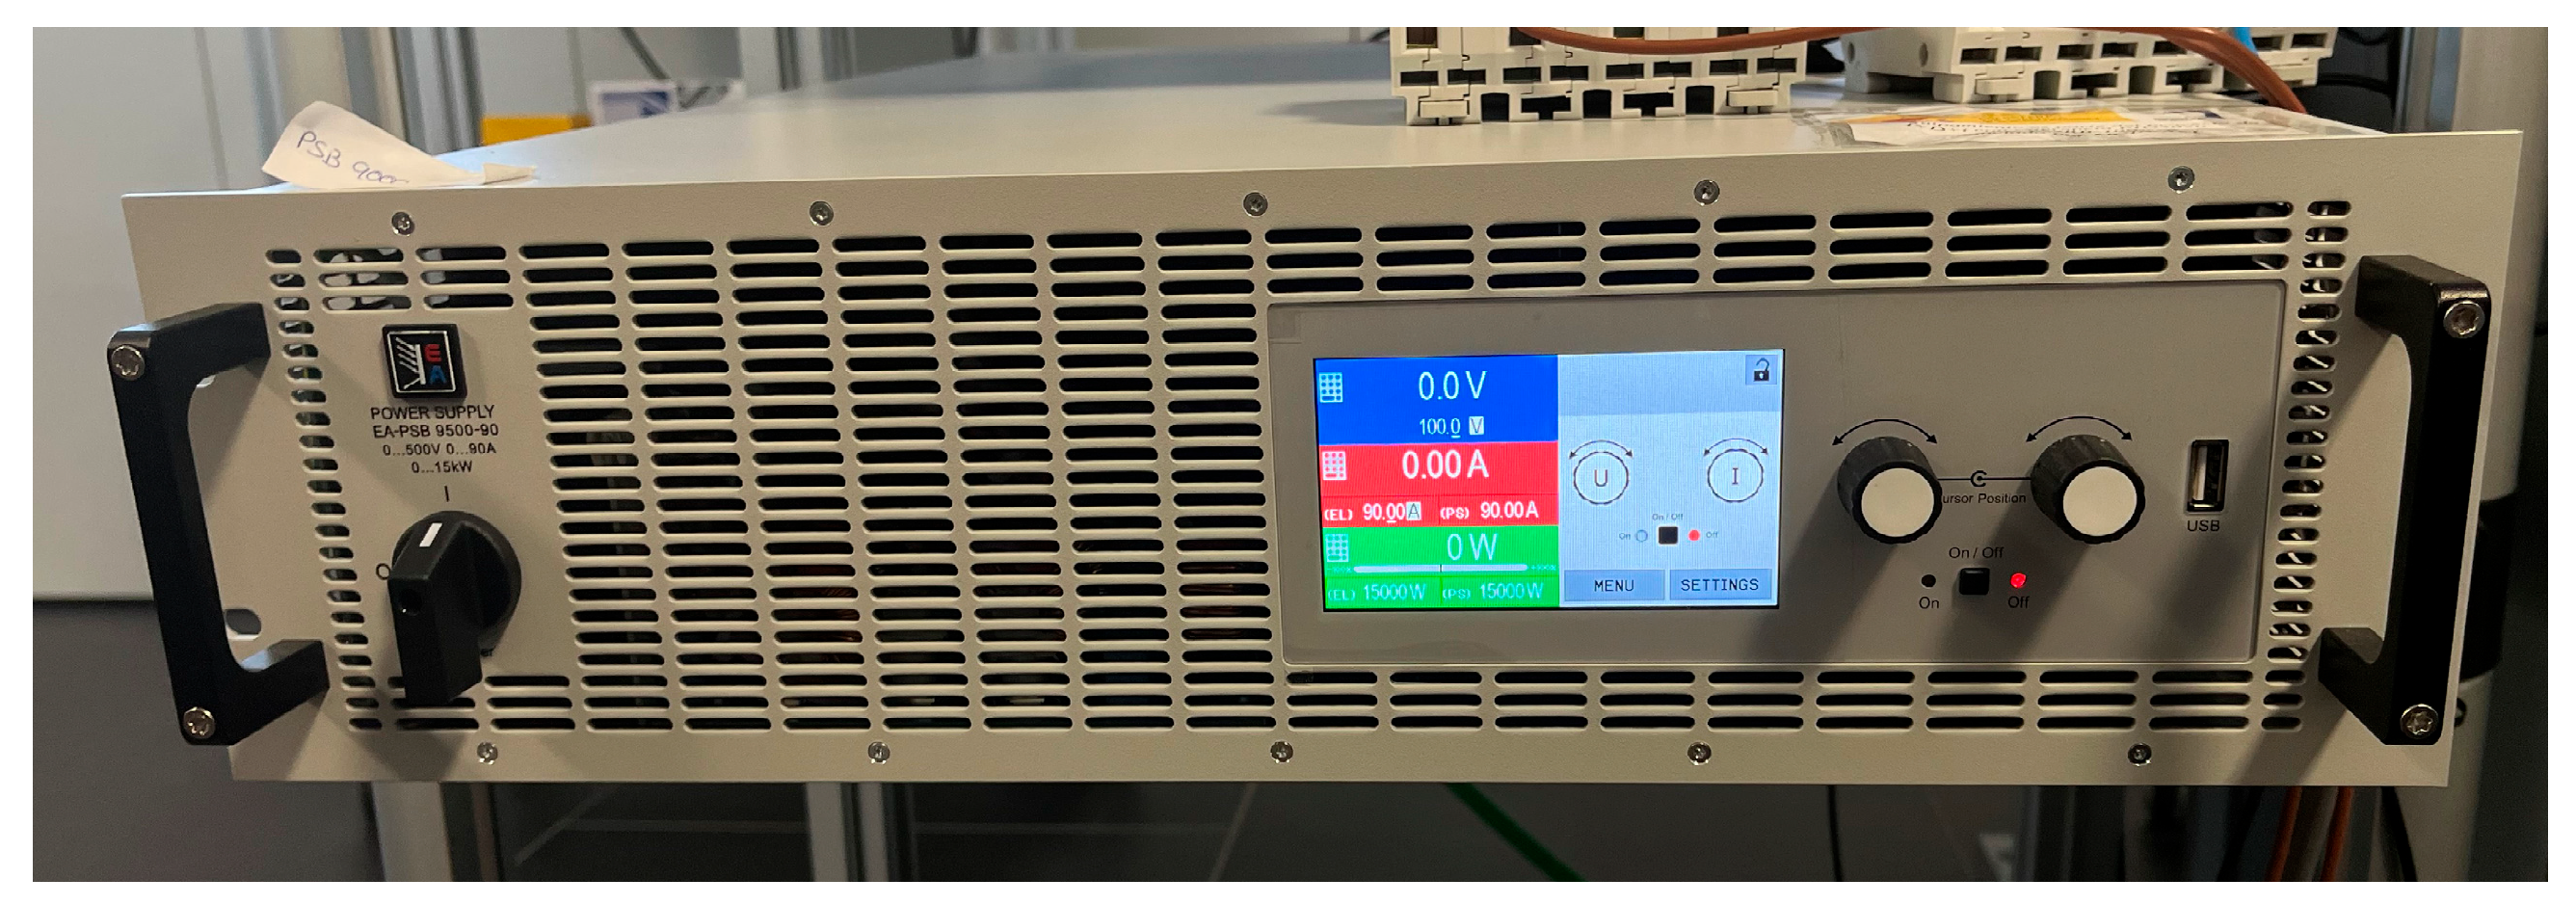
A modular Insulated Gate Bipolar Transistor (IGBT) power stack (model MTM-1/2B2IC0225F12HB, manufactured by GUASCH, Girona, Spain) is utilized to implement the boost converter stage. The converter employs a half-bridge topology with two IGBTs: one (T1) remains open, acting as a freewheeling diode, while the other (T2) is driven by a control signal via PWM from the Arduino®. This configuration allows precise control of the output voltage by adjusting the duty cycle of the PWM signal, providing real-time regulation of the turbine’s electrical operating point.
The converter operates at a switching frequency of 10 kHz, enabling efficient voltage regulation. The power stage is designed to support various control strategies, including MPPT and power curtailment. By dynamically adjusting the duty cycle, the boost converter efficiently manages power transfer from the turbine to the storage system, maintaining optimal operating conditions despite variations in wind speed. Figure 8a shows the appearance of the modular IGBT power stack, providing an overview of the physical setup. Figure 8b presents the electrical schematic, illustrating the connections and components within the boost converter stage, such as the two IGBTs, inductor, and capacitor.
In the converter’s design, key components such as the inductor, capacitor, and the IGBTs work together to facilitate smooth power conversion, minimizing switching losses and ensuring stable operation under different load conditions. The dynamics of this circuit are governed by the voltages across the inductor and capacitor, as well as the current flowing through the system, following the relationships derived in the dynamic modeling of the boost converter (as seen in Equation (9)).

4.3. Battery

The output of the boost converter is connected to a programmable bidirectional DC power supply (model PSB 9000 3U, EA Elektro-Automatik, Viersen, Germany), configured to emulate the electrical behavior of a 350 V lithium-ion battery. This emulation provides a stable DC bus for energy exchange, simulating the charging and discharging cycles of a real battery. This approach allows safe testing without the risks and limitations associated with using real batteries, particularly for testing scenarios that involve large power fluctuations or failure modes. Figure 9 displays the bidirectional power supply.
The EA PSB 9000 3U supports automated State of Charge (SOC) and State of Health (SOH) monitoring through the EA Battery Simulator software. This functionality allows for full characterization of storage performance under different wind profiles, enabling the system to accurately model and manage energy storage behaviors. By simulating various load profiles and charging conditions, the setup facilitates testing and validation of the wind turbine’s power management strategies under controlled conditions.

4.4. System Overview

Figure 10 illustrates the complete laboratory setup, highlighting the spatial arrangement and interconnection of all key components. The wind turbine is placed directly in front of the industrial fan, which is responsible for generating the artificial wind. The generator’s output is routed through the rectifier, followed by the power conditioning stages, and finally to the storage interface, completing the power conversion process. All system variables—including wind speed, DC voltage, DC current, and PWM duty cycle—are continuously monitored and logged using the sensors and the digital acquisition system described in Section 3.1.1. This ensures real-time tracking of the turbine’s performance under various conditions.
Additional instrumentation includes:
  • Oscilloscope: to visualize PWM signal, coil current, and switching transients on the IGBT gate;
  • Watt meters and multimeters: to monitor generated power and verify measurement accuracy;
  • Tachometer and frequency meter: to evaluate generator shaft speed and electrical frequency, enabling rotor characterization.

5. In-Lab System Test
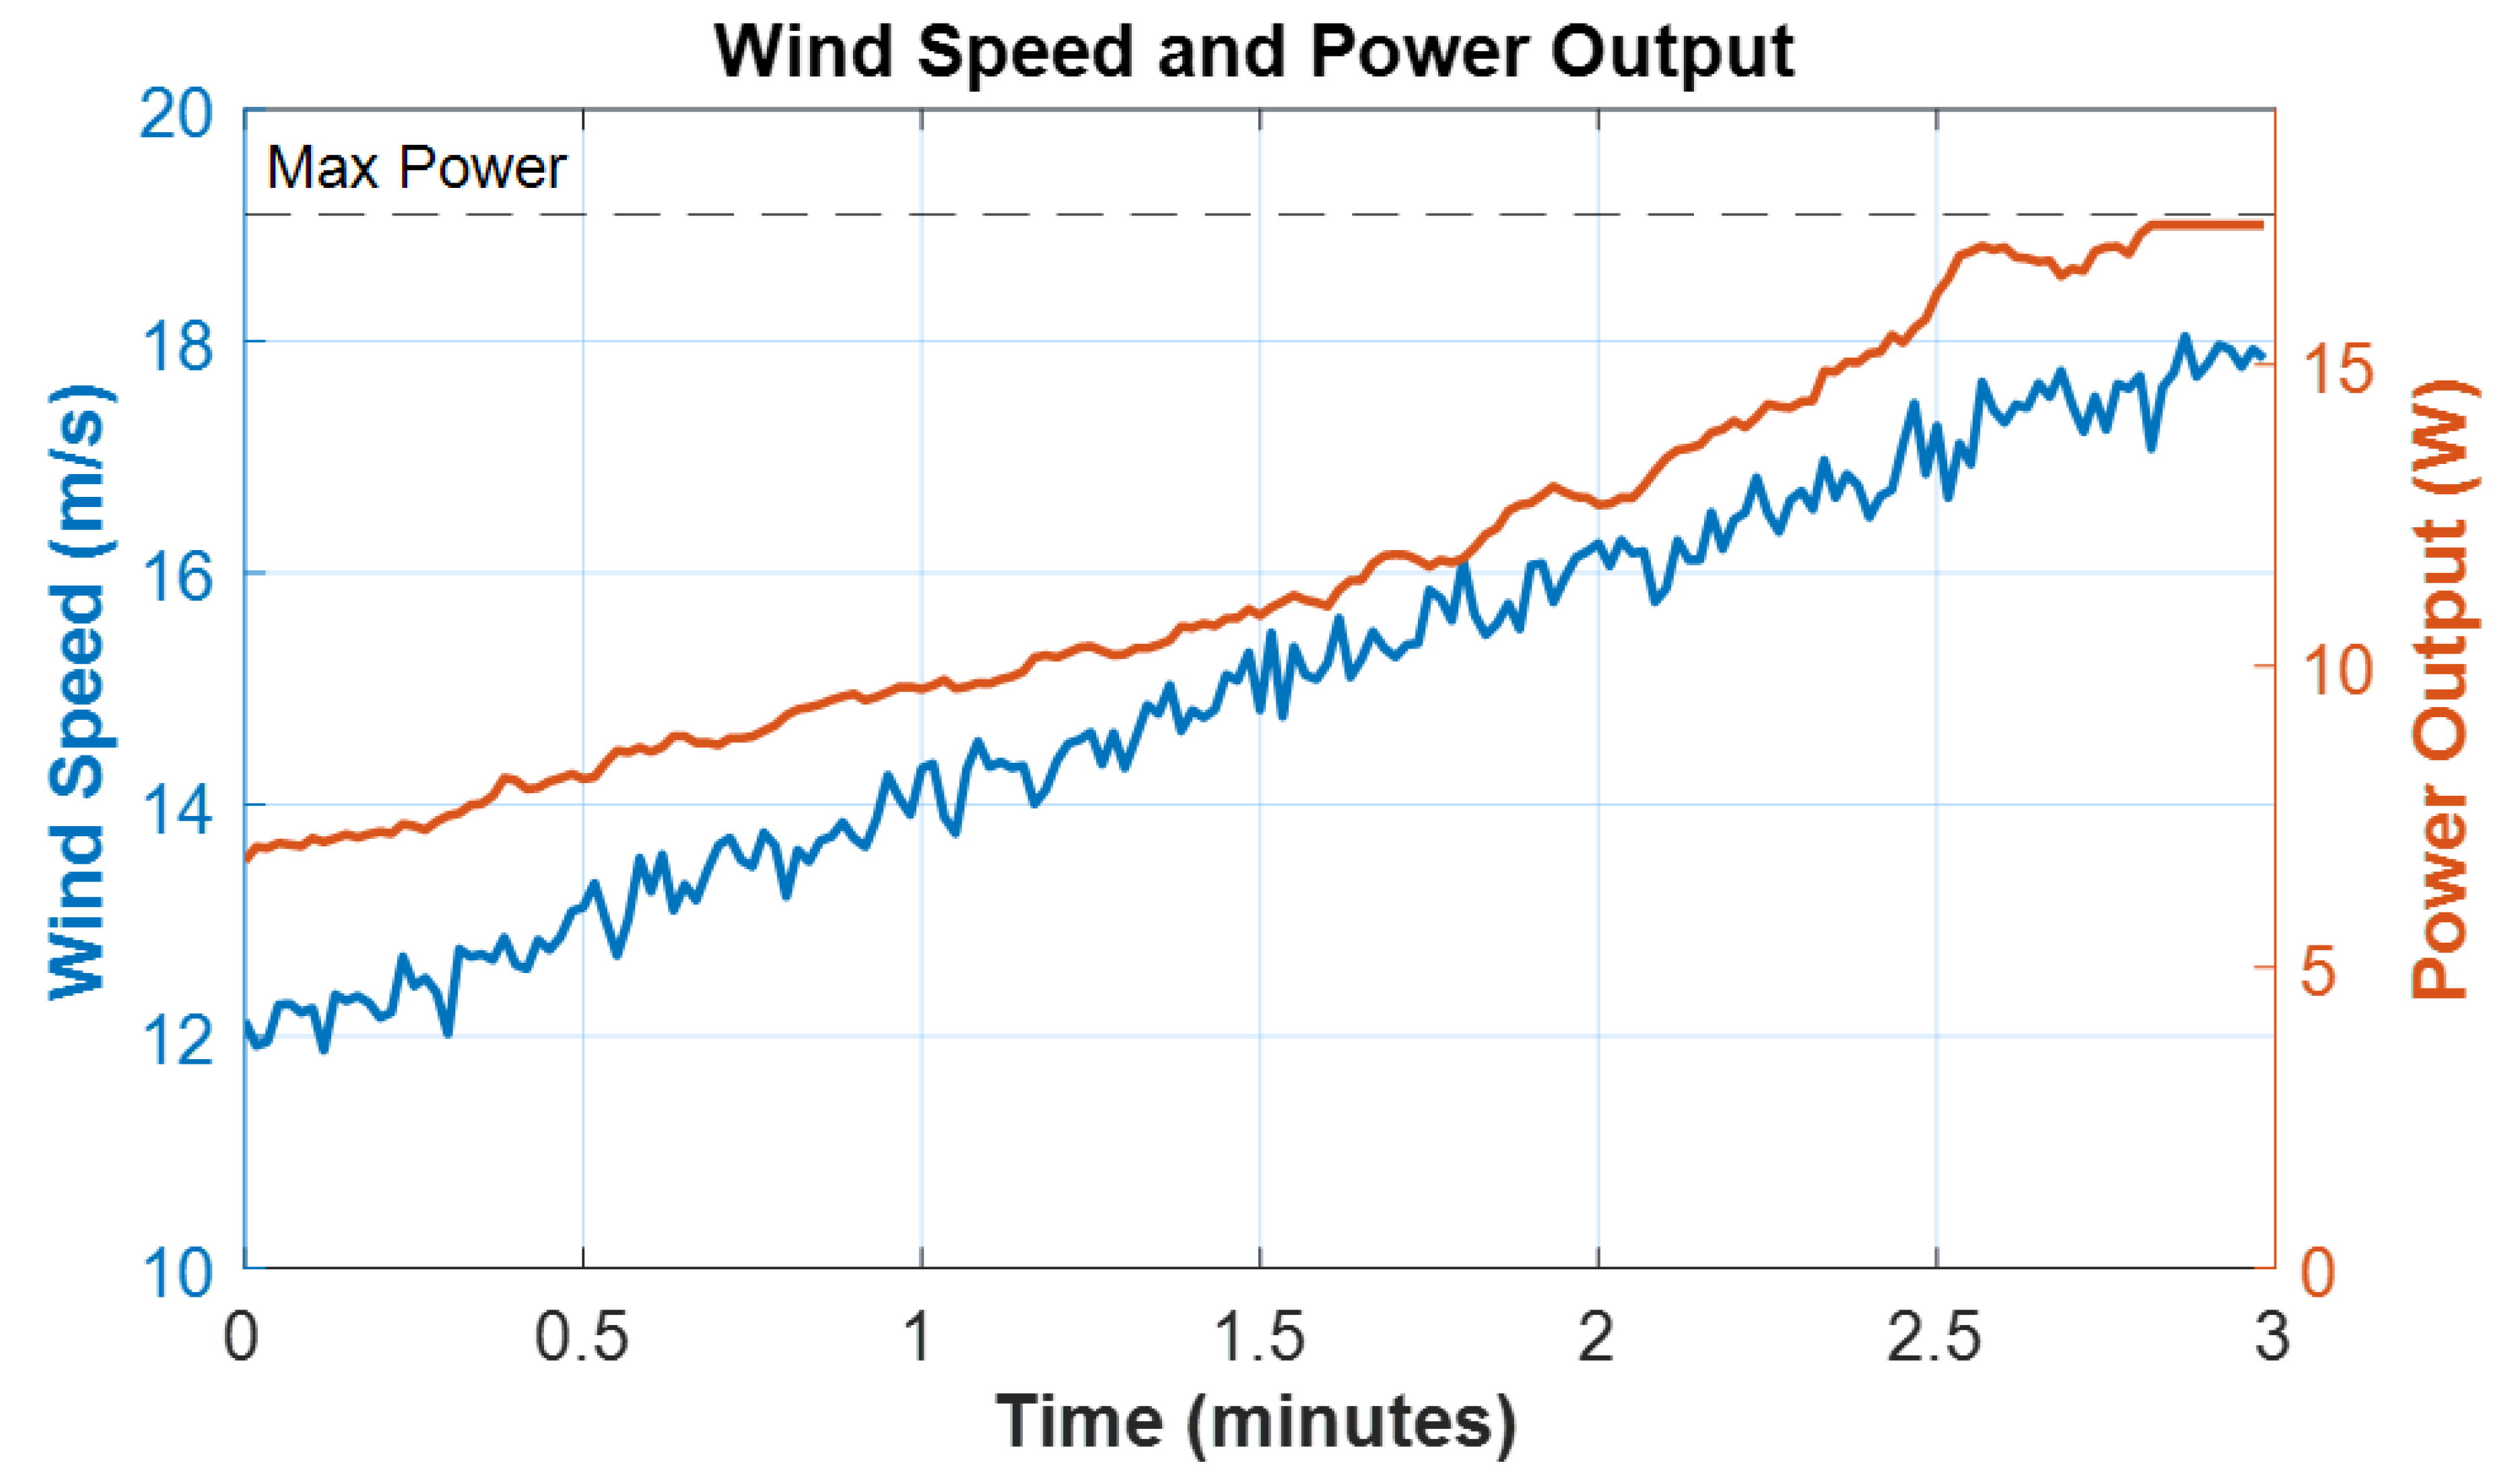
To verify the integrated functionality of the proposed monitoring and control platform, a laboratory test was conducted using the complete setup described in Section 4. The objective of the test was to evaluate the system’s real-time response under varying wind conditions and assess the performance of data acquisition, communication, and control across all subsystems.

5.1. MPPT Operation

In this test, the wind turbine operated in Maximum Power Point Tracking (MPPT) mode under variable wind conditions. The airflow incident on the rotor progressively increased over a period of 3 min using a variable-speed fan. The control signal sent to the boost converter was configured to continuously adjust the duty cycle based on real-time voltage and current measurements, following the MPPT algorithm implemented on the Arduino® controller. Throughout the experiment, wind speed, DC voltage, current, and output power were acquired and visualized via the MATLAB® supervisory interface. Figure 11 shows the evolution of wind speed and delivered power. As expected, power output increased nonlinearly with wind speed, consistent with the aerodynamic behavior of small PMSG-based turbines.
Figure 12 displays the corresponding voltage and current at the rectifier output. The voltage exhibits a steady increase in response to rising wind speed, while the current adapts to the electrical load as dictated by the MPPT control logic.

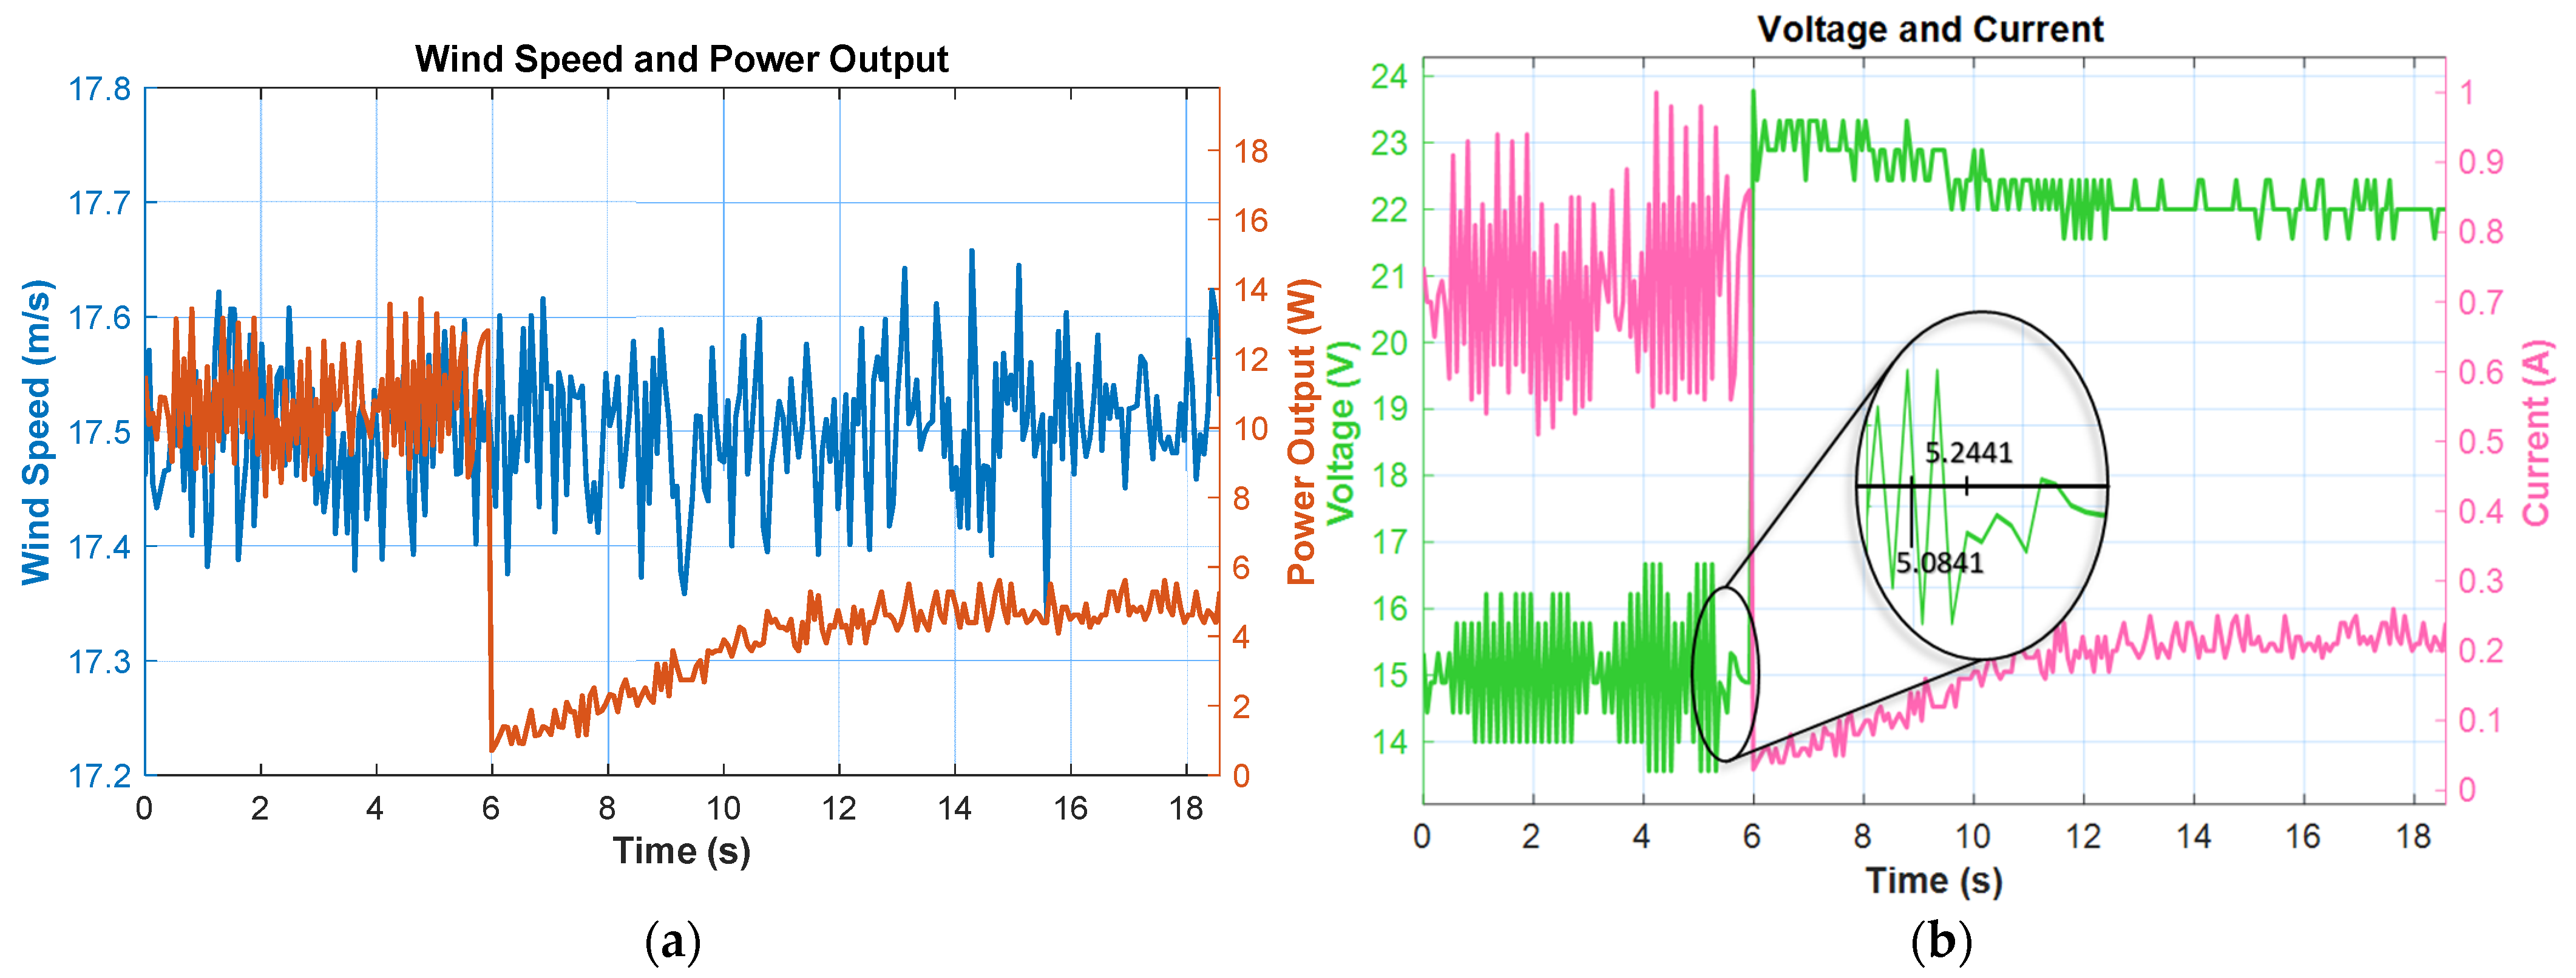
5.2. Variable Power Reference Operation

To evaluate the system’s responsiveness to dynamic control inputs, a second test was conducted under constant wind speed conditions. The wind turbine was subjected to a fixed airflow of approximately 17.5 m/s using the laboratory fan. During the test, the supervisory app was used to command a step change in the power reference sent to the Arduino®-controlled boost converter.
Initially, the power setpoint was maintained at approximately 11 W. At time t = 5.0841 s, a command was issued through the user interface to reduce the power reference to approximately 5 W. The Arduino® processed this command and began modifying the converter duty cycle at t = 5.2441 s, as recorded by the onboard sensors and illustrated in the voltage and current trace. Figure 13a presents the wind speed and electrical power output during the transition. Despite minor turbulence inherent to the fan-driven wind, the average wind speed remained close to 17.5 m/s throughout the test. Following the reference change, the power output gradually decreased, reflecting the system’s tracking of the new setpoint. Figure 13b shows the corresponding voltage and current measurements at the rectifier output. A zoomed-in view highlights the timing of the command and system response. After receiving the new reference, the Arduino® adjusted the duty cycle of the boost converter, resulting in a drop in current while voltage remained regulated. This behavior demonstrates the closed-loop response of the system to changes in the power reference.

5.3. Discussion

The laboratory test confirmed the integrated and effective operation of the proposed monitoring and control platform under controlled wind conditions. In the first experiment, the wind speed was incrementally increased, resulting in a nonlinear growth in output power consistent with the aerodynamic characteristics of small-scale PMSG-based wind turbines. Although the system’s performance was constrained using an indoor fan, the results demonstrated stable operation and proper MPPT behavior. The maximum power reached approximately 20 W, well below the nominal turbine capacity of 200 W under optimal outdoor wind conditions, highlighting the strong dependence of system performance on the available wind resource. This limitation is expected, as the airflow generated by the indoor axial fan lacks the uniformity, speed, and turbulence of real wind conditions. The reduced aerodynamic efficiency leads to lower mechanical input power, constraining electrical output despite correct system operation.
In the second experiment, conducted at constant wind speed, a step change in the power reference was issued through the MATLAB® supervisory application, from 11 W to 5 W. The system’s dynamic response to this change, captured in the measurements, exhibited a total delay of approximately 180 ms between the command issued from the app (t = 5.0841 s) and the actuation start by the Arduino® controller (t = 5.2441 s). This latency includes the communication path through the WebSocket protocol, transmission over the UART interface, and processing time within the microcontroller. According to the IEC 61400-25-5 standard [44], which defines requirements for communication performance in wind power systems, such latencies are acceptable provided they are compatible with the application’s control dynamics. In small wind systems with relatively slow response times, a delay on the order of hundreds of milliseconds is well within acceptable limits for supervisory control and power regulation tasks. The test results confirm that the platform maintained full bidirectional communication integrity, with no packet loss or command failure observed throughout the experiments. These findings validate the robustness of the proposed architecture in both monitoring and real-time control scenarios.

6. Conclusions

This paper presented a real-time remote-control platform for small wind turbines (SWTs) equipped with a permanent magnet synchronous generator (PMSG). The proposed system integrates customizable hardware components and open-source software technology, enabling efficient remote monitoring and control through an Arduino® microcontroller, a WebSocket server hosted on a Raspberry Pi®, and a graphical interface developed with MATLAB® App Designer. Experimental results demonstrated that the system can precisely control the turbine’s operating points, with deviations of less than 5% from theoretical values. This performance highlights the effectiveness of the approach in optimizing SWT operations, improving the integration of distributed small-scale renewable energy systems, and offering a flexible, scalable solution for renewable energy applications.
The proposed architecture follows the IEC 61400-25 standard for wind power system communication, providing an accessible and low-latency communication framework using the WebSocket protocol for real-time bidirectional interaction between system components. The platform’s responsiveness to power reference changes was validated through a controlled step test, during which a full communication and actuation cycle—from the supervisory app to the converter—was completed with a latency of approximately 180 ms. This delay is well within acceptable limits defined by IEC 61400-25-5 for control tasks in distributed wind systems. The ability to perform such transitions in real time confirms the system’s suitability for supervisory-level power control in addition to passive monitoring. Laboratory test results confirmed the system’s ability to make fast and accurate operational adjustments, emphasizing its applicability in the remote monitoring and control of small wind turbines in real-world scenarios.
As future work, the proposed communication platform could be extended to support Condition Monitoring Systems (CMSs) by integrating dedicated sensor nodes for vibration, temperature, or acoustic analysis. This would allow the same low-latency WebSocket-based infrastructure to transmit diagnostic data in real time, enabling fault detection capabilities to be embedded alongside supervisory control. Additionally, future validation campaigns will involve field testing on a real outdoor SWT to assess the platform’s behavior under non-stationary wind conditions and confirm its robustness beyond laboratory scenarios. It is worth noting that the current experimental setup, based on indoor fan-driven airflow, cannot fully replicate the dynamics and turbulence of natural wind, which limits the representativeness of the measured power output. These efforts will be accompanied by the implementation of basic cybersecurity mechanisms—such as encrypted communication, authentication layers, and secure middleware interfaces—to ensure the platform’s safe operation in real-world deployments.

Author Contributions

Conceptualization, J.C.-C. and G.G.-R.; methodology, R.S.-H.; software, J.C.-C. and N.M.; validation, G.G.-R. and R.S.-H.; formal analysis, J.C.-C., G.G.-R. and R.S.-H.; investigation, J.C.-C., G.G.-R., R.S.-H. and N.M.; resources, J.C.-C.; data curation, G.G.-R.; writing—original draft preparation, J.C.-C.; writing—review and editing, G.G.-R.; visualization, N.M.; supervision, R.S.-H.; project administration, R.S.-H. All authors have read and agreed to the published version of the manuscript.

Funding

This paper is part of the project “Integral control system to optimize the microgrids energy demand”, grant number PID2020-117828RB-I00, funded by the Spanish Ministry of Science, Innovation, and Universities. In addition, the author Gabriel Gómez-Ruiz is enjoying an FPU grant, number FPU21/00468, funded by the Spanish Ministry of Science, Innovation, and Universities for the training of university teaching staff during his PhD period.

Institutional Review Board Statement

Not applicable.

Informed Consent Statement

Not applicable.

Data Availability Statement

The raw data supporting the conclusions of this article will be made available by the authors on request.

Conflicts of Interest

The authors declare no conflicts of interest.

References

  1. Lau, H.C.; Tsai, S.C. Global Decarbonization: Current Status and What It Will Take to Achieve Net Zero by 2050. Energies 2023, 16, 7800. [Google Scholar] [CrossRef]
  2. Pepermans, G.; Driesen, J.; Haeseldonckx, D.; Belmans, R.; D’haeseleer, W. Distributed Generation: Definition, Benefits and Issues. Energy Policy 2005, 33, 787–798. [Google Scholar] [CrossRef]
  3. Lopez-Garcia, D.A.; Torreglosa, J.P.; Vera, D. A Decentralized P2P Control Scheme for Trading Accurate Energy Fragments in the Power Grid. Int. J. Electr. Power Energy Syst. 2019, 110, 271–282. [Google Scholar] [CrossRef]
  4. Renewable Energy Directive. Available online: https://energy.ec.europa.eu/topics/renewable-energy/renewable-energy-directive-targets-and-rules/renewable-energy-directive_en (accessed on 1 May 2025).
  5. The European Green Deal—European Commission. Available online: https://commission.europa.eu/strategy-and-policy/priorities-2019-2024/european-green-deal_en (accessed on 1 May 2025).
  6. Donadel, C.B.; Fardin, J.F.; Encarnacao, L.F. Distributed Generation Units as Ancillary Services Providers in a Pre Smart Grid Environment. Int. J. Emerg. Electr. Power Syst. 2017, 18, 20170021. [Google Scholar] [CrossRef]
  7. Madureira, A.G.; Pecas Lopes, J.A. Ancillary Services Market Framework for Voltage Control in Distribution Networks with Microgrids. Electr. Power Syst. Res. 2012, 86, 1–7. [Google Scholar] [CrossRef]
  8. Rezaei, N.; Kalantar, M. Smart Microgrid Hierarchical Frequency Control Ancillary Service Provision Based on Virtual Inertia Concept: An Integrated Demand Response and Droop Controlled Distributed Generation Framework. Energy Conv. Manag. 2015, 92, 287–301. [Google Scholar] [CrossRef]
  9. Faria, P.; Soares, T.; Vale, Z.; Morais, H. Distributed Generation and Demand Response Dispatch for a Virtual Power Player Energy and Reserve Provision. Renew. Energy 2014, 66, 686–695. [Google Scholar] [CrossRef]
  10. Aourir, J.; Locment, F. Limited Power Point Tracking for a Small-Scale Wind Turbine Intended to Be Integrated in a DC Microgrid. Appl. Sci. 2020, 10, 8030. [Google Scholar] [CrossRef]
  11. Lyu, X.; Subotić, I.; Groß, D. Unified Grid-Forming Control of PMSG Wind Turbines for Fast Frequency Response and MPPT. arXiv 2022, arXiv:2207.09536. [Google Scholar]
  12. Chalise, S.; Atia, H.; Poudel, B.; Tonkoski, R. Impact of Active Power Curtailment of Wind Turbines Connected to Residential Feeders for Overvoltage Prevention. In Proceedings of the 2016 IEEE Power and Energy Society General Meeting (PESGM), Boston, MA, USA, 17–21 July 2016; pp. 471–479. [Google Scholar]
  13. Sánchez-Herrera, R.; Mejías, A.; Márquez, M.A.; Andújar, J.M. A Fully Integrated Open Solution for the Remote Operation of Pilot Plants. IEEE Trans. Ind. Inform. 2019, 15, 3943–3951. [Google Scholar] [CrossRef]
  14. Bradney, D.; Evans, S.; Chu, M.; Clausen, P. A Low-Cost, High-Speed, Multi-Channel Arduino-Based Data Acquisition System for Wind Turbine Systems. Wind. Eng. 2020, 44, 509–518. [Google Scholar] [CrossRef]
  15. Chaudhari, K.G. Windmill Monitoring System Using Internet of Things with Raspberry Pi. Int. J. Adv. Res. Electr. Electron. Instrum. Eng. 2019, 8, 482–485. [Google Scholar] [CrossRef]
  16. Ermeey, A.K.; Taib, M.M.; Nasran, A.R.; Yushafizee, Y.M. A Vertical Wind Turbine Monitoring System Using Commercial Online Digital Dashboard. Int. J. Electr. Comput. Eng. (IJECE) 2020, 10, 5131–5138. [Google Scholar] [CrossRef]
  17. Pereira, R.I.S.; Dupont, I.M.; Carvalho, P.C.M.; Jucá, S.C.S. IoT Embedded Linux System Based on Raspberry Pi Applied to Real-Time Cloud Monitoring of a Decentralized Photovoltaic Plant. Measurement 2018, 114, 286–297. [Google Scholar] [CrossRef]
  18. Sánchez-Herrera, M.R.; Márquez, M.; de la Torre, L. Secure and Private Internet of Things for Industry, Training, and Homes: A Communications Solution for Connected Devices. IEEE Ind. Electron. Mag. 2023, 17, 14–21. [Google Scholar] [CrossRef]
  19. Sasikala, G.; Chandra, Y.P.S.; Siva, N.; Vinesh, A.S. Wind Turbine Fault Monitoring System Using MQTT. J. Phys. Conf. Ser. 2021, 2040, 012002. [Google Scholar] [CrossRef]
  20. Zhao, D.; Shao, D.; Wang, T.; Cui, L. Time-Frequency Self-Similarity Enhancement Network and Its Application in Wind Turbines Fault Analysis. Adv. Eng. Inform. 2025, 65, 103322. [Google Scholar] [CrossRef]
  21. Zhao, D.; Shao, D.; Cui, L. CTNet: A Data-Driven Time-Frequency Technique for Wind Turbines Fault Diagnosis under Time-Varying Speeds. ISA Trans. 2024, 154, 335–351. [Google Scholar] [CrossRef]
  22. Wiens, M.; Steindl, G.; Tubeuf, C.; Birkelbach, F.; Burfeind, J.; Meyer, T. DigiWind-An Open-Source Digital Twin Framework for Wind Energy Systems. IEEE Access 2024, 12, 84046–84063. [Google Scholar] [CrossRef]
  23. Vairavasundaram, I.; Ramu, S.K.; Stephenraj, J.P.; D, O.P.; Irudayaraj, G.C.R. IoT Based Monitoring System for DFIG Based Wind Turbines under Voltage Dips. E-Prime-Adv. Electr. Eng. Electron. Energy 2024, 9, 100690. [Google Scholar] [CrossRef]
  24. Alam, M.; Kumar, K.; Verma, S.; Dutta, V. Renewable Sources Based DC Microgrid Using Hydrogen Energy Storage: Modelling and Experimental Analysis. Sustain. Energy Technol. Assess. 2020, 42, 100840. [Google Scholar] [CrossRef]
  25. Gómez-Ruiz, G.; Sánchez-Herrera, R.; Clavijo-Camacho, J.; Cano, J.M.; Ruiz-Rodríguez, F.J.; Andújar, J.M. A Versatile Platform for PV System Integration into Microgrids. Electronics 2024, 13, 3995. [Google Scholar] [CrossRef]
  26. Deowan, M.d.E.; Nuhel, A.K.; Sazid, M.M.; Meghla, R.T.; Haider, I.; Hazari, M.d.R. Design and Analysis of IoT-Based Adaptive Microgrid System Including Renewable Energy Sources for Decentralized Zones. In Proceedings of the 2023 3rd International Conference on Robotics, Electrical and Signal Processing Techniques (ICREST), Dhaka, Bangladesh, 7–8 January 2023; pp. 84–89. [Google Scholar]
  27. Cabrera, M.H.; Gómez, A.B.; Torres, C.J.; Morales, A.S.; Ramírez, A.G. Integration of Industrial Power Quality Analyzer and Open Source Hardware and Software Solution for Microgrids Monitoring. In Proceedings of the 2019 IEEE CHILEAN Conference on Electrical, Electronics Engineering, Information and Communication Technologies (CHILECON), Valparaiso, Chile, 13–27 November 2019; pp. 1–6. [Google Scholar]
  28. Truong, D.-N.; Thi, M.-S.N.; Ngo, V.-T.; Hoang, A.-Q. Development of the Monitoring Program for an Integrated Small-Scale Wind and Solar Systems Based on IoT Technology. J. Sci. Technol. Issue Inf. Commun. Technol. 2021, 19, 26–31. [Google Scholar] [CrossRef]
  29. Wang, J.; Li, D.; Lv, X.; Meng, X.; Zhang, J.; Ma, T.; Pei, W.; Xiao, H. Two-Stage Energy Management Strategies of Sustainable Wind-PV-Hydrogen-Storage Microgrid Based on Receding Horizon Optimization. Energies 2022, 15, 2861. [Google Scholar] [CrossRef]
  30. Li, S.; Patnaik, S.; Li, J. IoT-Based Technologies for Wind Energy Microgrids Management and Control. Electronics 2023, 12, 1540. [Google Scholar] [CrossRef]
  31. Yang, F.; Wang, D. IoT-Enabled Intelligent Fault Detection and Rectifier Optimization in Wind Power Generators. Alex. Eng. J. 2025, 116, 129–140. [Google Scholar] [CrossRef]
  32. Senanayaka, J.S.L.; Karimi, H.R.; Robbersmyr, K.G. A Novel Soft-Stall Power Control for a Small Wind Turbine. In Proceedings of the 2017 IEEE 26th International Symposium on Industrial Electronics (ISIE), Edinburgh, UK, 19–21 June 2017; pp. 940–945. [Google Scholar]
  33. Hameed, Z.; Vatn, J.; Heggset, J. Challenges in the Reliability and Maintainability Data Collection for Offshore Wind Turbines. Renew. Energy 2011, 36, 2154–2165. [Google Scholar] [CrossRef]
  34. Escudero-Quintero, C.; Guzman-Rodriguez, J.P.; Villegas-Ceballos, J.P.; Henao-Bravo, E.E.; Gonzalez-Montoya, D. Flexible Hardware for Teaching and Research in Renewable Energy and Off-Grid Microgrids. HardwareX 2025, 22, e00636. [Google Scholar] [CrossRef]
  35. Cano, J.M.; Martin, A.D.; Herrera, R.S.; Vazquez, J.R.; Ruiz-Rodriguez, F.J. Grid-Connected PV Systems Controlled by Sliding via Wireless Communication. Energies 2021, 14, 1931. [Google Scholar] [CrossRef]
  36. Clavijo-Camacho, J.; Gomez-Ruiz, G.; Ruiz-Rodriguez, F.J.; Sanchez-Herrera, R. A Modular IGBT Power Stack − Based and Open Hardware Framework for Small Wind Turbines Assessment. Sustain. Energy Technol. Assess. 2024, 66, 103804. [Google Scholar] [CrossRef]
  37. UNE-EN 61400-25-1:2007; Wind Turbines—Part 25-1: Communications for Monitoring and Control of Wind Power Plants—Overall Description and Principles. AENOR Spanish Association for Standardization (AENOR): Madrid, Spain, 2007.
  38. LV 25-P | LV25 | Closed Loop Hall Effect. Available online: https://www.lem.com/en/product-list/lv-25p (accessed on 2 May 2025).
  39. LA 55-P | LA55 | Closed Loop Hall Effect. Available online: https://www.lem.com/en/product-list/la-55p (accessed on 2 May 2025).
  40. Komarizadehasl, S.; Lozano, F.; Antonio Lozano-Galant, J.; Ramos, G.; Turmo, J. Low-Cost Wireless Structural Health Monitoring of Bridges. Sensors 2022, 22, 5725. [Google Scholar] [CrossRef] [PubMed]
  41. Python 3.13 Documentation. Available online: https://docs.python.org/3/ (accessed on 13 June 2025).
  42. GNU Octave. Available online: https://octave.org/index (accessed on 14 June 2025).
  43. jebej/MatlabWebSocket. Available online: https://es.mathworks.com/matlabcentral/fileexchange/50040-jebej-matlabwebsocket (accessed on 3 May 2025).
  44. UNE-EN 61400-25-5:2007; Communications for Monitoring and Control of Wind Power Plants—Conformance Testing. AENOR Spanish Association for Standardization (AENOR): Madrid, Spain, 2007.
Figure 1. Wind energy conversion system.
Applsci 15 06887 g001
Figure 2. Communication model adapted from the IEC 61400-25 standard [37] to the proposed SWT remote-control system divided by layers.
Applsci 15 06887 g002
Figure 3. Printed circuit board designed to measure the voltage and current generated by the wind turbine: (a) layout design; (b) assembled board; (c) schematic diagram.
Applsci 15 06887 g003
Figure 4. Wind speed sensor connected to the Arduino® board.
Applsci 15 06887 g004
Figure 5. Designed app to monitor and control the SWT.
Applsci 15 06887 g005
Figure 6. Wind turbine model (Rutland FM910-4) used in the experimental setup.
Applsci 15 06887 g006
Figure 7. Diode bridge rectifier and ripple capacitor.
Applsci 15 06887 g007
Figure 8. Modular IGBT power stack: (a) appearance; (b) electrical scheme.
Applsci 15 06887 g008
Figure 9. Bidirectional power supply that emulates a Li-ion Battery.
Applsci 15 06887 g009
Figure 10. Complete experimental set-up of the platform presented.
Applsci 15 06887 g010
Figure 11. Wind speed and power output plot shown in the monitoring and control app.
Applsci 15 06887 g011
Figure 12. Voltage and current plot shown in the monitoring and control app.
Applsci 15 06887 g012
Figure 13. Transient response to the commanded change in power reference: (a) wind speed and power output; (b) voltage and current.
Applsci 15 06887 g013
Table 1. Comparison of representative control and communication systems for small wind turbine applications.
Control/Monitoring Systems
CriteriaArduino + Raspberry Pi (WebSocket) + PC (MATLAB App)Commercial SCADA Systems (e.g., Siemens WinCC, Schneider EcoStruxure, ABB/Emerson)ZigBee-Based Wireless ControlIoT-Based Solutions (ESP32 + MQTT, Node-RED, ThingsBoard, Blynk)PLC-Based Traditional Systems
Bidirectional CommunicationYes—fully supported via Arduino + Raspberry Pi + MATLAB GUIYes—standard SCADA feature for supervisory controlYes—supported, but mainly low-speed actionsYes—inherent to MQTT and cloud dashboardsYes—PLCs offer deterministic bidirectional communication
Real-Time ResponsivenessSub-second (non-deterministic); suitable for supervisory tasksModerate (seconds); real-time handled by PLCs, not SCADAModerate (100–500 ms); not for fast control loopsGood (<1 s); depends on network/cloud latencyHigh (ms); hard real-time via scan cycles
Protocol FlexibilityHigh—open source (RS232 y WebSocket)High—supports industrial protocols (Modbus, OPC UA 1)Medium—ZigBee only; needs gateway for othersVery High—supports MQTT, HTTP, REST, WebSocketMedium—limited to industrial fieldbuses/protocols
Integration of Customized Logic (MPPT, Curtailment, etc.)High—Fully programmable (Arduino via MATLAB)Moderate—Done externally (PLC), limited inside SCADAModerate—Possible in MCU nodes but limited useHigh—Flexible in both device and cloud layersHigh—Fully programmable via IEC languages
Ease of Sensor Integration (Modularity)High—Add sensors easily via Arduino’s analog pinsModerate—Requires PLC IO config and engineering effortHigh—Nodes are plug-and-play in mesh topologyHigh—Very flexible; dynamic MQTT topics, modularHigh—Add IO modules; needs config and programming
Open Access and Reprogrammability (for users/developers)Open-source core; compatible with open/proprietary toolsLimited—Vendor-locked, license-based customizationGood—Open protocol, MCU flexibilityExcellent—Open SDKs, full control of stackModerate—Logic modifiable, but closed firmware
Target Application ScaleSmall—Ideal for 1–5 turbines, microgrids, researchMedium–large—Centralized wind farms and utilitiesSmall—Suitable for sensor networks or campus setupsSmall–medium—Distributed setups, virtual wind farmsSmall–medium—Ideal for turbine-level automation
Cost and ComplexityVery low cost, moderate DIY complexityVery high cost, high engineering complexityLow cost, moderate setup/network complexityLow–moderate cost, user-friendly interfacesHigh cost, moderate programming complexity
1 Open Platform Communications Unified Architecture.
Table 2. Components of the voltage and current measurement board.
Component in Figure 3NameAccuracyDescription
1LEM® LV 25-P±0.9% (of full scale)Voltage transducer used to measure the DC bus voltage after rectification. Outputs a scaled analog voltage proportional to the measured DC voltage.
2LEM® LA 55-P±1.0% (typical, of full scale)Hall-effect current transducer for non-invasive current measurement. Measures the current flowing through the DC line and provides an analog output.
3TRACO POWER TEN 3-1211±1.0% output voltage regulationIsolated DC–DC converter that provides ±15 V dual supply for the analog sensors. Ensures power isolation between the sensing circuit and the main board.
4TRACO POWER YN 06-12D15±2.0% output voltage regulation (typ.) 1Dual output power module that delivers regulated ±15 V from a 12 V input, supplying power to the transducers with electrical isolation.
5R = 50 kΩ±1%Series resistor connected to the primary side of the LV 25-P for input scaling and current limitation.
6R = 220 Ω±1%Converts the output current of the LV 25-P into a proportional voltage signal for analog acquisition.
7R = 100 Ω±1%Converts the output current of the LA 55-P into a proportional voltage signal for analog acquisition.
1 typical value.
Disclaimer/Publisher’s Note: The statements, opinions and data contained in all publications are solely those of the individual author(s) and contributor(s) and not of MDPI and/or the editor(s). MDPI and/or the editor(s) disclaim responsibility for any injury to people or property resulting from any ideas, methods, instructions or products referred to in the content.

