Abstract
The optimization of design strategies in loading and waiting scenarios is of great significance for enhancing user experience. This study focuses on the click-to-load waiting scenario in mobile device interfaces and systematically analyzes the user experience performance of three design strategies—the interface type, loading indicator, and layout—across different page transition types (including the tab page, content page, and half-screen overlay). Based on questionnaire responses and experimental data (N = 90) collected from participants aged 20–29, we assessed subjective user perceptions across five validated metrics: time perception, loading speed, satisfaction, emotional valence, and arousal level. The results revealed significant differences among strategies in terms of loading speed perception, time awareness, and emotional responses. Notably, progressive loading strategies proved particularly effective in enhancing user satisfaction and alleviating temporal cognitive load. This study summarizes the characteristics of strategy applicability and proposes general optimization recommendations, offering both theoretical insights and practical guidance for designing loading feedback in mobile device interfaces.
1. Introduction
With the widespread adoption of high-speed networks, mobile users’ expectations for system responsiveness have continuously increased, making page loading a critical factor influencing interaction experience [1,2]. Even millisecond-level delays can trigger user frustration, reduce satisfaction, and lead to rapid page abandonment [3,4]. Against this backdrop, users’ subjective experience during loading has become a growing concern in user experience optimization [5,6,7]. Existing research has primarily sought to enhance the perceived quality of experience (QoE) by improving loading indicators [8] and interface layouts [9], with visual feedback showing significant effectiveness in alleviating wait-related anxiety, regulating emotions, and extending user patience, as demonstrated by Branaghan and Sanchez [10]. However, most of these studies have focused on static interfaces or single-strategy conditions (e.g., Ohtsubo et al. [11] and Branaghan & Sanchez [10]), lacking a systematic exploration of multi-strategy adaptability in dynamic transition scenarios. To address this gap, the present study focuses on click-to-load scenarios in mobile device interfaces, systematically analyzing the user effects of various waiting strategies across multi-level page transitions, with the aim of providing theoretical support and design guidance for optimizing the loading experience.
Page-level click-to-load scenarios refer to the content transition and loading processes triggered by navigation actions (e.g., clicking menus, tabs, or list items) in applications or web pages, typically occurring during the high-frequency, short-duration interactions that follow a user’s entry into the system. Users are highly sensitive to the response speed following a click; delayed feedback can easily trigger anxiety and disrupt operations [12]. Against this backdrop, the design of feedback during the click-to-load phase is crucial for maintaining interaction continuity, enhancing the perception of fluidity, and improving overall satisfaction.
Visual feedback is commonly employed on loading screens to enhance the quality of user experience [3,5]. Based on an empirical survey of over 40 mainstream mobile applications (as shown in Figure 1), we identified that users primarily experience four common page-level waiting and loading scenarios: app launch loading, click-to-load, pull-to-refresh, and upload/download processes. As a high-frequency interactive scenario within the page hierarchy, click-to-load—owing to its complex interaction process and sensitivity to time—emerges as a key factor influencing user perception and satisfaction [13]. Furthermore, the page transition structure within the click-to-load scenario is further subdivided into three typical sub-scenarios: tab page transitions, content page transitions, and half-screen overlay pop-ups. Therefore, this study adopts a mixed factorial design of three transition scenarios (tab page, content page, and half-screen overlay) × multiple (strategy types) to investigate the effects of the interface strategy, loading indicator strategy, and layout strategy on user waiting experience across different page transition types, and to derive corresponding design strategies.
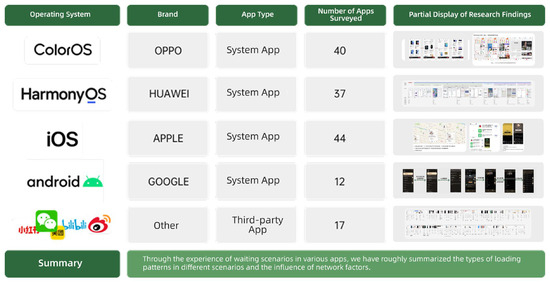
Figure 1.
Empirical research on mainstream mobile applications.
The main contributions of this article are as follows:
- Systematically categorizing mobile click-to-load scenarios and clearly defining three typical scenarios: tab page, content page, and half-screen page;
- Constructing a comprehensive design framework that encompasses interface strategy, symbol strategy, and layout strategy;
- Employing a multidimensional evaluation system to systematically investigate users’ subjective experiences during the click-to-load process, thereby providing a theoretical basis for design practice and assisting designers in optimizing feedback strategies across different transition scenarios to enhance the mobile waiting experience and interaction quality.
2. Related Work
2.1. Classification of Loading Waiting Scenarios
Loading waiting scenarios refer to the waiting states experienced by users during interactions with a system caused by content loading, data requests, or interface transitions. In user experience research, the classification of waiting scenarios has received widespread attention, with related studies exploring multiple dimensions such as visual feedback, loading symbol optimization [8], and interface layout [9]. In the existing literature, the visual feedback types for loading screens primarily include countdowns [14,15], progress bars [16,17,18,19,20], rotating buttons [21,22], passive animations [23], interactive animations [23], and skeleton screens [24]. However, despite these studies providing a theoretical basis for understanding users’ psychological and behavioral responses while waiting, there remains a lack of research that systematically classifies and deeply analyzes loading waiting scenarios from the structural perspective of page-level transitions. Against this backdrop, the current study further focuses on loading waiting scenarios in mobile page click-to-transition contexts.
This study surveyed 38 mainstream mobile applications under systems such as OPPO, Huawei, and iOS (as shown in Figure 2), and based on the intentions of data requests triggered by users during operations, loading was classified based on waiting scenarios into four categories: app launch loading, click-to-load, pull-to-refresh, and uploads/downloads. Among these, click-to-load and pull-to-refresh processes both belong to page-level waiting scenarios, with the specific classification depicted in Figure 2.
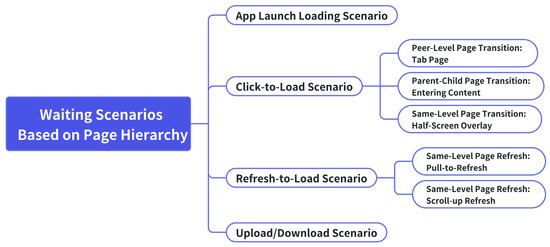
Figure 2.
Classification of waiting scenarios based on page hierarchy.
This study focuses on the click-to-load scenario within page-level waiting, which is a context frequently encountered during everyday mobile application use. Such scenarios are typically triggered when users click on interactive elements, which, in turn, initiate page transitions and content loading. Based on the hierarchical structure of pages, click-to-load scenarios can be further subdivided into three typical transition types (as shown in Figure 3):
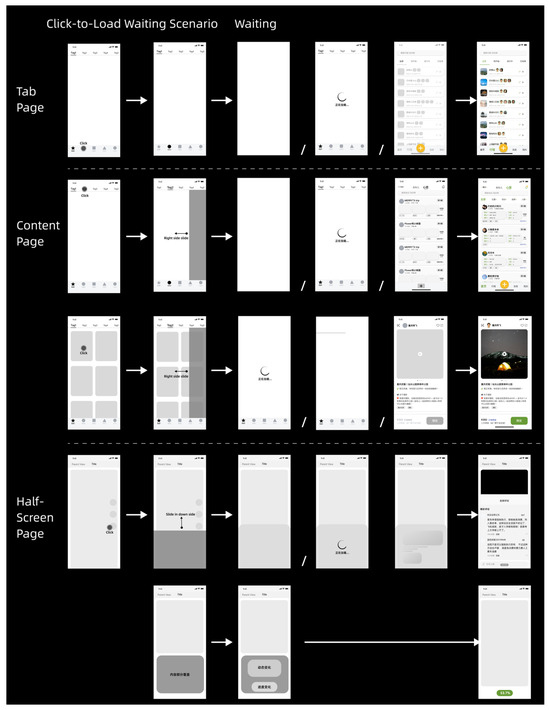
Figure 3.
Click-to-load waiting scenario classification.
- Tab page transitions refer to lateral switches between pages at the same level, commonly observed in the functional tabs of a home page’s bottom navigation bar. When a user clicks on a tab—such as “Home”—thereby triggering a loading operation, the system updates the page content to display the most recent data.
- Content page transitions involve hierarchical changes between parent and subordinate pages. This is often seen in content-centric applications, such as those featuring videos or illustrated notes, where users click on titles, images, or card modules to navigate from an information aggregation page to a subpage that presents detailed content.
- Half-screen transitions entail the partial overlay of a new interface on the existing page, which is a pattern frequently found in interactive zones like comment sections or pop-up detail panels. This type of transition typically appears as a floating layer that does not completely obscure the underlying page and supports localized refreshes to update its content.
Through this structured classification, the present study establishes a clear contextual foundation for the subsequent evaluation of click-to-load waiting experiences and the development of corresponding design strategies.
2.2. Design Strategies for Waiting Scenarios
In recent years, the design of waiting scenarios has increasingly evolved toward a multi-channel sensory approach, encompassing auditory, visual, and haptic domains [25,26]. Among these designs, that of waiting experiences on mobile platforms primarily focuses on visual feedback. Visual feedback not only conveys the system’s response process but also delivers waiting-related information to users through various types of fillers [18]. Existing research has demonstrated that the type of waiting filler can significantly affect users’ time perception [8,27]. For example, Hou, D. & Yao, K. compared three filler types—video, loading modal frames, and images—and found that video fillers most effectively reduce the perceived duration of waiting [28]. Moreover, the studies by Cao and Hu indicate that, in a 5 s loading scenario, an animation that combines progress bars with graphical elements is more effective at reducing perceived waiting times than a single-element presentation [29]. Lallemand, C. & Gronier, G. further investigated the effects of four types of initial loading pages (blank, circular indicator, logo, and a combined form) on users’ psychological states, with the combined form performing optimally [9]. Although these studies have provided preliminary insights into the influence of waiting for filler types on time perception, there is still a lack of systematic and mechanistic analysis of waiting scenarios from a structural perspective. Therefore, the present research further investigates the impact mechanism of visual filler types on perceived waiting times to provide a theoretical basis for optimizing interface design.
In addition to filler type, the design strategies applied during the perceptual process of waiting also have a pronounced influence on time perception. Previous studies have attempted to obscure users’ perception of time through methods such as accelerated animations, segmented loading, and user interactions by constructing novel psychological conceptual models [19]. Harrison’s experiments revealed that, compared to constant or decelerated progress bars, acceleration-based progress bars shorten subjective waiting time more effectively—a phenomenon that can be explained by the peak-end effect [30]. Concurrently, researchers have explored that segmented loading strategies (e.g., loading the textual framework before image content) can significantly enhance the perception of the loading process and thereby reduce perceived waiting times [31]. The introduction of active interactions has also been proven to effectively alleviate waiting anxiety and diminish perceived waiting times; interactive interfaces tend to yield higher user satisfaction and a greater sense of control compared to passive loading processes [27,32].
Furthermore, the design of information presentation is another key factor influencing users’ waiting experiences. Research indicates that providing clear indications of waiting time can help users develop realistic expectations and, thus, improve their experience [33,34]. However, an excessive amount of information is not always beneficial. Lallemand and Gronier found that high-information-density pages may actually lead to longer perceived waiting times [9]. Hou, D.& Yao, K. et al. also observed that, compared to a blank screen, animated loading pages with richer information content are perceived as taking longer during brief waiting periods [28]. The content, speed, type of emotional activation, and task complexity all contribute to users’ overall assessment of waiting times. Therefore, appropriately managing information density and ensuring task relevance are critical design strategies for optimizing the waiting experience and mitigating distortions in time perception.
In summary, the type of waiting filler, the dynamic design of the perceptual process, and the strategies for information presentation all play crucial roles in influencing users’ perceived waiting times. Although preliminary progress has been made in these areas, further exploration is needed to integrate these design elements effectively within mobile device interfaces. This study, grounded in the visual feedback mechanism, systematically analyzes the effects of various waiting indicator designs on perceived time, user emotions, and satisfaction, thereby providing theoretical support and design guidance for enhancing the user waiting experience.
2.3. Design of Waiting Experience Metrics
The waiting experience is a comprehensive manifestation of users’ subjective perceptions and objective behaviors in response to loading or response delays during the use of products or services. It not only affects overall user satisfaction but also involves multiple dimensions, such as time perception and emotional responses [35]. Thus, how can the quality of the waiting experience be measured? This question has become one of the key issues in current user experience design research.
In recent years, scholars have progressively established multidimensional evaluation systems for waiting experience, which mainly encompass the following three aspects:
- User Experience Satisfaction Metrics: hese originated from the Customer Satisfaction (CSAT) theory proposed in 1965 and typically utilize a five-point Likert scale to assess users’ immediate evaluations upon completing product functions (ranging from “very satisfied” to “very dissatisfied”). This metric is widely applied in the fields of internet services, e-commerce, and software products as a fundamental tool for measuring user satisfaction with design, interface, and functionality [36,37,38].
- Time Perception Metrics: These include methods such as the time perception technique and subjective loading speed questionnaires. The former focuses on users’ ability to perceive and reproduce time intervals, reflecting differences in attention and cognitive load; the latter captures users’ subjective ratings of loading time, thereby revealing the relationship between design fillers and users’ intuitive impressions, which can assist designers in optimizing loading strategies [39].
- Emotion-Related Metrics: Researchers employ instruments such as the PANAS scale [40] and the DASS-21 scale [41] to assess users’ emotional states during waiting periods. In recent years, the Self-Assessment Manikin (SAM), a graphical emotion self-report tool based on valence–arousal level dimensions [42], has been widely used in user emotion research. This tool allows users to indicate their emotional state through intuitive cartoon figures, thereby avoiding potential misinterpretations associated with textual descriptions.
Therefore, in designing waiting feedback, this study adopts a comprehensive approach by considering satisfaction, time perception, and emotional response. By combining questionnaire surveys with standardized scales, it conducts an in-depth analysis of users’ psychological states and behavioral reactions during waiting and constructs a waiting experience evaluation framework that accurately reflects users’ real experiences. This framework aims to provide both theoretical support and practical guidance for product optimization.
3. Methodology
3.1. Research Purpose
This study examines the effects of the interface strategy, loading indicator strategy, and layout strategy on users’ waiting experience for click-to-load scenarios on mobile applications across different page transition types (tab pages, content pages, and half-screen overlays). Based on extensive application surveys and analyses of click-to-load scenarios, three typical click-to-transition types were identified from the application framework perspective, which guided the experimental design to systematically evaluate users’ perceptions and evaluations during waiting periods.
The research aims to address the following questions are given below:
- Do different page transition scenarios have differential impacts on users’ time perception and waiting evaluations?
- How do the three interface design strategies (interface style, loading indicator, and page layout) individually affect users’ waiting experiences in various transition scenarios?
- Are there significant differences among design strategies across different transition scenarios in terms of time perception, loading speed, satisfaction, emotional valence, and arousal level?
- Is there a universal design strategy that is applicable across multiple transition scenarios?
- How are users’ subjective preferences for different transition scenarios associated with their evaluations of the waiting experience?
3.2. Experiment Design
This study employed a mixed factorial design of 3 transition scenarios (tab page, content page, half-screen overlay) × multiple strategy types to investigate user waiting experiences within click-to-load scenarios on mobile applications. Three sequential sub-experiments were systematically constructed, each corresponding to a distinct design strategy dimension: an interface strategy, loading indicator strategy, and layout strategy. In each experiment, the waiting time was uniformly set to 4 s, and the typical context of click-based page transitions was used as the experimental basis. This design progressively examines the application effects and user perceptual differences in various design strategies across multiple click-to-transition scenarios. In this design, the click-to-transition scenario functions as a within-subject variable, while the strategy type is implemented as a multi-level design. The dependent variables encompass five key user experience metrics: time perception, loading speed, satisfaction, emotional valence, and arousal level. Through systematic comparisons of different strategy combinations, this study elucidates the impact mechanisms of various factors on users’ subjective waiting perceptions and behavioral responses, thereby providing both theoretical support and practical guidance for optimizing the loading experience in mobile device interfaces.
The specific experimental designs are as follows:
- Experiment 1: Interface Strategy Experiment
This experiment investigates the impact of different waiting screen formats on user experience. Five types of waiting interfaces are set up: 1. blank screen; 2. loading screen; 3. skeleton screen; 4. loading screen + skeleton screen (1:1 combination); and 5. blank screen + loading screen (1:1 combination). These are tested across the three transition scenarios: tab page, content page, and half-screen overlay.
- Experiment 2: Loading Indicator Strategy Experiment
Building on Experiment 1, this experiment further focuses on the design of loading indicators within the interface. Three types of icons (no icon, hedonic-style icons, and regular icons) are combined with three types of text (no text, personified text, and regular text) to form a total of nine symbol combination types, which are then tested across the three transition scenarios.
- Experiment 3: Layout Strategy Experiment
Based on the findings from Experiments 1 and 2, this experiment explores the effect of content layout during page loading on the waiting experience. Two layout strategies were set up: 1. Segmented Loading (text first, then images); 2. Full Loading (text and images presented simultaneously). These were also tested within the three transition scenarios.
Each experiment employed a consistent set of dependent variables:
- Time Perception: Participants used the keyboard to replicate the perceived waiting duration.
- Loading Speed: Participants provided a subjective rating of the loading speed, ranging from very slow (1) to very fast (7).
- Satisfaction: Participants rated their satisfaction with the current waiting experience, with scores ranging from very dissatisfied (1) to very satisfied (7).
- Emotional Valence: Participants rated their current emotional state during the waiting phase, with values ranging from very unhappy (1) to very happy (9).
- Arousal Level: This rating reflects the intensity of the participants’ emotions, ranging from low arousal level (1) to high arousal level (9).
The three experiments were designed to be sequentially progressive. The experimental materials (see Figure 4) and variable configurations are detailed in Table 1. By conducting systematic comparative experiments across the three transition scenarios, this study aimed to comprehensively evaluate the mechanisms by which design strategies affect user waiting experiences, thereby providing empirical evidence and strategic recommendations for optimizing mobile interface design.
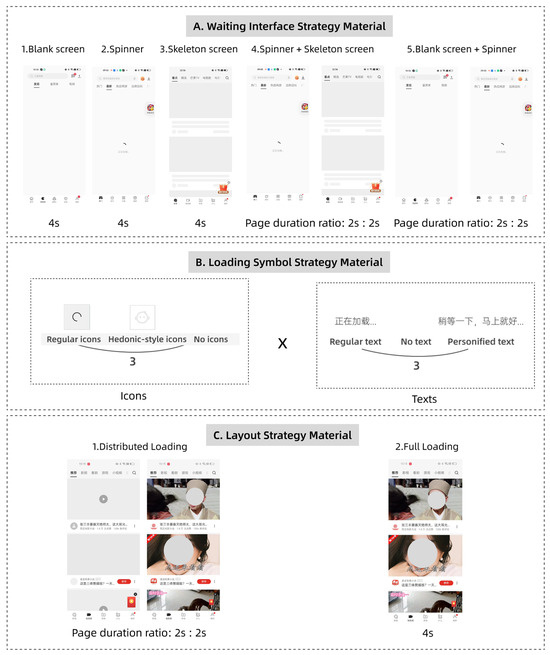
Figure 4.
Experimental materials, (A) Waiting interface strategy material; (B) loading symbol strategy material (“Loading…” and “Please wait a moment…”); (C) layout strategy materials.

Table 1.
Summary of waiting interface strategy variables, loading symbol strategy variables, and layout strategy variables in page hierarchy transition experiments.
3.3. Participants
This study employed a purposive sampling method to recruit 96 participants with prior experience using smartphones, consisting of students and faculty members from Zhejiang University. All participants voluntarily registered either online via the Zhejiang University forum or offline at the Zhetong building site and signed an informed consent form electronically before the experiment began. Participation was entirely voluntary and unpaid.
During the data collection process, the research team applied strict inclusion and exclusion criteria to screen participants. The inclusion criteria were as follows: (1) aged 18 years or older; (2) mentally healthy with no cognitive impairments; (3) physically healthy, with no functional impairments in the limbs or hand joints, and capable of operating a smartphone proficiently; (4) nearsightedness not exceeding 500 degrees, with the normal ability to view a smartphone screen. The exclusion criteria were as follows: (1) having participated in a similar experiment within the past three months to avoid learning or expectancy effects; (2) low engagement during the experiment, such as refusal to complete tasks, frequent interruptions, or evidently careless responses.
In total, 90 valid response datasets were obtained (including 51 males and 39 females). Participants ranged in age from 20 to 29 years (M = 23.29) (see Table 2). All participants had used a smartphone for more than 20 months. Their devices included mainstream brands such as iPhone and Huawei, covering various operating systems. Detailed demographic and device-related statistics are presented in Table 3.
Table 2.
Participant gender and age statistics in click-to-load scenarios.
Table 3.
Participant statistics on mobile phone brands and operating systems in click-to-load scenarios.
3.4. Experimental Setting, Equipment, and Materials
3.4.1. Equipment Description
The equipment used in the experiment included one OPPO K9 smartphone (6.43-inch AMOLED display, main screen resolution of 2400 × 1080 pixels, pixel density of 409 PPI, screen refresh rate of 90 Hz; manufactured by Guangdong OPPO Mobile Telecommunications Corp., Ltd., Dongguan, China), one Windows desktop computer, one external keyboard, and an additional smartphone for questionnaire completion.
3.4.2. Experimental Environment
The experiment was conducted in a quiet, sound-insulated room designed to minimize external disturbances, as illustrated in Figure 5. The room was well-lit with an illumination level of 400 lux, free from reflective surfaces, providing a suitable environment for smartphone operation. The ambient humidity was maintained at 50%, and the noise level was approximately 30 decibels. An experimenter was present in the room to guide participants through the procedure and monitor their questionnaire completion.
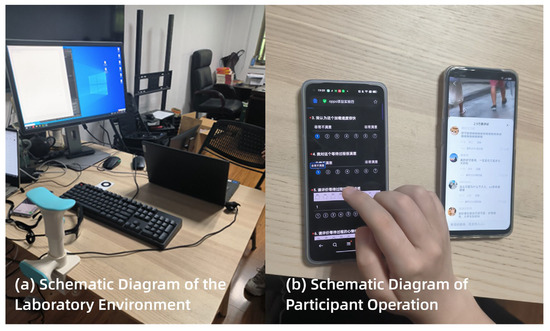
Figure 5.
Experimental environment and operation diagram. (The left device presents the questionnaire evaluating perceived loading time, satisfaction, and emotional state, while the right device displays the interactive interface used during the experiment).
The experimental scenario simulated a typical user experience in which participants encountered layered page-loading situations during everyday smartphone use. Efforts were made to replicate a realistic interaction environment. The distance between the participant’s eyes and the smartphone screen was controlled within the range of 30–40 cm, which is consistent with standard smartphone viewing conditions.
3.4.3. Materials Description
- Python Program Code:
A Python script (version 3.10.8) was used to enable keyboard-based time recording. By pressing and releasing the space bar, the system captured the perceived time interval, which was recorded as the dependent variable “time perception”. The software is available at https://www.python.org/ (accessed on 1 January 2024).
- 2.
- Experimental Stimuli:
The experimental stimuli were developed using Protopie, a professional prototyping software based on references from mainstream mobile applications (see Figure 4 for examples). This software supports local resource integration, ensuring that tasks can be completed smoothly, even under unstable network conditions. To enhance ecological validity, the content of each loading task varied across conditions. The material design underwent multiple rounds of evaluation by UI/UX designers from internet companies and was reviewed and approved by a professor of design studies and relevant doctoral researchers. Two rounds of pilot testing were conducted by the research team prior to the formal experiment to ensure the correctness of the materials. To control order effects, Latin square counterbalancing was applied across waiting scenarios to avoid sequence-related bias in the results.
- 3.
- Questionnaire Materials:
The questionnaire assessed four key dimensions of user experience, as illustrated in Figure 6. Loading speed and satisfaction were rated on a 7-point Likert scale (1–7), where higher scores indicated faster perceived speed or greater satisfaction. Emotional valence and arousal levels were measured using a 9-point Self-Assessment Manikin (SAM) scale (1–9). Specifically, for emotional valence, a score of 1 represents the most negative emotion, while a score of 9 indicates the most positive emotion. For arousal levels, 1 corresponds to the lowest emotional activation, and 9 to the highest emotional activation.
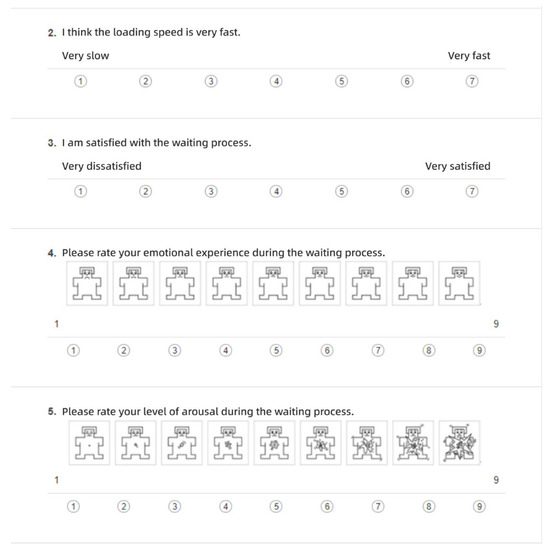
Figure 6.
Experimental questionnaire materials.
3.5. Procedure
To prevent the potential bias caused by unfamiliarity with the experiment during the first trial, a pre-experiment session was included. Participants were first guided through a preliminary scenario to familiarize themselves with the experimental interface and procedure. Only after participants demonstrated adequate understanding did the formal experiment begin, minimizing the risk of inaccurate responses due to operational unfamiliarity, as illustrated in Figure 7.
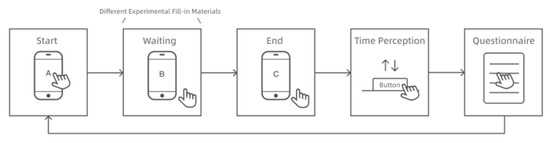
Figure 7.
Experimental flowchart.
The formal procedure was as follows:
- The experimenter instructed the participant to operate the smartphone in a designated context. After triggering a loading scenario, the participant was asked to perceive the duration of the loading screen.
- Once the perceived loading was complete, the participant was instructed to reproduce the experienced duration by holding down the space bar on the keyboard. The length of time the space bar was held down (in seconds) was recorded as the dependent variable, “time perception”.
- Following the time perception task, participants completed a subjective questionnaire. Based on their own perceptions, they rated the prior loading scenario across four dimensions: satisfaction, loading speed, emotional valence, and arousal level. This process was repeated for each loading sub-scenario.
4. Results
4.1. Waiting Interface Strategies in Page-Level Transitions
4.1.1. Tab Page Hierarchical Navigation Scenario
In the tab page scenario, repeated measure of ANOVA were conducted on various indicators under different interface strategies. The results revealed a significant effect of interface strategy on time perception in parallel page transitions (F = 8.292, p < 0.001). All interface strategies led to an underestimation of the objective’s 4 s waiting time. Ordered by mean time perception from shortest to longest, the interfaces were ranked as follows: Interface 5 (blank screen + loading spinner) < Interface 4 (spinner + skeleton screen) < Interface 3 (skeleton screen) < Interface 1 (blank screen) < Interface 2 (spinner). This indicates that Interface 5 produced the shortest perceived duration. Significant differences were also found in loading speed across the interface strategies (F = 7.876, p < 0.001). The ranking from highest to lowest for the mean perceived speed was Interface 5 > Interface 4 > Interface 2 > Interface 3 > Interface 1. Satisfaction ratings showed a significant effect as well (F = 3.665, p < 0.01), with the interfaces ranked by mean satisfaction as follows: Interface 5 > Interface 2 > Interface 3 > Interface 4 > Interface 1. For emotional valence, a significant difference was observed (F = 3.117, p < 0.05), with the mean scores ranked as Interface 5 > Interface 2 > Interface 4 > Interface 3 > Interface 1. No significant difference was found in arousal levels, though Interface 5 recorded the lowest mean arousal level score. For all within-subject factors showing significant effects, LSD post hoc tests were conducted. The detailed results are presented in Figure 8, with error bars indicating standard deviations.
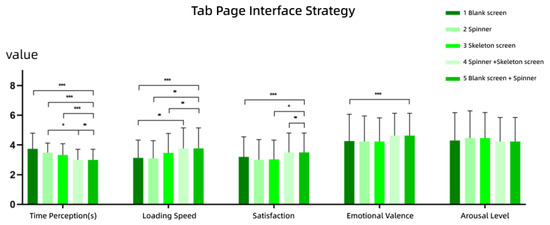
Figure 8.
Results of interface strategy for the tab page scenario (Experiment 1). Vertical lines: standard deviations (SDs). ***: p < 0.001, **: p < 0.01, *: p < 0.05.
- Time Perception: The time perception for Interface 5 was significantly lower than that for Interfaces 1, 2, 3, and 4, indicating that users perceived a shorter duration when interacting with Interface 5. Moreover, the time perception for Interface 4 was significantly lower than for Interface 2. This suggests that within the group of loading animations featuring a spinner, the addition of a two-stage skeleton screen (as shown in Interface 4) reduced users’ perceived waiting time.
- Satisfaction: Satisfaction ratings for Interface 5 were significantly higher than those for Interfaces 1, 3, and 4, indicating that users were more satisfied with Interface 5 compared to the other three.
- Loading Speed: Interface 5 was rated significantly higher in loading speed than Interfaces 1, 2, and 3. Given that the objective waiting time remained constant across all conditions, this result implies that users subjectively experienced Interface 5 to be faster.
- Emotional Valence: Interface 5 received significantly higher ratings for emotional valence compared to Interface 1, suggesting that it elicited more positive emotions. Interface 1, as a blank screen without any feedback during the waiting period, failed to provide users with a sense of progress, potentially contributing to more negative emotional responses.
4.1.2. Content Page Hierarchical Navigation Scenario
In the content page scenario, repeated measures of ANOVA were conducted on users’ responses across different interface strategies. The results showed that for hierarchical page transitions (parent–child navigation), there were significant differences in time perception across the five interface conditions (F = 6.759, p < 0.001). The mean reproduced durations, ranked from shortest to longest, were as follows: Interface 5 (blank screen + spinner) < Interface 1 (blank screen) < Interface 4 (spinner + skeleton screen) < Interface 3 (skeleton screen) < Interface 2 (spinner), indicating that Interface 5 led to the shortest perceived waiting time. Significant differences were also found in the loading speed among the interface strategies (F = 3.023, p < 0.05). Ranked from highest to lowest means, the order was Interface 5 > Interface 4 > Interface 3 > Interface 1 > Interface 2. This suggests that users perceived Interface 5 to be the fastest. Satisfaction ratings also showed significant variation across interface conditions (F = 2.784, p < 0.05). From highest to lowest, the mean satisfaction scores were Interface 5 > Interface 4 > Interface 2 > Interface 3 > Interface 1. No significant differences were observed in emotional valence, although Interface 4 yielded the highest average score. Similarly, no significant differences were found in arousal level, with Interface 5 having the lowest mean arousal level score. LSD post hoc tests were conducted on all dimensions with significant within-subject effects. The results are visualized in Figure 9.
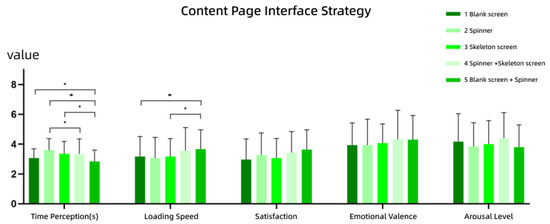
Figure 9.
Results of interface strategy for content page scenario (Experiment 1). Vertical lines: standard deviations (SDs). **: p < 0.01, *: p < 0.05.
- Time Perception: The reproduced duration for Interface 5 was significantly lower than that Interfaces 1, 2, and 3, indicating that users perceived Interface 5 to have a shorter wait time. Additionally, Interface 4 had a significantly lower perception of time than Interface 2, suggesting that the inclusion of a two-stage skeleton screen in spinner-based loading interfaces reduced users’ perceived wait duration.
- Loading Speed: Interface 5 yielded significantly higher loading speed than Interfaces 1 and 3. Given that the actual waiting time remained constant across conditions, this indicates that users subjectively experienced Interface 5 to be faster.
4.1.3. Half-Screen Page Hierarchical Navigation Scenario
In the half-screen page scenario, repeated measures of ANOVA were conducted to analyze participants’ responses across different interface strategies. The results indicated that in this context of intra-level navigation within the same page, there were significant differences in time perception for different waiting interface strategies (F = 3.657, p < 0.01). The average reproduced durations, ranked from shortest to longest, were as follows: Interface 5 (blank screen + spinner) < Interface 3 (skeleton screen) < Interface 4 (spinner + skeleton screen) < Interface 1 (blank screen) < Interface 2 (spinner). This suggests that Interface 5 resulted in the shortest perceived wait time. There were no significant differences in loading speed, although Interface 5 yielded the highest mean rating. Significant differences were found in user satisfaction (F = 2.551, p < 0.05). Ranked from highest to lowest, the satisfaction scores were Interface 5 > Interface 4 > Interface 3 = Interface 2 > Interface 1. There were no significant differences in emotional valence, although Interface 5 had the highest mean value. Similarly, the arousal level showed no significant difference, with Interface 5 having the lowest mean arousal level. LSD post hoc tests were performed on all within-subject variables that showed significant effects. The results are illustrated in Figure 10.
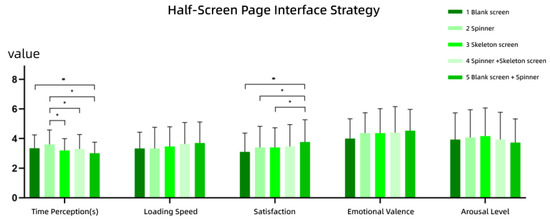
Figure 10.
Results of interface strategy for the half-screen page scenario (Experiment 1). Vertical lines: standard deviations (SDs). **: p < 0.01, *: p < 0.05.
- Time Perception: The time perception for Interface 5 was significantly lower than that of Interfaces 1 and 2, indicating that users perceived a significantly shorter wait duration using Interface 5. Interface 2 showed a significantly higher time perception than Interfaces 3, 4, and 5, suggesting that, among spinner-based interfaces, adding a secondary screen (such as a blank or skeleton screen) helped reduce the perceived waiting time.
- Satisfaction: Interface 5 yielded significantly higher satisfaction than Interfaces 1, 2, and 3, demonstrating that users preferred the dual-stage feedback design (blank screen + spinner) over single-element strategies.
4.2. Loading Symbol Strategies for Hierarchical Page Transitions
4.2.1. Tab Page Scenario
- (1)
- Icons
In the tab page scenario, repeated measures of ANOVA were conducted to examine participants’ responses to different loading icon strategies. The results showed that in page-level lateral transitions, there was no significant difference in time perception across the icon conditions. Among them, the no icon condition yielded the highest average of perceived duration. Similarly, there was no significant difference in loading speed across the icon strategies. However, satisfaction showed a significant difference (F = 7.953, p < 0.01). In terms of mean values, the ranking was hedonic-style icon > regular icon > no icon. Emotional valence also showed a significant difference (F = 10.233, p < 0.001), with the same ranking: hedonic-style icon > regular icon > no icon. There was no significant difference in arousal level across the conditions, although the no icon condition recorded the lowest average arousal level. LSD post hoc tests were conducted for the dimensions with significant within-subject effects. The results are presented in Figure 11.
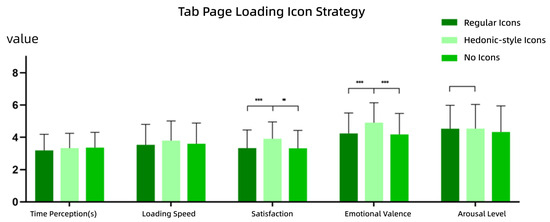
Figure 11.
Results of icon strategy for the tab page scenario (Experiment 2). Vertical lines: standard deviations (SDs). ***: p < 0.001, **: p < 0.01.
- Satisfaction: Participants reported significantly higher satisfaction for the hedonic-style icon conditions compared to both the regular icon and no icon conditions. This suggests that users tend to prefer hedonic-style icons, likely due to their visual appeal and entertainment value. No significant difference was found between the regular icons and no icon conditions.
- Emotional Valence: The hedonic-style icon condition also led to significantly more positive emotional responses than the other two conditions, indicating that hedonic-style icons can evoke more favorable affective experiences. There was no significant difference between regular icons and no icon conditions.
- Arousal Level: No significant difference was found across the icon strategies, suggesting that icon type does not notably affect users’ arousal levels.
- (2)
- Text
In the tab page scenario, participants’ responses to different loading text strategies were also analyzed using repeated measures of ANOVA. The results revealed no significant difference in time perception among the text conditions, with personified text yielding the lowest average perceived duration. Similarly, loading speed did not differ significantly among the conditions, although the personified text condition achieved the highest average subjective speed rating. No significant differences were found for satisfaction, emotional valence, or arousal level. However, personified text consistently scored the highest means for satisfaction and emotional valence, while the no-text condition showed the highest average for the arousal level. The results are shown in Figure 12.
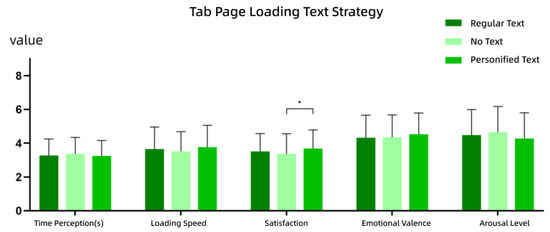
Figure 12.
Results of text strategy for the tab page scenario (Experiment 2). Vertical lines: standard deviations (SDs). *: p < 0.05.
4.2.2. Content Page Scenario
- (1)
- Icons
In the content page scenario involving hierarchical page transitions (i.e., transitions between higher-level and lower-level pages), repeated measures of ANOVA were conducted to examine the effects of different loading icon strategies on user responses. The results indicated that there was no significant difference in time perception across the icon conditions, although the no icon condition resulted in the highest average perceived duration. No significant difference was found for the loading speed either, with the hedonic-style icon condition producing the highest average speed ratings. However, satisfaction showed a significant difference (F = 9.104, p < 0.001), with mean values ranked as follows: hedonic-style icon > regular icon > no icon. Similarly, emotional valence also exhibited a significant difference (F = 7.272, p < 0.01), with the same ranking order: hedonic-style icon > regular icon > no icon. No significant difference was found for the arousal level, although the hedonic-style icon condition had the highest average arousal score. LSD post hoc tests were conducted for the dimensions that showed significant within-subject effects. The detailed results are illustrated in Figure 13.
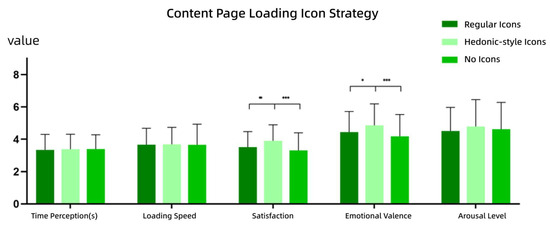
Figure 13.
Results of icon strategy for the content page scenario (Experiment 2). Vertical lines: standard deviations (SDs). ***: p < 0.001, **: p < 0.01, *: p < 0.05.
- Satisfaction: The hedonic-style icon condition resulted in significantly higher satisfaction ratings compared to both the regular icon and no icon conditions, suggesting that users prefer hedonic-style icons, likely due to their engaging and entertaining appearance. There was no significant difference in satisfaction between the regular icons and no icon conditions.
- Emotional Valence: Emotional valence scores were significantly higher in the Hedonic-style icon condition than in the other two conditions, indicating that hedonic-style icons elicit more positive emotional experiences. No significant difference was found between regular icons and no icon conditions.
- (2)
- Text
In the content page scenario, the effects of different loading text strategies were examined using repeated measures of ANOVA. The results showed that there was no significant difference in time perception across the text conditions, with personified text yielding the lowest average perceived duration. There was also no significant difference in loading speed, though personified text again had the highest average speed rating. No significant differences were found for satisfaction, emotional valence, or arousal level. However, both satisfaction and emotional valence reached the highest average values under the personified text condition. The no-text condition led to the highest average arousal rating. Detailed results are presented in Figure 14.
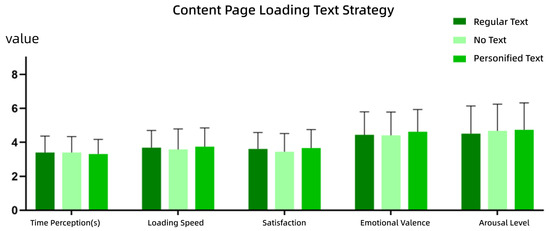
Figure 14.
Results of text strategy for the content page scenario (Experiment 2). Vertical lines: standard deviations (SDs).
4.2.3. Half-Screen Page Scenario
- (1)
- Icons
In the half-screen page scenario with page-level transitions, repeated measures of ANOVA were conducted to analyze the effects of different loading icon strategies on various indicators. The results revealed significant differences in time perception (F = 4.517, p < 0.05), with the regular icon condition showing the highest average time perception. Similarly, loading speed exhibited significant differences (F = 4.077, p < 0.05), with the following ranking from fastest to slowest: hedonic-style icon > no icon > regular icon. Satisfaction showed a significant difference (F = 7.144, p < 0.01), with the order from highest to lowest satisfaction as follows: hedonic-style icon > regular icon > no icon. Emotional valence also showed a significant difference (F = 4.136, p < 0.05), with the ranking as follows: hedonic-style icon > regular icon > no icon. No significant difference was found for the arousal level, with the regular icon yielding the highest average arousal score. LSD post hoc tests were performed for dimensions with significant within-subject effects. The results are shown in Figure 15.
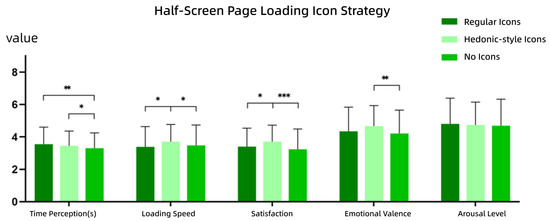
Figure 15.
Results of icon strategy for the half-screen page scenario (Experiment 2). Vertical lines: standard deviations (SDs). ***: p < 0.001, **: p < 0.01, *: p < 0.05.
- Time Perception: No icon led to significantly lower time perception than both the regular icon and hedonic-style icon, suggesting that users perceived less time to pass when no icon was present. There was no significant difference in time perception between regular and hedonic-style icons.
- Loading Speed: Hedonic-style icons resulted in significantly faster perceived loading speeds than both the regular icon and no icon, suggesting that users felt the hedonic-style icon loaded faster. No significant difference was found between regular icons and no icon conditions.
- Satisfaction: Hedonic-style icons resulted in significantly higher satisfaction than both regular icons and no icons, indicating that users preferred the hedonic-style icon, likely due to its appeal and entertainment value. No significant difference in satisfaction was found between regular icons and no icons.
- Emotional Valence: Hedonic-style icons induced significantly higher emotional valence than no icons, suggesting that hedonic-style icons elicit more positive emotional experiences. No significant difference was found between the regular icons and no icons in terms of emotional valence.
- (2)
- Text
In the half-screen page scenario, repeated measures of ANOVA were conducted to assess the effects of different loading text strategies on various indicators. The results showed that there was no significant difference in time perception across text strategies, with personified text yielding the lowest average time perception. No significant differences were observed in loading speed either, though personified text had the highest average loading speed. There were no significant differences in satisfaction, but personified text achieved the highest average satisfaction score. Emotional valence showed a significant difference (F = 3.854, p < 0.05), with personified text having the highest emotional valence. No significant difference was observed in arousal level, with no text having the highest average arousal score. LSD post hoc tests for dimensions with significant within-subject effects are shown in Figure 16.

Figure 16.
Results of text strategy for the half-screen page scenario (Experiment 2). Vertical lines: standard deviations (SDs). *: p < 0.05.
In terms of emotional valence, users rated personified text significantly higher than no text, suggesting that personified text fosters more positive emotional experiences. In terms of the arousal level, no text resulted in significantly higher arousal than regular text, while the low emotional valence for no text further indicates that the absence of text may evoke more negative feelings.
4.3. Page Hierarchy Transitions: Layout Strategies
4.3.1. Tab Page Scenario
In the tab page scenario, a repeated-measures ANOVA was conducted to examine the effects of different layout strategies on participants’ responses. The results showed a significant difference in time perception under different layout strategies in scenarios involving lateral page transitions (F = 4.259, p < 0.05). Specifically, the average time of reproduction for the stepwise loading strategy was lower than that for full loading. However, no significant differences were found for the perceived loading speed, with the stepwise loading strategy yielding the highest average rating. Similarly, no significant differences were observed in satisfaction, emotional valence, or arousal level, though the stepwise loading strategy consistently produced higher average values across these dimensions. Post hoc LSD tests for dimensions with significant within-subject effects are illustrated in Figure 17.
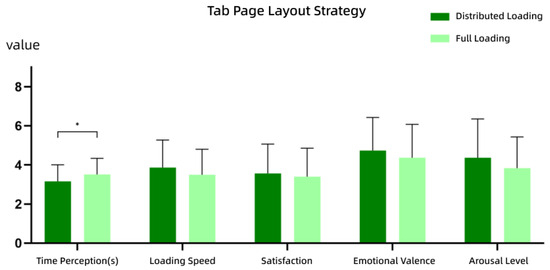
Figure 17.
Results of layout strategy for the tab page scenario (Experiment 3). Vertical lines: standard deviations (SDs). *: p < 0.05.
In terms of time perception, participants reproduced results with significantly less time under the stepwise loading condition compared to the full loading condition, suggesting that the stepwise strategy effectively reduces perceived waiting times.
4.3.2. Content Page Scenario
In the content page scenario, where page transitions occurred across hierarchical levels, a repeated-measures ANOVA was conducted to compare participant responses under different layout strategies. The analysis revealed a significant difference in time perception (F = 4.715, p < 0.05), with stepwise loading resulting in a lower average time reproduction than full loading. No significant differences were found in perceived loading speed, satisfaction, or emotional valence, although the stepwise loading strategy again showed relatively higher average values. However, a significant difference was observed in the arousal level (F = 6.366, p < 0.05), with full loading yielding a higher average arousal score. Post hoc LSD test results for significant dimensions are presented in Figure 18.
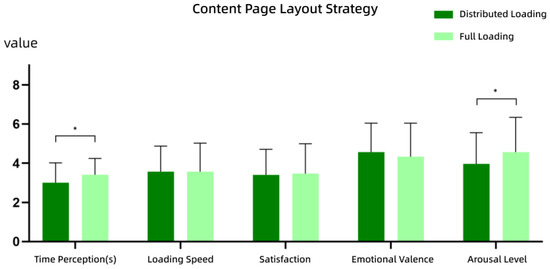
Figure 18.
Results of layout strategy for the content page scenario (Experiment 3). Vertical lines: standard deviations (SDs). *: p < 0.05.
- Time Perception: Participants reported significantly shorter reproduced durations under the stepwise loading strategy compared to the full-loading strategy, indicating that stepwise layouts can effectively reduce perceived waiting times.
- Arousal Level: Participants reported significantly higher arousal levels under the full-loading strategy, suggesting that full loading may induce stronger emotional intensity.
4.3.3. Half-Screen Page Scenario
In the half-screen page scenario involving within-level page transitions, a repeated-measures ANOVA was performed to evaluate the impact of different layout strategies. The results showed a significant difference in time perception (F = 4.904, p < 0.05), with stepwise loading associated with lower average time reproduction than full loading. There were no significant differences in perceived loading speed, satisfaction, emotional valence, or arousal level, although stepwise loading consistently yielded higher average scores across most dimensions. Notably, average arousal levels were identical for both layout strategies. Post hoc LSD test results for significant dimensions are shown in Figure 19.
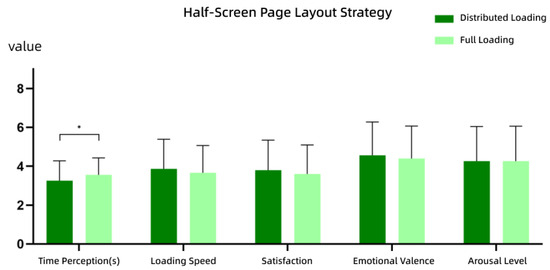
Figure 19.
Results of layout strategy for the half-screen page scenario (Experiment 3). Vertical lines: standard deviations (SDs). *: p < 0.05.
For the time perception metric, participants reported significantly shorter durations under the stepwise loading strategy compared to the full loading strategy, indicating that stepwise loading can significantly reduce users’ subjective experience of waiting times.
5. Discussion
5.1. Waiting Interface Strategies in Page Hierarchy Transitions
Experimental results revealed significant differences in time perception across various interface strategies, which is consistent with existing research findings, suggesting that moderate visual fillers can effectively divert attention, thus reducing users’ subjective time estimation during waiting periods [28]. In all interface strategies, subjective ratings of time reproduction in the three transition scenarios were consistently lower than the 4 s objective time, supporting the applicability of the attention-gating mechanism [42]. This indicates that appropriate visual stimuli not only alleviate users’ waiting anxiety but also systematically alters their perception of the passage of time.
Further analysis showed that two-stage interface strategies (e.g., 4 and 5) outperformed single-stage strategies (e.g., 1, 2, and 3) in terms of the perceived loading speed. Notably, Strategy 5 (blank page + spinning circle) achieved the highest mean scores for time reproduction, satisfaction, and emotional valence, demonstrating good generalizability across multiple transition scenarios. This may be attributed to the balance between its segmented feedback format and lower visual complexity, which not only aligns with users’ psychological expectations of the loading process but also effectively mitigates the negative impacts of information overload [43]. In contrast, interfaces with complex visual elements, such as Strategies 2 and 4, performed poorly in time reproduction ratings, further confirming the positive correlation between visual complexity and time overestimation [44]. On the other hand, Strategy 1 (blank page), which provided no feedback, performed the worst across all dimensions. The lack of loading feedback created a sense of uncertainty and anxiety, significantly lowering satisfaction and emotional valence. This finding underscores the importance of introducing dynamic feedback in transition loading scenarios.
Among the single-stage strategies, Strategy 2 (spinning page) performed the best overall, particularly in the satisfaction dimension, where it achieved the highest mean score. Designers may selectively use Strategy 2 (moderate loading) or Strategy 3 (skeleton screen, suitable for more content loading) based on the complexity of its content to better meet user expectations.
It is noteworthy that although Strategy 5 demonstrated the best overall performance in the content page scenario, Strategies 3 and 4 (skeleton screens) scored higher in emotional valence. Skeleton screens can establish reasonable expectations for the loading amount through a structural pre-presentation, thereby enhancing users’ emotional positivity. This result suggests that designers should consider guiding users’ emotional expectations through structure in scenarios with large data loads to optimize their waiting experience.
5.2. Interface Strategies While Waiting with Page Hierarchy Transitions
This study found that the type of loading icon has a significant impact on users’ emotional experience and satisfaction, while its effect on time perception is relatively weaker. This suggests that loading icons primarily influences the waiting experience through the emotional pathway. Among the three types of icons, hedonic-style icons significantly outperformed both the regular icon and no icon in terms of satisfaction and emotional valence. This is consistent with existing research that indicates “fun designs can alleviate user anxiety and enhance emotions” [31,45]. Hedonic-style icons, due to their novelty and visual appeal, help divert users’ attention during the waiting process, improve their emotional state, and thereby indirectly enhance the loading experience.
In contrast, regular icons, while providing feedback on loading status, lack the same level of entertainment value. No icon, on the other hand, lacked any visual cues, making the waiting process feel monotonous, which significantly reduced both emotional experience and satisfaction ratings.
Interestingly, in the half-screen page scenario, the no-icon strategy outperformed the icon strategies in the time reproduction dimension. Since the popup itself already provides some feedback, the role of the icon was somewhat diminished. Users lacking explicit references ended up underestimating the waiting time. This result aligns with the mechanism that “blank pages can compress time perception,” but it is important to note that its satisfaction performance was still the worst. This further corroborates the research conclusion that “low time perception does not equal high satisfaction” [46].
Regarding text strategies, although there were no significant differences between humanized and regular text across all dimensions, both were significantly better than no text, indicating that text prompts are indispensable elements in the loading process. Humanized text slightly outperforms regular text across most dimensions, so designers may flexibly choose between them depending on the context to enhance interface friendliness. In the half-screen page scenario, no-text strategies scored significantly lower for both emotional valence and satisfaction dimensions, further validating the important role of text feedback in micro-interactions. Since the humanized text style used in this experiment was relatively mild, future studies should explore its potential impact on users’ waiting experience by strengthening its stylistic features.
5.3. Layout Strategies in Page Hierarchy Transitions
Compared to icon and interface strategies, layout strategies have a relatively weaker overall impact on the user’s waiting experience, with significant differences only observed in time perception. The results show that the step-by-step loading strategy (text first, followed by images) yields higher mean values across multiple dimensions, including time reproduction, perceived loading speed, satisfaction, and emotional valence when compared to the full-load strategy. This confirms its advantage in reducing subjective waiting times and enhancing overall user experience.
In content page scenarios, the step-by-step loading strategy is particularly effective. Employing a “progressive content presentation” approach helps guide users to form reasonable expectations about loading, ultimately improving both satisfaction and emotional experience. However, unlike in tab and half-screen page scenarios, the full-load strategy scores higher on arousal, possibly due to the strong visual stimulation of loading a large amount of content all at once, which increases user attention [45]. Therefore, in scenarios where it is necessary to capture user interest or attention (such as when entering a new content level), designers may consider using the full-load strategy. However, it is crucial to balance the potential waiting anxiety it may cause.
Notably, in the half-screen page scenario, the step-by-step loading strategy achieved the highest satisfaction score and the lowest time reproduction score (Ftab = 4.259, Fcontent = 4.715, Fhalf-screen = 4.904). In this context, text carries more informational value than images (e.g., in comment sections), so the step-by-step approach that prioritizes text aligns better with user cognitive preferences and helps alleviate waiting anxiety. Designers should consider specific usage scenarios when designing page layouts, identify whether users are more focused on text or images, and arrange the loading order accordingly.
Although most dimensions in this experiment did not show significant differences, and only the “text first, then images” step-by-step format was tested, future research could explore a broader range of layout strategies and expand the sample size to provide more targeted design recommendations.
6. Conclusions
This study focuses on the user waiting experience during page hierarchy transitions on web interfaces, examining the impact of interface strategies, loading icon strategies, and layout strategies on subjective time perception, satisfaction, and emotional experience. Through a 2 (hierarchy type) × 3 (waiting strategy) between-group experimental design and the quantitative analysis of multidimensional measurement indicators, this study validates the critical role of visual hierarchy design in optimizing user waiting experiences. The specific conclusions obtained are as follows:
- Interface Strategy: Replacing blank areas with placeholder images significantly improves satisfaction, reduces perceived wait time, and enhances emotional responses. This effect is attributed to visual engagement and anticipatory cues, which alleviate the uncertainty of “empty waiting”.
- Loading Icon Strategy: Hedonic-style icons function as effective emotional interventions, significantly improving satisfaction and mood. Although personified text showed no significant statistical advantage, it outperformed standard text in subjective ratings, indicating its potential. The absence of icons, while sometimes reducing time perception, generally decreased satisfaction, highlighting its design risk.
- Layout Strategy: Step-by-step loading (e.g., displaying text before images) effectively reduces perceived waiting times and increases satisfaction, particularly in half-screen layouts. This approach improves cognitive ease and emotional comfort through gradual information disclosure.
- Strategy Adaptability: The effectiveness of waiting strategies varies by hierarchy type. Users are more responsive to text on half-screen pages, while in tab and content pages, feedback from icons plays a more prominent role. These findings underscore the need for context-sensitive designs rather than a universal strategy.
The waiting strategies proposed in this study not only provide theoretical support and empirical evidence for optimizing user experience during page hierarchy transitions but also offer feasible reference paths for designers in the visual feedback design of micro-interactions. However, these findings are based on a relatively homogeneous participant sample, which may limit the broader applicability of the results. To strengthen generalizability, future research should include a more diverse participant pool across age groups, cultures, and usage contexts. Future work will focus on developing and testing a broader spectrum of personified text styles to gain deeper insights into their impact on user experience. Additionally, future research could extend to dimensions such as loading initiation, refresh loading, upload/download processes, and the rhythm of interface animations to further investigate the emotional mechanisms and behavioral responses associated with user waiting experiences.
Author Contributions
Conceptualization, Y.Y. and C.W.; methodology, C.W.; software, H.W. and Y.C. (Yuching Chiang); validation, Y.Y.; formal analysis, C.W.; investigation, Y.Y.; resources, Y.C. (Yuching Chiang) and H.W.; data curation, C.W.; writing—original draft preparation, Y.Y.; writing—review and editing, Y.Y. and Y.C. (Yingpin Chen); visualization, Y.C. (Yingpin Chen); supervision, P.W.; project administration, C.C., H.L. and H.F.; funding acquisition, C.C. and H.F. All authors have read and agreed to the published version of the manuscript.
Funding
This research received no external funding.
Institutional Review Board Statement
This research is a joint project between Zhejiang University and Northwestern Polytechnical University and has been approved by the Ethics Review Committee of Northwestern Polytechnical University (IRB numbers: 201502024 and 202002024). We confirm that all research procedures were conducted in strict accordance with the relevant guidelines and regulations for human participants, as outlined in the Declaration of Helsinki.
Informed Consent Statement
Informed consent was obtained from all subjects involved in the study.
Data Availability Statement
The datasets generated and/or analyzed during the current study are not publicly available as they are part of an ongoing research project. However, they will be made available upon the study’s completion and can be obtained from the corresponding author upon reasonable request.
Acknowledgments
We gratefully acknowledge the support received from Zhejiang University, Northwestern Polytechnical University, and the Human Factors Research Department at OPPO. We are also deeply grateful to all the participants involved in this study. This project was achievable due to the full support they provided.
Conflicts of Interest
Author Haibo Lei was employed by the company Foshan Taihuo Redbird Technology Co., Ltd. The remaining authors declare that the research was conducted in the absence of any commercial or financial relationships that could be construed as a potential conflict of interest.
References
- Chen, A.N.; Lee, Y.; Hwang, Y. Managing Online Wait: Designing Effective Waiting Screens across Cultures. Inf. Manag. 2018, 55, 558–575. [Google Scholar] [CrossRef]
- Liu, X.; Ma, Y.; Wang, X.; Liu, Y.; Xie, T.; Huang, G. SWAROVsky: Optimizing Resource Loading for Mobile Web Browsing. IEEE Trans. Mob. Comput. 2017, 16, 2941–2954. [Google Scholar] [CrossRef]
- Miller, R.B. Response Time in Man-Computer Conversational Transactions. In AFIPS ’68 (Fall, Part I), Proceedings of the Fall Joint Computer Conference, Part I, San Francisco, CA, USA, 9–11 December 1968; Association for Computing Machinery: New York, NY, USA, 1968; pp. 267–277. [Google Scholar] [CrossRef]
- Krishnan, S.S.; Sitaraman, R.K. Video Stream Quality Impacts Viewer Behavior: Inferring Causality Using Quasi-Experimental Designs. In IMC ’12, Proceedings of the 2012 Internet Measurement Conference, Boston, MA, USA, 14–16 November 2012; Association for Computing Machinery: New York, NY, USA, 2012; pp. 211–224. [Google Scholar] [CrossRef]
- Nah, F.F.-H. A Study on Tolerable Waiting Time: How Long Are Web Users Willing to Wait? Behav. Inf. Technol. 2004, 23, 153–163. [Google Scholar] [CrossRef]
- Galletta, D.F.; Henry, R.; McCoy, S.; Polak, P. Web Site Delays: How Tolerant Are Users? J. Assoc. Inf. Syst. 2004, 5, 1–28. [Google Scholar] [CrossRef]
- Pfister, H.-R.; Wollstädter, S.; Peter, C. Affective Responses to System Messages in Human–Computer-Interac-tion: Effects of Modality and Message Type. Interact. Comput. 2011, 23, 372–383. [Google Scholar] [CrossRef]
- Kim, W.; Xiong, S.; Liang, Z. Effect of Loading Symbol of Online Video on Perception of Waitin-g Time. Int. J. Hum. Comput. Interact. 2017, 33, 1001–1009. [Google Scholar] [CrossRef]
- Lallemand, C.; Gronier, G. Enhancing User experience during Waiting Time in HCI: Contributions of Cognitive Psychology. In DIS ’12, Proceedings of the Designing Interactive Systems Conference, Newcastle Upon Tyne, UK, 11–15 June 2012; Association for Computing Machinery: New York, NY, USA, 2012; pp. 751–760. [Google Scholar] [CrossRef]
- Branaghan, R.J.; Sanchez, C.A. Feedback Preferences and Impressions of Waiting. Hum. Factors 2009, 51, 528–538. [Google Scholar] [CrossRef]
- Ohtsubo, M.; Yoshida, K. How Does Shape of Progress Bar Effect on Time Evaluation. In Proceedings of the 2014 International Conference on Intelligent Networking and Collaborative Systems, Salerno, Italy, 10–12 September 2014; pp. 316–319. [Google Scholar] [CrossRef]
- Yuzhen, W.; Yanqun, H.; Jutao, L.; Jie, Z. The Effect of Mobile Applications’ Initial Loading Pages on Users’ Mental State and Behavior. Displays 2021, 68, 102007. [Google Scholar] [CrossRef]
- Conn, A.P. Time Affordances: The Time Factor in Diagnostic Usability Heuristics. In CHI ’95, Proceedings of the SIGCHI Conference on Human Factors in Computing Systems, Denver, CO, USA, 7–11 May 1995; ACM Press: Denver, CO, USA, 1995; pp. 186–193. [Google Scholar] [CrossRef]
- Ghafurian, M.; Reitter, D.; Ritter, F.E. Countdown Timer Speed: A Trade-off between Delay Duration Perception and Recall. ACM Trans. Comput. Hum. Interact. 2020, 27, 11. [Google Scholar] [CrossRef]
- Ghafurian, M.; Reitter, D. Impatience Induced by Waiting: An Effect Moderated by the Speed of Countdowns. In DIS ’16, Proceedings of the 2016 ACM Conference on Designing Interactive Systems, Brisbane, QLD, Australia, 4–8 June 2016; Association for Computing Machinery: New York, NY, USA, 2016; pp. 556–564. [Google Scholar] [CrossRef]
- Harrison, C.; Amento, B.; Kuznetsov, S.; Bell, R. Rethinking the Progress Bar. In UIST ’07, Proceedings of the 20th Annual ACM Symposium on User Interface Software and Technology, Newport, RI, USA, 7–10 October 2007; Association for Computing Machinery: New York, NY, USA, 2007; pp. 115–118. [Google Scholar] [CrossRef]
- Amer, T.S.; Johnson, T.L. IT Progress Indicators: Sense of Progress, Subjective Sense of Time, User Preference and the Perception of Process Duration. Int. J. Technol. Hum. Interact. 2014, 10, 58–71. [Google Scholar] [CrossRef]
- Chien-Hsiung, C.; Shasha, L. The Effect of Visual Feedback Types on the Wait Indicator Interface of a Mobile Application. Displays 2020, 61, 101928. [Google Scholar] [CrossRef]
- Harrison, C.; Yeo, Z.; Hudson, S.E. Faster Progress Bars: Manipulating Perceived Duration with Visual Augmentations. In CHI ’10, Proceedings of the SIGCHI Conference on Human Factors in Computing Systems, Atlanta, GA, USA, 10–15 April 2010; Association for Computing Machinery: New York, NY, USA, 2010; pp. 1545–1548. [Google Scholar] [CrossRef]
- Kurusathianpong, P.; Tangmanee, C. Comparison of Perceived Waiting Time Between Two Lengths of Progress Indicator and Two Styles of Graphics Animation with Perceived Uncertainty as a Covariate. In Proceedings of the 2018 Seventh ICT International Student Project Conference (ICT-ISPC), Nakhon Pathom, Thailand, 11–13 July 2018; pp. 1–6. [Google Scholar] [CrossRef]
- Söderström, U.; Bååth, M.; Mejtoft, T. The Users’ Time Perception: The Effect of Various Animation Speeds on Loading Screens. In ECCE ’18, Proceedings of the 36th European Conference on Cognitive Ergonomics, Utrecht, The Netherlands, 5–7 September 2018; Association for Computing Machinery: New York, NY, USA, 2018; pp. 1–4. [Google Scholar] [CrossRef]
- Wenguo, Z.; Yan, G.; Weina, Q.; Kan, Z.; Xianghong, S. The Duration Perception of Loading Applications in Smartphone: Effects of Different Loading Types. Appl. Ergon. 2017, 65, 223–232. [Google Scholar] [CrossRef]
- Hohenstein, J.; Khan, H.; Canfield, K.; Tung, S.; Perez Cano, R. Shorter Wait Times: The Effects of Various Loading Screens on Perceived Performance. In CHI EA ’16, Proceedings of the 2016 CHI Conference Extended Abstracts on Human Factors in Computing Systems, San Jose, CA, USA, 7–12 May 2016; Association for Computing Machinery: New York, NY, USA, 2016; pp. 3084–3090. [Google Scholar] [CrossRef]
- Mejtoft, T.; Långström, A.; Söderström, U. The Effect of Skeleton Screens: Users’ Perception of Speed and Ease of Navigation. In ECCE ’18, Proceedings of the 36th European Conference on Cognitive Ergonomics, Utrecht, The Netherlands, 5–7 September 2018; Association for Computing Machinery: New York, NY, USA, 2018; pp. 1–4. [Google Scholar] [CrossRef]
- Pang, S.; Carl, G.; Andy, C. The Influence of Audio Effects and Attention on the Perceived Duration of Interaction. Int. J. Hum. Comput. Stud. 2022, 159, 102756. [Google Scholar] [CrossRef]
- Shirai, K.; Futami, K.; Murao, K. Exploring Tactile Stimuli from a Wrist-Worn Device to Manipulate Subjective Time Based on the Filled-Duration Illusion. Sensors 2022, 22, 7194. [Google Scholar] [CrossRef]
- Van Nimwegen, C.; Van Rijn, E. Time Swipes When You’re Having Fun: Reducing Perceived Waiting Time While Making It More Enjoyable. Behav. Inf. Technol. 2023, 42, 307–315. [Google Scholar] [CrossRef]
- Hou, D.; Yao, K. User Experience of Loading Design: The Influence of Different Presentation Duration and Type on Time Perception. J. Phys. Conf. Ser. 2021, 1955, 012076. [Google Scholar] [CrossRef]
- Cao, H.; Hu, X. A Research on Motion Design for APP’s Loading Pages Based on Time Perception. AIP Conf. Proc. 2018, 1955, 040075. [Google Scholar] [CrossRef]
- Hsu, C.-F.; Propp, L.; Panetta, L.; Martin, S.; Dentakos, S.; Toplak, M.E.; Eastwood, J.D. Mental Effort and Discomfort: Testing the Peak-End Effect during a Cognitively Demanding Task. PLoS ONE 2018, 13, e0191479. [Google Scholar] [CrossRef]
- Zhang, C.; Lv, M.; Zhang, W.; Chen, J.; Yang, L.; Lv, B.; Wu, T. Evaluating Scenario-Specific Loading Processes on Mobile Phones. Technologies 2019, 7, 27. [Google Scholar] [CrossRef]
- Cheng, A.; Ma, D.; Qian, H.; Pan, Y. The Effects of Mobile Applications’ Passive and Interactive Loading Sc-reen Types on Waiting Experience. Behav. Inf. Technol. 2024, 43, 1652–1663. [Google Scholar] [CrossRef]
- Macar, F.; Grondin, S.; Casini, L. Controlled Attention Sharing Influences Time Estimation. Mem. Cogn. 1994, 22, 673–686. [Google Scholar] [CrossRef] [PubMed]
- Li, A.; Zhao, D.; Xiong, G.; Tan, F.; Wang, X.; Ling, W. Is Waiting a Kind of Torture? Perceived Waiting Time and the Resulting Irrational Decision Making. Adv. Psychol. Sci. 2014, 22, 1679. [Google Scholar] [CrossRef]
- Ryan, G.; Valverde, M. Waiting Online: A Review and Research Agenda. Internet Res. 2003, 13, 195–205. [Google Scholar] [CrossRef]
- Oktarina, F.; Handoyo, E.R.; Rahayu, F.S. User Experience Analysis of ShopeeFood Service Using Google’s HEART Framework. Teknika 2025, 14, 47–56. [Google Scholar] [CrossRef]
- Rodden, K.; Hutchinson, H.; Fu, X. Measuring the User Experience on a Large Scale: User-Centered Metrics for Web Applications. In CHI ’10, Proceedings of the SIGCHI Conference on Human Factors in Computing Systems, Atlanta, GA, USA 10–15 April 2010; Association for Computing Machinery: New York, NY, USA, 2010; pp. 2395–2398. [Google Scholar] [CrossRef]
- Cardozo, R.N. An Experimental Study of Customer Effort, Expectation, and Satisfaction. J. Mark. Res. 1965, 2, 244. [Google Scholar] [CrossRef]
- Block, R.A.; Zakay, D. Prospective and Retrospective Duration Judgments: A Meta-Analytic Review. Psychon. Bull. Rev. 1997, 4, 184–197. [Google Scholar] [CrossRef]
- Watson, D.; Clark, L.A.; Tellegen, A. Development and Validation of Brief Measures of Positive and Negative Affect: The PANAS Scales. J. Personal. Soc. Psychol. 1988, 54, 1063–1070. [Google Scholar] [CrossRef]
- Lovibond, S.H.; Lovibond, P.F. Manual for the Depression Anxiety Stress Scales, 2nd ed.; Psychology Foundation monograph; Psychology Foundation of Australia: Sydney, NSW, Australia, 1995. [Google Scholar]
- Bradley, M.M.; Lang, P.J. Measuring Emotion: The Self-Assessment Manikin and the Semantic Differential. J. Behav. Ther. Exp. Psychiatry 1994, 25, 49–59. [Google Scholar] [CrossRef]
- Hou, G.; Wang, X. Emotional Valence and Arousal: The Impact of AI-Generated Image Stimuli on Design Creativity. Int. J. Technol. Des. Educ. 2024. [Google Scholar] [CrossRef]
- Ma, A.C.; Cameron, A.D.; Wiener, M. Memorability Shapes Perceived Time (and Vice Versa). Nat. Hum. Behav. 2024, 8, 1296–1308. [Google Scholar] [CrossRef]
- Zargham, N.; Avanesi, V.; Reicherts, L.; Scott, A.E.; Rogers, Y.; Malaka, R. “Funny How?” A Serious Look at Humor in Conversational Agents. In CUI ’23, Proceedings of the 5th International Conference on Conversational User Interfaces, Eindhoven, The Netherlands, 19–21 July 2023; Association for Computing Machinery: New York, NY, USA, 2023; pp. 1–7. [Google Scholar] [CrossRef]
- Xu, Y.; Zhang, H. A Bibliometric-Based Study of Virtual Reality User Interface Design. In Virtual, Augmented and Mixed Reality; Chen, J.Y.C., Fragomeni, G., Eds.; Springer Nature: Cham, Switzerland, 2023; pp. 114–129. [Google Scholar] [CrossRef]
Disclaimer/Publisher’s Note: The statements, opinions and data contained in all publications are solely those of the individual author(s) and contributor(s) and not of MDPI and/or the editor(s). MDPI and/or the editor(s) disclaim responsibility for any injury to people or property resulting from any ideas, methods, instructions or products referred to in the content. |
© 2025 by the authors. Licensee MDPI, Basel, Switzerland. This article is an open access article distributed under the terms and conditions of the Creative Commons Attribution (CC BY) license (https://creativecommons.org/licenses/by/4.0/).