Article

Carbon Emission Characteristics and Low-Carbon Operation Evaluation of Some Wastewater Treatment Plants in East China: An Empirical Study Based on Actual Production Data

1
State Key Laboratory of Urban Water Resource and Environment, School of Environment, Harbin Institute of Technology, Harbin 150090, China
2
Beijing Enterprises Water Group Limited (BEWG), Beijing 100102, China
*
Author to whom correspondence should be addressed.
Appl. Sci. 2025, 15(12), 6716; https://doi.org/10.3390/app15126716
Submission received: 28 April 2025 / Revised: 28 May 2025 / Accepted: 30 May 2025 / Published: 16 June 2025
(This article belongs to the Section Environmental Sciences)

Abstract

Against the backdrop of China’s “dual carbon” strategy, investigating the carbon emission characteristics and low-carbon operational status of wastewater treatment plants (WWTPs) across regions is pivotal for achieving synergistic pollution reduction and carbon mitigation. Leveraging 2024 operational data from 98 WWTPs in eastern China—encompassing treatment volume, energy consumption, sludge production, and chemical dosages—this study refined the Assessment Standard for Carbon Mitigation in Municipal WWTPs and Technical Specification for Low-Carbon Operation of WWTPs. A novel carbon accounting framework and low-carbon performance evaluation system were subsequently developed to analyze the impacts of treatment scale, technological configuration, and load rate on carbon footprints. Key findings revealed an average carbon intensity of 0.399 kg CO2-eq/m3 for the region, with small-scale facilities (0.582 kg CO2-eq/m3) exhibiting significantly higher emissions compared to their large-scale counterparts (0.392 kg CO2-eq/m3). Indirect emissions constituted 62.1% of the total footprint, while chemical dosing contributed 14.2%, primarily driven by carbon sources and phosphorus removal agents. Fossil-derived CO2 accounted for 4.6% of emissions. Notably, the AAO process demonstrated the lowest carbon intensity (0.370 kg CO2-eq/m3), whereas SBR systems registered the highest (0.617 kg CO2-eq/m3). Furthermore, 25% of the assessed facilities were classified as high-emission plants. Strategic recommendations are proposed, including prioritizing AAO process optimization, implementing intelligent chemical dosing control, utilizing food wastewater as an alternative carbon source, and enhancing operational load rates, to advance synergistic environmental and carbon mitigation goals in eastern China’s wastewater sector.

1. Introduction

The issue of global warming induced by elevated greenhouse gas (GHG) concentrations has profoundly impacted natural ecosystems and human living environments, emerging as a critical challenge confronting the global community [1]. Wastewater treatment plants (WWTPs) play a pivotal role in reducing aquatic pollutants, enhancing water quality, and restoring aquatic ecosystems [2,3,4,5,6]. According to the International Water Association (IWA) Executive President, carbon emissions from energy consumption during urban wastewater and water supply treatment processes account for 3–8% of total global GHG emissions [7]. As the world’s largest carbon emitter [8,9], China has witnessed a rapid expansion in both the number and treatment capacity of WWTPs over the past decade [10,11], with the carbon footprint of the wastewater treatment sector contributing 1–3% of national emissions [12]. Against the backdrop of China’s “dual carbon” goals, conducting in-depth research into the GHG emission characteristics and low-carbon operational status of domestic WWTPs, alongside systematically collecting and analyzing foundational data, represents a prerequisite for formulating integrated pollutant reduction and carbon mitigation policies.
Existing studies predominantly focus on individual WWTPs or macro-statistical analyses, with conspicuous gaps in systematic, high-precision carbon emission accounting for specific regions—particularly concerning chemical dosing and sludge treatment processes. Dengting Guo et al. [13] employed data from the Urban Drainage Statistical Yearbook and an optimized life cycle assessment methodology integrated with IPCC guidelines to quantify the total greenhouse gas (GHG) emissions of China’s wastewater treatment sector in 2017. However, their analysis relied on 2017 statistical data, which may not reflect current operational realities, and certain parameters—such as transportation distances and sludge treatment energy consumption—were derived from assumptions or literature averages. Jiarui Xi et al. [14] collected operational data from 50 WWTPs in Shanghai, including treatment volume, influent quality, and energy consumption, and applied IPCC 2006 and 2019 guidelines alongside an operation-specific data integration method (ODIM) to evaluate direct and indirect GHG emissions. Their study emphasized indirect emissions from electricity consumption but excluded carbon emissions associated with chemical dosing. Yindong Tong et al. [15] utilized data from the China Environmental Statistics Database and China Urban Construction Yearbook to estimate national wastewater treatment-related GHG emissions in 2020. Despite these efforts, none of the aforementioned studies incorporated comprehensive, plant-specific operational data, leading to uncertainties in carbon accounting. Qibiao Yu et al. [2] leveraged the China Urban Construction Statistical Yearbook and Ministry of Ecology and Environment reports, employing statistical modeling to analyze spatiotemporal GHG emission patterns in coastal prefecture-level cities and identify drivers of wastewater treatment emissions. Meichen Ji et al. [16] investigated temporal–spatial GHG emission variations across eight Beijing WWTPs between 2007–2021, exploring seasonal impacts, effluent standard upgrades, operational parameters, and clean energy adoption. However, their analysis omitted indirect emissions from chemical usage and relied on foreign emission factors (e.g., Italian data for CO2), potentially introducing biases. Existing research predominantly relies on statistical yearbooks rather than granular, plant-level operational data, particularly neglecting chemical dosing details. To address these gaps, this study aggregates full-scope 2024 operational data from 98 WWTPs in eastern China, encompassing water treatment volumes, energy consumption, sludge production, and precise chemical dosing records (e.g., agent types, dosages, concentrations). This dataset ensures accuracy and comprehensiveness in carbon accounting. Furthermore, the study adopts the Assessment Standard for Carbon Mitigation in Municipal WWTPs (2023) published by the China Urban Water Supply and Drainage Association, with methodological refinements including China-specific emission factors for CH4 and N2O tailored to regional treatment processes. These enhancements enable a high-resolution quantification of actual 2024 carbon emissions, offering critical insights for targeted mitigation strategies. Wen-Jie Du et al. [17] analyzed GHG emissions from 5155 municipal WWTPs in China between 2009 and 2019 using data from the Ministry of Housing and Urban-Rural Development’s “National Urban Wastewater Treatment Management Information System” and local government disclosures. They proposed mitigation technologies—such as heat pump energy recovery, anaerobic digestion for biogas production, and high-solids side-stream digestion—and evaluated their economic viability.
East China, the most economically and culturally developed region in China, encompasses Shanghai, Jiangsu, Zhejiang, Anhui, Fujian, Jiangxi, Shandong, and Taiwan provinces. Based on daily operational data from 98 WWTPs across East China in 2024, this study established a high-precision carbon emission accounting framework to comprehensively quantify emissions from these facilities. Subsequent analyses elucidated regional emission patterns, low-carbon operational performance, and influencing factors. A low-carbon operation evaluation system was further developed to propose actionable strategies for synergistic pollutant reduction and carbon mitigation.

2. Background and Methods

2.1. Overview of Sewage Treatment Plants in East China

This study focused on 98 operational municipal WWTPs in the East China region (excluding Taiwan Province and Shanghai Municipality). These facilities are located in cities characterized by subtropical monsoon and temperate monsoon climates, with annual mean temperatures ranging from 15 to 18 °C. The geographic distribution of the selected WWTPs across this region is visualized in Figure 1, demonstrating their spatial concentration patterns relative to urban agglomerations and hydrological systems.
According to the 2022 National Statistical Yearbook, the East China region contains 844 operational municipal WWTPs with an aggregate treatment capacity of 7.24 × 10⁷ m3/d. The present study investigated 98 WWTPs featuring a total designed capacity of 4.48 × 10⁶ m3/d and an average daily throughput of 3.55 × 10⁶ m3/d. These facilities exhibited design capacities ranging from 0.2 × 10⁴ to 20.0 × 10⁴ m3/d, with 73 plants (74.5% of the cohort) having capacities below 5.0 × 10⁴ m3/d contributing 43.4% of the total treatment volume (Table 1). Process configurations were dominated by anaerobic–anoxic–oxic (AAO), anoxic–oxic (AO) with multi-stage variants, and oxidation ditch systems, which collectively represented 91.9% of the facilities (Table 2) and 92.1% of the total treatment capacity. Influent characteristics during 2024 averaged COD 205.1 mg/L, BOD 76.6 mg/L, TP 3.34 mg/L, TN 32.5 mg/L, and NH4+-N 25.3 mg/L. The top five cities with the highest influent COD levels were Qingdao, Linyi, Suzhou, Huzhou, and Taicang, indicating localized industrial or municipal discharge patterns that warrant targeted pretreatment optimization. Effluent quality compliance was evaluated against three tiers of the Discharge Standard for Pollutants from Municipal Wastewater Treatment Plants (GB 18918-2002) [18]: Class 1A, Class 1B, and superior to Class 1A standards.

2.2. Carbon Emission Accounting Boundaries and Methodologies

2.2.1. System Boundary Definition

The accounting boundary for this study was defined as the intra-plant processes of WWTPs, encompassing influent reception, pretreatment, biological treatment, advanced treatment, disinfection, and sludge dewatering. Excluded from the boundary were sludge disposal operations and emissions occurring after wastewater discharge into receiving waters. Based on organic carbon origins, CO2 emissions within WWTPs were classified into two categories: biogenic and fossil-derived [19]. The majority of CO2 emissions originated from biogenic carbon present in wastewater, with only a minor fraction attributable to fossil fuel combustion. Consistent with IPCC guidelines, biogenic CO2—traceable to organic matter produced through recent plant photosynthesis—was excluded from the accounting framework, as it represents a short-term carbon cycle between atmospheric and biogenic pools. Conversely, fossil-derived CO2 emissions were fully incorporated into the assessment.
Electricity-related carbon emissions included auxiliary power consumption for both production and administrative activities. While this component does not directly contribute to treatment processes, it was included in the accounting due to two practical considerations: (1) lack of universal sub-metering for office electricity across all surveyed plants and (2) its relatively minor contribution (0.7–1.6% of total electricity use) to the overall carbon footprint of WWTP operations [20]. This pragmatic inclusion ensures comprehensive system-level analysis while maintaining methodological consistency.

2.2.2. Carbon Emission Accounting Methodologies

Currently, China lacks a unified national standard for carbon emission accounting in the wastewater treatment sector [21,22]. Existing practices are primarily guided by industry group standards. The Assessment Standard for Carbon Mitigation in Municipal Wastewater Treatment Plants (T/CUWA 50055-2023) [23], published by the China Urban Water Association on 21 December 2023, was adopted as the primary methodological basis for this study. Compared to the IPCC 2019 guidelines, the Chinese standard offers a more comprehensive accounting scope by explicitly incorporating carbon emissions from chemical consumption and fossil-derived CO2, thereby enhancing its applicability to individual WWTPs. In contrast, the IPCC 2019 framework is better suited for national- or city-scale emissions inventory development. Furthermore, the default CH4 and N2O emission factors in IPCC guidelines—derived predominantly from European and North American WWTP operational data—exhibit limitations in reflecting China’s treatment process characteristics. A comparative analysis of the three GHG accounting methodologies is summarized in Table 3.
The T/CUWA 2023 standard expands the accounting scope compared to IPCC 2019 and T/CAEPI 2022 by explicitly incorporating fossil-derived CO2 emissions and chemical consumption-related carbon emissions, thereby enhancing its applicability to individual WWTPs in China.
This study developed a high-precision carbon emission accounting framework for WWTPs by integrating three key methodological components:
  • The “Carbon Emission Reduction Assessment Standard for Urban Wastewater Treatment Plants” (T/CUWA 50055-2023) issued by the China Urban Water Supply and Drainage Association (21 December 2023);
  • The 2021 power sector CO2 emission factors published jointly by the Ministry of Ecology and Environment and the National Bureau of Statistics;
  • Process-specific CH4 and N2O emission factors for different treatment configurations (Table 4), derived as weighted averages from literature values in the “Technical Guide for Carbon Accounting and Emission Reduction Pathways in Urban Water Systems”.
Direct Carbon Emission Quantification Protocols
(1)
Biochemical Process CH4 Emissions
The annual CH4 emission from wastewater treatment biochemical processes was calculated using Equation (1):
m C H 4 = ( 1 + F C H 4 ) × Q × ( C O D i n C O D e f f ) × E F C H 4 × 10 3
where:
m C H 4 : Annual CH4 emission (kg CH4/a).
F C H 4 : Fugitive emission adjustment factor (%) for pumping stations and grit chambers (range: 10.25–26.19%; 20% adopted here).
Q: Influent flow rate (m3/a).
CODin/CODeff: Influent/effluent chemical oxygen demand (mg/L).
E F C H 4 : Process-specific methane emission factor (kg CH4/kg COD). Measured values are preferred. When unavailable, recommended values range from 0.004 to 0.0075 kg CH4/kg COD, with higher values applicable for sludge-accumulating units. The median value of 0.00575 kg CH4/kg COD (from AAO process guidelines) was used here.
(2)
N2O Emissions from Nitrogen Transformation
Direct N2O emissions during wastewater treatment were calculated using Equation (2):
m N 2 O = Q × ( T N i n T N e f f ) × E F N 2 O × 10 3 × 44 28
where:
m N 2 O : Annual direct N2O emission (kg N2O/a).
TNin/TNeff: Influent/effluent total nitrogen concentration (mg/L).
E F N 2 O : N2O emission factor (kg N2O/kg N). Priority should be given to values derived from mechanistic models or continuous monitoring. When neither is feasible, the default value of 0.01 kg N2O/kg N may be applied.
Carbon emissions from fossil carbon mineralization during wastewater treatment were quantified using Equation (3), while those from external carbon source mineralization were calculated using Equation (4):
m f C O 2 = Q × ( C O D i n C O D e f f ) × E F C O 2 × F C F × 10 3
where:
m f C O 2 : Annual fossil carbon-derived CO2-equivalent emission (kg CO2-eq/a).
E F C O 2 : Emission factor for biochemical CO2-equivalent emissions (kg CO2-eq/kg COD). Recommended range: 0.366–0.560 kg CO2-eq/kg COD; 0.463 kg CO2-eq/kg COD used here.
FCF: Fossil carbon fraction in influent organic matter (%), ranging from 5% to 20% (10% adopted here).
m e C O 2 = E F C O 2 × M e × r
where:
m e C O 2 : Annual external fossil carbon-derived CO2 emission (kg CO2-eq/a).
Me: Annual external carbon source dosage (kg/a).
r: Effective carbon content (%).
Assuming two-thirds of external carbon is catabolized and one-third is anabolized, direct CO2 emission factors for common carbon sources (glucose, sodium acetate, acetic acid, methanol) were calculated using Equations (5)–(8):
E F C 6 H 12 O 6 = 2 3 × 6 × 44 180 = 0.98 ( k g C O 2 / k g C 6 H 12 O 6 )
E F C H 3 C O O N a = 2 3 × 2 × 44 82 = 0.72 ( k g C O 2 / k g C H 3 C O O N a )
E F C H 3 C O O H = 2 3 × 2 × 44 60 = 0.98 ( k g C O 2 / k g C H 3 C O O H )
E F C H 3 O H = 2 3 × 1 × 44 32 = 0.92 ( k g C O 2 / k g C H 3 O H )
Total CO2-equivalent emissions from biochemical reactions ( M C O 2 ) were calculated using Equation (9):
M C O 2 = m f C O 2 + m e C O 2 + m C H 4 × 28
where:
M C H 4 / M N 2 O : CH4/N2O-equivalent CO2 emissions (kg CO2-eq/a).
CH4 and N2O emissions were converted to CO2-equivalents using IPCC-recommended GWPs by Equations (10) and (11):
M C H 4 = m C H 4 × G W P C H 4 with GWP C H 4 = 28 · kg · C O 2 / kg · C H 4
M N 2 O = m N 2 O × G W P N 2 O with GWP N 2 O : 265 · kg · C O 2 / kg · N 2 O
Total direct greenhouse gas emissions ( M d ) from WWTP operations were calculated using Equation (12):
M d = M C O 2 + M N 2 O + M C H 4
Indirect Carbon Emission Accounting Methodologies for Wastewater Treatment Plants
The indirect greenhouse gas (GHG) emissions from WWTPs primarily originate from electricity consumption and chemical reagent usage, with electricity consumption being the dominant factor. During the operation of WWTPs, equipment such as blowers, pumps, aeration devices, and agitators consume significant amounts of electricity. The indirect GHG emissions from electricity consumption can be calculated using the following Formula (13):
m e = E e × E F e , p
where:
m e represents the annual carbon emissions (in kgCO2-eq/a) from electricity consumption at the WWTP.
E F e , p denotes the average CO2 equivalent emission factor for the regional power sector (in kgCO2/kW·h), adopting the 2021 power sector CO2 emission factor published by the Ministry of Ecology and Environment and the National Bureau of Statistics of China. For instance, the average provincial power sector CO2 emission factor for Shandong Province in 2021 was 0.6838 kgCO2/kW·h.
E e signifies the annual electricity consumption of the WWTP (in kW·h/a).
Additionally, various chemicals such as flocculants, coagulants, carbon sources, and disinfectants are added during the wastewater treatment process. The production of these chemicals also results in GHG emissions. The CO2 emissions from chemical consumption can be accounted for using the formula (14):
m c = j = 1 ( M c , j × E F c , j × r c , j )
where:
m c denotes the annual carbon emissions (in kgCO2-eq/a) from chemical consumption at the WWTP.
M c , j represents the annual dosage of the j-th chemical (in kg/a).
E F c , j signifies the CO2 equivalent emission factor of the j-th chemical (in kgCO2-eq/kg). The specific parameters are detailed in Table 5.
r c , j denotes the effective content (%) of the j-th chemical.
The data presented in Table 5 are sourced from Supplementary Table A.0.4 of the Assessment Standard for Carbon Mitigation in Municipal Wastewater Treatment Plants (T/CUWA 50055-2023).

3. Results and Discussion

3.1. Overall Evaluation of Carbon Emissions

In 2024, the total treated water volume of 98 sewage treatment plants (STPs) in East China reached 1.29 × 10⁹ m3, with a total carbon emission of 5.17 × 10⁸ tCO2-eq. Among these emissions, direct emissions amounted to 1.96 × 10⁸ kgCO2-eq, while indirect emissions totaled 3.21 × 10⁸ tCO2-eq. The carbon emissions of individual STPs ranged from 0.29 × 10³ to 25.80 × 10³ tCO2-eq, with an average of 5.27 × 10³ tCO2-eq and a median of 3.43 × 10³ tCO2-eq.
The average carbon emission intensity of the 98 STPs was 0.399 kgCO2-eq/m3, varying from 0.160 to 1.749 kgCO2-eq/m3. Compared to the carbon emission intensity of STPs in China reported in other literature (0.360–1.439 kgCO2-eq/m3) [25,26,27,28,29,30], the carbon emission intensity of STPs in East China was lower. It was also lower than the average values reported for Poland, Finland [31], and several developing countries [32]. The average carbon emission intensity of wastewater treatment plants (WWTPs) in Poland and Finland is reported as 31 kg CO2eq/PE and 63 kg CO2eq/PE, respectively, when normalized to population equivalent (PE). When recalculated using treated water volume as the functional unit, the average emission intensity for both countries converges to approximately 0.7 kg CO2eq/m3. In comparison, Guo et al. [33] estimated an average greenhouse gas emission intensity of 0.45 kg CO2-eq/m3 across 5282 Chinese WWTPs. Notably, this value exceeds the emission intensity observed in eastern China’s facilities, which is attributed to the inclusion of sludge disposal-related emissions in Guo et al.’s national-scale assessment. By contrast, the present study focuses on direct process emissions and chemical-associated carbon outputs, thereby providing a refined baseline for targeted regional mitigation strategies. As shown in Figure 2, the distribution of carbon emission intensity in East China’s STPs generally followed a normal distribution. Specifically, five STPs (5.1%) had a carbon emission intensity of less than 0.2 kgCO2-eq/m3, 82 STPs (83.1%) had an intensity between 0.2 and 0.6 kgCO2-eq/m3, and only three STPs (3.1%) had an intensity higher than 1.0 kgCO2-eq/m3.
The proportion of each carbon emission category in East China’s STPs is illustrated in Figure 3. Indirect carbon emissions were the primary source of carbon emissions in STPs, with electricity consumption contributing the largest proportion, reaching 47.9%. This finding aligns with the research trends identified by Yang et al. [34,35] and other scholars. However, the proportion of carbon emissions from electricity consumption in East China (47.9%) was significantly lower than the value reported in their study (58.3%). This discrepancy may be attributed to the higher degree of grid cleanliness in East China.
The proportion of carbon emissions from chemical consumption was 14.2%, indicating that the impact of chemical-related carbon emissions on the overall carbon footprint of STPs cannot be overlooked. Notably, fossil-derived CO2, which was not considered in the IPCC accounting framework, accounted for 4.6% of carbon emissions in this study. Therefore, we recommend incorporating fossil-derived CO2 into the carbon emission accounting system of STPs to provide a more comprehensive assessment of their environmental impact.
From the perspective of processing units, the biochemical system (64.2%) and the water intake and lifting system (22.4%) were identified as the main contributors to carbon emissions in STPs. As shown in Figure 4, a positive correlation was observed between power consumption per ton of water treated and carbon emission intensity in STPs.
Direct carbon emissions accounted for 37.9% of the total carbon emissions, with CH4 and N2O emissions contributing 16% and 17.3%, respectively. It is noteworthy that the proportion of N2O emissions exceeded that of CH4, primarily due to two factors: first, the global warming potential (GWP) of N2O is significantly higher than that of CH4; second, the low influent C/N ratio of the 98 STPs included in this study, with an average value of 2.36, resulted in suboptimal biological nitrogen removal efficiency and increased production of N2O as an intermediate byproduct [36,37,38]. Consequently, despite the direct N2O emissions (337.3 t) being far lower than CH4 emissions (2953.7 t), the contribution of N2O to the overall carbon footprint remained significant.
A sensitivity analysis was conducted within this study’s GHG accounting framework to evaluate the influence of critical parameters, including CH4 and N2O emission factors, and the influent COD/TN ratio. The analysis revealed the following:
(1)
A 1% variation in CH4 or N2O emission factors resulted in a proportional 1% change in CH4 or N2O emissions, respectively.
(2)
A 10% fluctuation in the influent COD/TN ratio led to a 10.1% alteration in total carbon emissions.
These findings indicate comparable sensitivity coefficients across the evaluated parameters, suggesting that uncertainties in CH4/N2O emission factors and influent wastewater characteristics exert equivalent levels of influence on the overall carbon accounting accuracy. This underscores the necessity of region-specific emission factor databases and real-time influent quality monitoring for robust GHG inventories.

3.2. Analysis of Influencing Factors on Carbon Emission Intensity

3.2.1. Processing Scale

Figure 5 illustrates the distribution of carbon emission intensity across STPs of varying processing scales. Small-scale STPs (<1 × 10⁴ m3/d) exhibited significantly higher carbon emission intensity (0.582 kg CO2-eq/m3) compared to larger STPs (0.392 kg CO2-eq/m3), with a 48.5% increase attributed to low operational efficiency of equipment and high energy consumption per unit of water treated. The average carbon emission intensities for STPs with processing scales of 1.0 × 10⁴–5.0 × 10⁴ m3/d, 5.0 × 10⁴~10.0 × 10⁴ m3/d, and 10.0 × 10⁴–20.0 × 10⁴ m3/d were 0.408, 0.392, and 0.397 kg CO2-eq/m3, respectively. This indicates a decreasing trend in carbon emission intensity with increasing processing scale, which was most pronounced for scales below 5.0 × 10⁴ m3/d. However, the impact of scale effect on carbon emission intensity became insignificant when the processing scale exceeded 5.0 × 10⁴ m3/d.
Small-scale STPs (<1 × 10⁴ m3/d) had a power consumption per ton of water that was 59.1% higher than the average of the 98 STPs surveyed. This elevated energy consumption directly contributed to their significantly higher carbon emission intensity. The operational efficiency of equipment and facilities was lower in small-scale STPs and improved with increasing processing scale. However, beyond a processing scale of 1.0 × 10⁴ m3/d, further increases in scale had minimal impact on improving equipment operational efficiency. Specifically, the power consumption per ton of water for STPs with processing scales of 1.0 × 10⁴–5.0 × 10⁴ m3/d, 5.0 × 10⁴–10.0 × 10⁴ m3/d, and 10.0 × 10⁴–20.0 × 10⁴ m3/d was 0.289, 0.302, and 0.306 kW·h/m3, respectively, showing no significant reduction.

3.2.2. Operating Load Rate

The relationship between operating load and carbon emission intensity is shown in Figure 6. As the operating load rate increases, the carbon emission intensity decreases, with a clear negative correlation between the two. Specifically, for STPs with a load rate below 40%, the carbon emission intensity is as high as 0.883 kgCO2-eq/m3. For STPs with load rates in the range of 40% to 60% and 60% to 80%, the carbon emission intensity decreases to 0.407 kgCO2-eq/m3 and 0.416 kgCO2-eq/m3, respectively. When the load rate is higher than 100%, the carbon emission intensity of the STP reaches the minimum value of 0.326 kgCO2-eq/m3.
High-Emission Mechanisms During Low-Load Operation (<40% Design Capacity)
(1)
Reduced Equipment Efficiency and Elevated Energy Allocation
a. “Oversized Equipment” Phenomenon: Aeration blowers, pumps, and other critical units maintain baseline power consumption even at low loads, resulting in significant energy waste. For instance, blowers operating at reduced frequencies exhibit substantially lower energy efficiency compared to rated conditions.
b. Increased Proportional Fixed Energy Consumption: Lighting, control systems, and other fixed energy demands remain constant despite reduced influent volumes, thereby increasing energy allocation per unit of treated wastewater and indirectly elevating carbon intensity.
(2)
Impaired Microbial Activity and Treatment Performance
a. Endogenous Respiration Phase: Prolonged exposure to low organic loads induces microbial “starvation”, forcing microorganisms to utilize endogenous reserves. This metabolic shift necessitates higher aeration demands per unit pollutant degraded, prolongs hydraulic retention time (HRT), and exacerbates energy-related carbon emissions.
b. Sludge Aging: Extended solids retention time (SRT) under chronic low-load conditions reduces microbial activity, requiring supplementary carbon sources or chemical coagulants to stabilize treatment processes, both of which contribute to additional carbon footprints.
(3)
Chemical Addition-Induced Carbon Emissions
External Carbon Sources: Supplemental carbon (e.g., sodium acetate) for denitrification processes entails production, transportation, and utilization-phase emissions.
Foam/Sludge Bulking Control: Low-load operation often necessitates chemical addition to mitigate operational issues (e.g., foam formation, sludge bulking), further increasing process-related carbon emissions.
Emission Reduction Mechanisms During Moderate-to-High Load Operation (40–100% Design Capacity)
(1)
Optimized Equipment Performance: Key energy-consuming units (e.g., aeration systems, pumping systems) operate at peak efficiency near design capacity, minimizing specific energy consumption (kWh/m3).
(2)
Fixed Energy Cost Amortization: Fixed operational costs (e.g., lighting, automation) are distributed across larger influent volumes, reducing per-unit treatment emissions.
(3)
Enhanced Biological Treatment Efficiency
a. Microbial Activity Surge: High-load conditions stimulate exponential microbial growth, accelerating pollutant degradation rates, shortening HRT, and minimizing aeration requirements.
b. Mitigated Anaerobic Zone Formation: Sufficient organic loading prevents localized anoxic/anaerobic conditions in aeration tanks, thereby suppressing methane (CH4) and nitrous oxide (N2O) emissions.
(4)
Reduced Sludge-Associated Emissions
Lower Sludge Yield: High substrate availability enhances microbial assimilation efficiency, reducing excess sludge production.
Improved Sludge Stability: Enhanced microbial activity minimizes supplementary sludge disposal requirements and associated treatment emissions.
Emission Minimization Mechanisms During Overload Operation (>100% Design Capacity)
(1)
Peak Equipment Efficiency: Aeration systems and pumps operate within optimal design windows, maximizing energy efficiency (e.g., oxygen transfer rate, motor load factor).
(2)
Accelerated Microbial Metabolism: Overload conditions induce logarithmic microbial growth, rapidly depleting organic substrates and shortening HRT.
(3)
Optimized Carbon Utilization: Elevated influent carbon-to-nitrogen ratios may reduce external carbon supplementation demands for denitrification.
(4)
Indirect Emission Dominance: Electricity consumption constitutes the primary emission source in WWTPs. Overload operation reduces specific energy consumption (kWh/m3), offsetting potential minor increases in direct emissions (e.g., chemical use) and yielding net carbon intensity reductions.
In addition, there is also a clear negative correlation between the operating load rate and the power consumption per ton of water. When the operating load rate is below 40%, the average power consumption per ton of water is as high as 0.696 kW·h, and the corresponding carbon emission intensity also reaches the highest level. As the load rate increases, the operating efficiency of the equipment and facilities improves significantly, and the power consumption per ton of water gradually decreases, along with a reduction in carbon emission intensity. When the load rate is in the range of 60% to 80% and 100% to 120%, the power consumption per ton of water decreases to 0.282 kW·h/m3 and 0.237 kW·h/m3, respectively.

3.2.3. Treatment Process

Significant differences in carbon emission intensity exist among various sewage treatment processes (Figure 7). While carbon emission intensity is influenced by factors such as load rate, influent water quality, aeration intensity, and operational modes, the study found that among 98 STPs, the anaerobic–anoxic–oxic (AAO) process exhibited the lowest carbon emission intensity, with an average value of 0.370 kgCO2-eq/m3. This was lower than the average carbon emission intensity of all 98 STPs (0.399 kgCO2-eq/m3). This outcome is closely associated with the high nitrogen and phosphorus removal efficiency of the AAO process. In contrast, the Sequencing Batch Reactor (SBR) process, due to its intermittent operation mode, consumes more electricity, leading to a higher carbon emission intensity [30,31].
Direct Carbon Emission Disparities Between AAO and SBR Processes
(1)
Nitrous Oxide (N2O) Emission Variability During Denitrification
AAO Process: The continuous-flow configuration with dedicated anaerobic, anoxic, and aerobic zones spatially separates nitrification and denitrification processes. Enhanced carbon utilization efficiency in the anoxic zone promotes complete denitrification, minimizing N2O accumulation and emissions.
SBR Process: Sequential batch operation induces frequent environmental fluctuations (e.g., dissolved oxygen, carbon availability), destabilizing nitrifier and denitrifier communities. Incomplete denitrification under dynamic conditions exacerbates N2O generation.
(2)
Methane (CH4) Production Potential
AAO Process: Rapid organic matter adsorption by polyphosphate-accumulating organisms (PAOs) in the anaerobic zone and subsequent aerobic oxidation reduce residual organic content in excess sludge, thereby diminishing CH4 emission potential during downstream sludge treatment.
SBR Process: Intermittent aeration may leave residual organic substrates in sludge, increasing CH4 emissions during subsequent stabilization processes.
Indirect Carbon Emission Disparities Between AAO and SBR Processes
(1)
Aeration Energy Consumption and Efficiency
AAO Process: Continuous aeration in aerobic zones allows for optimized dissolved oxygen (DO) control (e.g., step-feed aeration, fine-bubble diffusers), reducing energy waste.
SBR Process: Frequent blower start/stop cycles during intermittent aeration incur energy losses (e.g., motor inrush currents), while prolonged aeration per treatment cycle elevates overall electricity consumption.
(2)
Hydraulic Retention Time (HRT) and Sludge Retention Time (SRT) Management
AAO Process: Continuous-flow operation enables extended SRT, facilitating nitrifier enrichment and stable nitrogen removal without chemical supplementation. Prolonged SRT also reduces excess sludge yield, mitigating sludge treatment emissions.
SBR Process: Limited SRT due to batch operation risks nitrifier washout during decanting phases, necessitating prolonged aeration or external carbon addition to maintain treatment efficacy, thereby increasing energy and chemical footprints.
Process Stability and Carbon Utilization Efficiency
AAO Process: Spatial segregation of functional microbial guilds (PAOs, nitrifiers, denitrifiers) ensures optimal carbon allocation, minimizing competition for resources. Stable carbon pathways reduce supplementary carbon requirements for denitrification.
SBR Process: Carbon substrates must simultaneously support anaerobic phosphorus release, denitrification, and aerobic phosphorus uptake within a single reactor, often leading to carbon limitations and necessitating external carbon dosing.
In summary, the AAO process demonstrates superior carbon emission performance through process compartmentalization, enhanced carbon utilization efficiency, and stable operational conditions. These attributes collectively minimize direct N2O/CH4 emissions and indirect energy-related emissions. Conversely, the SBR process’s intermittent operation and carbon resource competition result in higher overall carbon intensity, positioning the AAO configuration as a more environmentally sustainable option for wastewater treatment.
To eliminate interference from other factors on carbon emission intensity and more intuitively compare the carbon emission levels of different treatment processes, this study selected four STPs with different treatment processes for comparative analysis. These STPs were chosen to be as comparable as possible in terms of design capacity, influent/effluent water quality, and power consumption per ton of water. Their basic information and carbon emission data are presented in Table 6 and Table 7. The carbon emission intensity of the four STPs was ranked as follows: WWTPs4 (oxidation ditch process) < WWTPs2 (AAO process) < WWTPs3 (multi-stage AO process) < WWTPs1 (SBR process). However, due to differences in the treatment capacities of these four STPs, this ranking may not fully represent the actual carbon emission levels of each process. A larger sample size is required to draw more reliable conclusions.

3.2.4. Pollutant Reduction

Carbon emission intensity is closely linked to power consumption, with COD and TN being the primary oxygen-consuming pollutants. Figure 8 illustrates the relationship between COD removal, TN removal, and carbon emission intensity. After excluding outliers with limited sample sizes, the overall trend indicates that as COD and TN removal increases, carbon emission intensity rises correspondingly. Thus, while ensuring effluent compliance with discharge standards, minimizing COD and TN removal as much as possible is recommended to reduce carbon emission intensity and promote environmental sustainability. Additionally, the study revealed that when influent COD concentrations were between 200–250 mg/L, STPs exhibited higher carbon emission intensities than when COD concentrations were in the 250–300 mg/L range. This observation may stem from the combined effects of factors such as treatment capacity, load rate, operational mode, management practices, and process parameters.

3.2.5. Analysis of Chemical Carbon Emissions

This study conducted a comprehensive analysis of the chemical carbon emissions from 98 STPs in East China in 2024, revealing the significance of chemical usage in the carbon footprint of STPs. The results showed that chemical carbon emissions accounted for 14.2% of the total carbon emissions from STPs, highlighting the non-negligible role of chemical usage as a source of carbon emissions.
The proportion of carbon emissions from various agents is shown in Figure 9. Carbon sources and phosphorus removal agents were identified as the primary contributors to chemical carbon emissions, accounting for 27.8% and 18.9% of the total chemical carbon emissions, respectively [32]. This indicates that reducing the dosage of carbon sources and phosphorus removal agents is key to mitigating chemical carbon emissions from STPs. In contrast, disinfectants contributed the least to carbon emissions, with a share of only 10.4%, suggesting their relatively minor impact on chemical carbon emissions.
Based on these findings, the following recommendations are proposed to help STPs reduce chemical carbon emissions:
(1)
Optimize chemical dosage: Precisely control the addition of carbon sources and phosphorus removal agents to avoid overuse and reduce carbon emissions.
(2)
Adopt low-carbon alternatives: Explore and utilize low-carbon alternatives for carbon sources and phosphorus removal agents to lower overall carbon emissions.
(3)
Improve treatment processes: Enhance wastewater treatment processes to reduce reliance on carbon sources and phosphorus removal agents, thereby indirectly reducing carbon emissions.

3.2.6. Relationship Between Influent Water Quality and Chemical Carbon Emission Intensity

This study analyzed the impact of influent water quality, TN (total nitrogen) removal, and TP (total phosphorus) removal on the intensity of chemical carbon emissions (Figure 10). Carbon sources are vital for microbial synthesis of cellular materials and energy acquisition. During biological nitrogen and phosphorus removal processes, carbon sources serve as electron donors, participating in denitrification reactions to facilitate the reduction of nitrate nitrogen to nitrogen gas, thereby removing nitrate nitrogen from wastewater. Concurrently, carbon sources aid phosphorus-accumulating organisms (PAOs) in releasing and absorbing phosphorus, enhancing phosphorus removal efficiency. Scientific addition of carbon sources can optimize the microbial community structure in wastewater treatment systems, promoting the activity of denitrifying bacteria and PAOs and improving nitrogen and phosphorus removal rates. When influent carbon sources are insufficient, STPs often add carbon sources to ensure effluent TN compliance.
Figure 10 shows that as influent BOD/TN increases, the carbon emission intensity of carbon sources decreases. The carbon emission intensity of carbon sources when BOD/TN < 2 (0.051 kgCO2-eq/m3) is significantly higher than when BOD/TN > 2. When BOD/TN > 4, the carbon emission intensity of carbon sources drops to 5.73 × 10⁻³ kgCO2-eq/m3. Furthermore, the carbon emission intensity of carbon sources decreases with rising influent COD/TN. When COD/TN > 6, the carbon emission intensity of carbon sources declines sharply. No significant correlation was found between TN removal and the carbon emission intensity of carbon sources.
The carbon emission intensity of phosphorus removal agents when influent BOD/TP < 20 (0.0141 kgCO2-eq/m3) is substantially higher than when BOD/TP > 20 (0.0183 kgCO2-eq/m3). No significant correlation was observed between TP removal and carbon emission intensity of phosphorus removal agents. Therefore, controlling the proportions of various pollutants in the influent to meet nitrogen and phosphorus removal requirements can reduce the carbon emission intensity of carbon sources and phosphorus removal agents. Specific measures include implementing rainwater–sewage diversion, improving the sewer network, and adjusting the influent C/N ratio using alternative carbon sources. Additionally, Dereli et al. [39] found that optimizing high-efficiency sedimentation tank operation and configuring precise dosing systems can reduce phosphorus removal agent dosage. Controlling the reflux rate, nitrate nitrogen at the anoxic tank outlet, and rationally distributing influent to pre-anoxic, anaerobic, and anoxic zones can effectively utilize influent carbon sources, reducing the need for additional carbon sources.

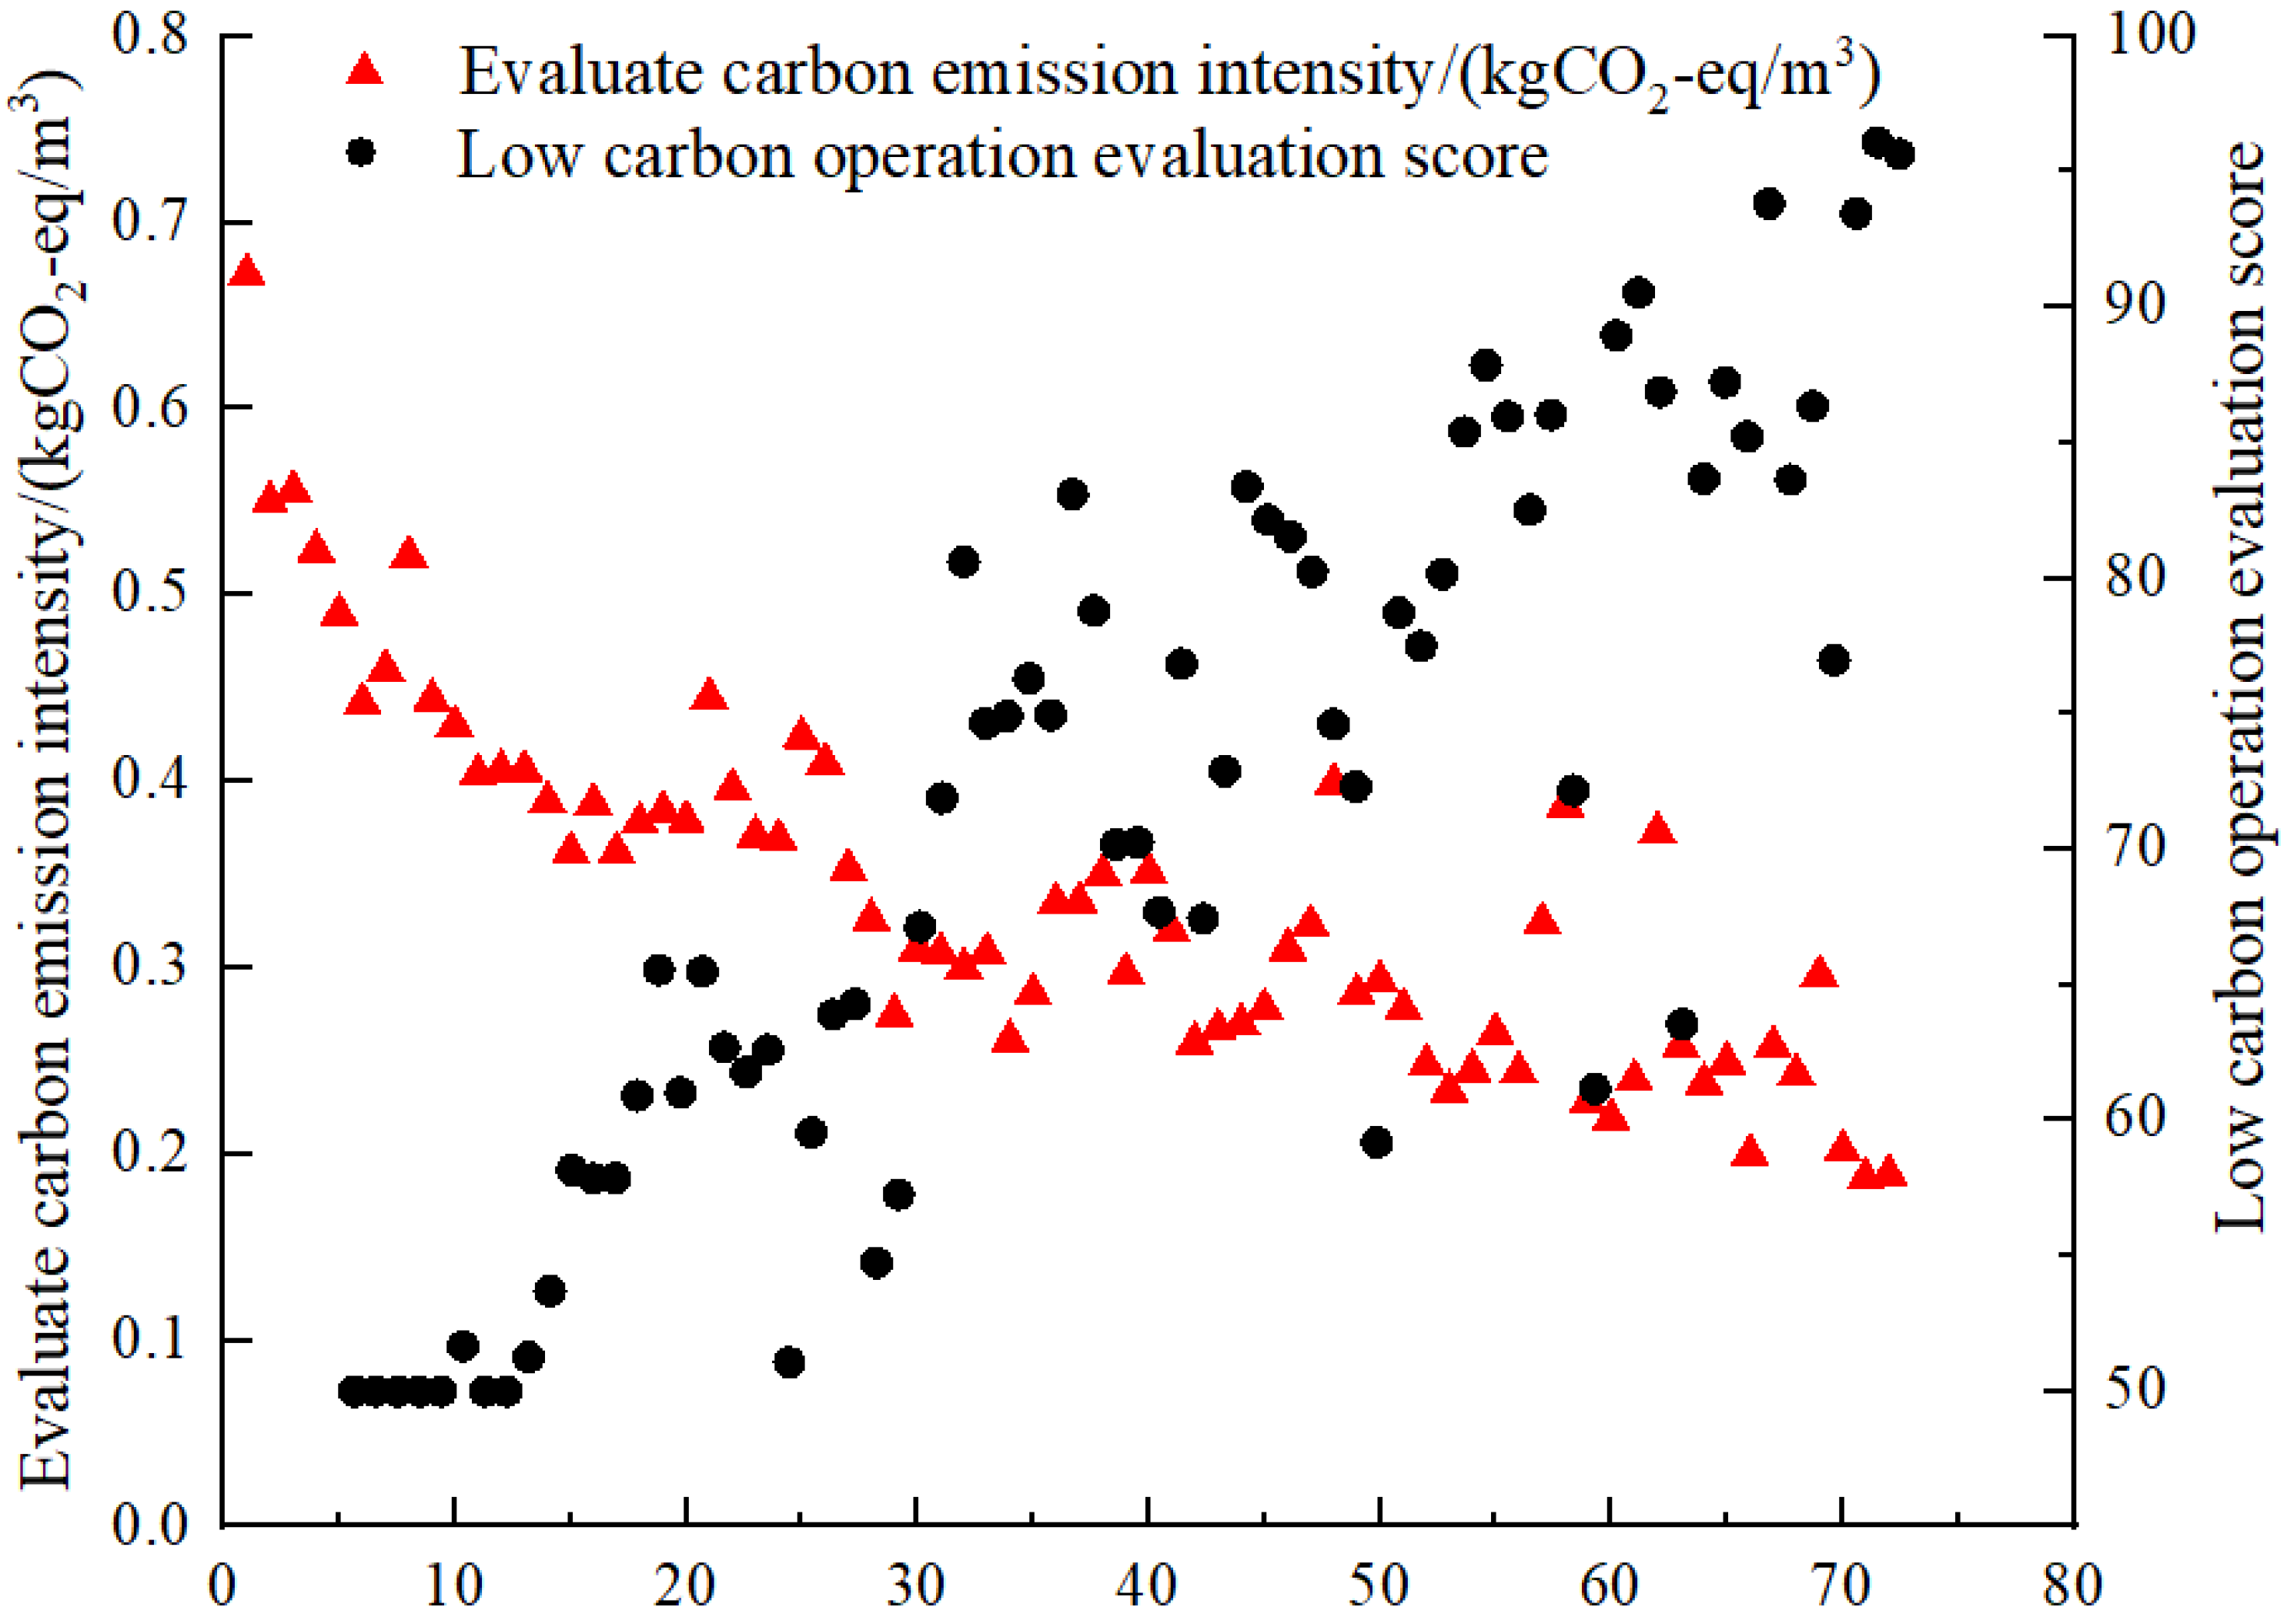
3.3. Low-Carbon Operation Evaluation

The Technical Specification for Low-Carbon Operation of Sewage Treatment Plants (T/CAEPI 49-2022), China’s inaugural low-carbon group standard in the sewage treatment sector, marks a pioneering effort in advancing low-carbon practices for STPs. Applying this standard, 98 STPs were evaluated for their low-carbon operations. Based on the evaluation criteria, STPs were initially screened, requiring an average load rate exceeding 50% and a daily average COD contribution from industrial wastewater to total influent COD below 10% during the evaluation period. After screening, 72 STPs met the evaluation conditions.
The low-carbon operation evaluation index system comprises quantitative evaluation and qualitative evaluation. Quantitative evaluation focuses on assessing carbon emission intensity, while qualitative evaluation examines low-carbon practices such as equipment/facility upgrades, operational optimization, monitoring, and accounting. Due to challenges in obtaining qualitative evaluation data, this study prioritizes quantitative evaluation, which provides a data-driven, objective reflection of STPs’ low-carbon performance. The carbon emission intensity is calculated using Formulas (15)–(17) below.
E P = E d c + E i c
E d c = E N 2 O × k 1 + E C H 4 + E C O 2
E i c = [ E e × k 2 × k 5 + E h + E c ] × k 3 × k 4
where:
E p : Evaluation of carbon emission intensity (kgCO2-eq/m3).
E d c : Direct carbon emission correction intensity (kgCO2-eq/m3).
E i c : Indirect carbon emission correction intensity (kgCO2-eq/m3).
E N 2 O : Direct N2O carbon emission (kgCO2-eq/m3).
E C H 4 : Direct CH4 carbon emission intensity (kgCO2-eq/m3).
E C O 2 : Direct CO2 carbon emission intensity (kgCO2-eq/m3).
k 1 : Total nitrogen removal rate correction factor (dimensionless).
k 2 : Treatment capacity correction factor (dimensionless).
k 3 : Oxygen-demanding pollutant reduction correction factor (dimensionless).
k 4 : Effluent discharge standard correction factor (dimensionless).
k 5 : Odor control level correction factor (dimensionless).
As shown in Figure 11, the carbon emission correction intensity of the 72 STPs exhibited a significant negative correlation with their low-carbon operation evaluation scores. Specifically, the higher the carbon emission intensity of an STP, the lower its low-carbon operation evaluation score. The average corrected carbon emission intensity was 0.338 kgCO2-eq/m3, with a maximum value of 0.672 kgCO2-eq/m3 and a minimum value of 0.187 kgCO2-eq/m3. The direct carbon emission correction intensity ranged from 0.046 to 0.218 kgCO2-eq/m3, with an average of 0.106 kgCO2-eq/m3. The indirect carbon emission correction intensity ranged from 0.116 to 0.560 kgCO2-eq/m3, with an average of 0.232 kgCO2-eq/m3.
After adjusting the correction factors—including the total nitrogen removal rate correction factor, treatment scale correction factor, oxygen-consuming pollutant reduction correction factor, effluent discharge standard correction factor, and odor control level correction factor—the carbon emission correction intensity of the 72 STPs decreased by 12% compared to pre-correction levels. Notably, only 11 STPs experienced an increase in carbon emission intensity after correction.
In terms of low-carbon operation evaluation, 14 (19.4%) STPs achieved scores above 85 points, meeting the Class 1 standard for low-carbon operation. 16 (22.2%) STPs were classified as Class 2, and 42 (58.3%) STPs were classified as Class 3. However, 18 STPs scored below 60 points, categorized as high-carbon-emitting STPs, with 7 STPs scoring only 50 points. The design capacities of these high-carbon-emitting STPs were primarily 0.2 × 10⁴–1 × 10⁴ m3/d (3 STPs) and 1.0 × 10⁴–4 × 10⁴ m3/d (3 STPs), suggesting that smaller-scale STPs possess greater carbon reduction potential.

4. Conclusions

This study systematically reveals the carbon emission characteristics of STPs in eastern China for the first time by integrating actual production data, providing a scientific foundation for regional policymaking on pollution and carbon reduction and promoting low-carbon operation modes. Additionally, the carbon emission accounting system and low-carbon operation evaluation system established herein offer technical support for STP carbon footprint certification and carbon trading mechanisms. The main conclusions are as follows:
(1)
In 2024, the total carbon emissions from 98 STPs in eastern China reached 5.17 × 10⁸ tCO2-eq, with an average carbon emission intensity of 0.399 kgCO2-eq/m3—lower than the average of several developing countries. The carbon emission intensity follows a normal distribution, with 83.1% of STPs having an intensity between 0.2 and 0.6 kgCO2-eq/m3.
(2)
Indirect carbon emissions are the primary source (62.1%) of STP carbon emissions, with power consumption (47.9%) and chemical use (14.2%) as key contributors. It is recommended to include fossil-derived CO2 (4.6%) in the accounting system.
(3)
Treatment scale, operating load rate, treatment process, influent water quality, and pollutant reduction significantly impact STP carbon emissions. Small-scale STPs inherently exhibit higher carbon emission intensities compared to large-scale facilities due to their elevated energy consumption per ton of wastewater. To address this structural disadvantage, we recommend that governmental authorities implement differentiated carbon quota allocation policies tailored to the operational realities of small-scale STPs.
(4)
To advance low-carbon wastewater treatment, we propose the following strategies:
(i)
Prioritize the promotion of the anaerobic–anoxic–oxic (AAO) process. Regulatory agencies should encourage municipal design institutes to adopt AAO technology as the preferred option for new construction or retrofitting projects.
(ii)
Deploy intelligent chemical dosing systems to optimize reagent utilization and minimize process-related carbon emissions.
(iii)
Enhance influent load rates through collaborative mechanisms with upstream authorities, such as expanding service coverage, implementing integrated governance of sewer networks, or constructing new infrastructure to improve hydraulic utilization.
(iv)
Strengthen the professional capabilities of STP personnel, as management and operational expertise directly influence plant efficiency, production costs, and carbon performance. Targeted training programs should be established to continuously upgrade the technical proficiency of plant operators and managers, enabling cost-effective achievement of low-carbon operational targets without substantial capital investments.
(5)
Carbon sources and phosphorus removal chemicals are the main contributors to chemical carbon emissions, accounting for 27.8% and 18.9% of such emissions, respectively. Reasonably controlling the nutrient proportion in influent can effectively reduce chemical carbon emissions.
(6)
The low-carbon operation evaluation of STPs in eastern China shows that only 19.4% meet the Class 1 standard, while 25% score below 60 points, categorized as high-carbon-emitting STPs, indicating significant carbon reduction potential.
Based on the study’s findings, the following recommendations are proposed to inform carbon regulation and climate policy development in East China:
(1)
Differentiated Regulatory Frameworks:
Regulatory frameworks should explicitly account for variations in carbon emission intensity across STPs of differing operational scales and treatment processes. Small-scale facilities, which inherently exhibit higher emission intensities due to elevated energy consumption per unit volume, warrant particular policy attention.
(2)
Technology Adoption Incentives:
Promote the adoption of intelligent chemical dosing systems and energy-efficient equipment to minimize process-related carbon footprints. Financial or technical constraints hindering small-scale STPs should be addressed through flexible incentives, such as subsidized technology upgrades or preferential tax exemptions.
(3)
Integration into Existing Management Systems:
Incorporate carbon emission metrics (absolute emissions and emission intensity) into the current wastewater sector governance framework. This integration would enable performance benchmarking and facilitate targeted mitigation strategies.
(4)
Carbon Mitigation Incentives:
Develop government-led incentive programs, including emission reduction subsidies and tax relief, to encourage synergistic pollution control and carbon reduction. Small-scale STPs facing financial or technical limitations should receive prioritized support through relaxed eligibility criteria or enhanced grant allocations.
Technological and Methodological Advancements:
(1)
Dynamic Emission Modeling: Conduct pilot studies on dynamic emission modeling and low-carbon technology applications for high-emission STPs to guide operational transformation toward carbon neutrality.
(2)
Real-Time Monitoring Systems: Deploy online greenhouse gas monitoring systems (e.g., for CO2, CH4, N2O) in underground STPs or facilities with odor control installations. Such systems would enable precise quantification of real-time emission profiles, offering superior accuracy compared to conventional calculation frameworks.
Study Limitations and Future Directions:
This research has several limitations. First, indirect emissions from sludge treatment processes were excluded from the analysis. Second, the study assumed constant emission factors throughout the treatment lifecycle, neglecting potential spatiotemporal variability. Future investigations should incorporate life cycle assessment (LCA) methodologies to account for upstream/downstream emissions and validate emission factors under diverse operational conditions.

Author Contributions

Conceptualization, H.W.; Methodology, H.W. and L.L.; Validation, X.Z.; Formal analysis, Z.L.; Investigation, H.W. and Z.L.; Resources, H.W. and Z.L.; Data curation, X.Z. and Z.L.; Writing—original draft preparation, Z.L.; Writing—review and editing, Y.T.; Visualization, Z.L.; Supervision, L.L.; Project administration, L.L.; Funding acquisition, L.L. All authors have read and agreed to the published version of the manuscript.

Funding

Supported by the State Key Laboratory of Urban Water Resource and Environment (Harbin Institute of Technology) (No. 2024TS14), the Innovative Research Group of the National Natural Science Foundation of China (No. 52321005), and the National Key R&D Program of China (2022YFC3801101).

Institutional Review Board Statement

Not applicable.

Informed Consent Statement

Not applicable.

Data Availability Statement

The data used in this article are not made public. If you need to use them, please contact the corresponding author.

Conflicts of Interest

Author Haoyu Wang was employed by the company Beijing Enterprises Water Group Limited (BEWG). The remaining authors declare that the research was conducted in the absence of any commercial or financial relationships that could be construed as a potential conflict of interest.

Abbreviations

The following abbreviations are used in this manuscript:
WWTPsWastewater treatment plants
IPCCUnited Nations Intergovernmental Panel on Climate Change
GS 2023Group Standard 2023, T/CUWA 50055-2023
GS 2022Group Standard 2022, T/CAEPI 49-2022
CODChemical oxygen demand
TNTotal nitrogen
BODBiochemical oxygen demand

References

  1. Shrestha, A.; Bhattarai, T.N.; Ghimire, S.; Mainali, B.; Treichel, H.; Paudel, S.R. Estimation of greenhouse gases emission from domestic wastewater in Nepal: A scenario-based analysis applicable for developing countries. Chemosphere 2022, 300, 134501. [Google Scholar] [CrossRef]
  2. Yu, Q.; Li, S.; Chen, N. Urbanization and greenhouse gas emissions from municipal wastewater in coastal provinces of China: Spatiotemporal patterns, driving factors, and mitigation strategies. Environ. Res. 2024, 259, 119398. [Google Scholar] [CrossRef] [PubMed]
  3. Tong, Y.D.; Wang, M.Z.; Peñuelas, J.; Liu, X.Y.; Paerl, H.W.; Elser, J.J.; Sardans, J.; Couture, R.M.; Larssen, T.; Hu, H.Y.; et al. Improvement in municipal wastewater treatment alters lake nitrogen to phosphorus ratios in populated regions. Proc. Natl. Acad. Sci. USA 2020, 117, 11566–11572. [Google Scholar] [CrossRef]
  4. Zhang, Y.X.; Huo, J.Z.; Zheng, X.J. Wastewater: China’s next water source. Science 2021, 374, 1332. [Google Scholar] [CrossRef] [PubMed]
  5. Li, S.B.; Emaminejad, S.A.; Aguiar, S.; Furneaux, A.; Cai, X.M.; Cusick, R.D. Evaluating Long-Term Treatment Performance and Cost of Nutrient Removal at Water Resource Recovery Facilities under Stochastic Influent Characteristics Using Artificial Neural Networks as Surrogates for Plantwide Modeling. ACS EST Eng. 2021, 1, 1517–1529. [Google Scholar] [CrossRef]
  6. Moussavi, S.; Thompson, M.; Li, S.B.; Dvorak, B. Assessment of small mechanical wastewater treatment plants: Relative life cycle environmental impacts of construction and operations. J. Environ. Manag. 2021, 292, 112802. [Google Scholar] [CrossRef]
  7. Yan, X.; Qiu, D.Z.; Zheng, S.K.; Cheng, K.; Han, Y.P.; Sun, J.H.; Su, X.F. Spatial and Temporal Distribution of Greenhouse Gas Emissions From Municipal Wastewater Treatment Plants in China From 2005 to 2014. Earths Future 2019, 7, 340–350. [Google Scholar] [CrossRef]
  8. Li, H.Y.; You, L.F.; Du, H.; Yu, B.W.; Lu, L.; Zheng, B.; Zhang, Q.; He, K.B.; Ren, N.Q. Methane and nitrous oxide emissions from municipal wastewater treatment plants in China: A plant-level and technology-specific study. Environ. Sci. Ecotechnol. 2024, 20, 100345. [Google Scholar] [CrossRef]
  9. Lu, J.Y.; Wang, X.M.; Liu, H.Q.; Yu, H.Q.; Li, W.W. Optimizing operation of municipal wastewater treatment plants in China: The remaining barriers and future implications. Environ. Int. 2019, 129, 273–278. [Google Scholar] [CrossRef]
  10. Xu, A.; Wu, Y.H.; Chen, Z.; Wu, G.X.; Wu, Q.Y.; Ling, F.Q.; Huang, W.E.; Hu, H.Y. Towards the new era of wastewater treatment of China: Development history, current status, and future directions. Water Cycle 2020, 1, 80–87. [Google Scholar] [CrossRef]
  11. Su, Q.; Dai, H.C.; Xie, S.Y.; Yu, X.Y.; Lin, Y.; Singh, V.P.; Karthikeyan, R. Water-Energy-Carbon Nexus: Greenhouse Gas Emissions from Integrated Urban Drainage Systems in China. Environ. Sci. Technol. 2023, 57, 2093–2104. [Google Scholar] [CrossRef] [PubMed]
  12. Liu, F.Q.; Ding, N.; Zheng, G.H.; Xu, J.R. Carbon emission prediction and reduction analysis of wastewater treatment plants based on hybrid machine learning models. Environ. Eng. Res. 2025, 30, 224–245. [Google Scholar] [CrossRef]
  13. Guo, D.; Li, B.; Yu, W.; Han, J.-C.; Zhou, Y.; Ye, Z.; Wu, X.; Young, B.; Huang, Y. Revisiting China’s domestic greenhouse gas emission from wastewater treatment: A quantitative process life-cycle assessment. Sci. Total Environ. 2023, 876, 162597. [Google Scholar] [CrossRef]
  14. Xi, J.; Gong, H.; Zhang, Y.; Dai, X.; Chen, L. The evaluation of GHG emissions from Shanghai municipal wastewater treatment plants based on IPCC and operational data integrated methods (ODIM). Sci. Total Environ. 2021, 797, 148967. [Google Scholar] [CrossRef] [PubMed]
  15. Tong, Y.D.; Liao, X.W.; He, Y.Y.; Cui, X.M.; Wishart, M.; Zhao, F.; Liao, Y.L.; Zhao, Y.X.; Lv, X.B.; Xie, J.W.; et al. Mitigating greenhouse gas emissions from municipal wastewater treatment in China. Environ. Sci. Ecotechnol. 2024, 20, 100341. [Google Scholar] [CrossRef]
  16. Ji, M.C.; Liao, H.Q.; Lu, Z.B.; Mao, L.H.; Zhou, X.X.; Yang, F.; Feng, D.X.; Wang, Q.Q. Analyzing the variation of greenhouse gas emissions from typical municipal wastewater treatment plants in Beijing during 2007–2021. Environ. Pollut. 2024, 360, 124655. [Google Scholar] [CrossRef] [PubMed]
  17. Du, W.-J.; Lu, J.-Y.; Hu, Y.-R.; Xiao, J.; Yang, C.; Wu, J.; Huang, B.; Cui, S.; Wang, Y.; Li, W.-W. Spatiotemporal pattern of greenhouse gas emissions in China’s wastewater sector and pathways towards carbon neutrality. Nat. Water 2023, 1, 166–175. [Google Scholar] [CrossRef]
  18. GB18918-2002; Discharge standard of pollutants for municipal wastewater treatment plant. State Environmental Protection Administration: Beijing, China, 2002.
  19. Li, D.; Van De Werfhorst, L.C.; Dunne, T.; Devarajan, N.; Ayala, T.G.; Holden, P.A. Surf zone microbiological water quality following emergency beach nourishment using sediments from a catastrophic debris flow. Water Res. 2020, 176, 115733. [Google Scholar] [CrossRef]
  20. Ogbu, C.A.; Ivanova, T.A.; Ewemoje, T.A.; Hlavsa, T.; Roubik, H. Estimating the Ecological Performance of Water and Wastewater Treatment in Africa: A Meta-Analysis. Chem. Eng. Technol. 2023, 46, 1078–1088. [Google Scholar] [CrossRef]
  21. Fang, S.; Cao, W.; Shao, Q.; Huang, W.; Wang, F.; Cheng, X.; Cao, J.; Luo, J.; Wu, Y. Reutilization of waste crawfish shell and sludge for efficient volatile fatty acids production by synchronously regulating the bioavailable substrates and microbial metabolic traits. J. Clean. Prod. 2022, 349, 131456. [Google Scholar] [CrossRef]
  22. Wang, M.; Jiang, T.; Mao, Y.; Wang, F.; Yu, J.; Zhu, C. Current Situation of Agricultural Non-Point Source Pollution and Its Control. Water Air Soil Pollut. 2023, 234, 471. [Google Scholar] [CrossRef]
  23. T/CUWA50055-2023; Standard for Carbon Reduction Assessment of Urban Wastewater Treatment Plant. China Urban Water Association: Beijing, China, 2023.
  24. T/CAEPI 49-2022; Technical specification for low-carbon operation evaluation of sewage treatment plant. China Association of Environmental Protection Industry: Beijing, China, 2022.
  25. Hua, H.; Jiang, S.; Yuan, Z.; Liu, X.; Zhang, Y.; Cai, Z. Advancing greenhouse gas emission factors for municipal wastewater treatment plants in China. Environ. Pollut. 2022, 295, 118648. [Google Scholar] [CrossRef]
  26. Lv, Z.; Shan, X.; Xiao, X.; Cai, R.; Zhang, Y.; Jiao, N. Excessive greenhouse gas emissions from wastewater treatment plants by using the chemical oxygen demand standard. Sci. China-Earth Sci. 2022, 65, 87–95. [Google Scholar] [CrossRef]
  27. Wang, D.; Ye, W.; Wu, G.; Li, R.; Guan, Y.; Zhang, W.; Wang, J.; Shan, Y.; Hubacek, K. Greenhouse gas emissions from municipal wastewater treatment facilities in China from 2006 to 2019. Sci. DATA 2022, 9, 317. [Google Scholar] [CrossRef]
  28. Zhang, Q.; Wu, Q.; Xie, Y.; Dzakpasu, M.; Zhang, J.; Wang, X.C. A novel carbon emission evaluation model for anaerobic-anoxic-oxic urban sewage treatment. J. Environ. Manag. 2024, 350, 119640. [Google Scholar] [CrossRef]
  29. Maktabifard, M.; Awaitey, A.; Merta, E.; Haimi, H.; Zaborowska, E.; Mikola, A.; Makinia, J. Comprehensive evaluation of the carbon footprint components of wastewater treatment plants located in the Baltic Sea region. Sci. Total Environ. 2022, 806, 150436. [Google Scholar] [CrossRef] [PubMed]
  30. Corominas, L.; Foley, J.; Guest, J.S.; Hospido, A.; Larsen, H.F.; Morera, S.; Shaw, A. Life cycle assessment applied to wastewater treatment: State of the art. Water Res. 2013, 47, 5480–5492. [Google Scholar] [CrossRef] [PubMed]
  31. Yang, M.; Pan, H.; Ma, X.; Zhang, Y.; Lyu, Y.; Zhang, X.; Shui, W.; Yang, Z. Energy self-sufficiency and carbon neutrality potential of Chinese urban wastewater treatment. J. Clean. Prod. 2024, 475, 143657. [Google Scholar] [CrossRef]
  32. Crini, G.; Lichtfouse, E. Advantages and disadvantages of techniques used for wastewater treatment. Environ. Chem. Lett. 2019, 17, 145–155. [Google Scholar] [CrossRef]
  33. Peng, L.; Ni, B.-J.; Ye, L.; Yuan, Z. The combined effect of dissolved oxygen and nitrite on N2O production by ammonia oxidizing bacteria in an enriched nitrifying sludge. Water Res. 2015, 73, 29–36. [Google Scholar] [CrossRef]
  34. Zhang, W.; Peng, Y.; Ren, N.; Liu, Q.; Chen, Y. Improvement of nutrient removal by optimizing the volume ratio of anoxic to aerobic zone in AAO-BAF system. Chemosphere 2013, 93, 2859–2863. [Google Scholar] [CrossRef] [PubMed]
  35. Desloover, J.; Vlaeminck, S.E.; Clauwaert, P.; Verstraete, W.; Boon, N. Strategies to mitigate N2O emissions from biological nitrogen removal systems. Curr. Opin. Biotechnol. 2012, 23, 474–482. [Google Scholar] [CrossRef] [PubMed]
  36. Campillo-Cora, C.; Fernández-Calviño, D.; Pérez-Rodríguez, P.; Fernández-Sanjurjo, M.J.; Núñez-Delgado, A.; Álvarez-Rodríguez, E.; Arias-Estévez, M.; Nóvoa-Muñoz, J.C. Copper and zinc in rhizospheric soil of wild plants growing in long-term acid vineyard soils. Insights on availability and metal remediation. Sci. Total Environ. 2019, 672, 389–399. [Google Scholar] [CrossRef]
  37. Daou, A.; Mallat, C.; Chammas, G.; Cerantola, N.; Kayed, S.; Saliba, N.A. The Ecocanvas as a business model canvas for a circular economy. J. Clean. Prod. 2020, 258, 120938. [Google Scholar] [CrossRef]
  38. Li, J.; Sun, W.; Li, M.; Linlin, M. Coupling coordination degree of production, living and ecological spaces and its influencing factors in the Yellow River Basin. J. Clean. Prod. 2021, 298, 126803. [Google Scholar] [CrossRef]
  39. Dereli, R.K.; Wang, X.; van der Zee, F.P.; van Lier, J.B. Biological performance and sludge filterability of anaerobic membrane bioreactors under nitrogen limited and supplied conditions. Water Res. 2018, 137, 164–172. [Google Scholar] [CrossRef]
Figure 1. Geographical distribution of 98 sewage treatment plants in East China.
Applsci 15 06716 g001
Figure 2. Carbon emission intensity distribution of wastewater treatment plants in East China.
Applsci 15 06716 g002
Figure 3. The proportion of carbon emissions from different sources (a) and different treatment stages (b) of sewage treatment plants.
Applsci 15 06716 g003
Figure 4. The relationship between power consumption per ton of water and carbon emission intensity.
Applsci 15 06716 g004
Figure 5. The relationship between scale and carbon emission intensity. (a) Distribution of carbon emission intensity in STPs of varying scales. (b) Distribution of power consumption per ton of water in STPs of varying scales.
Applsci 15 06716 g005
Figure 6. The relationship between operating load rate and carbon emission intensity and electricity consumption per ton of water. (a) Operating load rate vs. power consumption per ton of water. (b) Operating load rate vs. carbon emission intensity.
Applsci 15 06716 g006
Figure 7. Carbon emission intensity of different treatment processes.
Applsci 15 06716 g007
Figure 8. Distribution of COD (a) and TN (b) removal and carbon emission intensity.
Applsci 15 06716 g008
Figure 9. Carbon emission ratio of different kinds of chemicals.
Applsci 15 06716 g009
Figure 10. Relationship between influent water quality, TN and TP removal, and carbon emission intensity. (a) The relationship between influent BOD/TN and carbon emission intensity. (b) The relationship between influent COD/TN and carbon emission intensity. (c) The relationship between TN removal rate and carbon emission intensity. (d) The relationship between influent BOD/TP and carbon emission intensity. (e) The relationship between TP removal rate and carbon emission intensity.
Applsci 15 06716 g010
Figure 11. Carbon emission modification intensity and low carbon operation evaluation scores of 72 sewage treatment plants.
Applsci 15 06716 g011
Table 1. Scale distribution of WWTPs.
Design Scale/(104 m3·d−1)QuantityNumber FractionTotal Design Scale/(104 m3·d−1)Proportion of Total Design ScaleTotal Processing Scale/(104 m3·d−1)Proportion of Total Processing Scale
0~11111.2%9.72.2%6.91.9%
1~56263.3%193.943.3%147.541.5%
5~101919.4%14632.6%123.134.7%
10~2066.1%98.121.9%77.521.8%
Table 2. Process distribution of WWTPs.
Process TypeQuantityNumber FractionTotal Design Scale/(104 m3·d−1)Proportion of Total Design ScaleTotal Processing Scale/(104 m3·d−1)Proportion of Total Processing Scale
AAO6869.4%32372.1%255.572.0%
AO1313.3%37.58.4%298.2%
SBR44.1%173.8%14.24.0%
MBR22.0%15.53.5%12.13.4%
OD99.2%5211.6%42.311.9%
UCT22.0%2.70.6%1.80.5%
AAO: Anaerobic–anoxic–aerobic process; AO: Anaerobic–oxic; SBR: Sequencing batch reactor activated sludge process; MBR: Membrane bioreactor; OD: Oxidation ditch process; UCT: University of Capetown.
Table 3. Comparison of accounting boundaries across different methodologies.
Accounting CategoryIPCC 2019T/CAEPI 2022T/CUWA 2023
Pretreatment
Biological Treatment
On-site Sludge Dewatering
Off-site Pipeline Network×××
Chemical Consumption×
Biogenic CO2 Emissions×××
Fossil-derived CO2 Emissions××
Off-site Sludge Disposal×××
Notes: “√” indicates inclusion in the accounting boundary; “×” indicates exclusion. T/CAEPI 2022: Technical Specification for Low-Carbon Operation Evaluation of Wastewater Treatment Plants (T/CAEPI 49-2022) [24]. T/CUWA 2023 [24]: Assessment Standard for Carbon Mitigation in Municipal Wastewater Treatment Plants (T/CUWA 50055-2023).
Table 4. Emission factors of CH4 and N2O for WWTPs with different treatment processes.
Process TypeCH4 Emission FactorN2O Emission Factor
/(kgCH4∙kgCOD−1)/(kgN2O∙kgN−1)
AAO0.00970.0045
SBR0.00420.0276
OD0.00920.0017
AO0.00270.0115
UCT0.01800.0005
Table 5. Carbon emission factors of different chemicals.
Chemical ReagentEmission Factor EFc (kgCO2·kg−1)Chemical ReagentEmission Factor EFc (kgCO2·kg−1)
Glucose1.40Polyacrylamide (PAM)2.85
Sodium Acetate2.90Sodium Bicarbonate1.17
Methanol0.65Sodium Hydroxide0.46
Acetic Acid1.92Calcium Hydroxide1.11
Polyaluminum Chloride (based on Al3+ mass)6.19Sodium Carbonate1.46
Ferric Chloride (based on Fe3+ mass)2.86Quicklime (Calcium Oxide)1.18
Ferrous Chloride0.22Hydrochloric Acid1.20
Aluminum Sulfate0.30Citric Acid8.17
Iron Sulfate (based on Fe3+ mass)0.23Sodium Hypochlorite2.99
Magnet0.0081Sodium Chlorate5.11
Activated Carbon Powder7.96Other Chemical Agents1.60
Table 6. Basic information of four wastewater treatment plants with different treatment processes.
WWTPsDesign Scale/(104 m3·d−1)Treatment Scale/(104 m3·d−1)Treatment ProcessInfluent Water Quality (mg·L−1)Effluent Water Quality (mg·L−1)Power Consumption of per Ton Water/(kW·h/m3)
CODTNCODTN
WWTPs154.5SBR 267.243.622.210.90.290
WWTPs210.4AAO78.517.815.09.70.304
WWTPs343.4Multi-level AO311.145.316.76.50.337
WWTPs443.8OD179.533.614.17.30.198
Note: Water quality is the annual weighted average.
Table 7. Carbon emission of four wastewater treatment plants with different processes.
WWTPsFossil Source CO2 Emission Intensity/(kgCO2-eq/m3)CH4 Emission Intensity/(kgCO2-eq/m3)N2O Emission Intensity/(kgCO2-eq/m3)Power Consumption Emission Intensity/(kgCO2-eq/m3)Drug Consumption Emission Intensity/(kgCO2-eq/m3)Total Emission Intensity/(kgCO2-eq/m3)
WWTPs10.0110.0340.3750.1870.0050.613
WWTPs20.0150.0210.0150.2080.0270.286
WWTPs30.0140.0270.1850.2310.0050.462
WWTPs40.0090.0510.0190.1400.0080.227
Disclaimer/Publisher’s Note: The statements, opinions and data contained in all publications are solely those of the individual author(s) and contributor(s) and not of MDPI and/or the editor(s). MDPI and/or the editor(s) disclaim responsibility for any injury to people or property resulting from any ideas, methods, instructions or products referred to in the content.

