Article

Experimental Study of Temperature Distribution and Evolution Law of Fractured Rock Mass During Heat Transfer Process

1
Department of Mining Engineering, Taiyuan University of Technology, Taiyuan 030024, China
2
Key Laboratory of In-Situ Property-Improving Mining of Ministry of Education, Taiyuan University of Technology, Taiyuan 030024, China
*
Author to whom correspondence should be addressed.
Appl. Sci. 2025, 15(12), 6631; https://doi.org/10.3390/app15126631
Submission received: 2 May 2025 / Revised: 8 June 2025 / Accepted: 10 June 2025 / Published: 12 June 2025

Abstract

:
To investigate the hindering effect of fracture on heat transfer within rock mass, real-time temperature monitoring was conducted on fractured granite heated by different constant-temperature heat sources. The heat transfer characteristics were analyzed based on the temperature field distribution, temperature variation pattern, heating rate, temperature difference, and temperature gradient evolution within the fractured granite. Additionally, the difference in temperature field distributions of both intact and fractured granite under different heat source temperatures were discussed. The study reveals that fracture exerts significant control over temperature field distribution in granite, with heat transfer governed by the combined effects of rock heterogeneity and fracture presence. During heating, fractured granite exhibits three distinct temperature response stages: rapid heating, slow heating, and temperature stabilization. Steady temperatures decrease nonlinearly and linearly with increasing distance from the heat source on the left and right side of the fracture. All monitoring points display unimodal heating rate trends (rise–peak–decline–stabilization), with peak rates of 20~120 °C/h above the horizontal monitoring line F-F versus 10~20 °C/h below it. The hindering effect of fracture on heat transfer shows spatial heterogeneity; under the condition of the 80 °C heat source, the temperature difference in the central region is the largest (ΔTmax = 10.5 °C), and the top is the smallest (ΔTmin = 4.5 °C). Concentrated isothermal gradient contours form around fractures, with the time-to-peak gradient correlating positively with heat source distance. Maximum and minimum temperature gradients within the fracture reached 825 °C/m and 345 °C/m, respectively, at 90 °C source temperature. The research results can provide a theoretical basis and technical support for HDR geothermal development.

1. Introduction

With the continuous growth of global energy demand, the development and utilization of clean energy have become a crucial part of China’s energy strategy [1,2]. Hot dry rock (HDR) geothermal energy is a clean, renewable energy source with great development potential [3,4,5]. In the actual development of HDR geothermal resources, fractures formed by natural or artificial fracturing in reservoirs are not only the primary channels for fluid storage and migration but also the critical media for heat transfer and exchange. The temporal and spatial evolution characteristics of heat transfer and distribution in fractured rock mass are complex. Therefore, it is urgent to study the heat transfer characteristics within fractured rock mass, which is of great significance for geothermal development.
Since the 1990s, researchers have explored heat transfer mechanisms in fractured rocks through both experimental and simulation studies [6,7,8], with a predominant focus on single-fracture systems. Extensive research has demonstrated that heat transfer between flowing fluids and fractured rock masses can be described using either local thermal equilibrium (LTE) or local thermal non-equilibrium (LTNE) theories. The LTE theory assumes that the fluid and the fracture walls share the same temperature, an assumption that, while suitable for numerical simulations, deviates from real-world conditions. In contrast, the LTNE theory posits a temperature difference between the fluid and the fracture surface, with heat exchange governed by Newton’s law of cooling [9,10,11,12]. More recently, researchers have advanced the study of heat transfer in fractured rock masses by developing a range of mathematical models [13,14,15], often in conjunction with numerical simulation techniques. Specifically, Lei et al. [16] defined connectivity coefficients to quantify fracture network connectivity. They investigated the effects of fracture connectivity, discontinuity, and injection–production pressure difference on EGS extraction performance, verifying that the connected area ratio (Rs) serves as an effective indicator of fracture network connectivity levels. Jin et al. [17] employed the finite element method to study flow and heat transfer processes in fracture networks, incorporating stress-induced anisotropic aperture fields. Their analysis evaluated how different stress regimes influence thermal–fluid transport, identifying nonlinear normal deformation as the primary factor governing flow and heat transfer. Cao et al. [18] proposed a dynamic fracture aperture model accounting for thermal stresses, implementing this methodology in EGS simulations to conduct parameter sensitivity analysis of mass–heat transfer processes. Their results demonstrate that fracture geometry and dip angle significantly impact mass and heat transfer within reservoirs. Li et al. [19] introduced a method for determining the representative elementary volume (REV) of three-dimensional thermal conductivity tensors and heat transfer in fractured rock masses, examining the influence of key fracture parameters (density, disc diameter, and thermal contact resistance) on heat transfer characteristics. Zhou et al. [20] developed a two-dimensional model to investigate thermal energy transfer in fracture–rock matrix systems, evaluating the spatiotemporal temperature distribution. Their findings reveal that lateral heat conduction within the rock matrix is a critical parameter governing the spatiotemporal temperature evolution in both fractures and rock matrices.
In studies examining the influence of rock fractures on fluid flow and heat transfer, scholars typically focus on factors like fracture quantity [21], surface roughness [22,23,24], and contact ratio [25,26], among others. Additionally, in a pioneering study in 2000, Brown [27] introduced the concept of utilizing supercritical CO2 as a heat transfer fluid for geothermal exploitation. In recent years, supercritical CO2 has been extensively studied due to its advantageous properties, such as a high density-to-viscosity ratio, greater compressibility, and lower salt solubility, making it a promising candidate for heat transfer and CO2 storage in deep reservoirs [28,29,30]. Song et al. [31] developed a mathematical model to quantitatively assess heat transfer efficiency and conducted a comparative analysis of the heat transfer efficiencies of supercritical CO2 and water. Xu et al. [32] analyzed the superior heat extraction efficiency of supercritical CO₂ compared to water, summarized research advances in CO₂ geothermal systems, CO₂-enhanced geothermal systems (CO₂-EGS), and CO₂ plume geothermal systems (CPGS), and identified their prevailing technical challenges. Additionally, Zhang et al. [33] performed a comparative study of the variations in average outlet temperature and heat extraction rates of three heat transfer fluids—H2O, supercritical CO2, and N2O—along with an analysis of temperature distribution on fracture surfaces under different experimental conditions.
In summary, current research on the heat transfer of fractured rock, on the one hand, is advanced through theoretical derivation and laboratory experiments of the heat transfer process of single fractured rock after injection of fluid and then summarizes its convective heat transfer characteristics from two aspects of linear seepage or nonlinear seepage. On the other hand, the numerical model of the geothermal reservoir with a complex fracture network is constructed to study its heat transfer capacity. Previous studies mainly focused on the influence of fracture structure characteristics on fluid flow and heat transfer, while the exploration of the dynamic evolution of the temperature field and the hindering effect of the fracture in the heat transfer process of fractured rock is limited. Therefore, in this study, by conducting the heat transfer test of granite containing the fracture, the temperature and temperature gradient at each monitoring point inside of the fractured granite were measured experimentally by using a multi-channel data acquisition instrument. On this basis, the variation laws of temperature and temperature gradient inside of the fractured granite, as well as the influence of the fracture on the heat transfer of granite, were explored. The research findings can enrich and enhance the heat transfer laws of fractured rock mass, providing a theoretical basis and technical support for geothermal development.

2. Test Overview

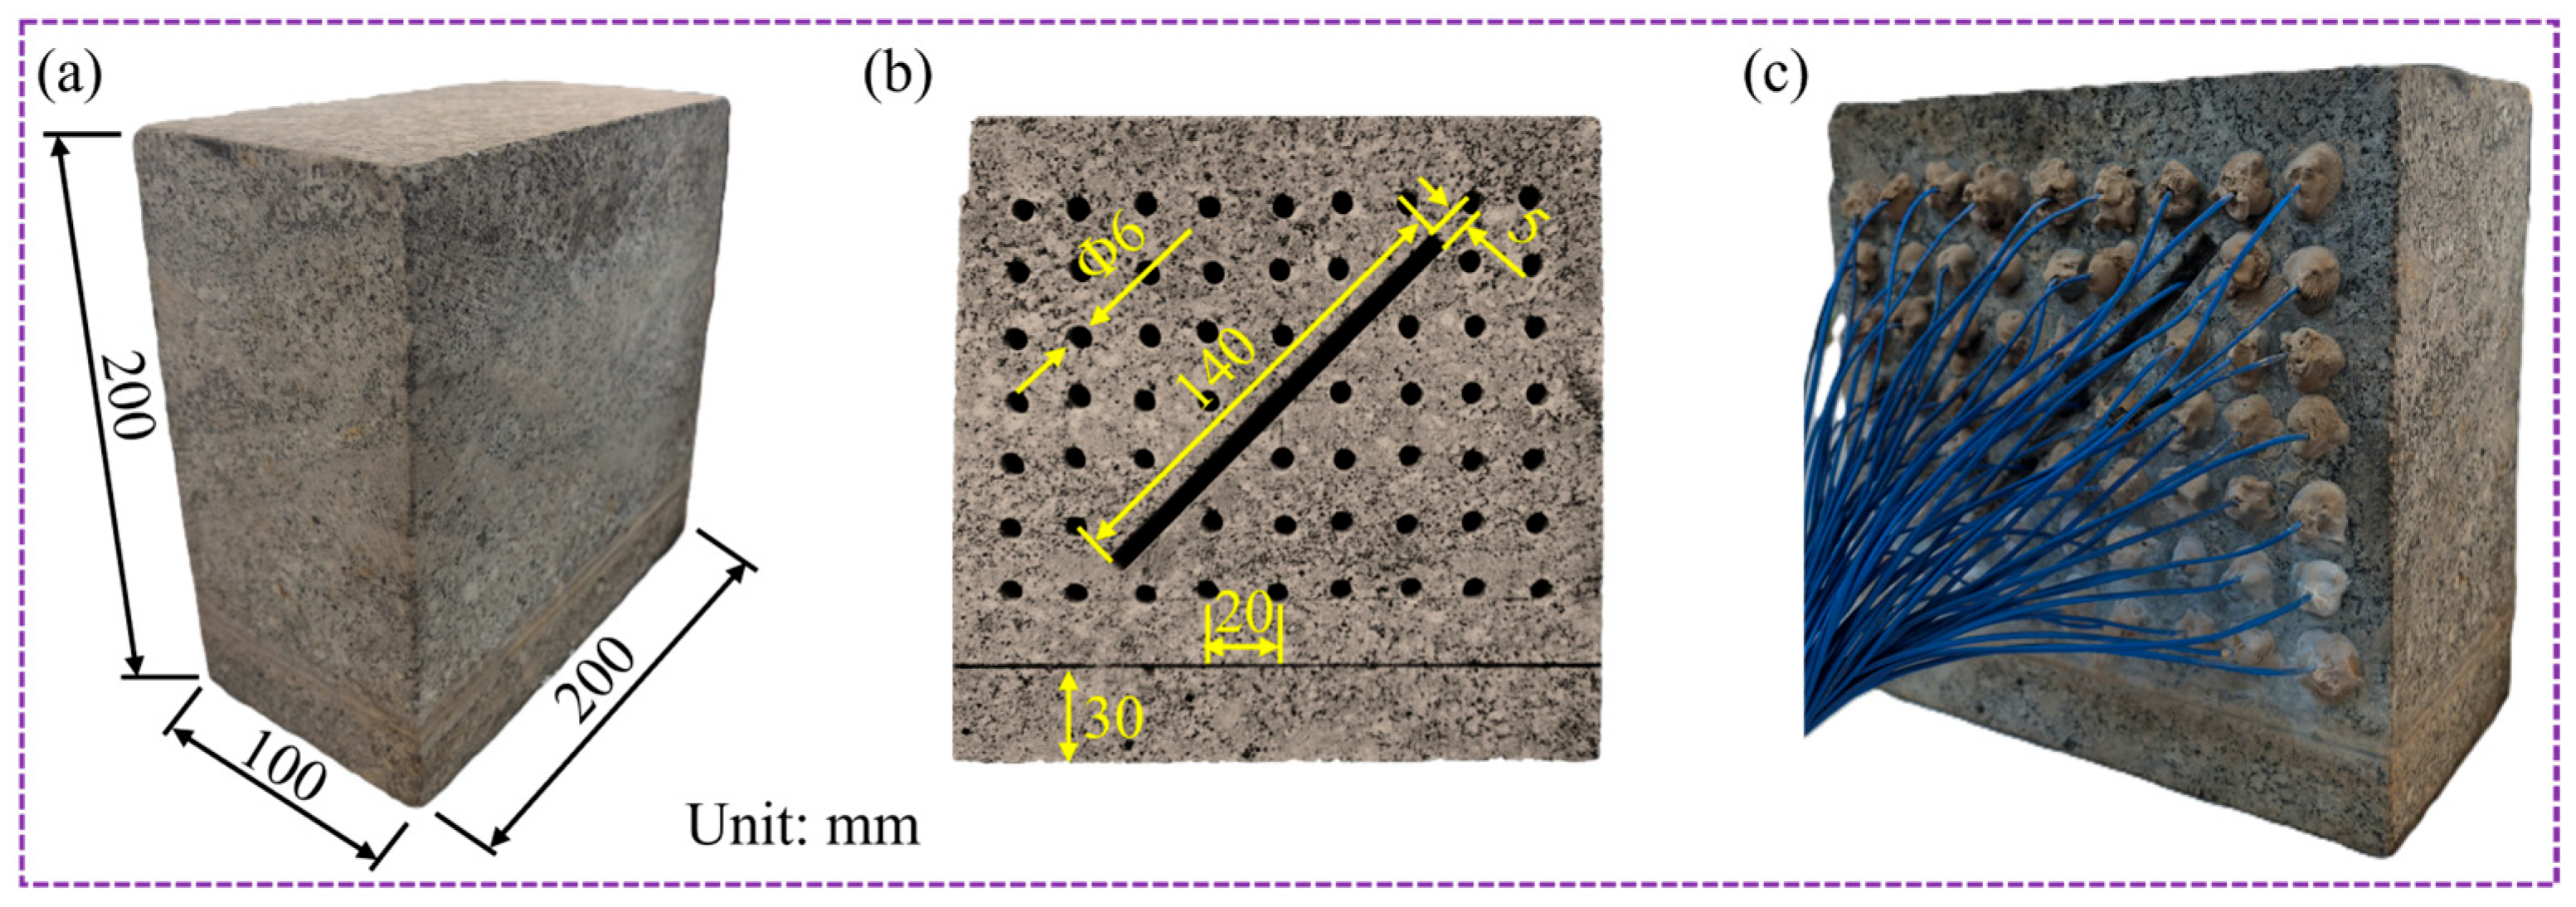
2.1. Specimen Preparation

Geothermal resources predominantly comprise two types: HDR systems in deep geological formations with essentially no inherent fluid and hydrothermal reservoirs. HDR reservoir lithologies typically consist of granitic or metamorphic rocks [4,34]. In this study, granite collected from the late Indosinian strata exposed in the eastern part of the Gonghe Basin, Qinghai Province was used for experiments. The main mineral compositions and contents of the granite were identified through XRD analysis, as presented in Table 1.
The granite sample was prepared into a cuboid specimen measuring 200 mm × 200 mm × 100 mm, and the surface of the specimen was polished to ensure its smoothness (Figure 1a). A penetrating fracture measuring 140 mm in length, 5 mm in width, and 100 mm in depth, with an inclination angle of 45°, was prefabricated in granite using the high-pressure water jet cutting method. Subsequently, a total of 58 temperature-monitoring holes with a diameter of 6 mm were drilled on the surface of the granite. The drilling depth was maintained at 30 mm. The longitudinal and transverse spacing between the hole and the center of the hole was 20 mm (Figure 1b). After the prefabricated fracture and drilling were completed, temperature sensors needed to be installed in them, as shown in Figure 1c (specific details are described in Section 2.3.1). During the test, the height of the heating area of the specimen immersed in water was 30 mm.

2.2. Test Equipment

The test equipment is shown in Figure 2. The heat source equipment adopted a rock thermal shock fracture test bench, with an effective volume size of 600 mm × 600 mm × 550 mm. The test bench offers a constant heat source ranging from room temperature to 350 °C, with a temperature control accuracy of ±0.5 °C, a temperature uniformity of ±1 °C, and a good thermostatic heating effect. The heat source temperature accuracy, affected by its uniformity and controller performance, was determined to be ± 2% through multiple measurements and calculations.
The TOPRIE-TP9000 multi-channel data acquisition instrument was utilized in experimental data acquisition equipment. This instrument is capable of simultaneously collecting 64 temperature data points, with a temperature measurement accuracy that can reach ±0.1 °C. The temperature sensor employs K-type temperature sensors to gather temperature data from all monitoring points on the granite specimen throughout the test. The sensors monitoring the granite’s internal temperature exhibit an accuracy of ±0.3%, while the system’s thermal insulation accuracy is ±3%. Consequently, using Equation (1), the maximum experimental uncertainty for fractured granite ( T r ) is calculated as 3.62%
U T r T r = 1 T r T r T h   U T h   2 + 1 T r T r T dr   U T dr   2 + 1 T r T r T s U T s 2 1 / 2
where U is the uncertainty and the subscripts r, h, dr, and s stand for rock, heat source, and data recorder, respectively.

2.3. Test Methods and Procedures

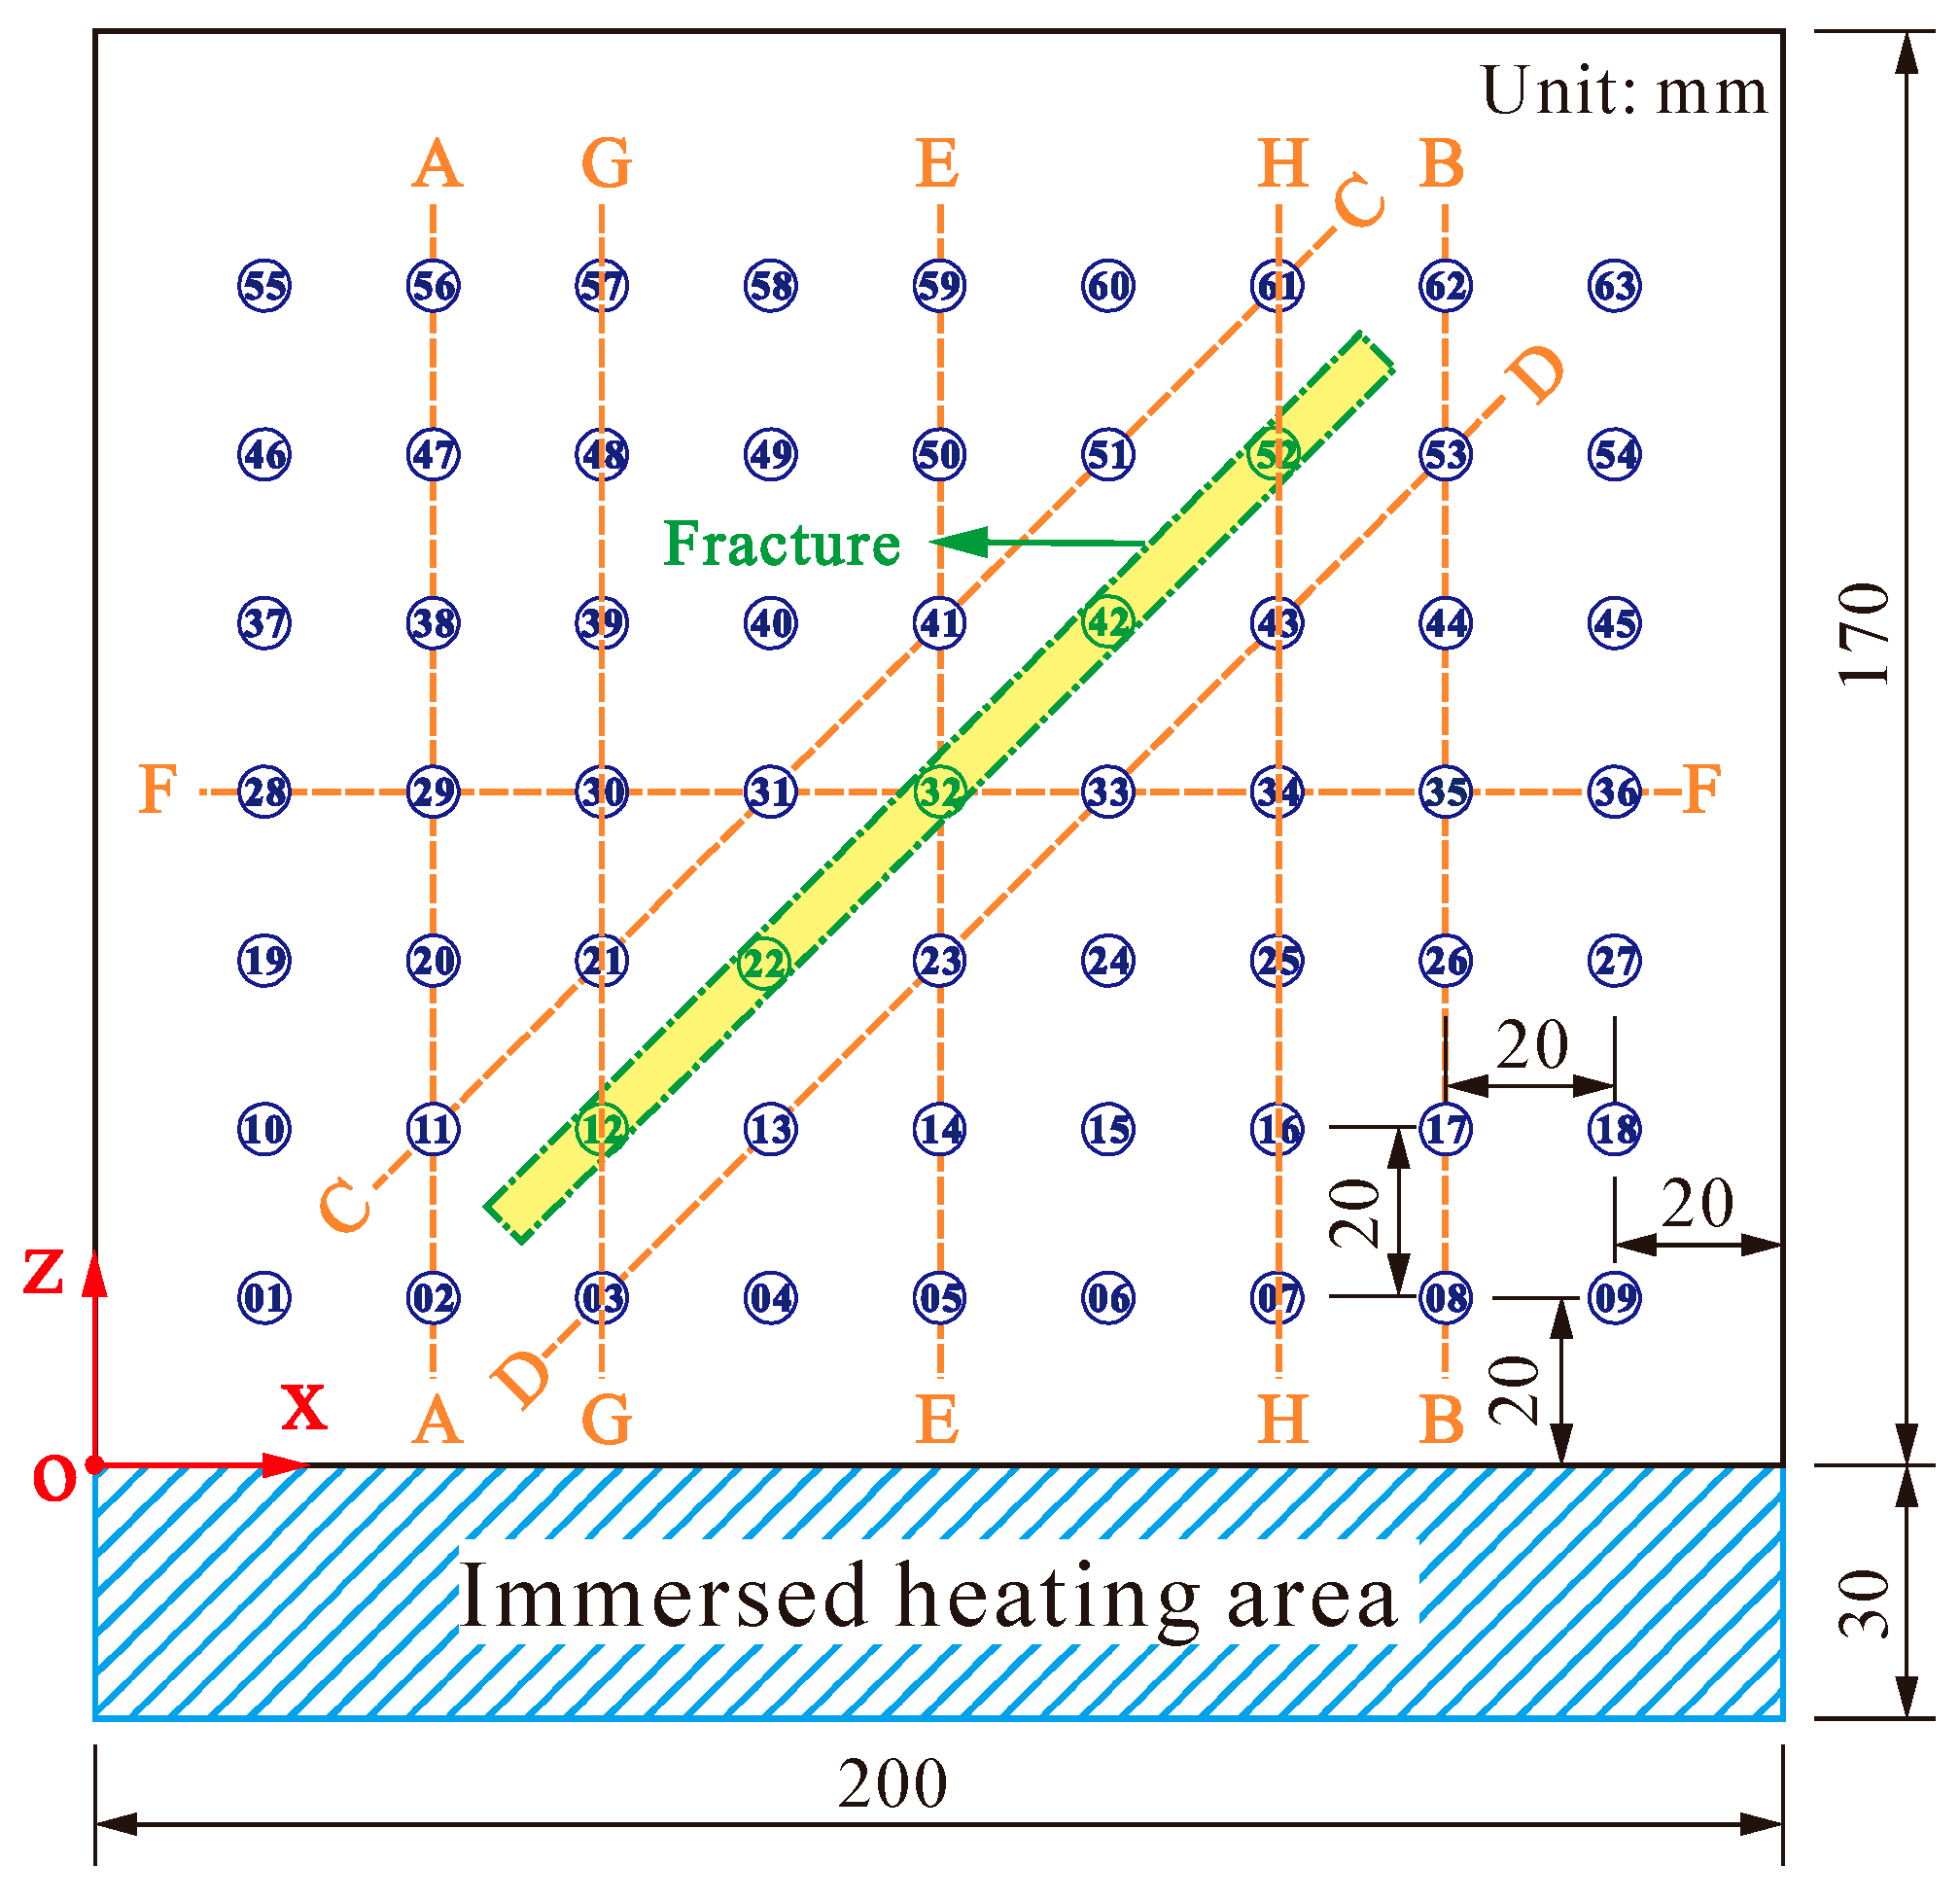
2.3.1. Temperature Sensors’ Installation

The temperature sensor was placed at the bottom of the hole, and then aluminum powder was added to the hole to fill the remaining space in the hole. The purpose of adding aluminum powder is to quickly and accurately transfer the temperature at the bottom of the hole to the temperature sensor. Subsequently, the aluminum powder was compacted. Finally, the hole was sealed with high-temperature-resistant cement at the orifice. We completed the embedding of all temperature sensors sequentially. To isolate the indoor air, the high-temperature-resistant heat insulation adhesive was used to seal the front and rear opening surfaces of the penetrating fracture.

2.3.2. Constant Temperature Heat Source Heating

Taking the heat source temperature of 60 °C as an example, the target temperature was set to 60 °C by the heating control panel in Figure 2d. After the temperature reached the preset temperature, the circulating pump was initiated, and the data recorder was opened. The fractured granite specimen was placed on the bracket to ensure that the specimen’s preset heating area was completely submerged by water. To minimize the impact of hot gas on the surrounding area of the specimen, the lightweight insulation foam board was placed on the water’s surface. The indoor temperature ( T i ) was set to 25 °C through air conditioning. In order to ensure that the rock sample could achieve a stable heat transfer state, based on multiple pre-experiments, we set the heating time to 9 h. After the test, the specimen was removed from the test bench and placed in a ventilated, dry environment to be restored to room temperature through natural air drying. Based on the above test process, the heat transfer characteristics of fractured granite under different heat source temperatures could be studied by adjusting the preset temperatures of the heating control panel in Figure 2d to 70 °C, 80 °C, 90 °C, and 100 °C, respectively.

2.3.3. Data Acquisition and Processing

As shown in Figure 3, the lower left corner of the fractured granite was set as the coordinate origin, with the horizontal rightward direction designated as the x-axis and the vertical upward direction as the y-axis. According to the specific position of the temperature sensor inside of the fractured granite, the corresponding x and y coordinate values were assigned. In order to illustrate the effect of the fracture on the heat transfer of granite, five vertical monitoring lines (A-A, B-B, E-E, G-G, H-H), one horizontal monitoring line (F-F), and two oblique monitoring lines (C-C, D-D) in Figure 3 are selected in this paper; combined with five monitoring points in the fracture, a comprehensive analysis is performed to reveal the heat transfer characteristics within the fractured granite.

3. Results and Discussion

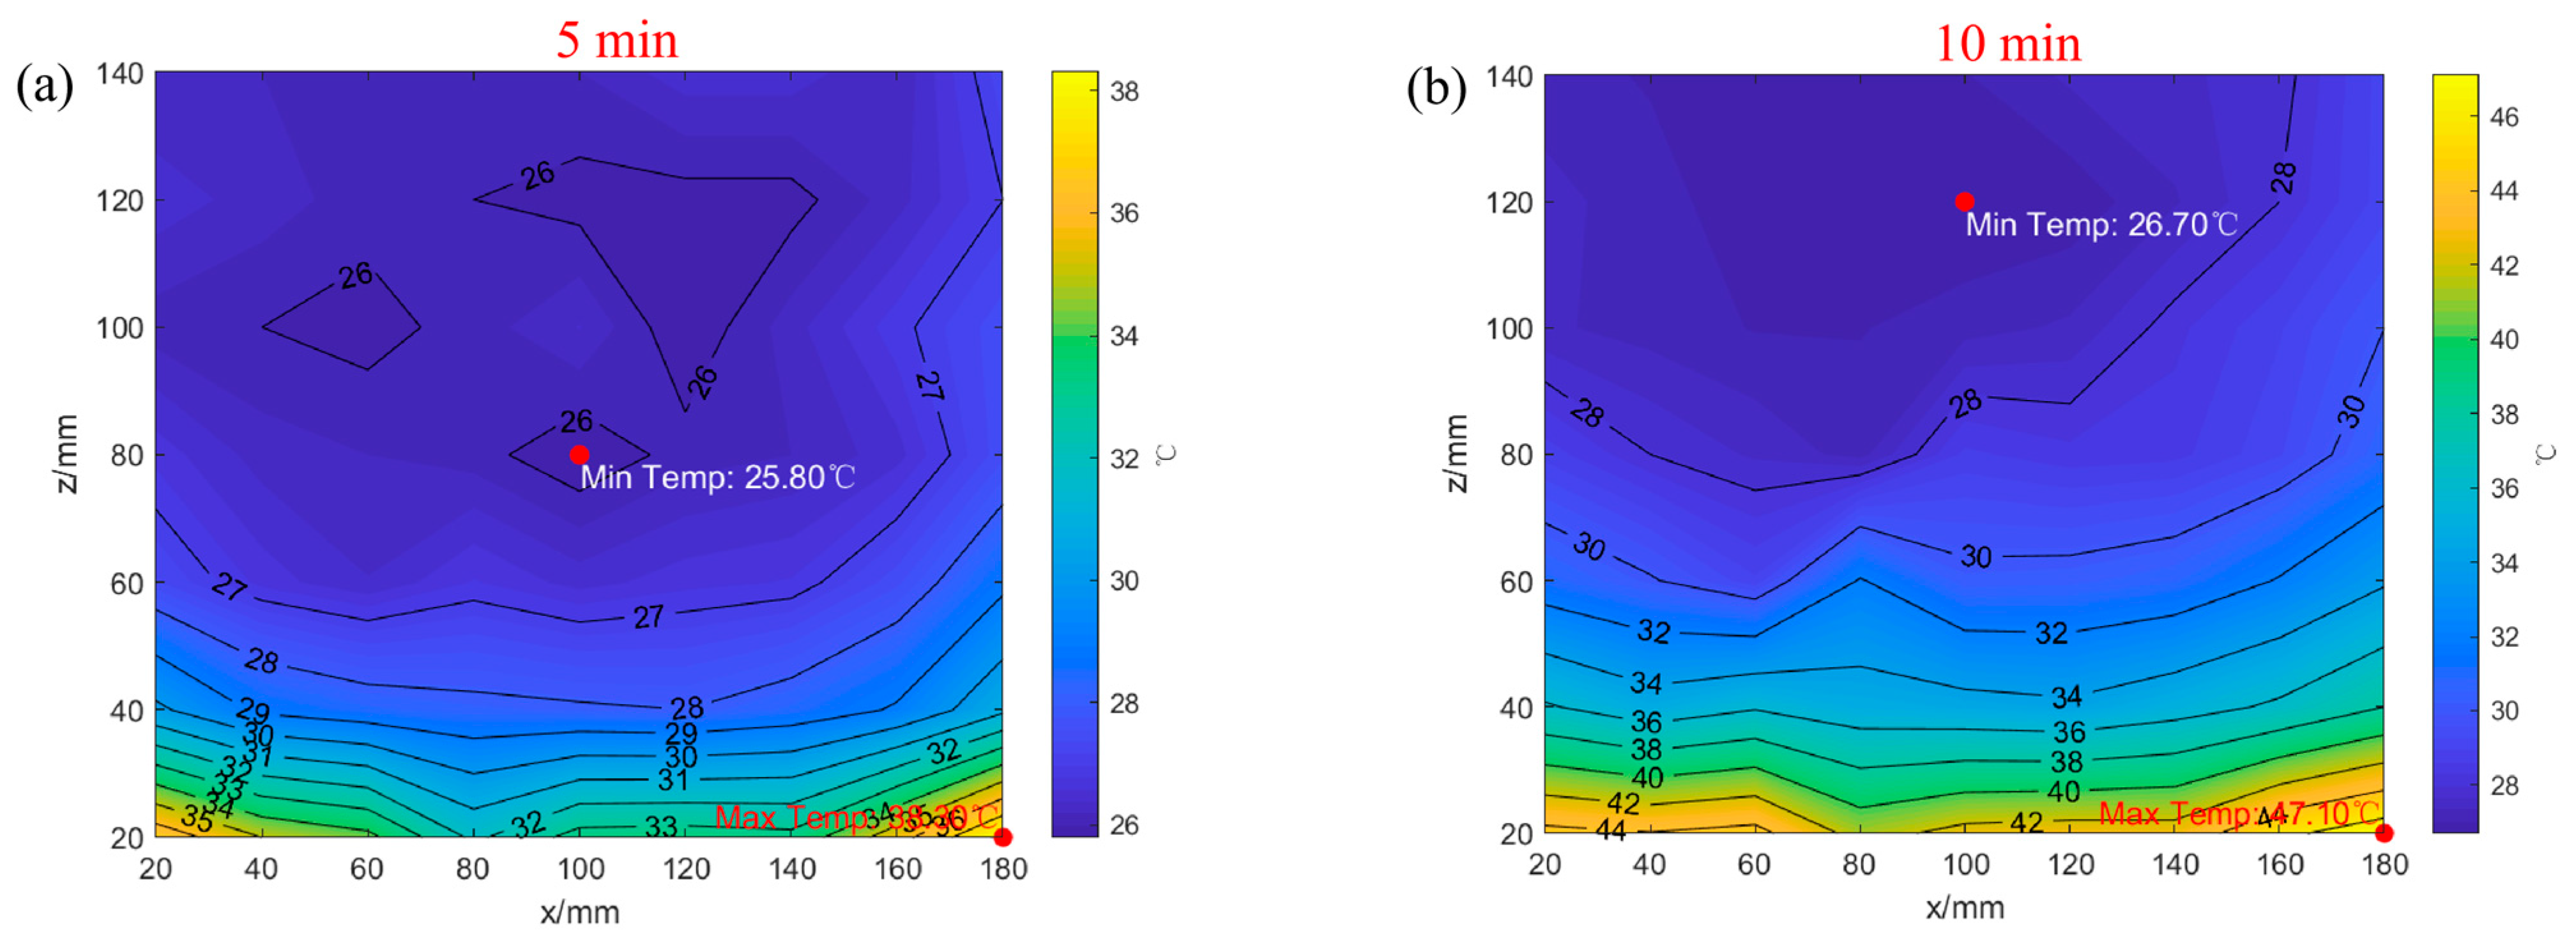
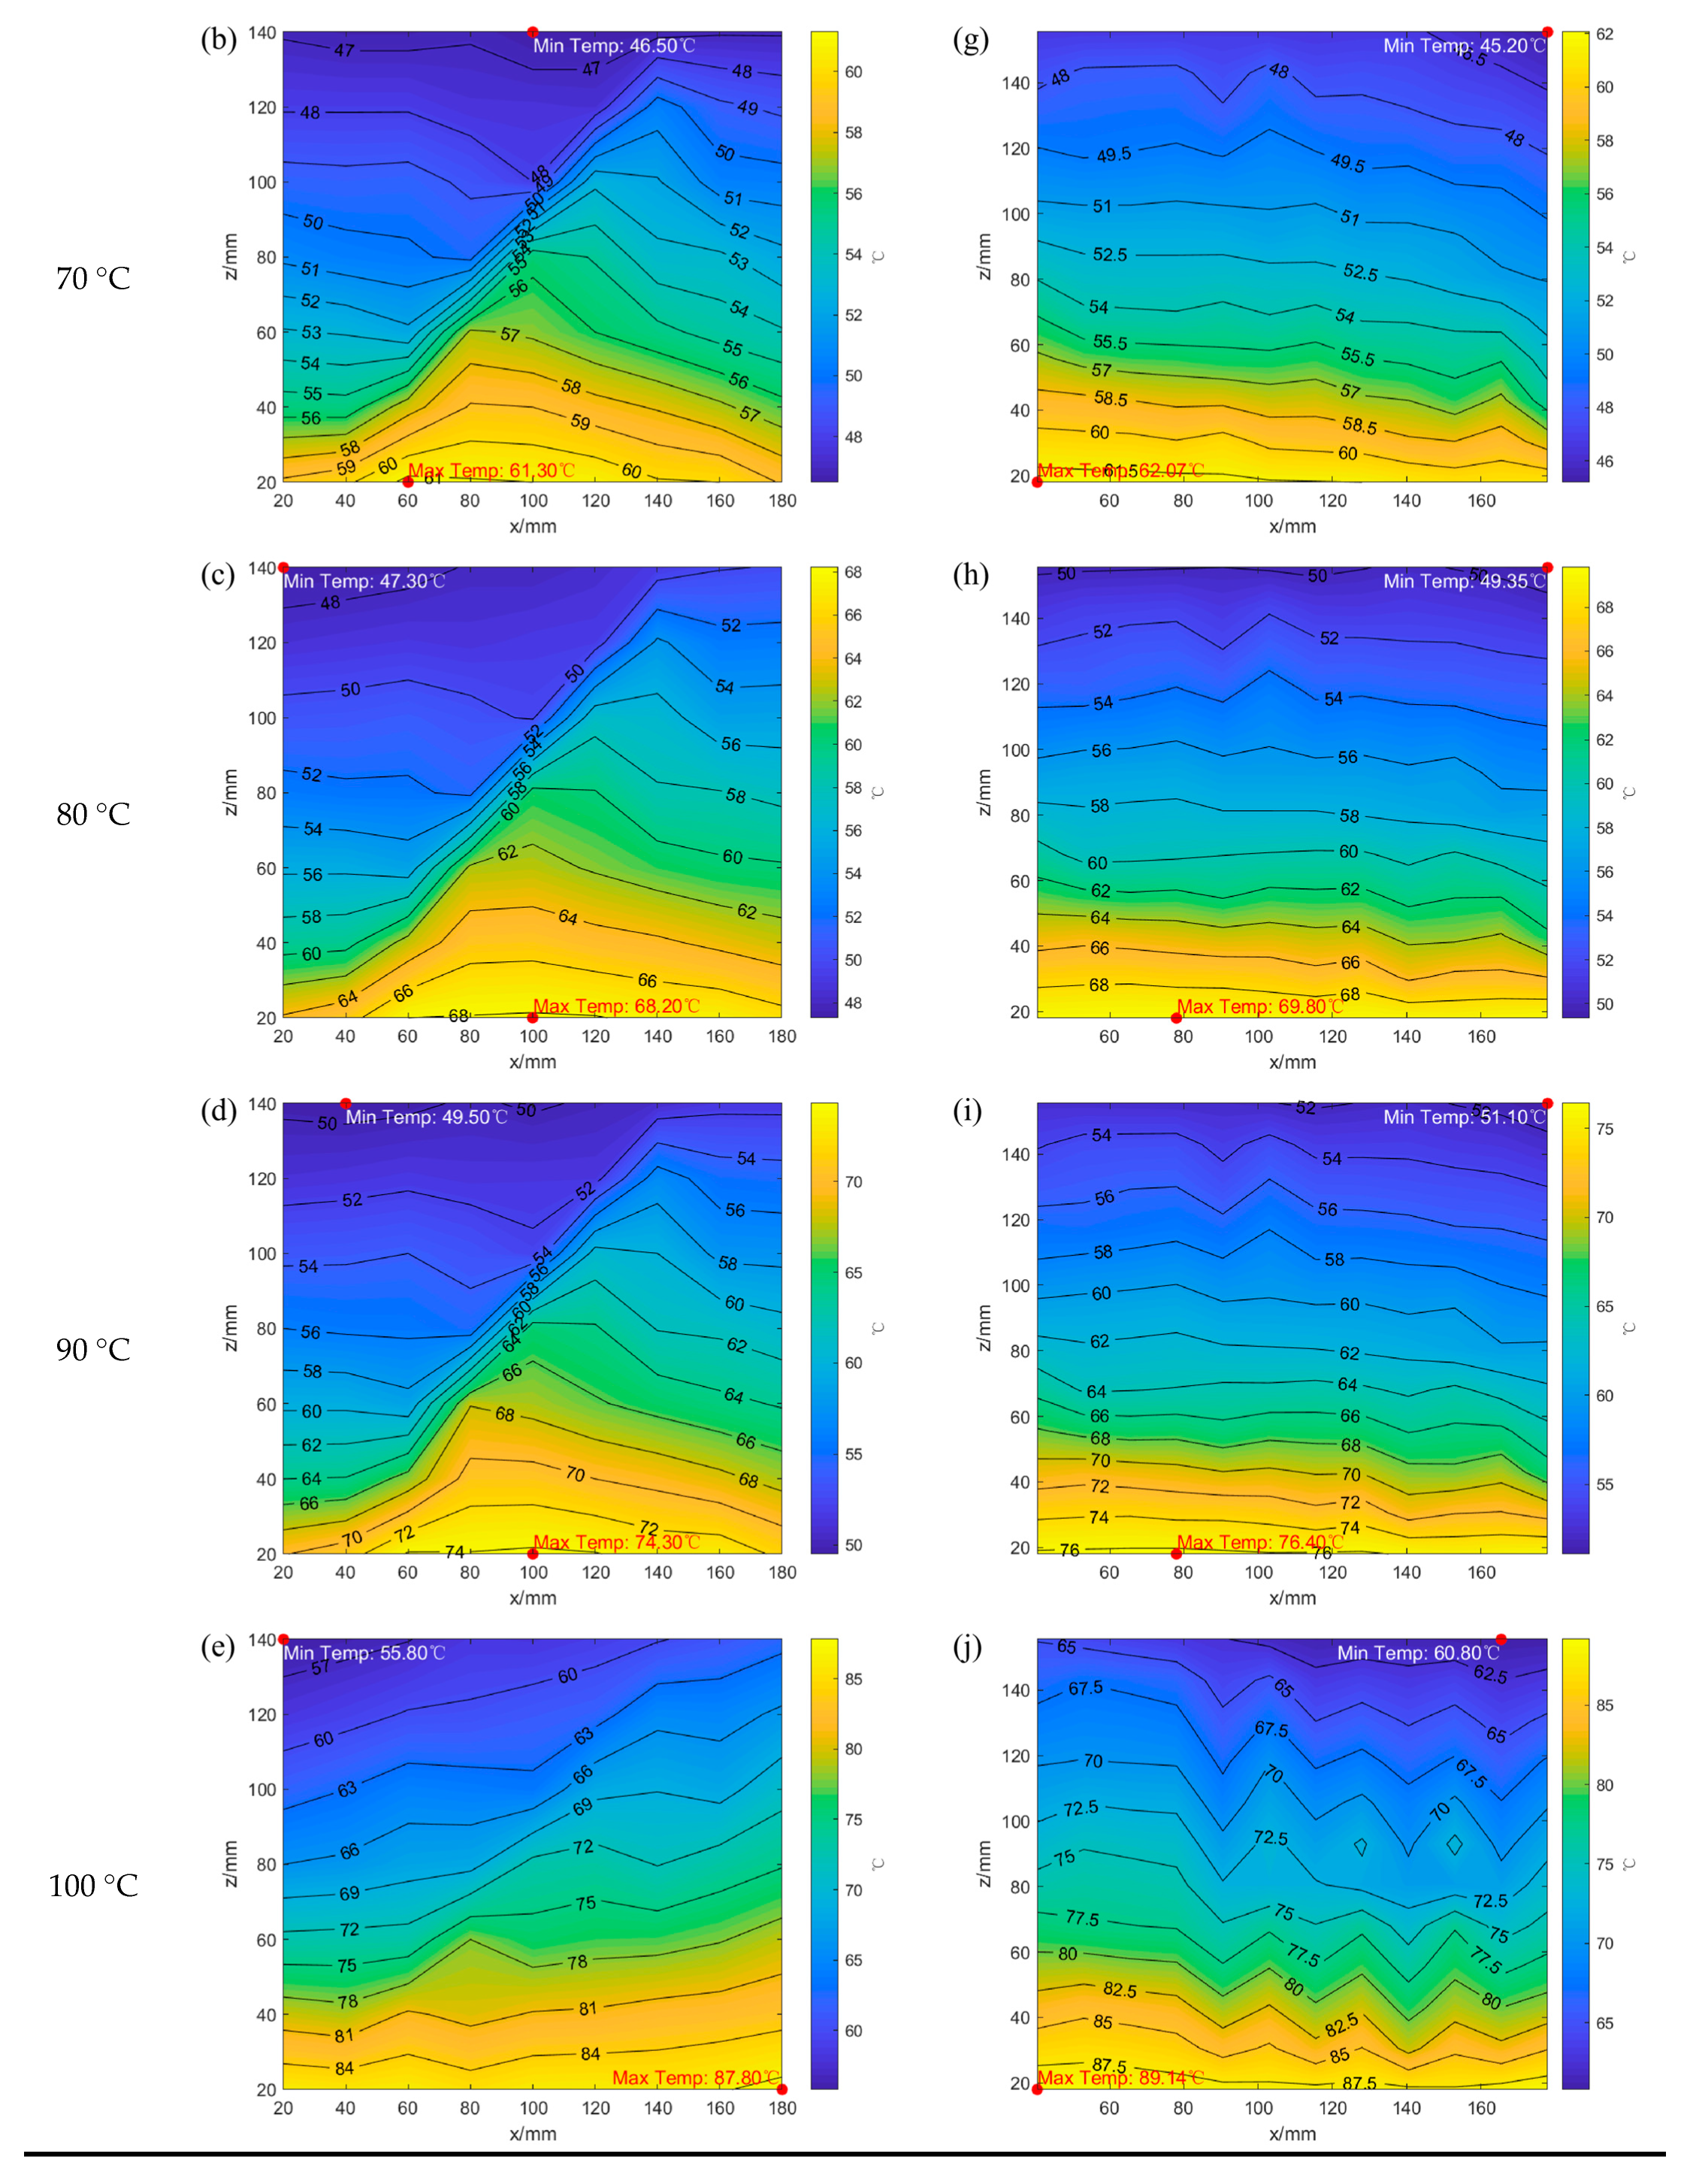
3.1. Distribution of Temperature Field in Fractured Granite

To gain an intuitive understanding of the heat transfer process in fractured granite, cloud diagrams illustrating the temperature field distribution in fractured granite were drawn. The temperature field distribution of the fractured granite at various times under a heat source temperature of 80 °C is shown in Figure 4.
It can be seen from Figure 4 that during the initial 10 min, although the isolines are horizontally distributed overall, there are still temperature fluctuations and cusps at the same distance from the heat source ( d h ). This phenomenon can be attributed to the fact that despite the granite being structurally uniform as a whole, in reality, its interior is a polycrystalline composite structure formed by quartz, feldspar, mica, and other crystals, so there is a significant inhomogeneity within the granite, which eventually causes local temperature fluctuations. At 35 min, the shape of the temperature contour undergoes a significant change, which is mainly attributed to the interference of the fracture. Due to the existence of the fracture, the temperature distribution cloud map gradually shows that the temperature on the lower side of the fracture is higher than that on the upper side. After 60 min, the shape of the temperature contour map tends to stabilize, and only the numerical value shows a gradual increase. In summary, the inherent heterogeneity of granite and the fracture’s presence significantly influence the temperature field’s shape and spatial distribution.
Regarding the impact of the fracture on the distribution of the temperature field in granite, the fracture does not yet affect the temperature field distribution at 5 min. At 10 min, the lower-left corner of the fracture begins to affect heat transfer within the granite slightly. At 35 min, the impact of the fracture on heat transfer in granite is significantly enhanced, which is specifically reflected in the heat concentration in the region of 40~180 mm in the x-direction. This is due to the low thermal conductivity of air in the fracture, which impedes the rapid upward transfer of heat along the vertical direction and eventually leads to the significant difference in the distribution of the internal temperature field of the granite between the two sides of the fracture. At 60 min, the heat accumulation phenomenon in the 40 to 120 mm area in the x-direction is further intensified. After 60 min, the heat concentration at the lower side of the fracture in this area continues to exist.

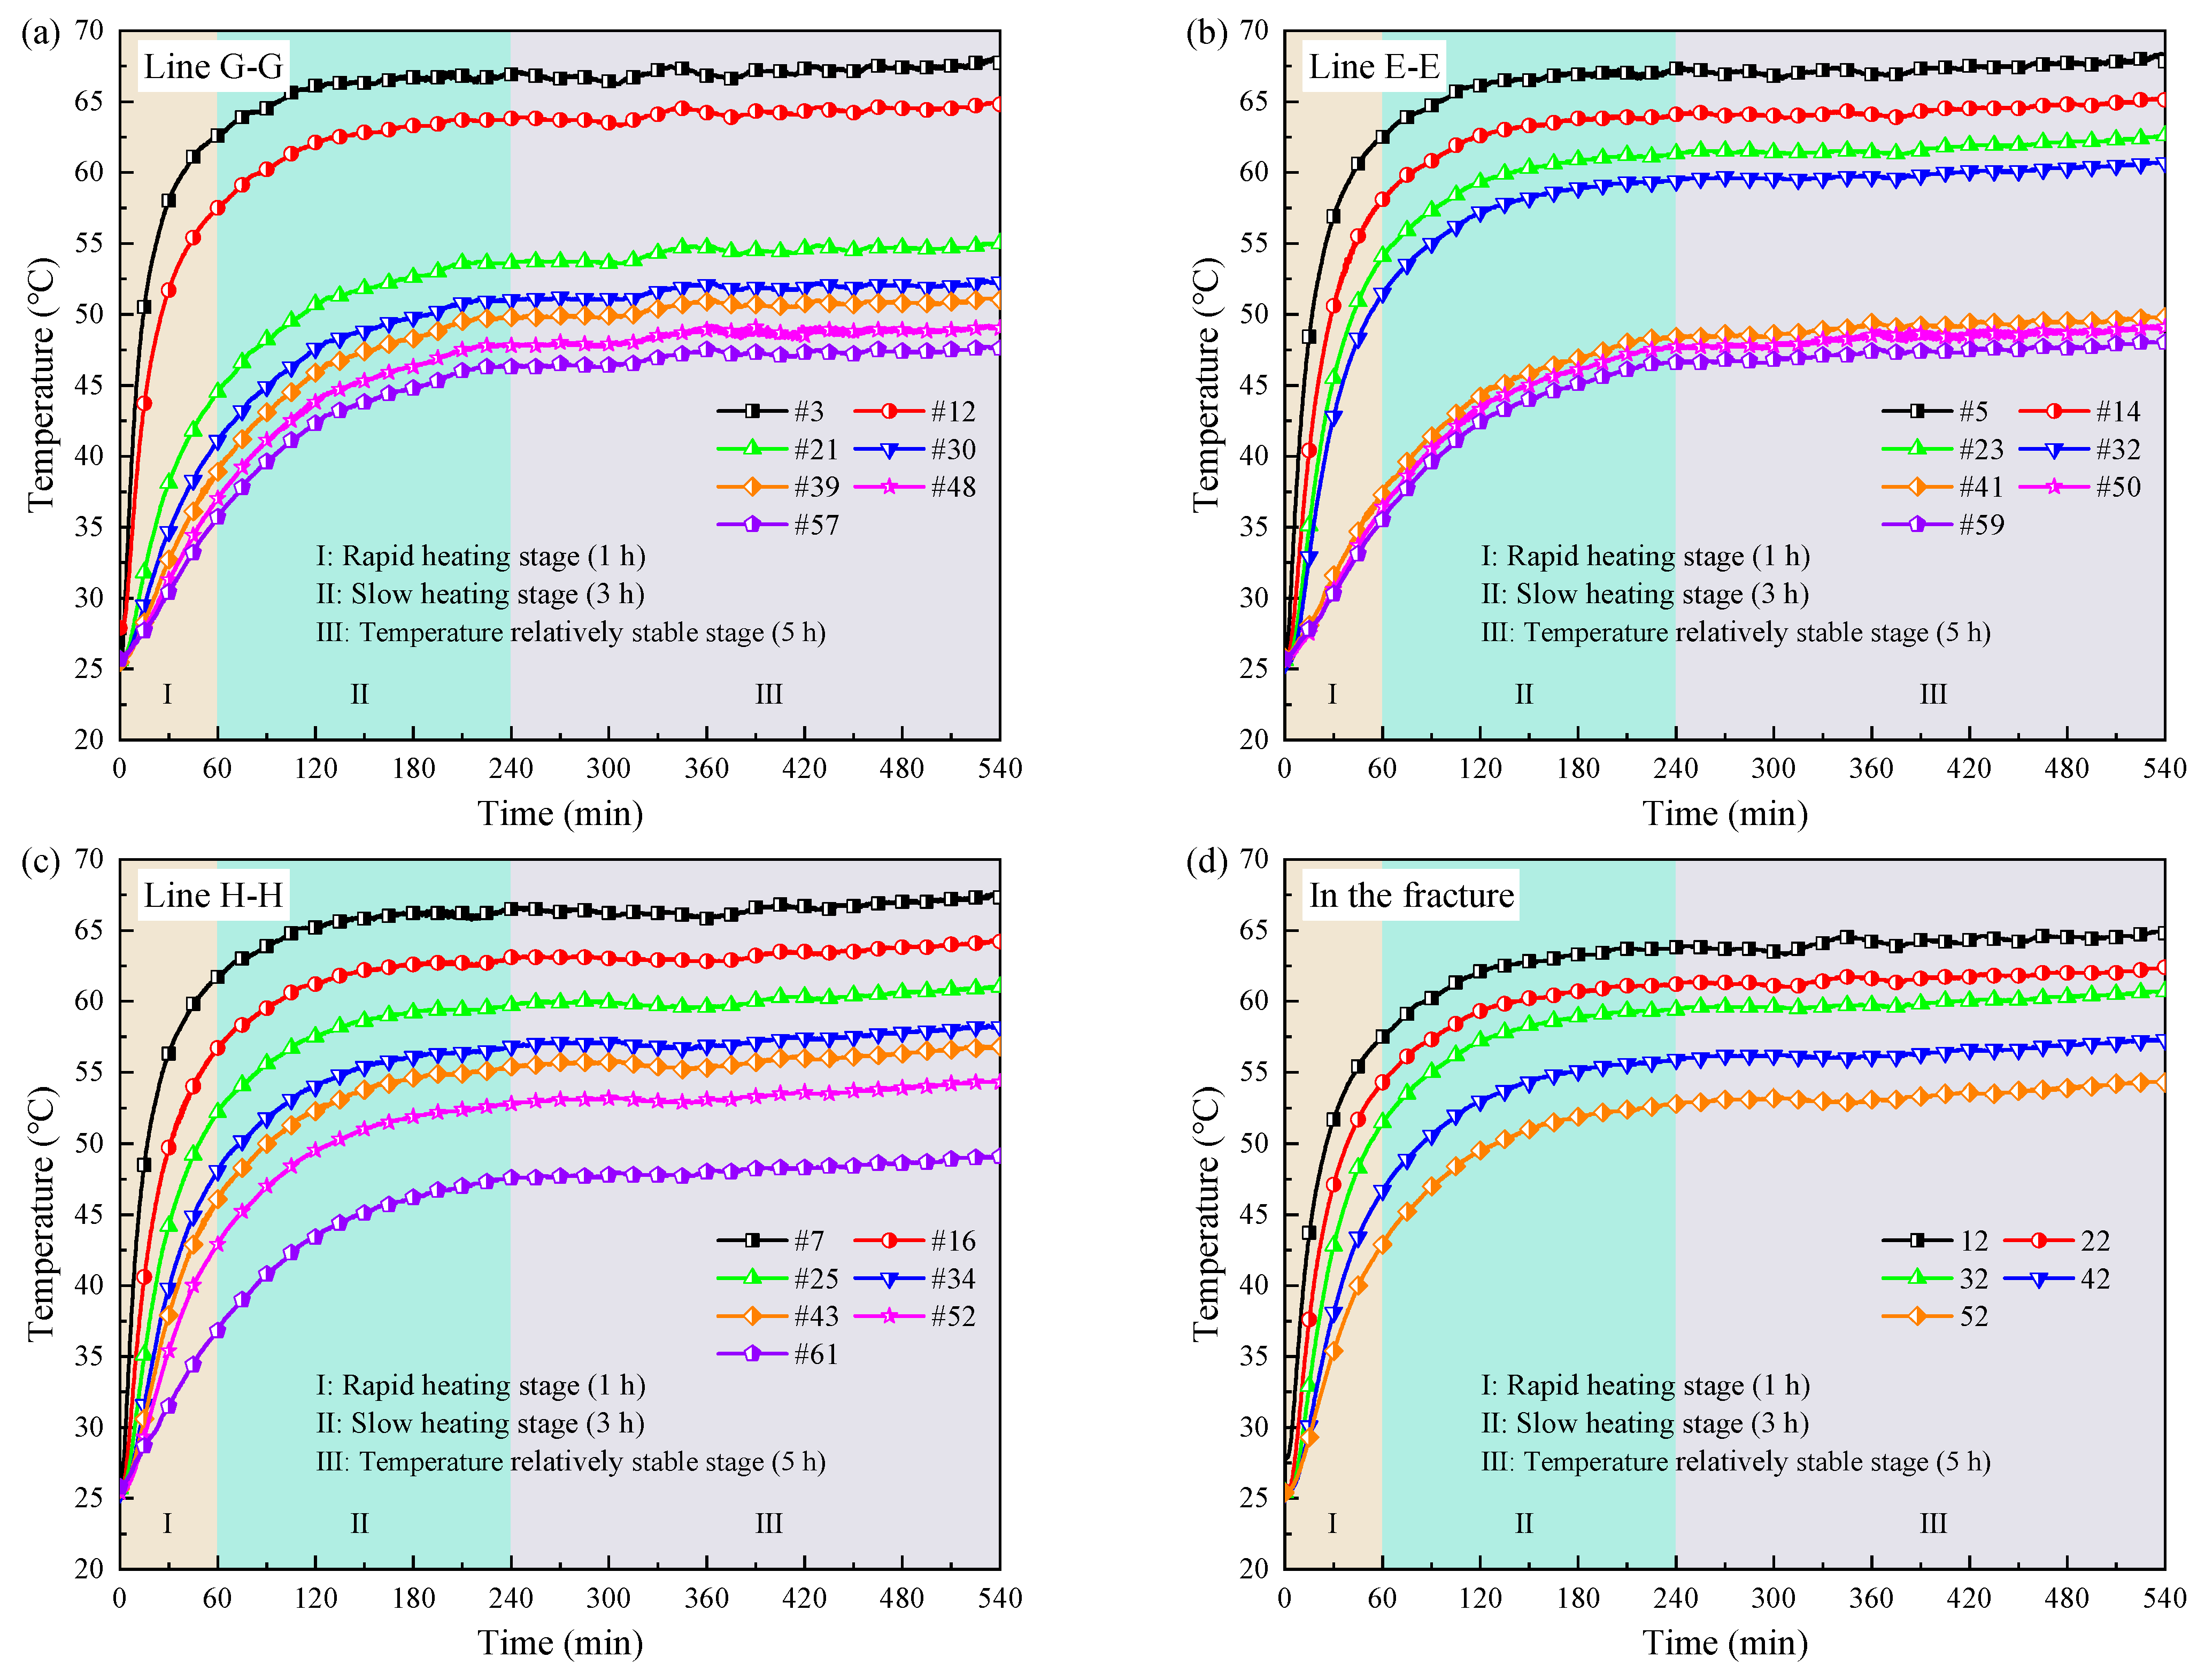
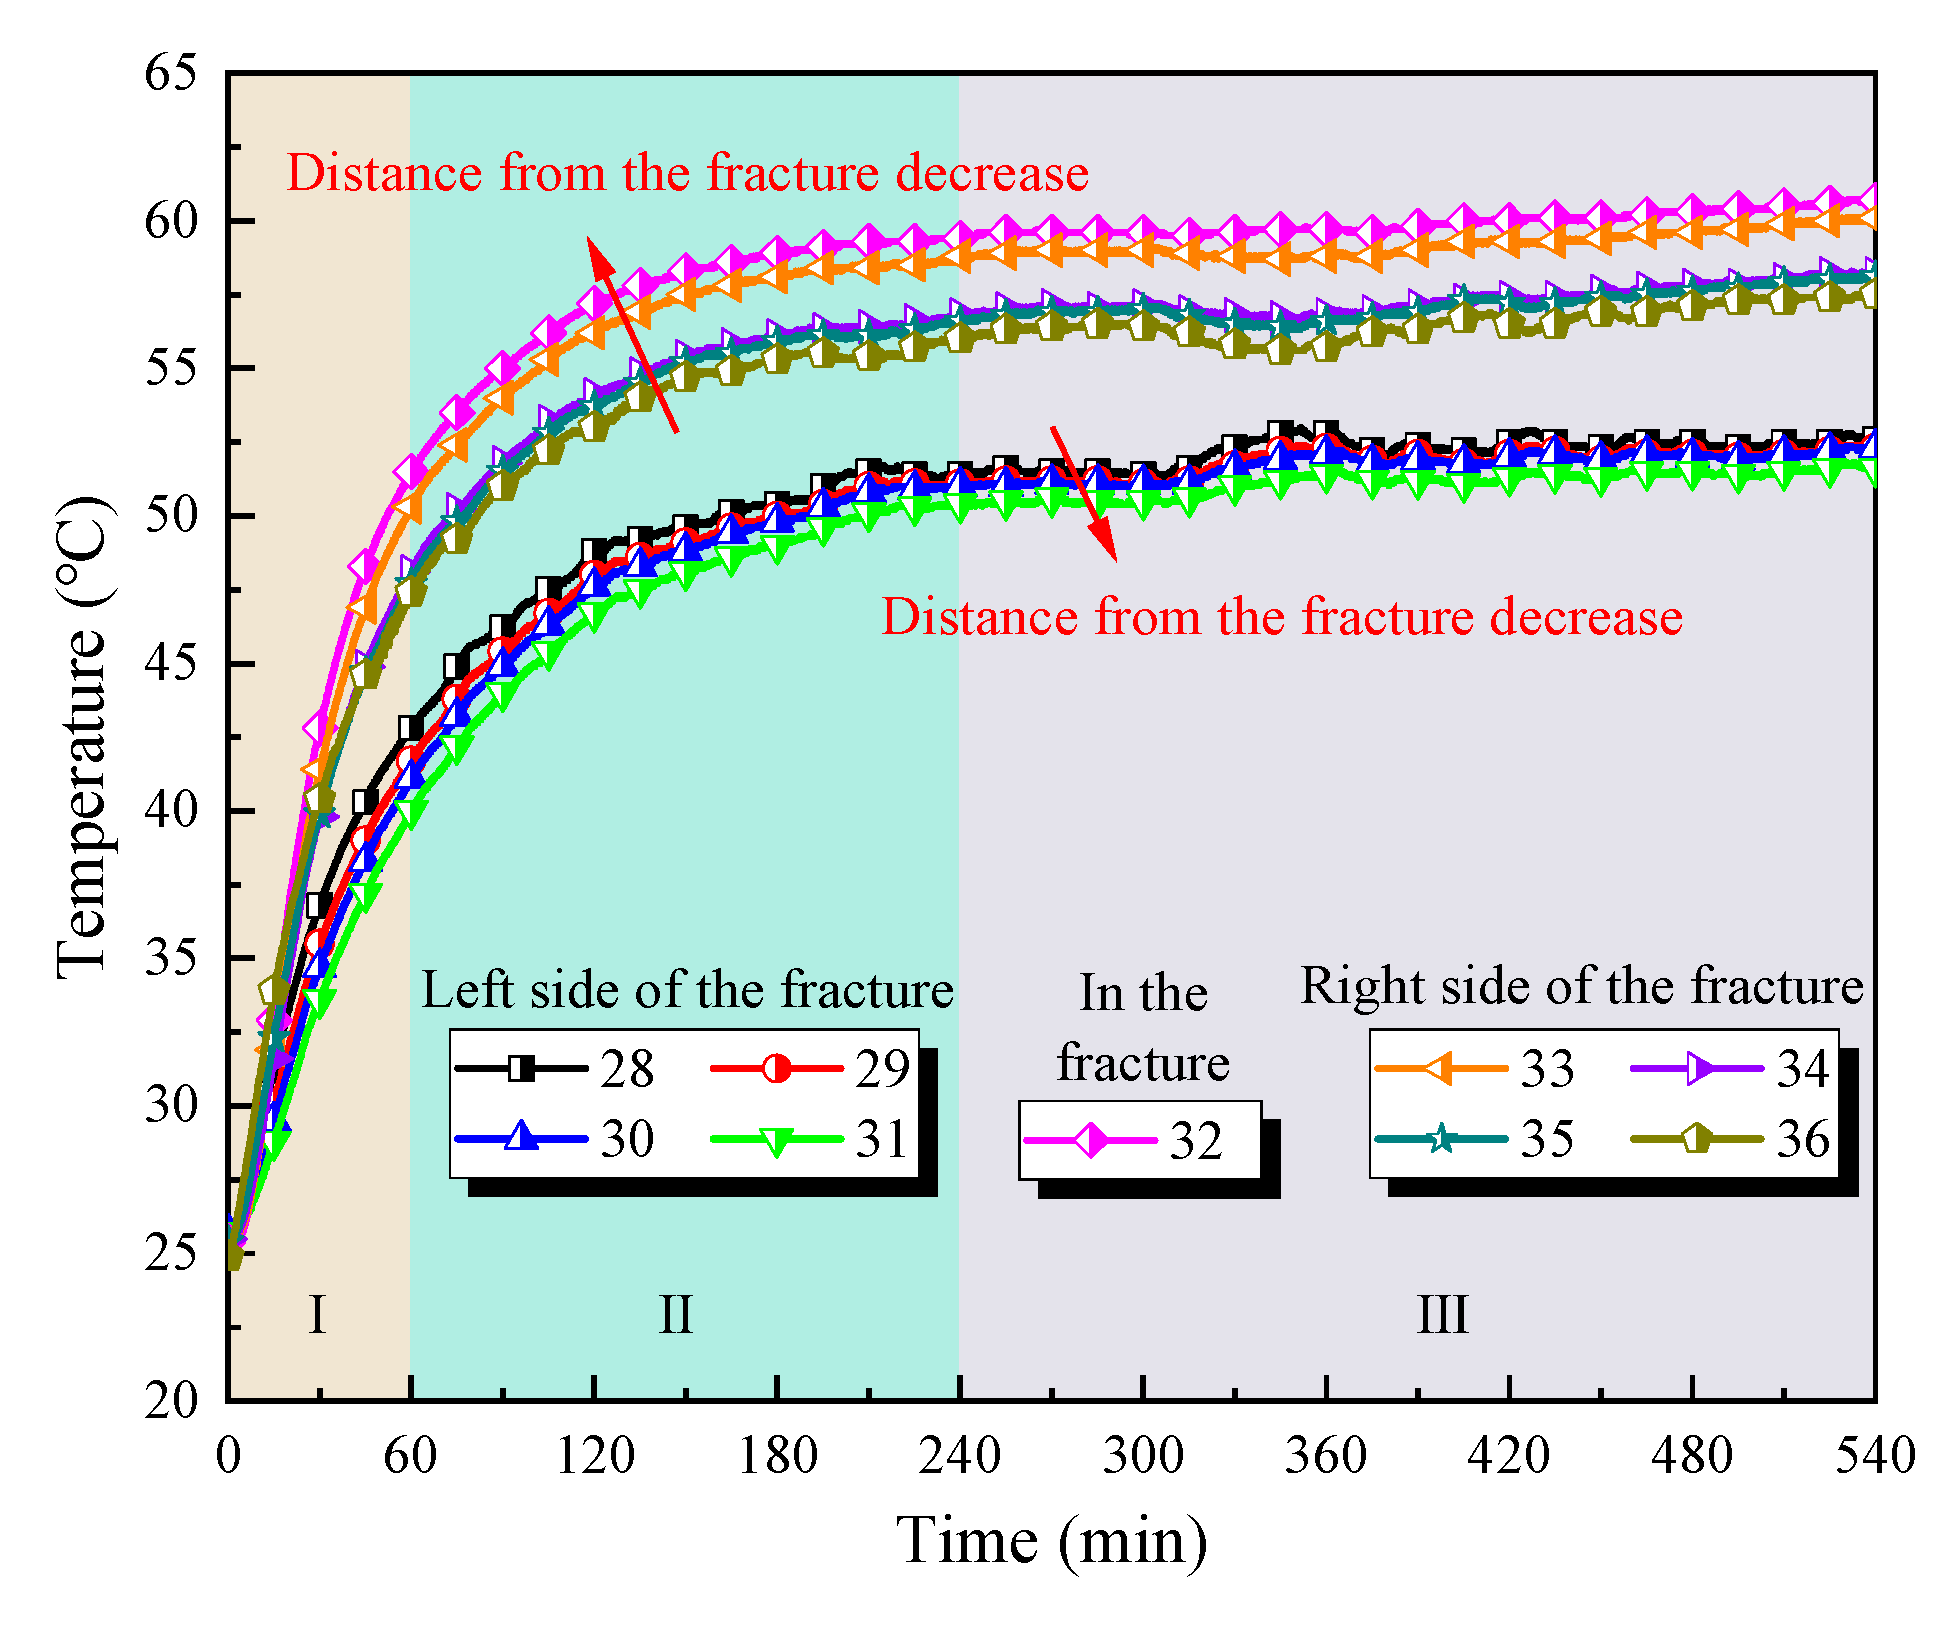
3.2. Variation Patterns of Temperature at Monitoring Points

Figure 5 illustrates the temperature variations of monitoring points on lines G-G, E-E, and H-H and in the fracture over time under 80 °C heat source heating. Based on Figure 5, it is evident that during the heating process, the temperature of each monitoring point undergoes three primary stages: (1) a rapid heating stage (Ⅰ), which takes a short time but has a large heating range and lasts for approximately 1 h; (2) a slow heating stage (Ⅱ), which lasts for about 3 h and experiences a gradual transition from unsteady heat conduction to steady heat conduction; and (3) a temperature stabilization stage (Ⅲ), the temperature is relatively stable in this stage, with the temperature essentially unchanged. Further observation of the curve reveals that the temperature from the monitoring points below the fracture (e.g., 3#, 23#, and 43#) compared to those above the fracture (e.g., 21#, 41#, and 61#) has dropped sharply. This indicates that the fracture has significantly impeded heat transfer in the granite. The temperature at monitoring points 12#, 32#, and 52# in the fracture is nearly the same as that of the points below the fracture, yet it significantly differs from the temperature of the points above it.
The presence of the fracture significantly influences the temperature distribution in granite. To further study the steady temperature distribution characteristics around the fracture in granite, Figure 6 illustrates the curves of the steady temperature of the monitoring points on different monitoring lines around the fracture with the position of the monitoring points when heated for 540 min at different heat source temperatures. It can be seen from Figure 6 that inside of the granite, the monitoring line A-A is situated on the left side of the granite, and the monitoring line C-C is positioned on the upper part of the fracture. The steady temperature of the monitoring points along these two lines decreases nonlinearly as the d h increases. Conversely, the monitoring line B-B is located on the right side of the granite, and the monitoring line D-D is situated on the lower part of the fracture. The steady temperature of the monitoring points on the two monitoring lines decreases linearly with the increase in the distance from the monitoring point to the heat source.
A combination of Figure 5 and Figure 6 shows that the presence of the fracture alters the distribution characteristics of the steady temperature within the granite. This is because in the lower area of the fracture, the heat transfer is primarily carried out by heat conduction, and the heat flow has not been significantly disturbed before reaching the fracture. The heat can be transferred to the lower wall of the fracture more uniformly, which still adheres to the one-dimensional linear heat conduction law [35]. In addition, as d v increases, the degree of heat loss gradually increases, which leads to the trend of a linear decrease in the steady temperature. On the contrary, in the upper region of the fracture, heat transfer involves the combination of the fracture itself and the surrounding rock. A portion of the heat transfer needs to bypass the air fracture. Due to the influence of the fracture’s geometry, the heat passing through the granite bypass path causes the heat flow’s direction to deflect. In addition, another part of the heat transfer needs to be transferred through the fracture. The thermal conductivity of the air within the fracture is approximately 0.03 W/(m·K) [36], significantly lower than that of the granite bedrock, which is between 2.5 and 4.5 W/m⋅K [37,38,39]. This reduction in thermal conductivity weakens the efficiency of heat transfer and complicates the heat flow path within the fracture. Therefore, in comparison to the rock on the lower side of the fracture, the complexity of the heat flow path of the rock on the upper side of the fracture in the heat transfer process leads to the nonlinear characteristics of the steady temperature change of the rock on the upper side of the fracture. The fitting relationships between the steady temperature ( T s ) and the distance from the heat source ( d h ) are shown in Table 2.

3.3. The Average Heating Rate at Monitoring Points

The heating rate provides a relatively intuitive reflection of the speed of heat transfer within the granite. The heating rates at various monitoring points inside of the granite during the heating process can be calculated according to Equation (2). This study statistically analyzed the heating rates at monitoring points located on lines E-E, F-F, C-C, and D-D during the initial two hours of heating. The results are presented in Figure 7.
ω = Δ T Δ τ
where ω is the average heating rate, °C/h; Δ T is the temperature difference of the monitoring point during a specific period of time, °C; and Δ τ is the heating time interval, h. In this paper, Δ τ takes 2 min.
Figure 7 reveals that the heating rates at all monitoring points generally exhibited a trend of initial increase followed by a decrease, ultimately stabilizing. Points closer to the heat source demonstrated a more pronounced increasing trend in the heating rate, indicating faster heat transfer and, consequently, higher temperatures at these proximal locations. During the initial heating phase, the significant temperature difference between the granite’s initial temperature and the heat source facilitated rapid heat transfer, causing the heating rate to rise gradually. As heat transfer progressed and the granite mass temperature increased, the heating rate declined slowly until it essentially stabilized. For monitoring points along the same line, increasing d h correlated with a longer duration of the heating rate increase phase and an overall lower heating rate, signifying slower heat transfer. For instance, on line E-E (Figure 7a), the peak heating rate at the point closest to the source (#05) was 111 °C/h compared to only 9 °C/h at the farthest point (#59). This represents a reduction of 91.89% in the peak heating rate as the d h increased from 20 mm to 140 mm. Comparing the heating rates of points #23 and #41 located below and above the fracture, respectively, indicates a significant influence of the fracture on the local heat transfer rate, evidenced by the substantially higher heating rate below the fracture compared to above it. This difference results from the combined effects of d h and the presence of the fracture. As shown in Figure 7b, monitoring points at similar d h exhibited essentially identical heating rate trends. However, due to the fracture and the inherent heterogeneity of the granite, which create different effective heat transfer paths to the points, the times at which individual points reached their peak heating rates varied, albeit generally remaining within the range of 0.3 to 0.4 h. Comparing the heating rates of adjacent monitoring points on either side of the fracture in Figure 7c,d shows consistent temporal trends between neighboring points across different phases, despite differences in their peak heating rate magnitudes. This suggests that the fracture has a minor influence on the temperature change trend of adjacent points laterally across the fracture. Nevertheless, because the fracture significantly alters the heat transfer paths within the granite, the temperatures at laterally adjacent points across the fracture differ.
The peak heating rate at a monitoring point reflects the relative speed of heat transfer in its vicinity, while the time taken to reach this peak rate is a critical parameter for defining the rapid heating phase. Consequently, studying the peak heating rate is significant for heat transfer analysis. Figure 8 presents the relationship curves between the peak heating rate and the d h for monitoring points on lines E-E, F-F, C-C, and D-D during the initial two hours of heating by the 80 °C source. Figure 8 shows that the peak heating rate decreases as d h increases, with the magnitude of this decrease also diminishing with greater distance. The peak heating rates for points located below monitoring line F-F range from 20 to 120 °C/h, significantly higher than the 10 to 20 °C/h observed for points above line F-F, indicating faster heat transfer and, consequently, higher temperatures in the lower region of the fractured granite compared to the upper region. Heat transfer along line F-F itself experiences less direct influence from d h and is primarily affected by the altered heat transfer paths due to the fracture, resulting in relatively small variations in the heating rates of its points, maintained within 15 to 30 °C/h. Furthermore, for points to the right of line F-F, the heating rate increases with proximity to the fracture, whereas for points to the left the heating rate increases with distance from the fracture; this phenomenon arises because heat converges towards the fracture side from below on the right but diverges away from the fracture side on the left. Within the sub-regions S1 and S2 formed by monitoring line E-E intersecting with lines C-C and D-D, respectively, monitoring points at equivalent d h exhibit essentially consistent heating rates and similar temperature changes (Figure 5).

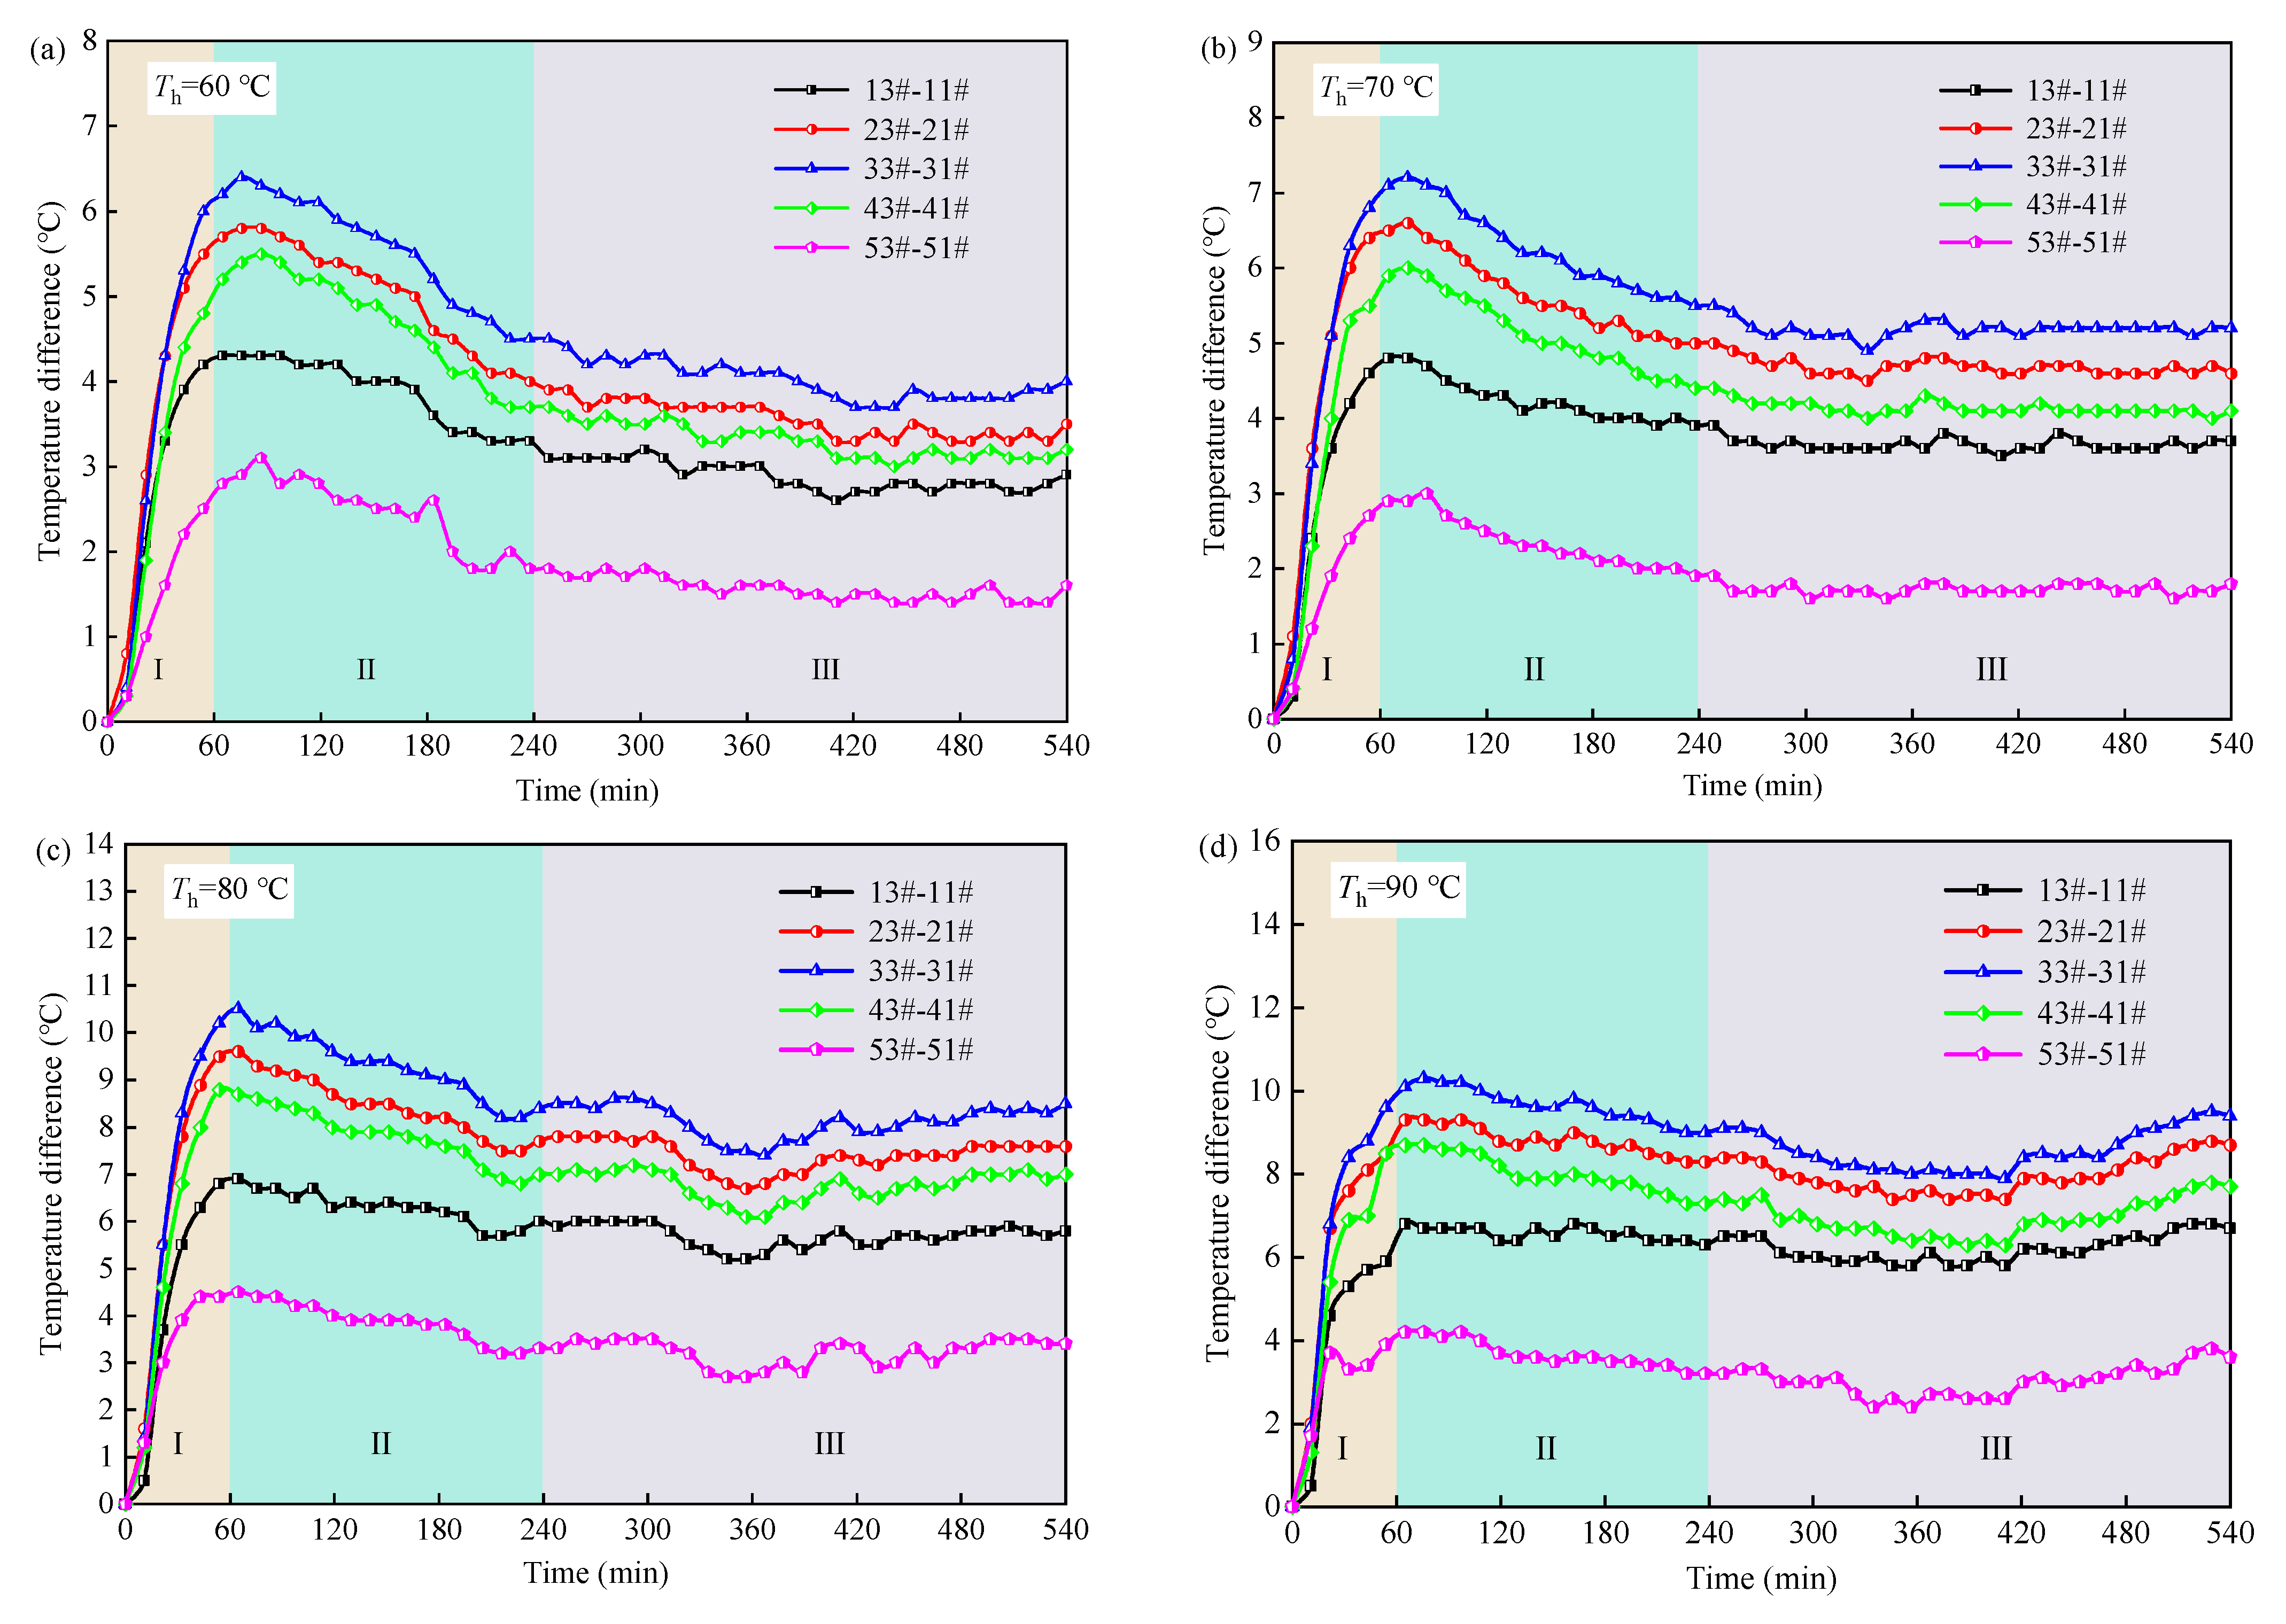
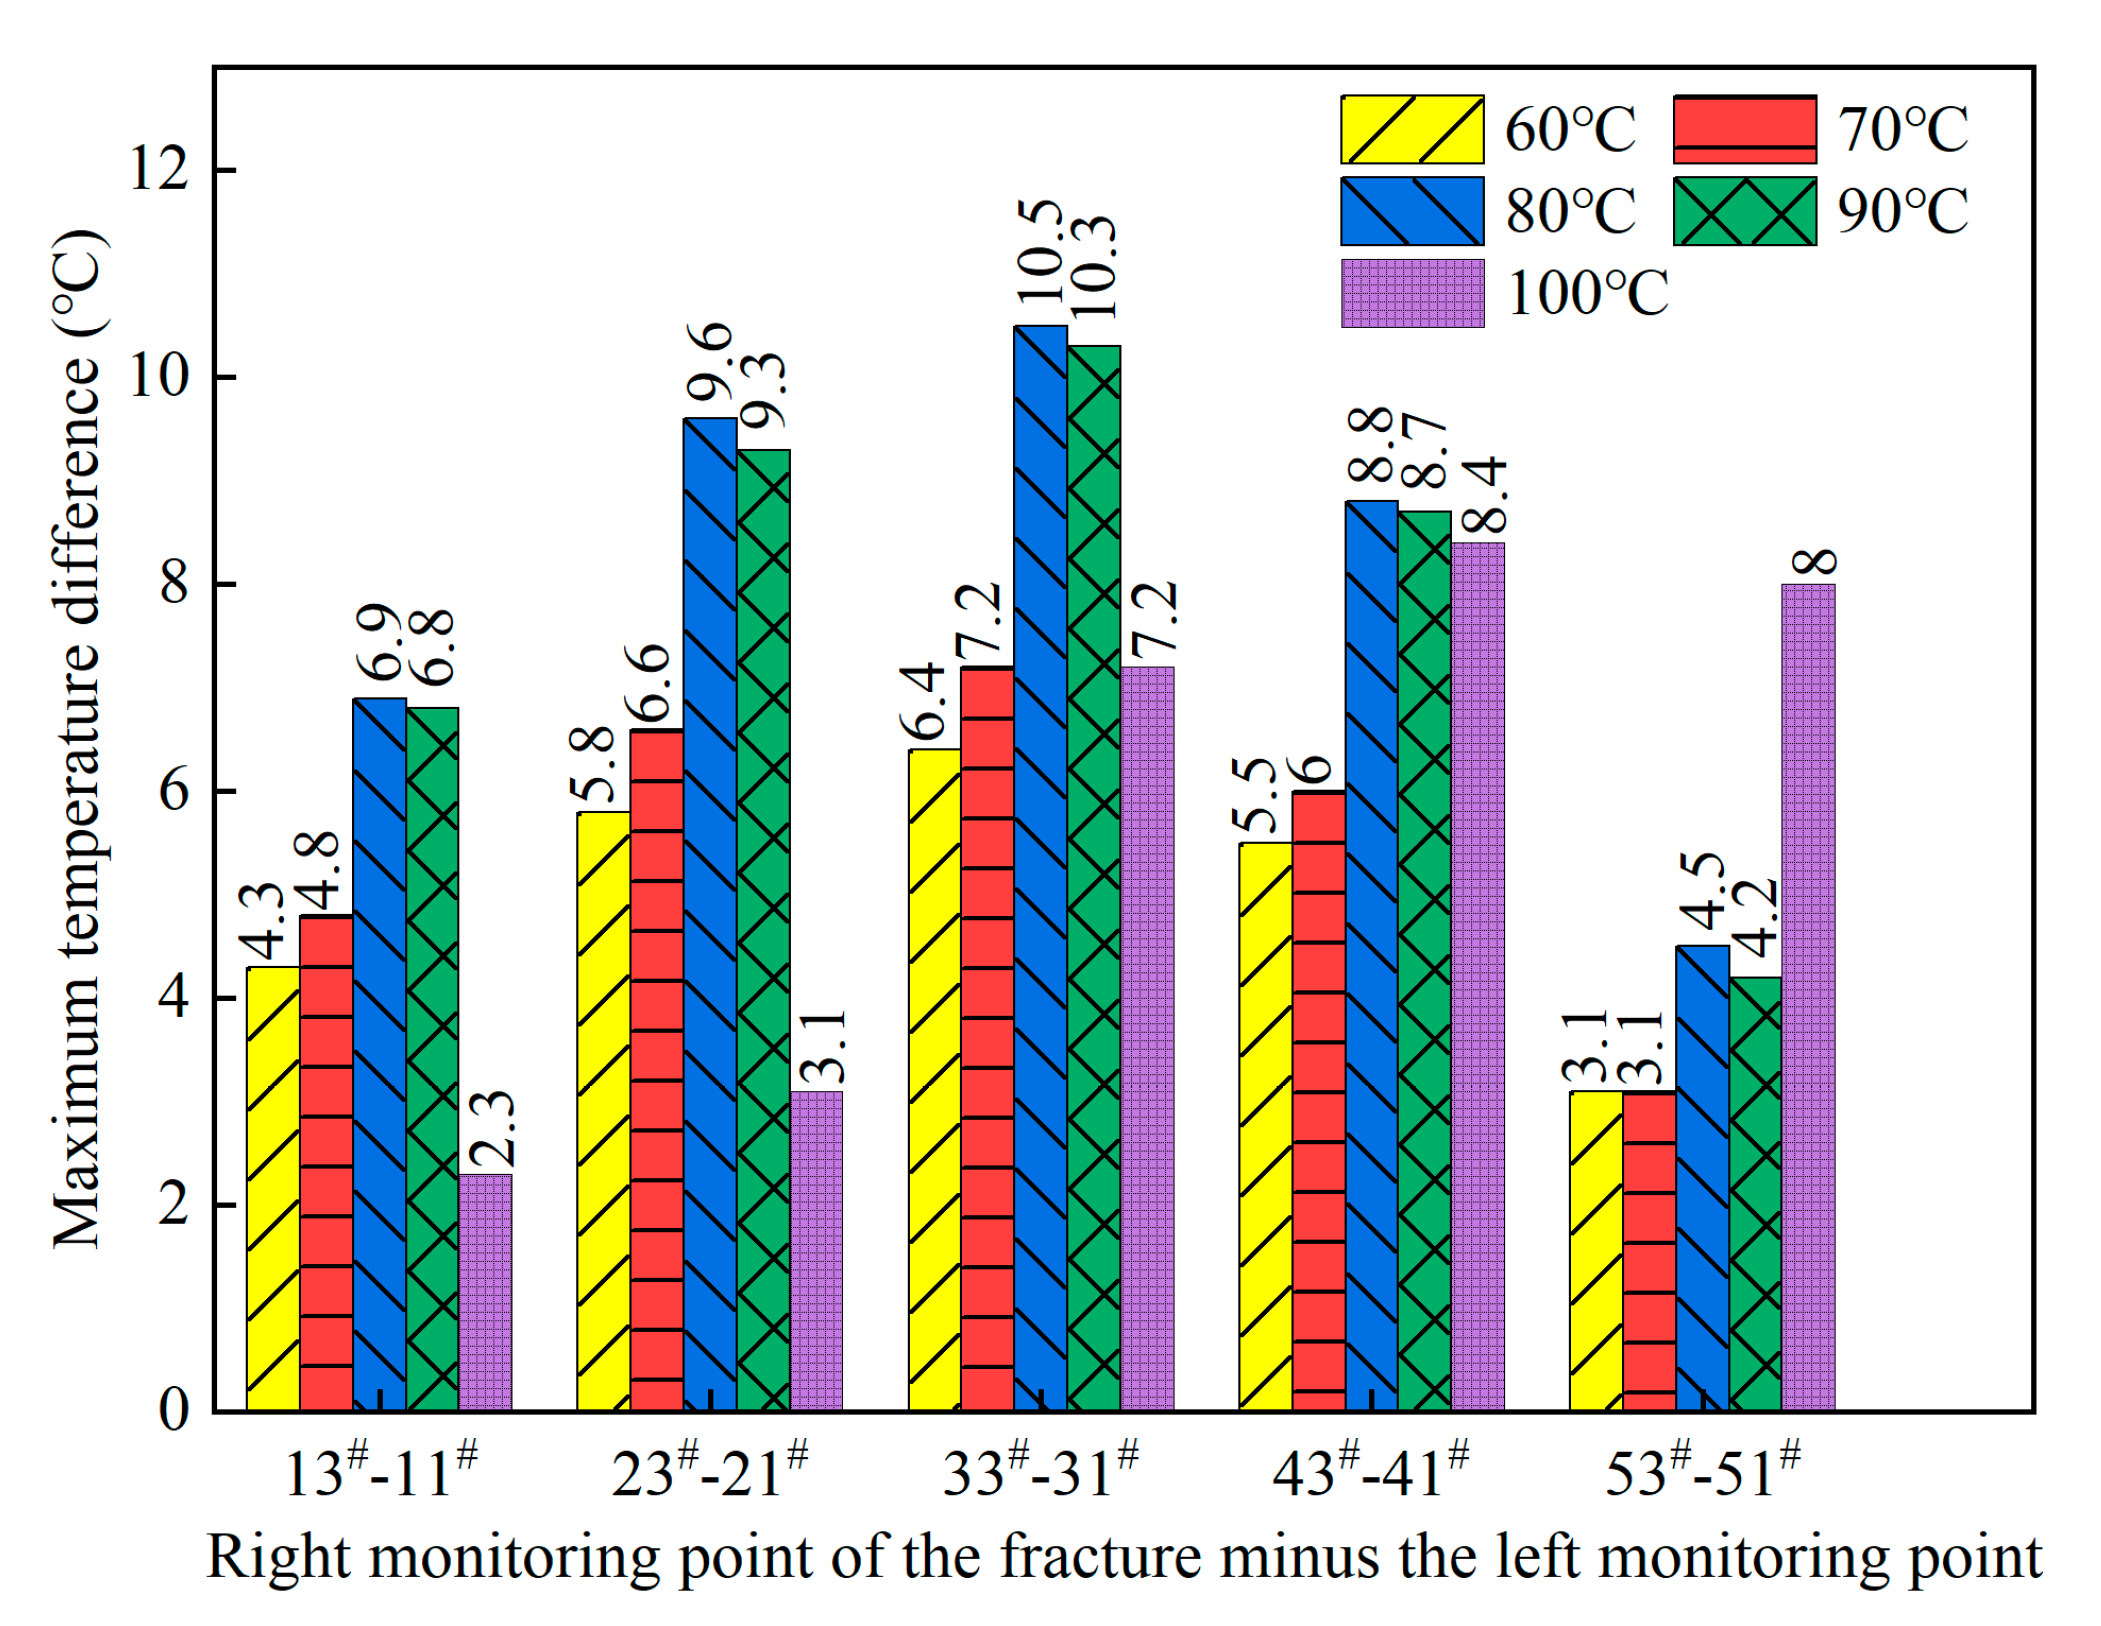
3.4. Temperature Difference Between the Left and Right Sides of the Fracture

Figure 9 reveals the temperature variations of the horizontal monitoring line F-F in fractured granite during the entire heating process with a heat source of 80 °C. As shown in Figure 9, the temperature at monitoring points on the right side of the fracture (33#, 34#, 35#, 36#) is generally higher than those at the monitoring points on the left side of the fracture (28#, 29#, 30#, 31#). Among the monitoring points on the left and right sides of the fracture, the temperature at point 33#, located on the right side of the fracture, is the highest. This result is primarily attributed to the accumulation of heat on the right side of the fracture. Conversely, the temperature at monitoring point 31# on the left side of the fracture is the lowest, mainly because of the influence of the fracture’s thermal barrier.
To further explore the influence of the fracture on the heat transfer of granite, the temperature difference between monitoring points on the left and right sides of the fracture at the same d h was analyzed. The temperature difference between the left and right monitoring points of the fracture under heating conditions ranging from 60 °C to 90 °C is shown in Figure 10. From Figure 10, it can be seen that the temperature difference between the left and right monitoring points of the fracture initially increases and then decreases over time within the temperature range of 60 °C to 80 °C, eventually stabilizing. When heated by a 90 °C heat source, the temperature difference between the left and right monitoring points of the fracture rises slowly after 7 h.
The size of the temperature difference between the left and right monitoring points of the fracture can, to some extent, reflect the degree to which the fracture impedes the heat transfer process of the granite. The temperature difference is greater during the unsteady heat transfer stage of the granite compared to the steady heat transfer stage. It can be seen that the fracture’s hindering effect on granite during the unsteady heat transfer stage is more pronounced than in the steady heat transfer stage. The main reason is that in the unsteady heat transfer stage of granite, the presence of the fracture significantly interferes with the heat transfer and distribution process. This is because the heat flow needs to bypass or traverse the fracture, and the stable heat transfer path has not yet been established in this stage due to the granite experiencing a higher heating rate during the unsteady heat transfer stage, which exacerbates the hindrance caused by the fracture of the heat transfer of granite. After entering the steady-state heat transfer stage, although the fracture still affects the heat flow path in the granite, as the heating time increases, the heat balance in the granite is gradually established. The heat flow reaches a stable state, and the distribution of heat in the granite becomes increasingly uniform, resulting in a diminished blocking effect of the fracture on the granite’s heat transfer.
As observed from Figure 10a–d, the temperature difference between monitoring points 33# and 31# is the largest, whereas the temperature difference between monitoring points 53# and 51# is the smallest. This indicates that the middle part of the fracture significantly affects the heat transfer of granite, while the upper right corner of the fracture presents a relatively minor hindrance to granite’s heat transfer. From the perspective of the heat transfer path and the heating rate, it can be seen that in the middle of the fracture, the heat reaching the left monitoring point 31# of the fracture must go through a longer heat transfer path and overcome greater thermal resistance, resulting in a significantly lower heating rate at monitoring point 31# compared to monitoring point 33#. This ultimately leads to the maximum temperature difference between the two monitoring points, 33# and 31#. In the right upper part of the fracture, although monitoring point 51# has a longer heat transfer path, as the distance from the monitoring point to the heat source increases, the extent of heat loss also increases, and heat attenuation is obvious, which makes the heating rates of the monitoring points 53# and 51# lower, eventually leading to the smallest temperature difference between the left and right monitoring points in the right upper part of the fracture.
The maximum temperature difference between the left and right monitoring points at different positions of the fracture at different heat source temperatures is shown in Figure 11.
As seen from Figure 11, in the range of a heat source temperature from 60 °C to 90 °C, the sizes of maximum temperature differences between the left and right monitoring points of the fracture are ranked as follows: 33#-31# > 23#-21# > 43#-41# > 13#-11# > 53#-51#. As the temperature of the heating source increases, the maximum temperature difference between the two monitoring points exhibits a significant growth trend. Specifically, the maximum temperature difference between monitoring points 33# and 31# increases from 6.4 °C at 60 °C to 7.2 °C at 70 °C, marking a 12.50% rise. There is a further increase from 7.2 °C at 70 °C to 10.5 °C at 80 °C, an increase of 45.83%. This indicates that in the temperature interval from 60 °C to 80 °C, there is a difference in the degree of influence of the fracture on the heat transfer of granite for every 10 °C increase in temperature. In addition, when the heat source temperature increases from 80 °C to 90 °C, the maximum temperature difference between the two monitoring points remains essentially unchanged. It is worth noting that when the heat source temperature reaches 100 °C, the maximum temperature difference between the left and right monitoring points at different positions of the fracture becomes 43#-41# > 53#-51# > 33#-31# > 23#-21# > 13#-11#, which demonstrates that the impact of the fracture on natural convection heat transfer (60 °C, 70 °C, 80 °C, 90 °C) and boiling heat transfer (100 °C) is different. According to the principle of heat transfer, during boiling heat transfer, the formation and growth of bubbles, as well as the flow disturbance generated by their detachment from the heating wall surface, significantly enhance heat transfer efficiency. In this process, the formation and release of bubbles promote the effective exchange and transfer of heat, which makes the temperature of the heating wall surface of granite rise rapidly, leading to a different effect of the existence of the fracture on the heat transfer of the granite.

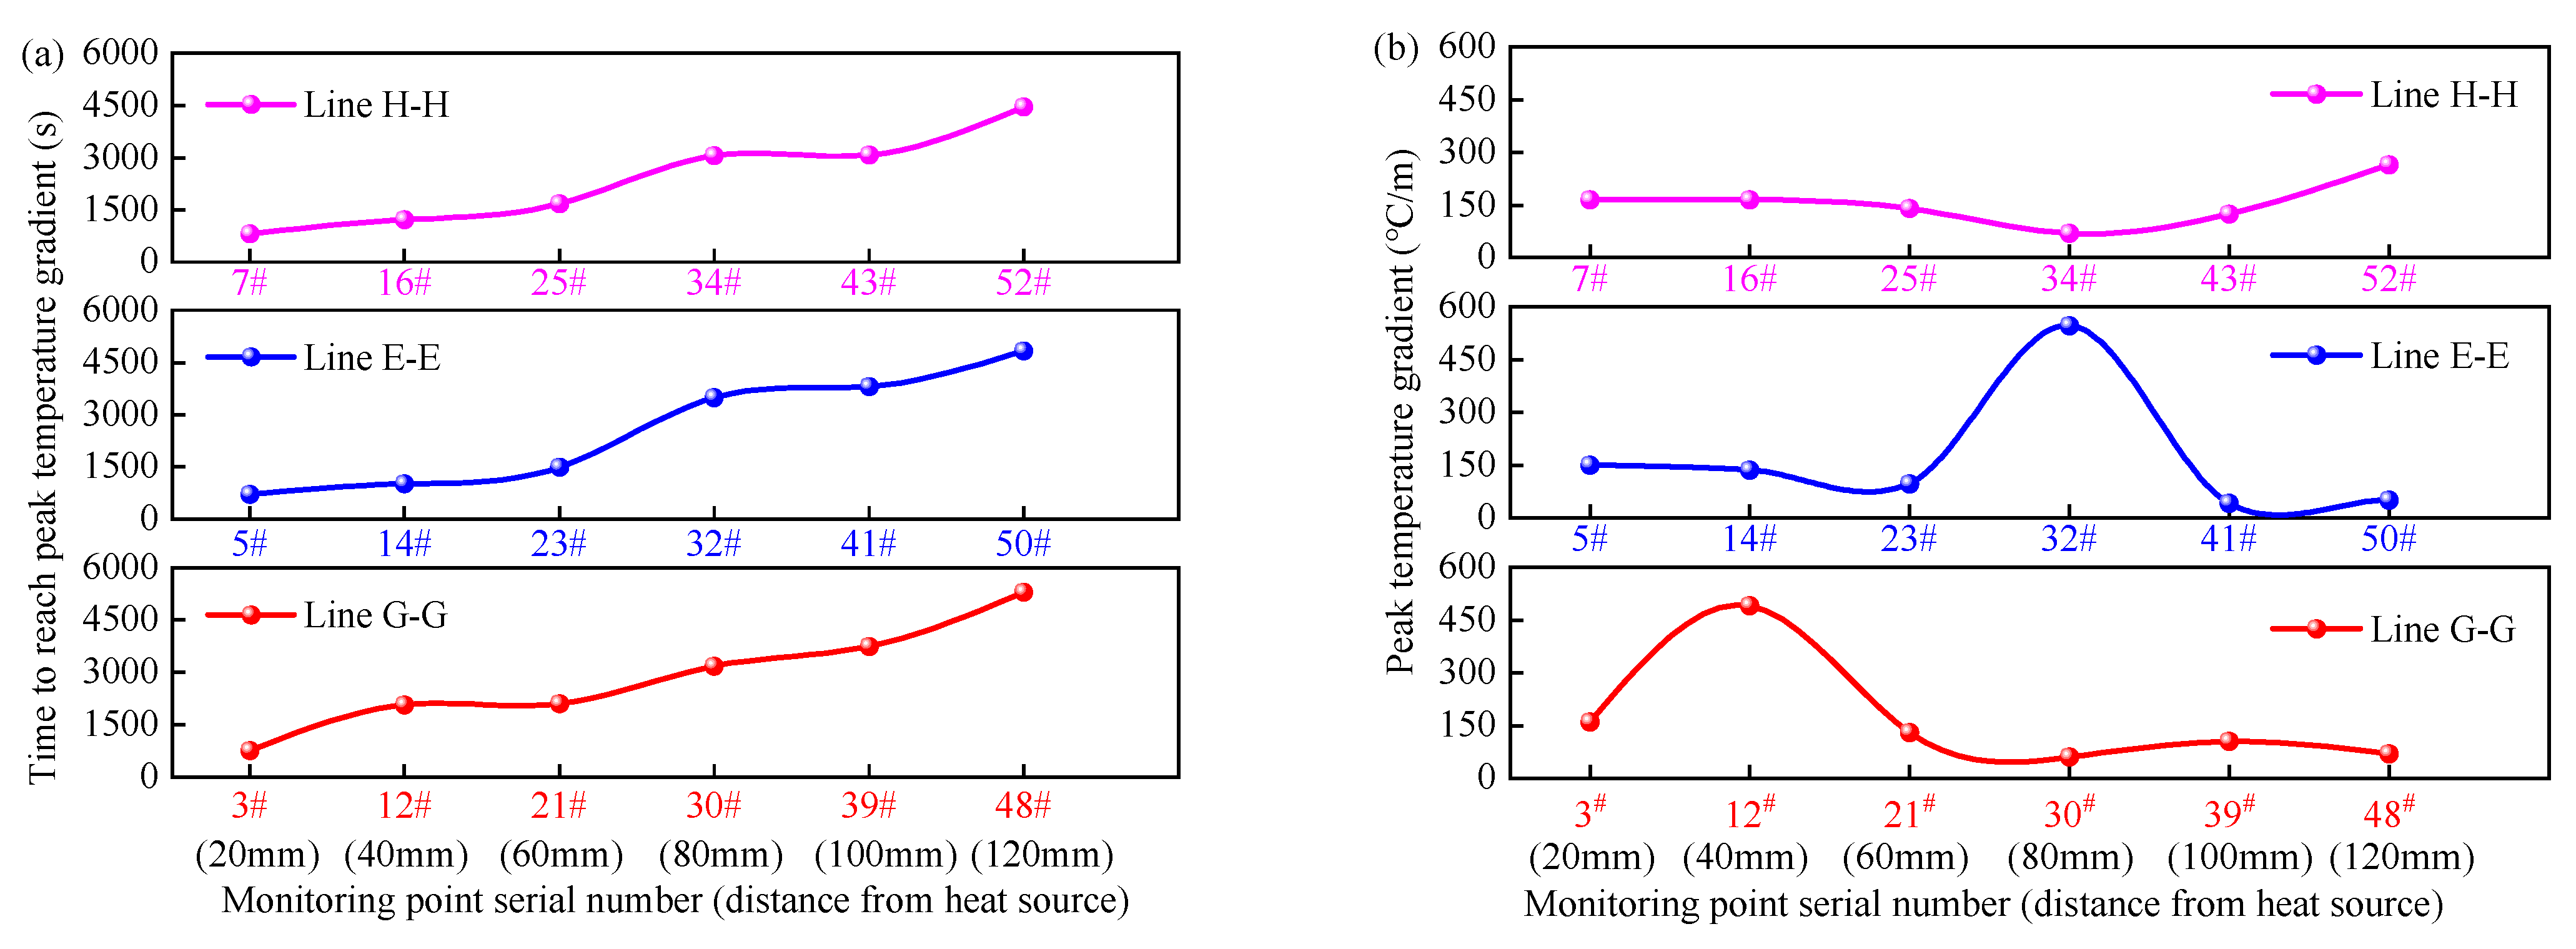
3.5. Temperature Gradient Evolution in Fractured Granite

The temperature gradient is a two-dimensional vector whose magnitude equals the maximum rate of temperature change and whose direction is that of increasing temperature. Consequently, the temperature gradient can be utilized to analyze the laws governing heat transfer during heat conduction in fractured granite. The temperature gradient in this study is obtained by taking the limit of the ratio between the temperature difference across adjacent isothermal surfaces and the perpendicular distance separating those surfaces:
T Grad = lim Δ x 0 Δ T Δ x
where T Grad is the temperature gradient, °C/m; Δ T is the temperature difference between adjacent isothermal surfaces, °C; and Δ x is the vertical distance between adjacent isothermal surfaces, m.
Figure 12 depicts the distribution of the temperature gradient field within the fractured granite at different times under heating by an 80 °C heat source. During the initial heating stage, the temperature gradient vectors were predominantly vertically downward, indicating upward heat transfer. Concurrently, the temperature gradient exhibited minimal variation in the upper region of the granite, signifying negligible heat transfer. The maximum temperature gradient magnitude across the entire domain was 0.48 °C/mm, located at the bottom-right corner of the granite (Figure 12a,b). In the middle heating stage, regions of elevated temperature gradient formed annular patterns surrounding the fracture. As heating progressed, the temperature gradient demonstrated minimal change, suggesting that heat transfer was approaching a steady state (Figure 12c,d). During the late heating stage, the temperature gradient within the fractured granite stabilized, the highest and lowest recorded temperature gradients were 0.39 °C/mm and 0.04 °C/mm, respectively, and the predominant direction of heat transfer remained essentially unchanged (Figure 12e,f).
From Figure 13, it can be seen that the time at which the monitoring point reaches the peak temperature gradient is positively correlated with d h . On the same monitoring line, excluding the monitoring points within the fracture, the peak temperature gradient at the other monitoring points gradually decreases with the increase of the distance from the monitoring point to the heat source. Additionally, the peak temperature gradient at monitoring points 12# and 32# within the fracture attains its maximum value on the monitoring line; however, on the monitoring line D-D, the peak temperature gradient at monitoring point 52# within the fracture is lower than that at monitoring point 7# near the heat source. This is because monitoring point 7# is closer to the heat source, resulting in a greater temperature change rate per unit length compared to monitoring point 52#.
The corresponding relationship between the peak temperature gradient at each monitoring point in the fracture and the temperature of the heat source is shown in Figure 14. It can be seen from Figure 14 that the relationships between the sizes of the peak temperature gradients at each monitoring point under different heat source temperatures are 22# > 32# > 12# > 42# > 52#. This indicates that the peak temperature gradient is largest in the middle and lower sections of the fracture and the peak temperature gradient is lowest in the upper right corner. Considering the relationship between temperature gradient and thermal stress, it becomes evident that the thermal stress generated in the middle and lower sections of the fracture during heat transfer can reach its maximum. Within the temperature range of 60 °C to 90 °C, as the heat source temperature increases, the peak temperature gradient at each monitoring point exhibits a gradual upward trend. However, when the heat source temperature reaches 100 °C, the peak temperature gradient at each monitoring point decreases in comparison to that at 90 °C.

4. Discussion

Based on the experimental results and the analysis of the heat transfer characteristics in fractured granite presented in this study, it was observed that fractures significantly impede heat conduction within the granite, resulting in distinct regional characteristics in its internal temperature field distribution. To discuss the disparities in heat transfer between fractured granite and intact granite, heat transfer data for intact granite under identical experimental conditions [40] were referenced. A comparison of the stable temperature field distribution characteristics between fractured granite and intact granite under heating by a heat source ranging from 60 to 100 °C is presented in Figure 15.
Figure 15 illustrates that the stable temperature field distribution in intact rock exhibits similar patterns under different heat source temperatures, namely, nearly horizontal isothermal contours. Minor undulations in the isothermal contours occur in localized regions due to variations in the thermal conductivity coefficients of different mineral constituents within the granite. For fractured granite, the stable temperature field distribution under various heat source temperatures consistently demonstrates isothermal contours concentrating around the fracture and diverging towards both sides. Furthermore, under the same heat source temperature, the temperature in the top region of the intact rock is higher than that in the fractured rock, and this trend becomes more pronounced with increasing heat source temperature.
During geothermal exploitation, the injected low-temperature fluid in production wells exchanges heat with the rock mass, requiring continuous heat replenishment from the surrounding rock. However, the presence of fractures impedes this process to some extent, representing a significant factor contributing to reduced thermal extraction efficiency. Additionally, Liu et al. [35] demonstrated through thermal resistance analysis and numerical calculations that the obstruction effect of fractures on heat replenishment diminishes as the angle between the fracture and the heat source increases. Therefore, in the implementation of geothermal development projects, the construction of thermal reservoirs should try to avoid the formation of large-scale unconnected fracture groups, which will greatly hinder the transfer of heat.

5. Conclusions

In this study, the temperature distribution and evolution law of fractured granite was investigated using a constant temperature heat source and a multi-channel data recorder from the perspectives of temperature field distribution, temperature variation pattern, heating rate, temperature difference, and temperature gradient evolution, leading to the following primary conclusions:
(1) The fracture significantly alters the granite’s temperature field distribution. Granite’s heterogeneity, coupled with the fracture’s presence, governs the field’s regional characteristics.
(2) Fractured granite exhibits three distinct temperature response stages during heating: rapid heating, slow heating, and stabilization. Steady temperatures decrease nonlinearly (left fracture side) and linearly (right fracture side) with increasing distance from the heat source.
(3) Heating rates at all monitoring points followed a unimodal trend (increase, peak, decrease) before stabilization. Peak heating rates ranged 20~120 °C/h above the horizontal fracture (F-F) and 10~20 °C/h below it.
(4) The fracture creates maximal temperature differences on both sides of its central region and minimal differences near the top (e.g., ΔT = 10.5 °C at the center and 4.5 °C at the top under a 80 °C heat source). This confirms the fracture’s dominant heat transfer impedance in the central granite region.
(5) Heating generates concentrated isothermal gradient contours around the fracture. The time to peak temperature gradient correlates inversely with heat source proximity. Peak gradients within the fracture reached 825 °C/m (max) and 345 °C/m (min) at 90 °C source temperature.
Future research should prioritize quantitative studies on fracture-induced impediments to heat transfer in rock masses. This necessitates integrating laboratory experiments and numerical simulations with actual geothermal reservoir conditions and undertaking a holistic consideration of the influence of fractures’ geometric parameters (e.g., length, aperture, density) and surface characteristics (e.g., roughness, contact ratio, heat exchange area) on heat transfer.

Author Contributions

Conceptualization, B.X.; methodology, K.L. and Q.F.; investigation, K.L., Q.F. and F.H.; data curation, K.L. and Q.F.; writing—original draft, Q.F.; writing—review and editing, B.X., K.L., F.H. and W.Z.; supervision, B.X., K.L. and W.Z.; funding acquisition, B.X. All authors have read and agreed to the published version of the manuscript.

Funding

This research was supported by the Joint Key Project of the National Natural Science Foundation of China (Grant No. U24A2089) and the Shanxi Provincial Natural Science Foundation Project (Grant Nos. 202303021211042 and 202303011222006).

Institutional Review Board Statement

Not applicable.

Informed Consent Statement

Not applicable.

Data Availability Statement

The data used to support the findings of this study are available from the corresponding author upon request.

Conflicts of Interest

The authors declare no conflicts of interest.

Nomenclature

Latin symbols
A-A, B-B, E-E, G-G, H-HVertical temperature monitoring lines
F-FHorizontal temperature monitoring line
C-C, D-DOblique temperature monitoring lines
d h Vertical distance from the heat source (mm)
T Temperature (℃)
T Grad Temperature gradient (℃/mm)
T h Heat source temperature (℃)
T r Rock temperature (℃)
T s Steady temperature (℃)
U Uncertainty
Greek symbols
Δ T Temperature difference (℃)
Δ τ Heating time interval (s)
ω The average heating rate (°C/h)
Subscripts
drData recorder
iIndoor
MaxMaximum
MinMinimum
rRock mass
sSystem
Acronyms
HDRHot dry rock
XRDX-ray diffraction

References

  1. Zhang, L.; Chen, S.; Zhang, C. Geothermal power generation in China: Status and prospects. Energy Sci. Eng. 2019, 7, 1428–1450. [Google Scholar] [CrossRef]
  2. Hou, J.; Cao, M.; Liu, P. Development and utilization of geothermal energy in China: Current practices and future strategies. Renew. Energy 2018, 125, 401–412. [Google Scholar] [CrossRef]
  3. Zhu, J.; Hu, K.; Lu, X.; Huang, X.; Liu, K.; Wu, X. A review of geothermal energy resources, development, and applications in China: Current status and prospects. Energy 2015, 93, 466–483. [Google Scholar] [CrossRef]
  4. Zhu, Z.; Yang, S.; Ranjith, P.G.; Tian, W.; Tian, H.; Zheng, J.; Jiang, G.; Dou, B. A comprehensive review on mechanical responses of granite in enhanced geothermal systems (EGSs). J. Clean. Prod. 2023, 383, 135378. [Google Scholar] [CrossRef]
  5. Sharmin, T.; Khan, N.R.; Akram, M.S.; Ehsan, M.M. A state-of-the-art review on geothermal energy extraction, utilization, and improvement strategies: Conventional, hybridized, and enhanced geothermal systems. Int. J. Thermofluids 2023, 18, 100323. [Google Scholar] [CrossRef]
  6. Kolditz, O. Modelling flow and heat transfer in fractured rocks: Dimensional effect of matrix heat diffusion. Geothermics 1995, 24, 421–437. [Google Scholar] [CrossRef]
  7. Zhao, Z. On the heat transfer coefficient between rock fracture walls and flowing fluid. Comput. Geotech. 2014, 59, 105–111. [Google Scholar] [CrossRef]
  8. Zhao, J.; Tso, C.P. Heat transfer by water flow in rock fractures and the application to hot dry rock geothermal systems. Int. J. Rock Mech. Min. Sci. Geomech. Abstr. 1993, 30, 633–641. [Google Scholar] [CrossRef]
  9. Chen, Y.; Ma, G.; Wang, H. Heat extraction mechanism in a geothermal reservoir with rough-walled fracture networks. Int. J. Heat Mass Transf. 2018, 126, 1083–1093. [Google Scholar] [CrossRef]
  10. Wang, G.; Ma, X.; Song, X.; Li, G. Modeling flow and heat transfer of fractured reservoir: Implications for a multi-fracture enhanced geothermal system. J. Clean. Prod. 2022, 365, 132708. [Google Scholar] [CrossRef]
  11. Zhang, W.; Qu, Z.; Guo, T.; Wang, Z. Study of the enhanced geothermal system (EGS) heat mining from variably fractured hot dry rock under thermal stress. Renew. Energy 2019, 143, 855–871. [Google Scholar] [CrossRef]
  12. Zhou, L.; Zhu, Z.; Xie, X.; Hu, Y. Coupled thermal–hydraulic–mechanical model for an enhanced geothermal system and numerical analysis of its heat mining performance. Renew. Energy 2021, 181, 1440–1458. [Google Scholar] [CrossRef]
  13. Wu, X.; Huang, Z.; Dai, X.; Song, H.; Zhang, S. Thermo-coupled FSI analysis of LN2 jet impinging on hot dry rock. Appl. Therm. Eng. 2020, 165, 114621. [Google Scholar] [CrossRef]
  14. Xiong, F.; Sun, H.; Ye, Z.; Zhang, Q. Heat extraction analysis for nonlinear heat flow in fractured geothermal reservoirs. Comput. Geotech. 2022, 144, 104641. [Google Scholar] [CrossRef]
  15. Yao, C.; Shao, Y.; Yang, J.; Huang, F.; He, C.; Jiang, Q.; Zhou, C. Effects of non-darcy flow on heat-flow coupling process in complex fractured rock masses. J. Nat. Gas Sci. Eng. 2020, 83, 103536. [Google Scholar] [CrossRef]
  16. Lei, Z.; Zhang, Y.; Lin, X.; Shi, Y.; Zhang, Y.; Zhou, L.; Shen, Y. A thermo-hydro-mechanical simulation on the impact of fracture network connectivity on the production performance of a multi-fracture enhanced geothermal system. Geothermics 2024, 122, 103070. [Google Scholar] [CrossRef]
  17. Jin, Y.; He, C.; Yao, C.; Sun, Z.; Zhang, X.; Yang, J.; Jiang, Q.; Zhou, C. Effects of in-situ stress on heat transfer in fracture networks. Geomech. Energy Environ. 2024, 37, 100516. [Google Scholar] [CrossRef]
  18. Cao, R.; Shi, J.; Jia, Z.; Cao, C.; Cheng, L.; Liu, G. A modified 3d-EDFM method considering fracture width variation due to thermal stress and its application in enhanced geothermal system. J. Hydrol. 2023, 623, 129749. [Google Scholar] [CrossRef]
  19. Li, Z.; Huang, C.; Wang, H.; Xing, S.; Long, M.; Liu, Y. Determination of heat transfer representative element volume and three-dimensional thermal conductivity tensor of fractured rock masses. Int. J. Rock Mech. Min. Sci. 2023, 170, 105528. [Google Scholar] [CrossRef]
  20. Zhou, R.; Zhan, H.; Wang, Y. On the role of rock matrix to heat transfer in a fracture-rock matrix system. J. Contam. Hydrol. 2022, 245, 103950. [Google Scholar] [CrossRef]
  21. Ma, Y.; Gan, Q.; Zhang, Y.; Huang, Y. Experimental research on the heat transfer characteristics of fluid flowing through rock with intersecting fractures. Geothermics 2022, 107, 102587. [Google Scholar] [CrossRef]
  22. He, Y.; Bai, B.; Hu, S.; Li, X. Effects of surface roughness on the heat transfer characteristics of water flow through a single granite fracture. Comput. Geotech. 2016, 80, 312–321. [Google Scholar] [CrossRef]
  23. Huang, Y.; Zhang, Y.; Gao, X.; Ma, Y.; Hu, Z. Experimental and numerical investigation of seepage and heat transfer in rough single fracture for thermal reservoir. Geothermics 2021, 95, 102163. [Google Scholar] [CrossRef]
  24. Tian, X.; Ye, Z. Experimental study on convection heat transfer properties in rough-walled fractures of granite: The effect of fracture roughness. Geothermics 2024, 122, 103085. [Google Scholar] [CrossRef]
  25. Liu, J.; Xie, H.; Li, C.; Hu, J.; Luo, Y.; Liu, B.; Wang, Z. Effect of complex void structures on flow channeling and heterogeneous heat transfer in fractured rocks. J. Hydrol. 2024, 639, 131654. [Google Scholar] [CrossRef]
  26. Xiong, F.; Jiang, Q.; Ye, Z.; Zhang, X. Nonlinear flow behavior through rough-walled rock fractures: The effect of contact area. Comput. Geotech. 2018, 102, 179–195. [Google Scholar] [CrossRef]
  27. Brown, D.W. A hot dry rock geothermal energy concept utilizing supercritical CO2 instead of water. In Proceedings of Twenty-Fifth Workshop on Geothermal Reservoir Engineering; Stanford University: Stanford, CA, USA, 2000. [Google Scholar]
  28. Liu, X.; Wang, Y.; Li, S.; Wang, J. Convection heat transfer of supercritical CO2 in a single fracture in enhanced geothermal systems. Int. Commun. Heat Mass Transf. 2021, 123, 105170. [Google Scholar] [CrossRef]
  29. Xu, R.; Zhang, L.; Wang, W.; Jiang, P. Core-scale investigation of convective heat transfer of supercritical pressure CO2 in hot rock fracture with various inclinations. Appl. Therm. Eng. 2021, 188, 116648. [Google Scholar] [CrossRef]
  30. Zhang, L.; Jiang, P.; Wang, Z.; Xu, R. Convective heat transfer of supercritical CO2 in a rock fracture for enhanced geothermal systems. Appl. Therm. Eng. 2017, 115, 923–936. [Google Scholar] [CrossRef]
  31. Song, W.; Wang, C.; Du, Y.; Shen, B.; Chen, S.; Jiang, Y. Comparative analysis on the heat transfer efficiency of supercritical CO2 and H2O in the production well of enhanced geothermal system. Energy 2020, 205, 118071. [Google Scholar] [CrossRef]
  32. Xu, Z.; Zhao, H.; Fan, L.; Jia, Q.; Zhang, T.; Zhang, X.; Han, D.; Tan, Y.; Liu, J. A literature review of using supercritical CO2 for geothermal energy extraction: Potential, methods, challenges, and perspectives. Renew. Energy Focus 2024, 51, 100637. [Google Scholar] [CrossRef]
  33. Zhang, J.; Liu, Y.; Lv, J.; Yang, G.; Xia, J. Comparative investigation of heat extraction performance in 3d self-affine rough single fractures using CO2, H2O and H2O as heat transfer fluid. Renew. Energy 2024, 235, 121309. [Google Scholar] [CrossRef]
  34. Nath, F.; Mahmood, M.N.; Ofosu, E.; Khanal, A. Enhanced geothermal systems: A critical review of recent advancements and future potential for clean energy production. Geoenergy Sci. Eng. 2024, 243, 213370. [Google Scholar] [CrossRef]
  35. Liu, K.; Xi, B.; Gao, P.; He, S.; Dong, Y.; Chen, L. Experimental study on heat transfer characteristics of rock mass with single fracture in geothermal reservoir. Therm. Sci. Eng. Prog. 2025, 62, 103631. [Google Scholar] [CrossRef]
  36. Beirão, S.G.S.; Ribeiro, A.P.C.; Lourenço, M.J.V.; Santos, F.J.V.; Nieto De Castro, C.A. Thermal conductivity of humid air. Int. J. Thermophys. 2012, 33, 1686–1703. [Google Scholar] [CrossRef]
  37. Cho, W.J.; Kwon, S.; Choi, J.W. The thermal conductivity for granite with various water contents. Eng. Geol. 2009, 107, 167–171. [Google Scholar] [CrossRef]
  38. Pan, J.; Feng, Z.; Zhang, Y.; Xi, X.; Miao, S.; Cai, M. Experimental study on evaluation of porosity, thermal conductivity, UCS, and elastic modulus of granite after thermal and chemical treatments by using p-wave velocity. Geoenergy Sci. Eng. 2023, 230, 212184. [Google Scholar] [CrossRef]
  39. Zhao, X.G.; Zhao, Z.; Guo, Z.; Cai, M.; Li, X.; Li, P.F.; Chen, L.; Wang, J. Influence of thermal treatment on the thermal conductivity of beishan granite. Rock Mech. Rock Eng. 2018, 51, 2055–2074. [Google Scholar] [CrossRef]
  40. Xi, B.; He, S.; Chen, Z.; Li, X.; Dong, Y.; Yang, X.; Xin, G. Thermal shock factor measurement and its evolution in granite under conduction heating. Chin. J. Rock Mech. Eng. 2020, 39, 1356–1368. [Google Scholar] [CrossRef]
Figure 1. Preparation of fractured granite sample: (a) intact cubic granite specimen; (b) single fracture obtained by water jet cutting and blind holes obtained by drilling for embedding temperature sensors; (c) temperature sensors’ embedding.
Applsci 15 06631 g001
Figure 2. Experimental system: (a) heat transfer system for fractured granite; (b) temperature data monitoring panel; (c) automatic water replenishment system; (d) constant temperature heating control panel.
Applsci 15 06631 g002
Figure 3. The position of embedded temperature sensors and monitoring lines in the fractured granite sample.
Applsci 15 06631 g003
Figure 4. Temperature field distribution of fractured granite at different times under the heat source temperature of 80 °C: (a) 5 min; (b) 10 min; (c) 35 min; (d) 60 min; (e) 300 min; (f) 540 min.
Applsci 15 06631 g004aApplsci 15 06631 g004b
Figure 5. Temperature variation curves of monitoring lines under 80 °C heat source heating: (a) line G-G; (b) line E-E; (c) line H-H; (d) in the fracture.
Applsci 15 06631 g005
Figure 6. The relationship between the steady temperature of the monitoring points and the distance from the heat source ( T h = 80 °C): (a) line A-A; (b) line B-B; (c) line C-C; (d) line D-D.
Applsci 15 06631 g006
Figure 7. Variation curves of the average heating rate at monitoring points within fractured granite under a 80 °C heat source heating during the first 2 h: (a) line E-E; (b) line F-F; (c) line C-C; (d) line D-D.
Applsci 15 06631 g007
Figure 8. Relationship between peak heating rates at monitoring points and vertical distance from the heat source during the first 2 h of fractured granite heated by an 80 °C heat source.
Applsci 15 06631 g008
Figure 9. Temperature variation curves of monitoring points on horizontal line F-F ( T h = 80 °C).
Applsci 15 06631 g009
Figure 10. Temperature difference change of the left and right monitoring points of the fracture at different temperatures: (a) 60 °C; (b) 70 °C; (c) 80 °C; (d) 90 °C.
Applsci 15 06631 g010
Figure 11. The maximum temperature difference between the left and right monitoring points of the fracture at different heat source temperatures.
Applsci 15 06631 g011
Figure 12. Temperature gradient field distribution of granite at different times under a heat source temperature of 80 °C (In the figure, the pink arrow is the temperature gradient of the monitoring point): (a) 5 min; (b) 10 min; (c) 35 min; (d) 60 min; (e) 300 min; (f) 540 min.
Applsci 15 06631 g012
Figure 13. The peak response characteristics of temperature gradient: (a) time to reach the peak; (b) peak temperature gradient.
Applsci 15 06631 g013
Figure 14. The relationship between the peak temperature gradient and the heat source temperature at monitoring points in the fracture.
Applsci 15 06631 g014
Figure 15. Comparison of temperature field distributions between intact rock and fractured granite after heating at different heat source temperatures: (ae) are fractured granite; (fj) are intact granite.
Applsci 15 06631 g015aApplsci 15 06631 g015b
Table 1. Mineral composition and content of granite.
Mineral ComponentContent/%Mineral ComponentContent/%
Quartz25Calcite6
Plagioclase31Chlorite1
Orthoclase11Gypsum1
Black mica13Others1
Tremolite11
Table 2. The fitting relationship between the steady temperature ( T s ) and the distance from the heat source ( d h ) of the monitoring lines in different areas of the granite under different T h .
Monitoring LinesHeat Source
Temperature( T h , °C)
Fitting EquationR2
A-A60 T s = e x p   4.0 3.3 3 d h + 1.1 5 d h 2 0.991
70 T s = e x p   4.2 3.9 3 d h + 1.2 5 d h 2 0.993
80 T s = e x p   4.3 5.2 3 d h + 1.6 5 d h 2 0.996
90 T s = e x p   4.4 5.6 3 d h + 1.7 5 d h 2 0.996
100 T s = e x p   4.6 5.1 3 d h + 0.9 5 d h 2 0.998
B-B60 T s = 54.4 0.8 1 d h 0.989
70 T s = 61.6 1.1 1 d h 0.990
80 T s = 69.6 1.4 1 d h 0.993
90 T s = 75.8 1.8 1 d h 0.993
100 T s = 90.9 2.2 1 d h 0.996
C-C60 T s = e x p   4.0 3.6 3 d h + 1.3 5 d h 2 0.994
70 T s = e x p   4.2 4.7 3 d h + 1.7 5 d h 2 0.997
80 T s = e x p   4.3 6.6 3 d h + 2.6 5 d h 2 0.998
90 T s = e x p   4.4 7.0 3 d h + 2.6 5 d h 2 0.998
100 T s = e x p   4.6 5.8 3 d h + 1.7 5 d h 2 0.996
D-D60 T s = 55.7 0.8 1 d h 0.993
70 T s = 55.7 0.8 1 d h 0.994
80 T s = 55.7 0.8 1 d h 0.988
90 T s = 55.7 0.8 1 d h 0.991
100 T s = 55.7 0.8 1 d h 0.987
Disclaimer/Publisher’s Note: The statements, opinions and data contained in all publications are solely those of the individual author(s) and contributor(s) and not of MDPI and/or the editor(s). MDPI and/or the editor(s) disclaim responsibility for any injury to people or property resulting from any ideas, methods, instructions or products referred to in the content.

