Abstract
This paper presents a case study comparing CFD predictions with experimental measurements for micropumps, with the goal of evaluating the accuracy and limitations of CFD methods in complex microscale geometries. A fast design and evaluation methodology was developed, integrating linear design, 3D fully viscous CFD-based optimization, and rapid prototyping and testing. The main problem at this scale and configuration of pumps is the combination of Reynolds and Taylor numbers. Their impact on labyrinth performance prediction and therefore volumetric efficiency dominates the losses at this scale. Multiple CFD simulations were conducted using various turbulence models and solver settings, and results were compared against experimental data. The labyrinth region was simulated both independently and as part of the full pump assembly, with RANS and LES used for the former and RANS for the latter. Precision 3D-printed rotors and volutes were tested, and performance maps were obtained. Significant discrepancies between CFD and experiments were observed, which were reconciled using two empirical scaling coefficients for pressure and mass flow. These collapsed the CFD predictions onto the experimental data across all available speedlines. While the generalizability of these coefficients remains uncertain, the concept of using corrected scales, rather than other methods, seems to capture the macroscopic discrepancies between CFD and experiments.
1. Introduction
Centrifugal pumps are critical components in various industries, including water distribution and aerospace propulsion, where the drive to maximize efficiency and reliability while minimizing costs and environmental impact is increasingly important. Addressing these challenges requires a multidisciplinary approach that integrates advanced numerical analyses, experimental validations, and innovative optimization techniques. Recent research has provided valuable insights into improving pump performance by optimizing key components, such as the impeller and diffuser. Elyamin et al. [1] demonstrated that a 7-blade impeller configuration reduces hydraulic losses by minimizing secondary flows, resulting in a performance improvement of approximately 3.2% in total head compared to 5- or 6-blade configurations. However, further increases in blade count were shown to offer diminishing returns due to increased blockage and reduced flow passages. Adjustments in blade angles have also been shown to enhance hydraulic performance by improving flow guidance and reducing incidence losses at the blade leading edge [2].
Complementing geometric optimization, recent studies have emphasized the importance of accurate turbulence modeling in predicting complex flow features in pumps. Zhou et al. [3] found that the SST k-omega turbulence model, especially when coupled with low-Reynolds number corrections, effectively predicts vortex core positions and flow separation in centrifugal pump diffusers. Further advancements in low-specific-speed centrifugal pumps have focused on expanding the high-efficiency operating range. Optimizing blade outlet width, angle, and wrap angle resulted in a 4.18% improvement in hydraulic efficiency [4], while research into side clearance effects demonstrated reduced pump head and efficiency due to the formation of secondary flow vortices, especially in semi-open impeller designs [5]. Wu et al. [6] optimized the hub contour of a high-loading centrifugal compressor using particle swarm optimization. CFD and experiments showed a 0.78% efficiency gain and improved stall margin, mainly due to better flow uniformity and reduced losses in the diffuser. Capurso et al. [7] evaluated a novel impeller design in double-suction pumps using CFD and experiments. The new configuration enhanced efficiency, improved flow symmetry, and reduced shaft loading, offering better hydraulic performance and energy savings.
Studies on cavitation and volute tongue geometry have demonstrated that targeted design modifications can significantly reduce radial forces and enhance overall pump performance. Coutier-Delgosha et al. [8] validated CFD simulations of cavitation onset and cavitation sheet formation, showing good agreement with experimental results. In parallel, Alemi et al. [9] examined the influence of volute tongue configurations using CFD and found that shorter tongues and larger cutwater gaps minimized radial forces. Notably, a tongue angle 5° smaller than the impeller’s outlet velocity angle reduced radial forces by approximately 40% at the design point.
Beyond external flow structures, internal components such as balance holes have also proven critical in maintaining operational stability. Research has shown that internal leakages and the strategic inclusion of balance holes can significantly reduce axial thrust, thus enhancing pump longevity and performance [10]. As an alternative approach to managing axial loads, the use of double-suction pump configurations has also been proposed [11].
Efficiency improvements have extended to pumps operating in reverse mode, where specific geometric refinements were introduced to optimize performance. Modifications such as rounding the blades’ leading edges and refining the hub/shroud interface led to measurable efficiency gains. Tests on these altered impellers revealed a maximum efficiency of 24.57% when functioning as a pump, and 22.02% in hydro turbine generator mode [12]. Advancements in diffuser design have similarly contributed to hydraulic performance. Wang et al. [13] demonstrated that the implementation of a vaned diffuser enhanced pressure recovery and reduced hydraulic losses, with pressure fluctuations decreasing further from the impeller outlet—indicating improved stability. Complementary work by Liu et al. [14] achieved a 4% increase in efficiency and an 8% rise in head through optimized diffuser geometry. Nonetheless, challenges remain. Cavitation-induced instabilities, particularly rotating cavitation, continue to generate severe force oscillations in centrifugal turbopumps [15]. Additionally, surface roughness has been identified as a critical factor affecting both efficiency and head, opening new possibilities for refinement in material selection and manufacturing processes [16]. To address these multifaceted issues, Kim et al. [17] integrated turbomachinery theory with advanced numerical analysis and optimization strategies, achieving notable improvements in both impeller and volute designs that surpassed initial performance expectations.
Other studies have employed genetic algorithms and CFD simulations, with significant pressure and head improvements observed. Guleren et al. [18] utilized a genetic algorithm (GA) coupled with computational fluid dynamics (CFD) to perform a multi-objective optimization of a centrifugal pump, focusing on the interaction between the impeller and diffuser. The optimized design achieved a head increase of approximately 25.74% under operating conditions, demonstrating significant improvements in performance due to the optimized impeller-diffuser interaction. Design optimization of a centrifugal pump with backward-curved blades using surrogate modeling and three-dimensional steady Reynolds-averaged Navier–Stokes (RANS) analysis. The study demonstrated that the optimized design led to enhanced hydraulic performance [19].
Numerical simulation, surrogate modeling, and genetic algorithms have enhanced the efficiency of residual heat removal pumps (RHRP), achieving an 8.34% increase compared to original simulations due to improved pressure distributions and reduced flow separation [20]. Multi-objective optimization techniques have also aimed to simultaneously increase efficiency and decrease the required net positive suction head (NPSHr) of centrifugal pumps, utilizing genetic algorithms and neural network modeling to identify design trade-offs for optimal performance [21].
Integrating artificial intelligence algorithms for pump design optimization has shown promising results in improving centrifugal pump performance. Gu et al. [22] study employed a multi-objective optimization approach for a centrifugal pump impeller, integrating a Kriging surrogate model with a multi-island genetic algorithm. The optimization process led to significant improvements in pump performance. Specifically, the optimized impeller design achieved a head increase of 6.73%, an efficiency enhancement of 3.85%, and a reduction in the net positive suction head required (NPSHr) by 3.4%. Another study used a modified particle swarm optimization (PSO) algorithm in conjunction with an artificial neural network (ANN) surrogate model. The ANN was trained using data from CFD simulations to predict pump performance based on design parameters, allowing for efficient exploration of the design space. The optimization resulted in a notable improvement in pump efficiency. The study reported an increase in efficiency at the design point by approximately 0.454% [23]. These innovative approaches, which consider multiple parameters and refine objective functions, offer valuable insights into enhancing pump efficiency and reducing operational costs. Zhou et al. [24] introduced an optimal hydraulic design method for centrifugal pump impellers, integrating two-dimensional hydraulic design theory, genetic algorithms (GA), and boundary vorticity flux diagnosis. This method, which involved designing and comparing five impellers with varied blade profiles using computational fluid dynamics (CFD), resulted in impellers that exhibited superior hydraulic performance, including higher efficiency and lower torque under design conditions. Shape optimization of a low-specific-speed centrifugal pump was also conducted using genetic algorithms and Bézier curves [25].
Additive manufacturing (AM) technology has emerged as a promising tool, particularly for space applications, offering advantages such as design flexibility, performance improvements, and reductions in production time and costs. Haleem at al. [26] study reviewed various materials used in AM processes, such as metals, polymers, and composites, and explored their impact on reducing waste and improving energy efficiency. It emphasized the role of AM in achieving sustainable operations across different industries, providing insights into emerging materials and methods that can enhance environmental benefits. Ngo et al. [27] presented a comprehensive review of 3D printing (additive manufacturing), covering the range of materials, methods, applications, and the challenges faced by the industry. It also addressed challenges related to material properties, process control, and cost, offering a detailed perspective on the future of 3D printing technologies. Xiong [28] explored the materials, applications, and development trends in additive manufacturing technology. The paper focused on advancements in materials used in AM, including the growing importance of multi-material and hybrid printing.
Preliminary studies on hydraulic components, such as closed impellers made from Inconel 625, have validated the geometrical accuracy of AM parts, demonstrating optimal printing orientations and minimal process defects. Adiaconitei et al. [29] explored the use of additive manufacturing (AM) for developing a closed pump impeller intended for mechanically pumped fluid loop systems. The study used AM techniques to design and produce an impeller, assessing the advantages of AM over traditional manufacturing methods, such as reduced material waste and the ability to create complex geometries. The results demonstrated the feasibility of using AM to produce high-performance pump components with improved efficiency and reduced lead time. Adiaconitei et al. [30] further investigated the manufacturing of a closed impeller using Selective Laser Melting (SLM) technology for fluid loop systems. The study focused on the specific AM technique, examining the quality, precision, and material properties of the impeller produced. The results showed that SLM AM enabled the creation of complex geometries, leading to improvements in performance, reduced material usage, and greater design flexibility for pump components in fluid loop systems. Comparisons between classical machined impellers and those produced using AM techniques showed minimal differences in pressure rise and mass flow rate, with AM titanium impellers exhibiting less than 1% variation [31]. These findings suggest that AM technologies hold great potential for producing high-performance centrifugal pumps for space applications, reducing limitations associated with conventional manufacturing methods.
While numerous studies have improved centrifugal pump performance through geometric optimization, turbulence modeling, and advanced manufacturing techniques, challenges remain in accurately predicting pump performance at small scales, where the interplay between Reynolds and Taylor numbers complicates flow behavior and loss estimation. These issues are particularly acute when validating CFD simulations against experimental data, as discrepancies can be significant across different operating regimes.
This paper is framed as a case study comparing CFD predictions with experimental measurements for small-scale centrifugal pumps. It presents an integrated and rapid methodology for pump design and evaluation, combining linear predesign techniques, three-dimensional fully viscous CFD-based optimization, and precision additive manufacturing for accelerated prototyping. The proposed approach addresses the persistent challenge of reconciling the CFD results with experimental measurements at small scales—where discrepancies are often amplified due to Reynolds number effects and manufacturing tolerances. A key aspect of this work is the tight and iterative connection between simulations and experiments, in contrast to traditional sequential workflows where design, testing, and analysis are performed in separate stages. This integration supports faster refinement and validation of the pump design.
The study also explores a simple empirical adjustment using two global scaling factors—for pressure and mass flow—that bring the CFD results into closer agreement with experimental data across the tested operating range. These scaling factors are purely empirical and are used to illustrate the consistent offset observed between CFD and experiment. This approach is intended as a diagnostic tool to explore potential sources of systematic deviation.
2. Materials and Methods
A methodology for defining the pump main components (closed impeller and associated volute) was developed following an optimization procedure previously described in [32]. Figure 1 shows the logical steps in designing, optimization, and evaluation of the AM oriented components. Subsequently, the AM pump components will be printed using Inconel 625 (Carpenter Additive, USA) and validated on a dedicated in-house test bench.
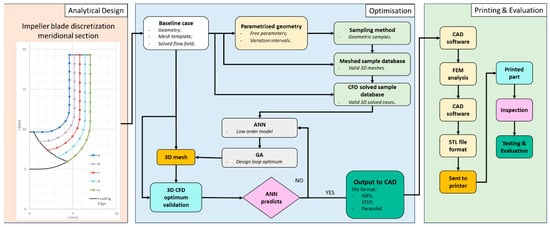
Figure 1.
Design and evaluation methodology for the AM pump components.
2.1. Design Considerations
Operating specifications of the pump are presented in Figure 2. The working fluid for this study was HFE-7200 (3M, USA) [33]. However, due to the environmental considerations and low availability of the HFE7200 working liquid, the experimental campaign was conducted using deionized water under similitude conditions. This substitution was also applied in the numerical simulations. While the use of deionized water is common in hydraulic testing, it is important to acknowledge the key differences in thermophysical properties between HFE-7200 and deionized water. At room temperature, HFE-7200 has a higher density (≈1430 kg/m3 vs. ≈997 kg/m3 for water) and a lower dynamic viscosity (≈0.65 mPa·s vs. ≈0.89 mPa s for water), as well as significantly lower specific heat capacity and thermal conductivity. These differences affect dimensionless parameters such as the Reynolds and Prandtl numbers, which influence flow behavior and heat transfer characteristics.
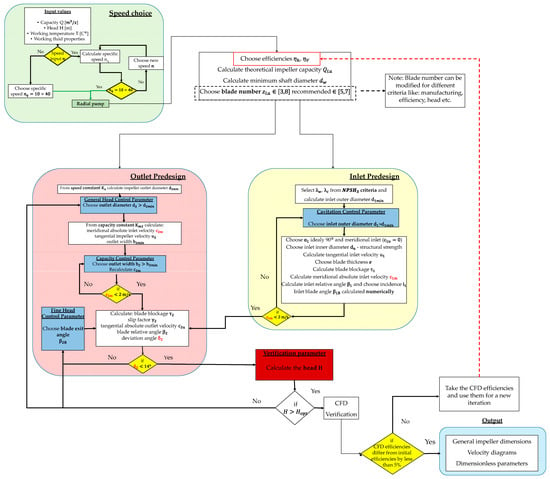
Figure 2.
Predimensioning algorithm for impeller design.
In this study, similitude was achieved by preserving Reynolds number similarity in the experimental and numerical setups, thereby ensuring that inertial and viscous forces governing the flow were appropriately scaled. Although thermal similitude could not be achieved due to differences in specific heat and conductivity, this limitation is acceptable because the primary focus was on hydraulic performance rather than thermal effects. As such, deionized water remains a valid substitute for replicating the fluid dynamic behavior of HFE-7200 within the scope of this study.
The closed impeller and volute geometries were pre-dimensioned using an in-house algorithm, which is based on classical pump theory and analytical formulations [33,34]. This algorithm calculates key geometric parameters and point coordinates that can be directly exported for CFD analysis. Figure 2 serves as a logical flowchart outlining the decision-making process and fundamental parameters involved in the predesign of a centrifugal pump impeller. Its structure follows a sequential logic rooted in established turbomachinery design principles, as detailed in the cited literature.
The predesign process is generally governed by the following key concepts:
- Hydraulic and energy requirements: the process begins with defining the desired head and flow rate, from which hydraulic power and specific speed are determined.
- Selection of specifics (Ns): the specific speed guides the choice of impeller type (radial, mixed-flow, or axial) and influences the selection of suitable geometric relationships.
- Velocity triangles and blade angles: blade angles at the inlet and outlet are estimated based on velocity triangles, ensuring efficient energy transfer and proper flow turning.
- Dimensioning of main geometry: core geometric features such as impeller diameter, blade height, and blade number are derived using empirical correlations and design charts, ensuring both hydraulic performance and structural feasibility.
- Loss considerations and corrections: empirical correction factors are incorporated to account for hydraulic losses, slip effects, and blockage, refining the initial estimates.
2.1.1. Impeller
For the impeller design, the most important parameter to choose is the rotational speed or specific speed, calculated using Equation (1).
where —Specific speed; —speed [rpm]; —volumetric flow or capacity [m3/s]; —head [m]
The first design of the impeller is evaluated by a fast (reduced complexity) CFD analysis where the impeller efficiencies are calculated and a second design iteration of impeller is generated. The process is repeated until the CFD efficiencies are lower than 5%. Figure 3 shows the extracts from the algorithm program developed in-house, where the discretization of the blade points can be seen. Subsequently, Figure 4 shows the final version of the closed impeller that was further analyzed using CFD and the printed model. Due to the proprietary nature of the design and to safeguard intellectual property rights, specific dimensions and detailed specifications of the closed impeller cannot be disclosed in this publication. The overall exterior dimension of the closed impeller is 39.7 mm with an axial height of 8 mm (without labyrinths at this stage of design).
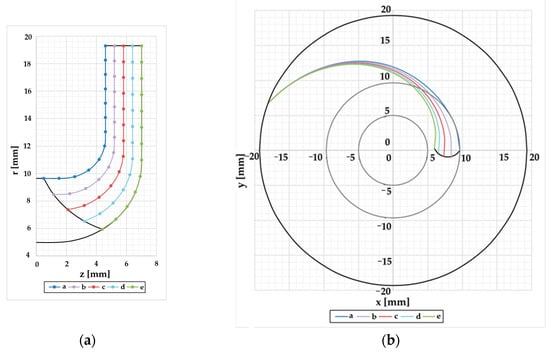
Figure 3.
Impeller blade discretization: (a) meridional section; (b) front view.
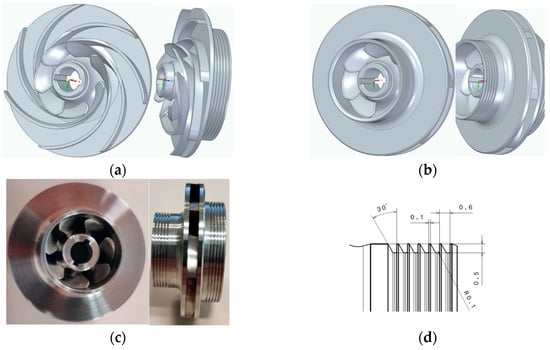
Figure 4.
3D model of the (a) impeller blade geometry representation; (b) closed impeller configuration; (c) In625 printed impeller; (d) Labyrinth groove profile.
An important issue to be taken into account is the clearance between the rotor and the casing. Through this clearance, the liquid can flow backwards from the high pressure at the rotor outlet and the low pressure of the inlet. For the labyrinth design, a tapered asymmetrical groove profile is used, as seen in Figure 4d. Those grooves create vortices and extract flow rate from the leakage flow.
2.1.2. Volute
The design of an associated volute is necessary in order to have a complete pump stage. The volute cross section area was designed by means of constant angular momentum, based on previous studies and on theory [34,35,36,37]. Thus, the double volute represents the best option for this type of pump as it can significantly reduce the radial forces acting on the impeller. As the bearings materials specific for space pumps (carbon or ceramics) do not have high mechanical strength, the radial loads should be as low as possible. Figure 5 presents the volute design, with an interior diameter of 41.1 mm, a channel width of 4.8 mm, and a channel height of 5.5 mm. The other dimensions, due to the proprietary nature of the design and to safeguard intellectual property rights, cannot be disclosed in this publication.
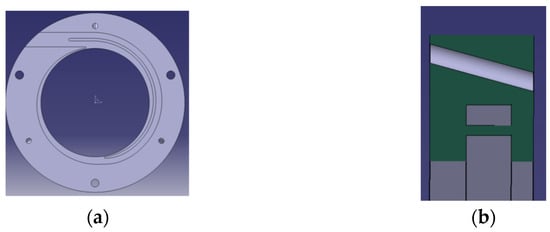
Figure 5.
Volute geometry: (a) top and (b) section view.
After all the design iterations were verified with CFD simulations and the efficiency was equal or higher than the imposed one, the final impeller was verified with the volute and the resulting geometries were considered as output from the theoretical design step.
2.2. CFD Case Setup
2.2.1. Labyrinth
To better understand the fluid flow behavior within the pump, the labyrinth section was studied separately due to its distinct resolution requirements. Both steady and unsteady CFD simulations were performed on the labyrinth section to identify the most suitable modeling strategy for the full pump analysis. For steady-state simulations, three turbulence models were evaluated: k-ε, SST, and Spalart–Allmaras (SA). For unsteady simulations, two approaches were considered: unsteady RANS (uRANS) and Large Eddy Simulation (LES).
Different meshes were used for the RANS and LES cases, reflecting their distinct modeling requirements. For the RANS simulations (both steady and unsteady), a coarser mesh was employed, with fewer elements and a more relaxed near-wall resolution. Inflation layers were still applied to capture boundary layer behavior, but the mesh was designed to operate with wall functions, targeting y⁺ values in the range of 1–300, depending on the turbulence model used. This allowed for computational efficiency while maintaining acceptable accuracy for the RANS-based models.
In contrast, the LES simulation required a significantly finer mesh to resolve large-scale turbulent structures and capture near-wall dynamics without relying on wall functions. A 60° periodic sector was modeled and 17 inflation layers were applied near the walls, with a first layer height of 10−5 mm and a growth rate of 1.27. This ensured a y⁺ value close to 1 throughout wall-bounded regions (Figure 6), in accordance with best practices for wall-resolved LES in complex internal flows [38,39]. The final LES mesh consisted of approximately 6.1 million elements.
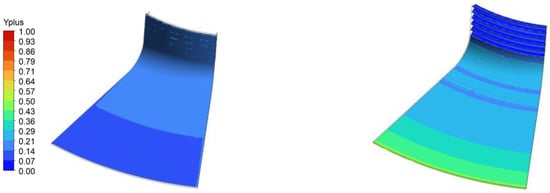
Figure 6.
The y+ distribution on the front labyrinth.
Figure 7 illustrates the detailed mesh topology near the walls in the LES case. The LES simulation used the WALE (Wall-Adapting Local Eddy-Viscosity) subgrid-scale model in ANSYS CFX, along with second-order spatial discretization and a second-order backward Euler scheme for time integration. The time step was selected to keep the Courant number below 1, ensuring both stability and accurate resolution of turbulent fluctuations.
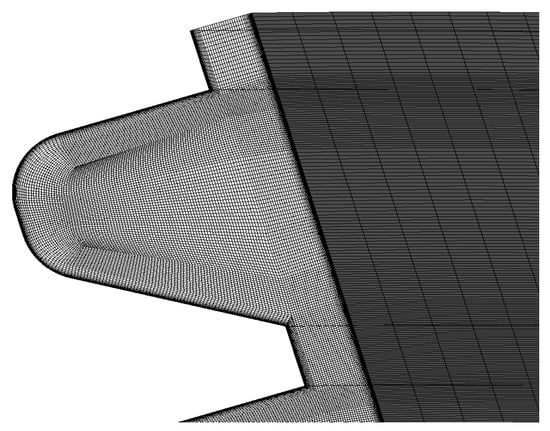
Figure 7.
Mesh representation for labyrinths.
All simulations applied smooth, adiabatic wall conditions, with boundary pressures set at 4.5 bara at the inlet and 1.5 bara at the outlet. The working fluid in the labyrinth analysis was HFE 7200, consistent with the properties listed in Table 1.

Table 1.
Pump operating specifications.
For the LES discretization, the approach presented in [40] was applied. A user-defined flow field function was implemented to estimate the proportion of calculated to modeled turbulent kinetic energy (TKE).
The integral length scale (ILS), see Figure 8, is approximately one order of magnitude larger than the representative cell size in the far field. Within the boundary layer, the flow is primarily modeled by the sub-grid scale, classifying this as a wall-modeled LES case. Figure 8a presents an iso-volume representing the region where 70% of the turbulent kinetic energy is resolved, with a color map illustrating the spatial distribution of the resolution percentage.
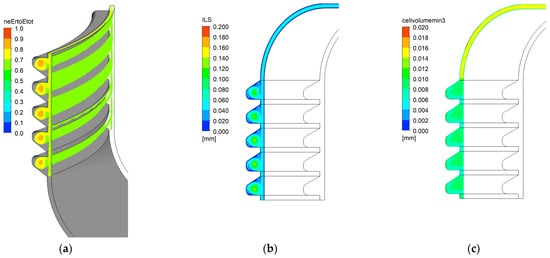
Figure 8.
Grid size justification for the LES simulation: (a) Eresolved/Etotal; (b) Integral Length Scale (local distribution); (c) Cubic root of the cell volume (local distribution).
2.2.2. Centrifugal Pump
The full pump simulations were performed using a coarser mesh, suitable for steady-state RANS modeling, due to the high computational cost associated with LES for the entire pump domain. Nevertheless, the RANS simulations were validated against experimental measurements to ensure reliability. The numerical simulations were conducted under steady-state conditions using the ANSYS CFX solver, with mesh generation carried out in ANSYS Meshing (ANSYS 2022 R2), following established best practices for turbomachinery simulations as outlined by Ferziger et al. [41] The RANS equations were solved using the standard k-ε turbulence model, widely used for turbomachinery applications due to its balance between accuracy and computational efficiency. A finite volume method was employed, with a second-order upwind scheme for convective terms and second-order central differencing for diffusive terms.
A grid independence study was performed for the computational domain of the impeller, including the labyrinth seal regions, to ensure that the numerical results were not sensitive to mesh resolution. Five different mesh densities were tested, ranging from 4.3 million to 11.98 million elements. The simulations were conducted at the nominal operating point of the centrifugal pump, which was selected as the design point for this analysis. The primary differences between mesh levels were in the volume mesh size within the blade passage and labyrinth cavities, as well as refinements in the inflation layers near walls to capture boundary layer effects more accurately. For the 9.22 million element mesh, the inflation mesh had 10 layers with a growth rate of 1.3.
Key output parameters—such as pressure distribution, velocity field, and hydraulic efficiency—were monitored and compared across the different mesh resolutions. The results for the 9.22 million and 11.98 million element meshes showed negligible variation (less than 1%), indicating that mesh convergence had been achieved. Therefore, Mesh 4 (9.22 million elements) was selected for subsequent simulations, as it provided an optimal balance between accuracy and computational cost (see Figure 9).
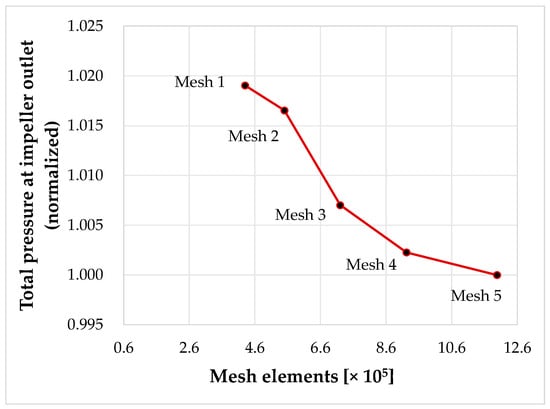
Figure 9.
Total pressure variation versus number of mesh elements.
The mesh representation for the entire domain is shown in Figure 10, which includes the mesh of the impeller, a section through it, and the volute mesh.
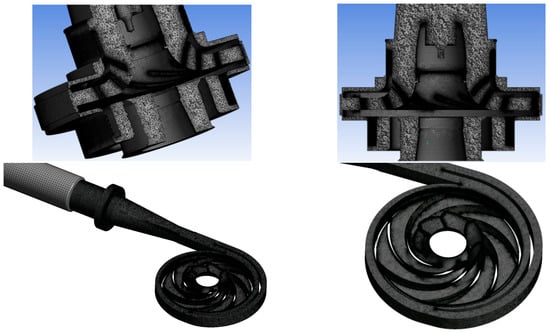
Figure 10.
Grid representation for the main components of the centrifugal pump.
These studies guided the grid resolution used in the full pump simulations. However, due to computational constraints, a formal mesh convergence study for the complete pump assembly was not carried out. As a result, some uncertainty remains in the global CFD predictions.
Therefore, the overall computational domain consisted of approximately 30 million elements. Figure 11 illustrates the computational domain along with the applied boundary conditions. At the inlet, a constant total pressure and temperature were imposed, while the outlet boundary condition was defined by varying flow rates along the operating line. No-slip, adiabatic wall conditions were applied throughout the domain. Stationary walls within the rotating domain were treated as counter-rotating to compensate for the impeller motion, and a Frozen Rotor interface was used to couple the impeller and volute domains [42]. To ensure consistency with the experimental setup, which was conducted under similitude conditions, deionized water was used as the working fluid [43].
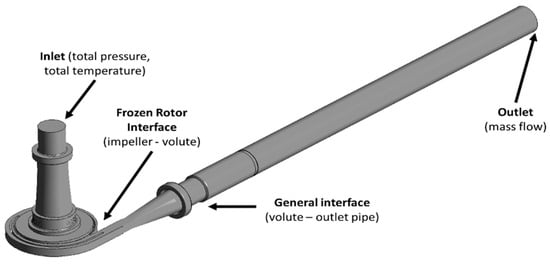
Figure 11.
Boundary conditions for the centrifugal pump.
A high-order advection scheme was imposed in all cases, with double precision. For convergence of the case, the RSM residuals (target below 10−5), domain imbalance (below 1%) and a monitoring point positioned on the outlet domain (stable variation of the pressure) were checked.
2.3. Experimental Setup
For the testing activities, the closed impellers were fitted into an in-house test bench that was designed to test and evaluate the hydraulic performance of the pumps, developed by COMOTI (Bucharest, Romania). The test bench allowed temperature control on the pump support and on the working fluid (both under vacuum conditions). The effective integration into the bench was performed with a dedicated pump demonstrator, a modular mechanical assembly that is capable of accommodating numerous geometries by using adapters. The test bench is presented in Figure 12. A National Instruments data acquisition system (DAQ) was used with LabView 2020 software for data interpretation. The DAQ was set to 10 parameters/s data recording. Pressure data were recorded from 13 sensors installed on the pump casing.
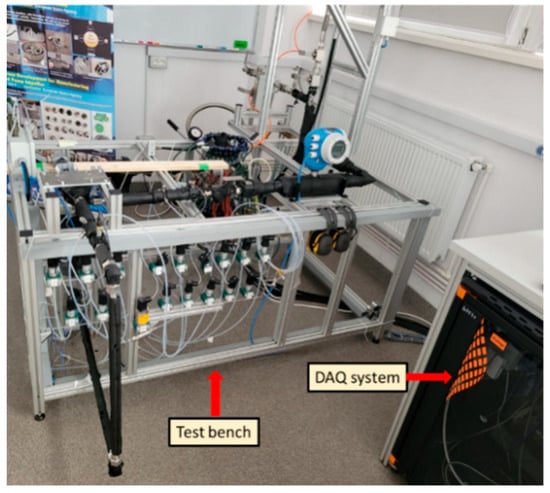
Figure 12.
In-house test bench [31].
A general overview of the experimental procedure followed during the pump testing is as follows:
- Assembly of the device under test (DuT)—The pump is carefully assembled, ensuring all components are correctly fitted and sealed to avoid any leaks during testing. Calibration of sensors and measurement devices is also performed at this stage to ensure accurate readings throughout the process.
- Filling the test bench with working fluid—The test bench is filled with the specified working fluid, ensuring proper circulation and venting of air to avoid any airlocks that might interfere with the performance measurements.
- Determining the required rotational speed—The pump is operated at different rotational speeds, in line with the test conditions. These speeds are selected based on the operational parameters and the objectives of the study, ensuring that each test point reflects the desired performance range.
- Recording data at each operational point—Data, including flow rates, pressures, and power consumption, are recorded for each operational point.
- Emptying the test bench—After completing each set of measurements, the working fluid is carefully drained from the test bench. This ensures that no fluid remains in the system, preventing contamination or cross-contamination of fluids in subsequent tests.
- Disassembling the DuT—Once all necessary data have been collected, the pump is disassembled for inspection and cleaning. This step ensures that no damage occurs to the components during the testing process and allows for any necessary maintenance before performing additional tests.
3. Results
3.1. Labyrinth Simulations Using Different Turbulence Models
Several turbulence models (k-ε, SST, and Spalart–Allmaras) were used in the simulations to compare their performance and evaluate their suitability for capturing the specific flow phenomena in the pump. Figure 13 illustrates the wall shear distribution in the labyrinth from steady-state simulations. Among the three models, only the Spalart–Allmaras model predicted Taylor–Couette-like structures, prompting further investigation using unsteady RANS (uRANS) and Large Eddy Simulation (LES). The uRANS study with the SST model did not reveal this flow pattern, and the flow parameters showed no differences between steady-state and unsteady SST simulations. Additionally, a LES was performed (Figure 14), with fine geometrical discretization, which revealed flow patterns similar to those of the SST model and no significant Taylor–Couette-like structures. This suggests that the initial finding with the Spalart–Allmaras model may have been an anomaly or specific to its characteristics.
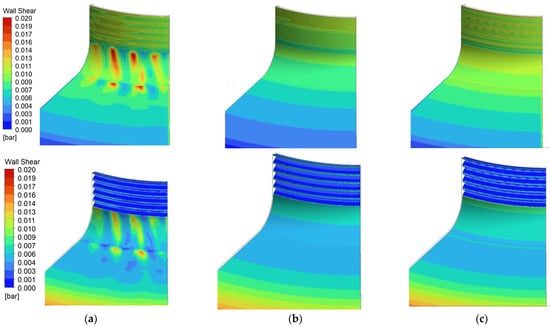
Figure 13.
Wall shear distribution on the front labyrinth—steady case: (a) SA; (b) k-epsilon; (c) SST.
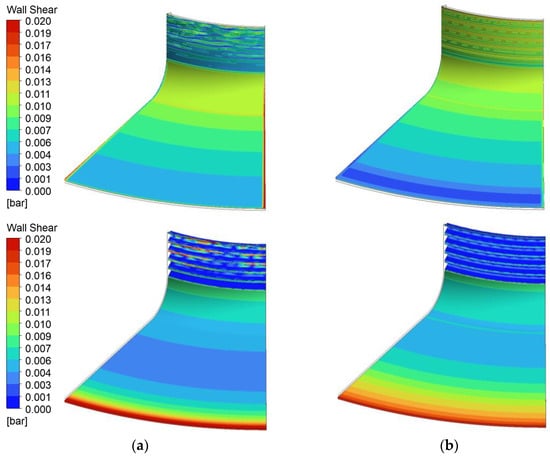
Figure 14.
Wall shear distribution on the front labyrinth—unsteady case. (a) LES; (b) uRANS.
In estimating the seal mass flow (Figure 15), the k-epsilon model exceeds the LES and all other RANS models by approximately 20%. However, for the torque-to-mass flow ratio, the k-epsilon model is closest to the LES values. All models tend to overestimate these values when compared to the LES results. This suggests that while LES provides a more accurate representation of the physical processes, the RANS models tend to predict higher values for torque and shear stress on the rotating wall.
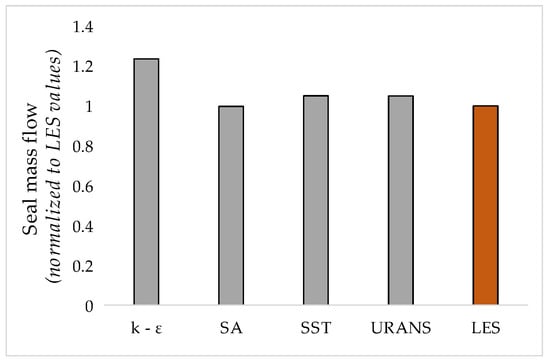
Figure 15.
Seal mass flow obtained for the steady and unsteady cases.
Although the torque (Figure 16) and shear stress on the rotating wall (Figure 17) were significantly lower in the LES simulation compared to all RANS simulations, the LES results were in better agreement with all models except the k-epsilon model for the other integrated parameters. All values are presented relative to the reference LES value, which is set as 1 and considered the most accurate in the absence of experimental data. The colors are used only to differentiate the LES case from the RANS cases.
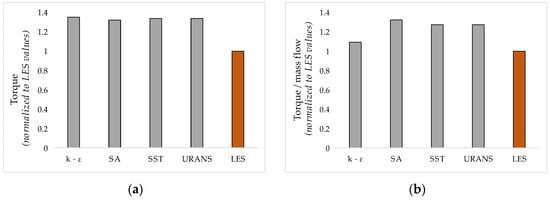
Figure 16.
Torque area integrated: (a) over the rotating labyrinth and (b) over the stationary casing.
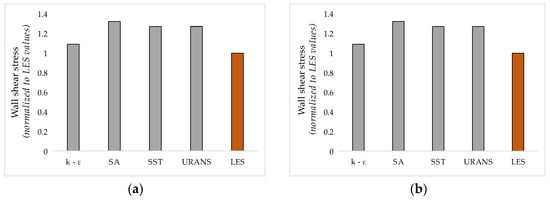
Figure 17.
Wall shear stress aria integrated: (a) over the rotating labyrinth and (b) over the stationary casing.
The wall shear stress was integrated over both the stationary and rotating surfaces of the domain. For the stationary casing, the wall shear stress predictions from most turbulence models were fairly close to the LES results. This suggests that the shear stress on the stationary casing is less sensitive to the choice of turbulence model, with the notable exception of the k-epsilon model, which deviated significantly from the LES results, indicating a less accurate prediction of wall shear stress on the stationary casing.
This suggests a common tendency among RANS models to predict higher frictional forces on the rotating surfaces. Despite this general trend, the k-epsilon model was the closest to the LES results, with only a 10% higher shear stress. Among the RANS models, it displayed the lowest wall shear stress on the rotating labyrinth wall. In terms of integrated parameters, the relationship between mass flow and shear stress reveals some interesting discrepancies. Although the k-epsilon model displayed the lowest shear stress among the RANS models, it overestimated the mass flow by approximately 20%. Overall, while k-ε predicted the lowest shear stress of the RANS models, this does not explain the overestimation of mass flow, since LES results show even lower shear stress values yet also predict low mass flows rates—consistent with the other RANS models tested. The comparative analysis of wall shear stress between the LES and various RANS models reveals critical insights. LES provides a more reliable and accurate prediction of wall shear stress and associated flow parameters. Most RANS models, particularly k-epsilon, may be overestimating frictional forces and energy dissipation within the labyrinth.
The observed discrepancies between the computational models highlight the need for further experimental validation to improve model accuracy. Consequently, additional RANS simulations were performed for the entire geometry and compared with experimental data. Although the LES model is known for its higher accuracy and reliability in predicting flow behavior and associated stresses, the computational cost for such simulations would be prohibitively high for this application.
3.2. CFD and Experimental Data Comparison
To ensure a comprehensive evaluation of centrifugal pump performance, the manufactured pump components were 3D scanned to identify deviations introduced during the manufacturing process. These deviations were incorporated into the numerical simulations, and a comparative study was conducted at the duty point to assess the impact of surface roughness. Three surface conditions were considered: an ideal case (0 μm), the measured average for In625 (16 μm), and a worst-case scenario (40 μm).
Additional parameters varied in the simulations included inlet turbulence intensity levels (1%, 5%, and 10%) and the choice of turbulence model. Figure 18 presents the pump performance in terms of static pressure distribution and total pressure at the outlet. To further evaluate the influence of the turbulence model in the labyrinth area, the ratio of seal leakage flow to useful flow is also compared (Figure 18c).
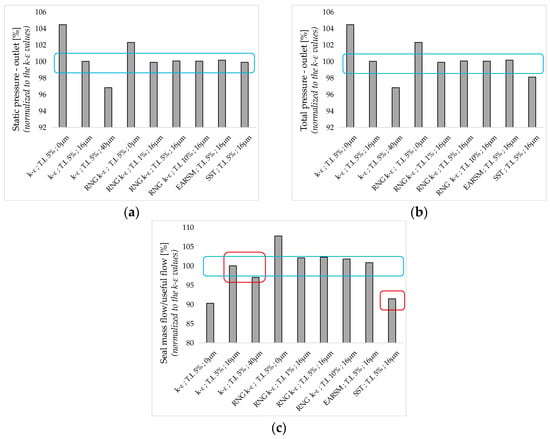
Figure 18.
Comparison of pump performances obtained using different turbulence models, surface roughness and inlet turbulent intensity: (a) Static pressure outlet; (b) Total pressure outlet and (c) Seal mass flow/useful flow.
Surface roughness plays an important role in estimating both seal leakage flow and total/static pressure at the outlet. For the k-epsilon model, three surface roughness values were applied (0 μm, 16 μm, and 40 μm), resulting in performance differences of up to 7%. Additionally, the influence of inlet turbulence intensity (TI) was evaluated through sensitivity tests using values typically encountered in turbomachinery applications (e.g., 1%, 5%, and 10%). The results, obtained using the RNG (Renormalization Group) k-epsilon model, showed negligible differences in key flow parameters. This insensitivity is attributed to the dominance of geometry-induced turbulence generation—particularly in the blade passages and labyrinth seals—where local shear layers and strong flow acceleration rapidly overwhelm any differences in upstream TI. This indicates that inlet turbulence intensity is not a critical parameter for this particular case. Similar conclusions have been reported in the literature. For instance, Hutton and Casey [44] noted that, in internal turbomachinery applications, the inlet TI has minimal impact due to rapid turbulence development within the domain. Wilcox [45] similarly emphasized that in high-shear flows, the influence of boundary conditions on turbulence diminishes quickly as the flow becomes fully turbulent.
In terms of turbulence model influence, the SST model predicted higher pressure losses and lower head values compared to all other models. To better approximate the physical behavior, k-epsilon model variants incorporating rotation and curvature compensation terms were also investigated. For the RNG model, similar values were obtained for the static and total pressure distribution at the outlet, and in this case, wall roughness had minimal influence on pump performances. The standard k-epsilon formulation appeared to be the most conservative in predicting secondary flows and total pressure, making it the most credible model for this study. The EARSM (Explicit Algebraic Reynolds Stress Model) produced results closely aligned with the k-epsilon model across all key parameters.
Based on this findings, subsequent numerical simulations were conducted using a wall roughness of 16 µm, a turbulence intensity of 5%, and the k-epsilon turbulence model. Figure 19 illustrates the y+ distribution along the impeller blades, indicating a maximum value of approximately 30 near the trailing edge. Near the leading edge, the y+ value also approaches 30, although this value is not uniform along the blade height. Despite these variations, the y+ values remain within the acceptable range recommended for the k-epsilon model, ensuring the validity of the simulation results.
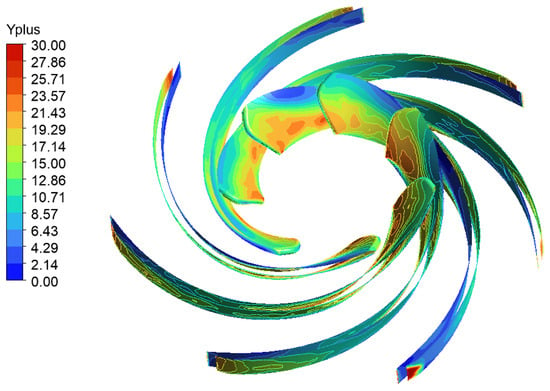
Figure 19.
The y+ distribution on the impeller blades.
Figure 20 and Figure 21 present results for the nominal point at maximum rotational speed. Figure 20a shows the pressure distribution, revealing a uniform pattern at the impeller exit with no signs of flow detachment on the impeller blades. Figure 20b provides further detail, confirming these observations and highlighting the stability of the flow characteristics at maximum rotational speed. Figure 21a shows that the velocity in the front labyrinth is lower compared to other regions of the impeller. The velocity profile gradually increases as the fluid approaches the impeller blades, indicating acceleration of the flow. In contrast, Figure 21b reveals a higher velocity distribution in the back labyrinth. This increased velocity is driven by higher pressure and the kinetic energy transferred to the fluid by the impeller blades, resulting in a more dynamic flow profile in that region.
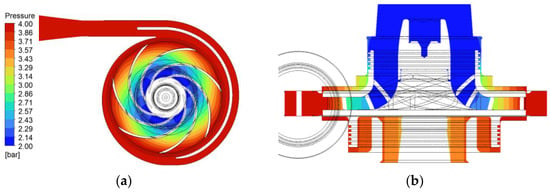
Figure 20.
Static pressure distribution (a) across mid-span; (b) labyrinth.

Figure 21.
Velocity in stationary frame back flow region in (a) top labyrinth and (b) bottom labyrinth (very low, because of seal).
Backflow in both labyrinths is minimal, indicating effective flow management within the impeller system. The minimal backflow results in a small recirculation zone in the front labyrinth region, ensuring stable and predictable flow patterns. The limited extent of this recirculation does not significantly affect the overall performance of the impeller, thereby contributing to the efficient operation of the centrifugal system.
The following results present the total pressure variation and torque for three operating speeds corresponding to the studied centrifugal pump. Figure 22a, Figure 23a and Figure 24a illustrate the total pressure distribution across the pump at different rotational speeds, highlighting the influence of the volute on the pump’s performance. A significant pressure drop is observed in the volute and outlet duct as the mass flow rate increases. This behavior is consistent across all rotational speeds, indicating that higher flow rates lead to greater pressure losses due to increased friction and flow separation within the volute and outlet duct. The torque results (Figure 22b, Figure 23b and Figure 24b) exhibit a typical trend, with torque increasing alongside mass flow rate. This outcome is expected, as higher flow rates require more energy input from the impeller to sustain the flow, thereby increasing torque demand. This trend remains consistent across the different rotational speeds, confirming the direct relationship between mass flow rate and torque in centrifugal pumps operation.
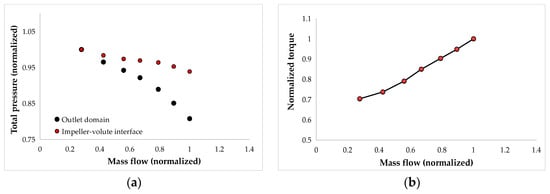
Figure 22.
Speedline map 80% from the nominal speed for (a) total pressure; (b) torque.
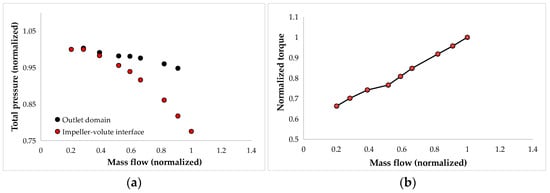
Figure 23.
Speedline map 93% from the nominal speed for (a) total pressure; (b) torque.
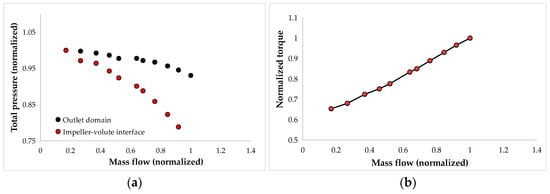
Figure 24.
Speedline map at nominal speed for (a) total pressure; (b) torque.
Figure 25 shows a comparison between the CFD results and experimental data at three rotational speeds, highlighting notable discrepancies, especially at the nominal speed and higher mass flow rates. To explore the consistency of these deviations, simple empirical scaling factors were applied uniformly across the performance map: mass flow was multiplied by 0.85 and static pressure by 0.96 (Figure 26). This empirical adjustment reduced the global offset between CFD and experimental results, allowing a better visual alignment of trends across the speedlines. It is important to note that these scaling factors are not derived from a physical model and should not be interpreted as validated corrections. These adjustments are used solely to illustrate the consistent offset observed between simulation and experiment and do not represent a validated correction. The intent is to explore the nature of the mismatch, not to imply physical accuracy or general applicability of the scaling factors.
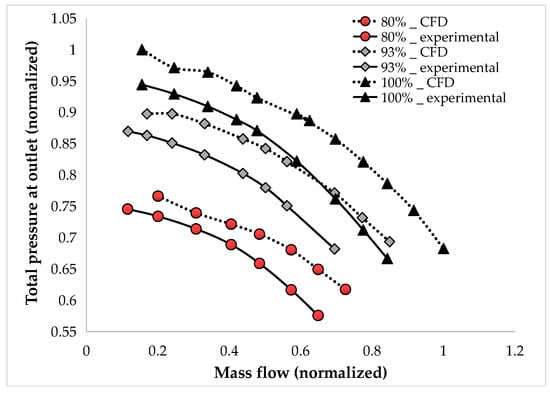
Figure 25.
Comparison between experimental and native CFD analysis.
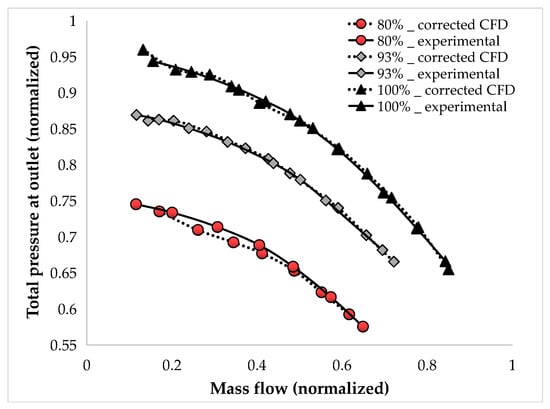
Figure 26.
Comparison between experimental and empirical adjustments of CFD analysis.
The majority of pressure losses occur within the volute and outlet pipe, where surface roughness has a substantial impact on the accuracy of pressure loss estimations. Despite variations in inlet turbulence intensity (up to 10%), pump performance remains largely unaffected, indicating a low sensitivity to this parameter. Measurements of total pressure at the rotor and pipe outlets confirm that losses in the passive components (volute and outlet pipe) increase with mass flow. The observed linear relationship between mass flow and pressure losses suggests that these losses are primarily kinematic in nature, rather than dynamic.
It is important to emphasize that these scaling factors are purely empirical and were never intended—or presented—as universal corrections. They are not derived from a physical model and do not constitute a validated adjustment method. Nonetheless, the fact that a single linear factor per axis can align the entire performance map suggests the existence of a systematic, possibly numerical, underlying cause. These adjustments are intended solely to illustrate the nature of the observed mismatch between simulation and experiment—not to imply physical accuracy or general applicability. Future work will focus on investigating the origin of this behavior and developing physically grounded methods to address the discrepancy at its source.
4. Conclusions
This study presents a case study comparing the CFD results with experimental data for small-scale centrifugal pumps. A fast and efficient method was used for design and testing, combining early stage design tools, 3D CFD optimization, and rapid prototyping with high-precision 3D printing. The approach helped address common challenges in small-scale pumps, especially the combined influence of Reynolds and Taylor numbers on labyrinth performance, which strongly affect efficiency and losses. Important factors such as labyrinth shape, surface roughness, turbulence models, and inlet flow conditions were carefully studied to understand their impact on both simulations and experimental outcomes.
While mesh sensitivity was analyzed in critical subcomponents (the impeller and labyrinth), a full grid convergence study of the entire pump assembly was not conducted. This limitation will be addressed in future work through a more comprehensive mesh refinement analysis to enhance the reliability of global performance predictions.
Results showed that LES provides more accurate predictions of wall shear stress within the labyrinth, while most RANS models, particularly the k-epsilon model, tend to over-predict frictional effects. Among the RANS models, the standard k-epsilon formulation proved to be the most credible due to its conservative and consistent performance.
Surface roughness significantly affected seal flow and outlet pressure, while inlet turbulence intensity had a negligible impact, likely due to dominant geometry-induced turbulence. The SST model, though more dissipative, highlighted the sensitivity of pressure predictions to turbulence modeling choices.
Through comparative analysis of CFD simulations and experimental data, significant discrepancies were identified, particularly in the labyrinth region. Using both RANS and LES for labyrinth flow and RANS for the entire pump assembly, the simulations successfully captured key performance metrics. The results emphasized the critical roles of surface roughness and turbulence modeling in performance predictions. Notably, the application of simple scaling coefficients for mass flow and pressure successfully aligned the CFD results with experimental measurements across all speedlines.
Although the transferability of the scaling coefficients to other pump configurations remains uncertain, the concept of correcting the CFD results through scaling factors—rather than more complex methods—offers a practical solution to mitigate macroscopic discrepancies between numerical predictions and experimental data. This insight provides a valuable framework for the future design, prototyping, and optimization of small-scale pumps.
Author Contributions
Conceptualization, V.D., C.D., I.S.V. and R.M.; methodology, O.D., V.D., C.D., I.S.V. and R.M.; software, O.D., V.D. and I.S.V.; validation, O.D., V.D. and C.D.; formal analysis, O.D., V.D. and I.S.V.; investigation, O.D., V.D. and C.D.; resources, O.D., V.D. and R.M.; data curation, O.D., V.D., C.D. and I.S.V.; writing—original draft preparation, O.D., C.D. and I.S.V.; writing—review and editing, V.D. and R.M.; visualization, O.D. and V.D.; supervision, R.M., project administration, R.M., funding acquisition, R.M. All authors have read and agreed to the published version of the manuscript.
Funding
The presented work was performed under “NUCLEU” programme, in the frame of the National Research, Development, and Innovation Plan 2022–2027, carried out with the support of the Romanian Ministry of Research Innovation and Digitalization, project no. PN23.12.06.01 and “Development of a Closed Impeller Using Advanced Manufacturing”, contract no 4000137441/22/NL/MG/ces, funded by the European Space Agency (ESA).
Institutional Review Board Statement
Not applicable.
Informed Consent Statement
Not applicable.
Data Availability Statement
The data presented in this study are available on request from the corresponding author. Due to the contract agreement between COMOTI and funding agency, the research activities and data presented in this paper will be presented in an Executive Summary. Report and will be available for public use, after project closure.
Conflicts of Interest
The authors declare no conflicts of interest. The funders had no role in the design of the study; in the collection, analyses, or interpretation of data; in the writing of the manuscript; or in the decision to publish the results.
Abbreviations
The following abbreviations are used in this manuscript:
| RANS | Reynolds-Averaged Navier–Stokes |
| EARSM | Explicit Algebraic Reynolds Stress Model |
| LES | Large Eddy Simulations |
| CFD | Computational Fluid Dynamics |
| AM | Additive Manufacturing |
| RNG | Renormalization Group |
| SST | Shear Stress Transport |
| SA | Spalart–Allmaras |
| CAD | Computer-aided design |
| NPSHr | Net Positive Suction Head |
| TKE | Turbulent Kinetic Energy |
| ILS | Integral Length Scale |
References
- Elyamin, G.R.A.; Bassily, M.A.; Khalil, K.Y.; Gomaa, M.S. Effect of impeller blades number on the performance of a centrifugal pump. Alex. Eng. J. 2019, 58, 39–48. [Google Scholar] [CrossRef]
- Han, X.; Kang, Y.; Li, D.; Zhao, W. Impeller Optimized Design of the Centrifugal Pump: A Numerical and Experimental Investigation. Energies 2018, 11, 1444. [Google Scholar] [CrossRef]
- Zhou, L.; Bai, L.; Li, W.; Shi, W.; Wang, C. PIV validation of different turbulence models used for numerical simulation of a centrifugal pump diffuser. Eng. Comput. 2018, 35, 2–17. [Google Scholar] [CrossRef]
- Pei, J.; Wang, W.; Yuan, S.; Zhang, J.F. Optimization on the impeller of a low-specific-speed centrifugal pump for hydraulic performance improvement. Chin. J. Mech. Eng. 2016, 29, 992–1002. [Google Scholar] [CrossRef]
- Ayad, A.F.; Abdalla, H.M.; Aly, A.A.E.A. Effect of semi-open impeller side clearance on the centrifugal pump performance using CFD. Aerosp. Sci. Technol. 2015, 47, 247–255. [Google Scholar] [CrossRef]
- Wu, Y.; Li, Q.; Yuan, H.; Li, Z.; Zhou, S.; Han, G.; Lu, X. Performance Improvement of a High Loading Centrifugal Compressor with Vaned Diffuser by Hub Contour Optimization. Aerospace 2024, 11, 246. [Google Scholar] [CrossRef]
- Capurso, T.; Bergamini, L.; Torresi, M. Performance analysis of double suction centrifugal pumps with a novel impeller configuration. Energy Convers. Manag. X 2022, 14, 100227. [Google Scholar] [CrossRef]
- Coutier-Delgosha, O.; Fortes-Patella, R.; Hofmann, M.; Stoffel, B.; Reboud, J.L. Experimental and Numerical Studies in a Centrifugal Pump With Two-Dimensional Curved Blades in Cavitating Condition. J. Fluids Eng. 2003, 125, 970–978. [Google Scholar] [CrossRef]
- Alemi, H.; Nourbakhsh, S.A.; Raisee, M.; Najafi, A.F. Effect of the volute tongue profile on the performance of a low specific speed centrifugal pump. Proc. Inst. Mech. Eng. Part A J. Power Energy 2015, 229, 210–220. [Google Scholar] [CrossRef]
- Babayigit, O.; Ozgoren, M.; Aksoy, M.H.; Kocaaslan, O. Experimental and CFD investigation of a multistage centrifugal pump including leakages and balance holes. Desalination Water Treat. 2017, 67, 28–40. [Google Scholar] [CrossRef]
- Fathi, M.; Raisee, M.; Nourbakhsh, S.A.; Arani, H.A. The effect of balancing holes on performance of a centrifugal pump: Numerical and experimental investigations, 29th IAHR Symposium on Hydraulic Machinery and Systems. IOP Conf. Ser. Earth Environ. Sci. 2019, 240, 032017. [Google Scholar] [CrossRef]
- Derakhshan, S.; Mohammadi, B.; Nourbakhsh, A. Efficiency Improvement of Centrifugal Reverse Pumps. ASME J. Fluids Eng. 2009, 131, 021103. [Google Scholar] [CrossRef]
- Wang, K.; Jing, Y.; He, X.; Liu, H. Efficiency improvement and evaluation of a centrifugal pump with vaned diffuser. Adv. Mech. Eng. 2019, 11, 1–12. [Google Scholar] [CrossRef]
- Liu, Y.-Y.; Yang, G.; Xu, Y.; Peng, F.; Wang, L.-Q. Effect of space diffuser on flow characteristics of a centrifugal pump by computational fluid dynamic analysis. PLoS ONE 2020, 15, e0228051. [Google Scholar] [CrossRef]
- Valentini, D.; Pace, G.; Pasini, A.; Hadavandi, R.; D’Agostino, L. Experimental Characterization of Unsteady Forces Triggered by Cavitation on a Centrifugal Pump. Int. J. Turbomach. Propuls. Power 2018, 3, 13. [Google Scholar] [CrossRef]
- He, X.; Jiao, W.; Wang, C.; Cao, W. Influence of Surface Roughness on the Pump Performance Based on Computational Fluid Dynamics. IEEE Access 2019, 7, 105331–105341. [Google Scholar] [CrossRef]
- Kim, J.H.; Lee, H.C.; Choi, Y.-S.; Yoon, J.-Y.; Kim, S. Design techniques to improve the performance of a centrifugal pump using CFD. J. Mech. Sci. Technol. 2015, 29, 215–225. [Google Scholar] [CrossRef]
- Guleren, K. Automatic optimization of a centrifugal pump based on impeller–diffuser interaction. Proc. Inst. Mech. Eng. Part A J. Power Energy 2018, 232, 1004–1018. [Google Scholar] [CrossRef]
- Heo, M.W.; Ma, S.-B.; Shim, H.S.; Kim, K.Y. High-efficiency design optimization of a centrifugal pump. J. Mech. Sci. Technol. 2016, 30, 3917–3927. [Google Scholar] [CrossRef]
- Wang, W.; Yuan, S.; Pei, J.; Zhang, J. Optimization of the diffuser in a centrifugal pump by combining response surface method with multi-island genetic algorithm. Proc. Inst. Mech. Eng. Part E J. Process Mech. Eng. 2017, 231, 191–201. [Google Scholar] [CrossRef]
- Safikhani, H.; Khalkhali, A.; Farajpoor, M. Pareto based multi-objective optimization of centrifugal pumps using CFD, Neural networks and genetic algorithms. Eng. Appl. Comput. Fluid Mech. 2011, 5, 37–48. [Google Scholar] [CrossRef]
- Gu, Y.D.; Pei, J.; Yuan, S.Q.; Zhang, J.F.; Wang, W.J. Multi-objective optimization of centrifugal pump impeller based on kriging model and multi-island genetic algorithm. In Proceedings of the 16th International Symposium on Transport Phenomena and Dynamics of Rotating Machinery, Honolulu, HI, USA, 10–15 April 2016. [Google Scholar]
- Bashiri, M.; Derakhshan, S.; Shahrabi, J. Design Optimization of a Centrifugal Pump Using Particle Swarm Optimization Algorithm. Int. J. Fluid Mach. Syst. 2019, 12, 322–331. [Google Scholar] [CrossRef]
- Zhou, X.; Zhang, Y.X.; Ji, Z.L.; Hou, H.C. The Optimal Hydraulic Design of Centrifugal Impeller Using Genetic Algorithm with BVF. Int. J. Rotating Mach. 2014, 2014, 845302. [Google Scholar] [CrossRef]
- An, Z.; Zhounian, L.; Peng, W.; Linlin, C.; Dazhuan, W. Multi-objective optimization of a low specific speed centrifugal pump using an evolutionary algorithm. Eng. Optim. 2016, 48, 1251–1274. [Google Scholar] [CrossRef]
- Haleem, A.; Javaid, M.; Rab, S.; Singh, R.P.; Suman, R.; Kumar, L. Significant potential and materials used in additive manufacturing technologies towards sustainability. Sustain. Oper. Comput. 2023, 4, 172–182. [Google Scholar] [CrossRef]
- Ngo, T.D.; Kashani, A.; Imbalzano, G.; Nguyen, K.T.Q.; Hui, D. Additive manufacturing (3D printing): A review of materials, methods, applications and challenges. Compos. Part B Eng. 2018, 143, 172–196. [Google Scholar] [CrossRef]
- Xiong, S.L. Materials, Application Status and Development Trends of Additive Manufacturing Technology. Mater. Trans. 2020, 61, 1191–1199. [Google Scholar] [CrossRef]
- Adiaconitei, A.; Vintila, I.S.; Mihalache, R.; Paraschiv, A.; Frigioescu, T.; Vladut, M.; Pambaguian, L. A Study on Using the Additive Manufacturing Process for the Development of a Closed Pump Impeller for Mechanically Pumped Fluid Loop Systems. Materials 2021, 14, 967. [Google Scholar] [CrossRef]
- Adiaconitei, A.; Vintila, I.S.; Mihalache, R.; Paraschiv, A.; Frigioescu, T.F.; Popa, I.F.; Pambaguian, L. Manufacturing of Closed Impeller for Mechanically Pump Fluid Loop Systems Using Selective Laser Melting Additive Manufacturing Technology. Materials 2021, 14, 5908. [Google Scholar] [CrossRef]
- Popa, I.F.; Dobromirescu, C.; Vintila, I.S.; Tinca, I.; Mihai, D.; Canache, A.M.; Crunteanu, D.E. Hydraulic Performance Comparison of Centrifugal Closed Impellers Fabricated by Means of Additive Manufacturing and Classical Machining for Space Active Thermal Control Systems of Satellites. Appl. Sci. 2024, 14, 9448. [Google Scholar] [CrossRef]
- Drăgan, V.; Dumitrescu, O.; Dobromirescu, C.; Popa, I.F. Satellite Thermal Management Pump Impeller Design and Optimization. Inventions 2024, 9, 54. [Google Scholar] [CrossRef]
- Gülich, J.F. Centrifugal Pumps; Springer: Berlin/Heidelberg, Germany, 2014. [Google Scholar] [CrossRef]
- Lobanoff, V.S.; Ross, R.R. Centrifugal Pumps Design and Application, 2nd ed.; Gulf Professional Publishing: Oxford, UK, 1992; ISBN 978-0-08-050085-0. [Google Scholar] [CrossRef]
- Pumps, S. Centrifugal Pump Handbook, 3rd ed.; Butterworth-Heinemann: Oxford, UK, 2010; ISBN 978-0-7506-8612-9. [Google Scholar] [CrossRef]
- Yang, S.S.; Kong, F.Y.; Chen, B. Research on Pump Volute Design Method Using CFD. Int. J. Rotating Mach. 2011, 2011, 137860. [Google Scholar] [CrossRef]
- Dehghan, A.A.; Shojaeefard, M.H. Experimental and numerical optimization of a centrifugal pump volute and its effect on head and hydraulic efficiency at the best efficiency point. Proc. Inst. Mech. Eng. Part C J. Mech. Eng. Sci. 2022, 236, 4577–4598. [Google Scholar] [CrossRef]
- Bose, S.T.; Park, G.I. Wall-Modeled Large-Eddy Simulation for Complex Turbulent Flows. Annu. Rev. Fluid Mech. 2018, 50, 535–561. [Google Scholar] [CrossRef] [PubMed]
- Salim, S.M.; Cheah, S.C. Wall y+ strategy for dealing with wall-bounded turbulent flows. Int. MultiConf. Eng. Comput. Sci. 2009, 2, 2165–2170. [Google Scholar]
- Gerasimov, A. Quick Guide to Setting Up LES-type Simulations. European Technology Group ANSYS Sweden AB. Available online: https://www.tfd.chalmers.se/~lada/comp_turb_model/postscript_files/Quick_Guide_to_Setting_Up_LES_version_1.4_for_Lars.pdf (accessed on 12 November 2024).
- Ferziger, J.H.; Perić, M. Computational Methods for Fluid Dynamics, 3rd ed.; Springer: Berlin/Heidelberg, Germany, 2002. [Google Scholar] [CrossRef]
- Li, W.G. Effects of interface model on performance of a vortex pump in CFD simulations. Int. J. Fluid Eng. 2024, 1, 013901. [Google Scholar] [CrossRef]
- Guo, R.; Li, X.; Li, R. Multi-objective optimization design in a centrifugal pump volute based on an RBF neural network and genetic algorithm. Adv. Mech. Eng. 2023, 15, 16878132231160390. [Google Scholar] [CrossRef]
- Hutton, A.G.; Casey, M.V. Quality and trust in industrial CFD—A European initiative. In Proceedings of the 39th Aerospace Sciences Meeting and Exhibit, Reno, NV, USA, 8 January 2001. [Google Scholar] [CrossRef]
- Wilcox, D. Turbulence Modeling for CFD, 3rd ed.; DCW industries: La Canada, CA, USA, 2006. [Google Scholar]
Disclaimer/Publisher’s Note: The statements, opinions and data contained in all publications are solely those of the individual author(s) and contributor(s) and not of MDPI and/or the editor(s). MDPI and/or the editor(s) disclaim responsibility for any injury to people or property resulting from any ideas, methods, instructions or products referred to in the content. |
© 2025 by the authors. Licensee MDPI, Basel, Switzerland. This article is an open access article distributed under the terms and conditions of the Creative Commons Attribution (CC BY) license (https://creativecommons.org/licenses/by/4.0/).