Featured Application
This method enables the fast and objective assessment of moisture in lime-plastered heritage walls, greatly improving restoration efficiency. It also has broad applicability to similar structures in other Confucian temples, supporting heritage conservation.
Abstract
Infrared thermography (IRT), a widely used nondestructive testing method, is commonly employed to identify moisture in historic walls. However, its reliance on manual interpretation by experts makes the process both time-consuming and costly. This study addresses the challenge of detecting wall moisture; this issue is closely linked to the deterioration of cultural heritage structures. This study focuses on the brick walls of the Tainan Confucian Temple, the oldest Confucian temple in Taiwan. The targeted are walls coated with lime plaster mixed with red mineral pigments, a traditional finish that gives the temple its distinctive red appearance. This study proposes a system to automatically identify wall areas, mark low-temperature zones, and determine the presence and distribution of moisture. Visible and infrared thermal images of these walls are captured and preprocessed to normalize the size and enhance the features. Finally, two convolutional neural network (CNN) models are trained in this study: one for identifying wall regions and the other for detecting low-temperature areas. The proposed method achieves an accuracy of 91.18% in detecting wall moisture, representing a 24.05% improvement over conventional object recognition techniques, the accuracy of which is 73.5%. In addition, this method requires only 3 s to detect the wall moisture, representing a 99.92% reduction in processing time compared to the conventional manual method. This method not only provides a fast and objective method for assessing moisture in lime-plastered heritage walls but also significantly enhances the efficiency of restoration efforts. This method can be applied to similar wall structures in other Confucian temples, offering broad potential for heritage conservation.
1. Introduction
Cultural heritage merits preservation due to its aesthetic, historical, scientific, and social value [1]. The preservation process involves a comprehensive evaluation of the structures, including moisture detection, to determine whether the walls contain moisture [2], which can lead to various degrees of damage and ultimately shorten the lifespan of the building [3].
Various techniques can be employed to analyze the moisture conditions in brick walls. Given the fragility and vulnerability of cultural heritage structures, invasive sampling methods may cause irreversible damage. Therefore, nondestructive testing (NDT) techniques are prioritized in heritage conservation. In recent years, NDT methods have become the primary approach for the assessing moisture, defects, and deterioration of heritage sites [4]. The commonly used techniques include infrared thermography (IRT) [5], electrical conductivity (EC), electrical resistivity tomography (ERT), and ground-penetrating radar (GPR). These methods provide valuable information about both the internal structure and surface conditions of heritage materials. Among them, IRT has been proven effective for rapidly assessing the moisture distribution on building surfaces and façades through long-term applications [6]. Due to its suitability for evaluating the moisture content in buildings [7], IRT has been widely adopted for the façade diagnostics of historical monuments around the world, such as the São Paulo Municipal Market [8], Hagia Sophia [9], and the Pitti Palace in Florence [10].
In the context of cultural heritage studies, wall moisture is commonly categorized into five types: accidental, air, building, percolation, and upward moisture. Accidental moisture refers to water unintentionally entering a structure due to failures or defects in piping systems, such as rainwater drainage, sewage, or drinking water lines. Air moisture occurs when high ambient humidity interacts with surfaces cooler than the dew point, leading to condensation. Building moisture denotes water trapped within the materials during the wall construction process. Percolation moisture refers to water infiltration through cracks, structural defects, or openings such as doors and windows. Lastly, upward moisture involves the capillary rise of groundwater, which may vary seasonally based on humidity levels. Thermal infrared (IR) imaging enables the identification of temperature differences on surfaces made of the same material [11], with moisture-affected areas typically appearing cooler than the surrounding dry regions. As a result, thermal imaging can assist in distinguishing moisture sources, prioritizing restoration efforts, and formulating conservation strategies for cultural heritage structures [12]. Regions with lower surface temperatures often correspond to areas with higher moisture and salt contents [4]. ERM can be used in conjunction with IRT to detect and quantify surface moisture. Moisture mapping using ERM provides insights into the distribution and extent of dampness across wall façades, with moist zones identified by ERM often aligning with those detected through IRT [2].
Given these techniques, heritage wall preservation often involves experts visually identifying areas with low temperature and high moisture in thermal images. This process requires substantial expertise, time, and effort. Automating the detection of moist regions in thermal imagery can significantly improve the efficiency of preservation workflows and contribute to the long-term safeguarding of cultural heritage.
In this context, artificial intelligence (AI) applications have achieved significant progress across a wide range of fields, including cancer diagnosis [13], depression analysis [14], traffic control [15], environmental noise assessment [16], and the surface analysis of floors [17] and walls [18]. In the realm of cultural heritage, recent studies have begun exploring the use of artificial neural networks (ANNs) [19] and convolutional neural networks (CNNs) [20] to accelerate the processing of visible imagery. However, limited research has addressed the application of AI for thermal imaging analysis for heritage wall preservation.
While AI applications in thermal imaging for cultural heritage remain limited, certain material characteristics must also be considered. Materials with high reflectivity are unsuitable for moisture detection using IRT, which is why current IRT-based moisture assessments primarily focus on low-reflectivity materials such as brick and stone. Aged brick walls, in particular, tend to absorb moisture easily, making damp areas more distinguishable [21]. This study focused on the old brick walls of the Tainan Confucian Temple, which are coated with lime plaster. Because the moisture conditions of these walls cannot be assessed visually, image processing techniques combined with a convolutional neural network (CNN) model were employed to detect high-moisture regions using thermal images, thereby improving the efficiency of heritage restoration efforts.
2. Study Area
Confucius (551–479 BCE) was a notable ancient philosopher and educator whose influence remains profound worldwide. After his death, his former residence was dedicated to him, becoming the first Confucian temple in China, known as the Qufu Confucian Temple. Other Confucian temples were subsequently modeled on the aforementioned temple. Since the era of the Tang dynasty, all schools were mandated by law to establish Confucian temples to honor Confucius. These temples thus acquired an educational function and became critical sites for venerating Confucius and nurturing talent. Confucian temples have a fixed architectural style and are primarily red. Because Chinese culture influenced neighboring countries, many Confucian temples were constructed in Vietnam, Korea, and Japan. At one point, over 3000 Confucian temples existed worldwide, and more than 34 such temples still exist in Taiwan.
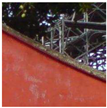
The present case study focused on the Tainan Confucian Temple, the oldest Confucian temple in Taiwan. This temple is located in southern Taiwan. The temple was established in 1665 and was the only place offering education for young scholars at that time; thus, it is also known as the First Academy of Taiwan. Because of its uniqueness and importance, the temple has been well preserved by various regimes in Taiwan and is currently classified as a cultural asset of the highest level by the Taiwanese government, as shown in Figure 1a.
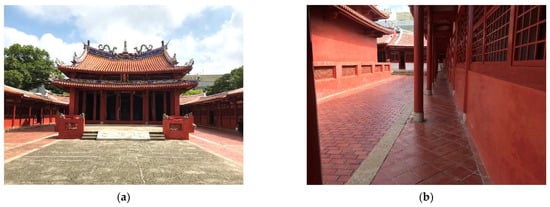
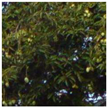
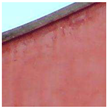
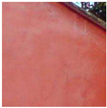
Figure 1.
Dacheng Hall and the characteristic red exterior walls of the Tainan Confucian Temple. (a) Dacheng Hall. (b) Red exterior walls.
The outer walls of the Tainan Confucian Temple are made of red bricks covered by lime plaster mixed with red earth (iron oxide and mineral pigments), giving the walls a red appearance, as shown in Figure 1b. The brickwork cannot be viewed from the surface, and the moisture content cannot be visually assessed. The aforementioned wall construction method is commonly seen in existing Confucian temples.
To detect and analyze the moisture in the walls of the Tainan Confucian Temple, infrared thermal images were captured using a FLIR SC660 camera. This camera was equipped with two lenses, which enabled the simultaneous capture of visible and infrared thermal images. The sizes of these images differed, with the resolutions of the visible and thermal infrared images being 2048 × 1536 and 640 × 480 pixels, respectively. It is typically used for thermal measurements of buildings, capable of detecting minor temperature variations and is less affected by sunlight reflection. The spectral range for thermal imaging was 7.5–13 μm, with a temperature detection range of −40 °C to 1500 °C, an imaging frequency of 30 Hz, and a thermal sensitivity of less than 30 mK.
In this study, thermal and visible images were captured simultaneously on 21 and 22 July 2022. The study area had a tropical climate, with an average relative humidity of about 75% throughout the year, resulting in minimal humidity variation across seasons. Due to the higher temperatures in the summer, the moisture in the walls was easier to detect when present. Therefore, this study chose to conduct infrared thermal imaging during the summer. On these 2 days, the average temperature was 31.4 °C, the minimum temperature was 29.9 °C, the maximum temperature was 32.6 °C, the average wind speed was 2.9 m/s, the average relative humidity was 72.7%, and the rainfall was 0 mm. To ensure the size and quality of the walls in the thermal images, the images were captured at a distance of 2–3 m, with the camera shooting angle approximately orthogonal to the wall. In the thermal images, each different material corresponded to its own emissivity. Since the target of this study was on the red brick walls of a historical building, the emissivity was set to 0.90. To confirm that the walls contained moisture under different solar radiation conditions, this study chose to capture thermal images in the morning, noon, afternoon, and evening. Because the ground absorbed solar heat faster than it radiates during the daytime, it caused the temperature to rise. Conversely, the ground absorbed solar heat slower than it radiated at night, which caused the temperature to drop.
3. Methodology
The methodology of this study is shown in Figure 2, which consisted of three main stages: image preprocessing, database construction, and CNN training. Specifically, visible images were used to develop the dataset for training the CNN model for red wall detection, whereas the thermal images were utilized for training the CNN model focused on moisture detection.
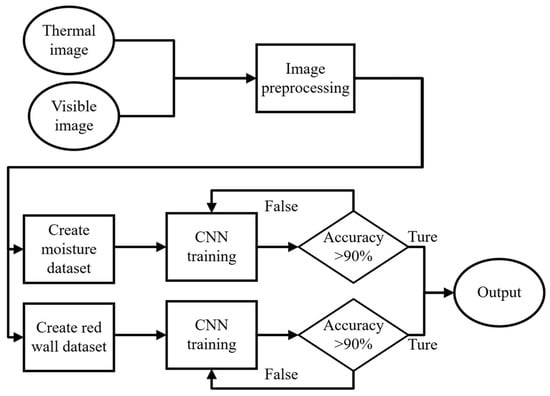
Figure 2.
Methodology in this study.
3.1. Image Preprocessing
To determine whether there is excessive moisture issue within red walls, experts rely on the evaluation of both visible and thermal images. However, due to the limitations of the FLIR SC660 camera, the captured ranges and resolutions of the visible and thermal images differed. The captured images are shown in Figure 3a,b, representing the visible and thermal images, respectively, where discrepancies in the imaging coverage can be clearly observed. In this stage of this study, image alignment was performed by using the central points of both image types as a reference, as illustrated in Figure 3c.
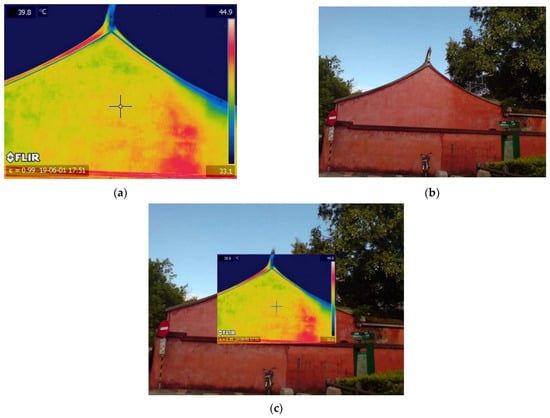
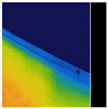
Figure 3.
The captured images. (a) Infrared thermal image. (b) Visible image. (c) The result of overlapped visible and infrared thermal images using a central point.
To achieve alignment, the center points of the two image types were used as references to calculate their respective corner coordinates. However, the objects in the thermal images appeared smaller than those in the visible images. Through mathematical computation, the center coordinates of the visible and thermal images were determined to be (1024, 768) and (470, 352), respectively. Furthermore, the four corner coordinates of the thermal images were identified as (554, 415), (1493, 414), (554, 1119), and (1493, 1119). These coordinates were subsequently used as cropping points for the visible images to ensure spatial alignment between the modalities.
However, this study found that the center-based alignment method was not applicable to all data. Misalignment occurred due to unintentional hand movements during image capture, which caused shifts in the central points of the visible and thermal images. To address this issue, the thermal images were first preliminarily resized, followed by the application of a convolution operation and a binarization process to both the visible and thermal images. The processed images were then subjected to iterative overlay analysis, as shown in Figure 4. This step involved calculating the number of white pixels in the overlapping regions between the two image types. By statistically evaluating the coordinate offsets (X, Y) that produced the greatest overlap, the optimal alignment coordinates were determined. This approach effectively compensated for the inconsistencies in image positioning caused by movement during image acquisition.
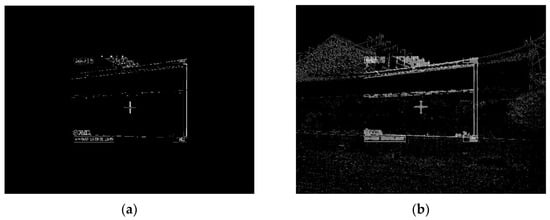
Figure 4.
Enhancement of a visible image and an infrared thermal image. (a) Overlap and binarization of visible and infrared thermal images. (b) Contour map for an original image and the corresponding infrared thermal image.
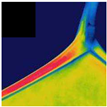
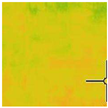
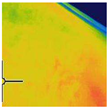
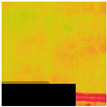
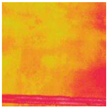
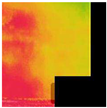
Finally, a masking technique was employed to eliminate noise, particularly artifacts such as the brand watermarks and temperature labels commonly present in thermal images. The original thermal images utilized a rainbow color map, which did not include a color pixel for black. Therefore, a black mask was applied. This masking process did not affect the subsequent CNN training or the detection results. The thermal images before and after mask application are shown in Figure 5.
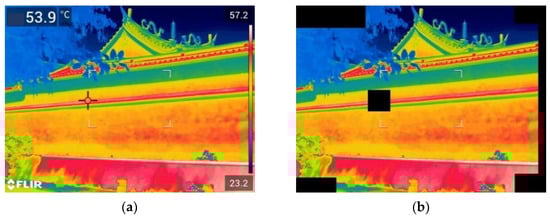
Figure 5.
Comparison of infrared thermal images obtained before and after mask application. (a) Before mask application. (b) After mask application.
3.2. Database Augmentation
The collected thermal images were used to locate areas of moisture within the walls, while the visible images were employed to identify the locations of the red walls. However, due to the differences in resolution between the visible and thermal images, all images were cropped and resized prior to being input into the CNN model. This standardization step was essential to prevent the model from making erroneous predictions due to inconsistent image dimensions [22].
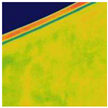
Since CNN training requires a substantial amount of data, the standardized thermal images were further divided into 12 equal rectangular segments to increase the training sample size and improve model accuracy. Each segmented image measured pixels and often contained a large portion of pure red wall or pure background. This method helped reduce the unsatisfactory training results caused by the compression or deformation of input data. The segmentation results are shown in Figure 6.
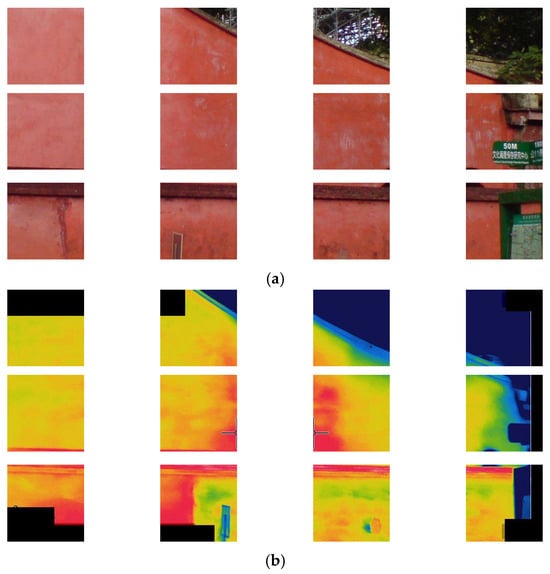
Figure 6.
Segmentation results. (a) Visible image. (b) Infrared thermal image.
To accurately identify whether the analyzed walls contained moisture, two CNN models were trained in this study. The first model was used to identify the presence of red walls in the visible images. When the presence of walls was confirmed, the second model identified whether the walls contained moisture in the thermal images. Because of the different requirements of these two CNN models, independent training image databases were required.
The dataset used in this study included thermal images of red walls captured at the Confucius temple and the Lee’s Ancestral Residence in Luzhou. It not only increased the amount of training data but also broadened the application of this method. As a result, the applicability of this method is not limited to the Confucian Temple but can also be generalized for detecting moisture in the red walls of other heritage structures.
From the image databases for the CNN models, 80% and 20% of the images were designated for training and testing, respectively. The first set of images consisted of 4200 unenhanced red wall images and 2800 images without red walls. The second set of images consisted of 1500 images of moist wall areas and 2000 images of wall areas without moisture. The sample datasets for detecting red walls in the visible images and moisture in the thermal images are shown in Figure 7. Within the red wall dataset, images in which the red wall occupied only a minimal portion of the frame were categorized under the ‘Without red wall’ class.
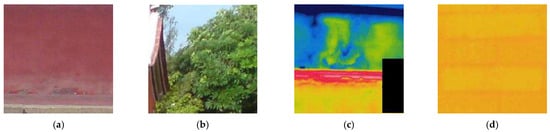
Figure 7.
Sample dataset for detecting red walls in visible images and moisture in thermal images. Rotated images. (a) Red wall. (b) Without red wall. (c) Moisture. (d) Without moisture.
A total of 5600 images were selected from the first group to serve as the dataset, ensuring a uniform distribution of images under different conditions. To increase the number of training samples, image rotation techniques were applied to the second group. Specifically, 500 red wall images were augmented by applying a small rotation of ±10°, as summarized in Table 1. This limited rotation range was chosen to mitigate issues such as data imbalance and overfitting. Randomized selection and random angle deflection were employed to ensure that the appearance probabilities of all samples were as evenly distributed as possible. Two examples of rotated images are shown in Figure 8.

Table 1.
The number of samples in the datasets.
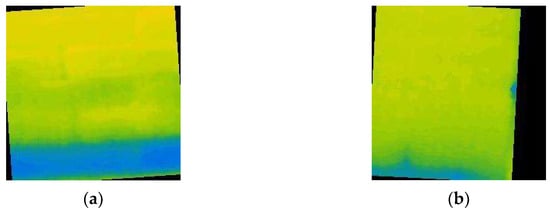
Figure 8.
Rotated images. (a) Image rotated 10° to the left. (b) Image rotated 10° to the right.
3.3. CNN Training and Evaluation
Advances in AI have resulted in the development of various CNN models, such as AlexNet, Inception, and GoogLeNet. AlexNet is a deep CNN model proposed by Alex Krizhevsky, Ilya Sutskever, and Geoffrey Hinton in 2012 [23]. AlexNet shows excellent performance in the fields of image processing and object recognition. It consists of a multilayer CNN with a max pooling layer between each layer, which helps to reduce the number of parameters and computational costs. Furthermore, its uses dropout layers and the rectified linear unit activation function for optimization, thus achieving strong generalization ability and robustness as well as avoiding overfitting problems.
The versions of the hardware and software used are listed in Table 2. An Nvidia RTX 2070 SUPER graphics processing unit was employed to accelerate CNN model training. This study used the captured images to train AlexNet to evaluate the moisture content in the red walls of the analyzed temple. The architecture of AlexNet is shown in Table 3. In addition, the captured images were processed, the processed images were imported into MATLAB, and transfer learning methods were used to create two CNN models [24]. A layered library was used to employ a fully connected, a SoftMax, and a classification layer. Because this study only identified whether the red walls contained moisture, which was binary classification, the fully connected layer, which was the third-last layer in the CNN models, was replaced with two image outputs.
Table 2.
Hardware and software used in this study.
Table 3.
The architecture of AlexNet in this study.
To address the problem of detecting irregularly shaped moist areas on the red walls, CNN-based moisture detection was conducted multiple times for areas identified as containing moisture. The scan size for each detection process was set as 235 × 235 pixels, and the coordinate position for each scan was moved by 47 pixels to achieve more accurate results, as shown in Figure 9.
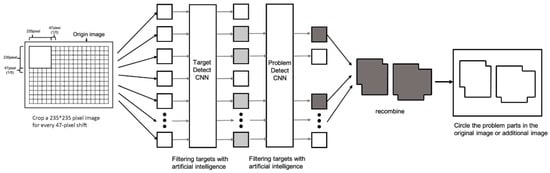
Figure 9.
Overall moisture detection process.
Moreover, during CNN training, hyperparameters must be adjusted. In this study, three crucial hyperparameters were considered during CNN training, as shown in Table 4: the initial learning rate, number of epochs, and minibatch size.
Table 4.
Hyperparameter settings used in this study.
3.3.1. Initial Learning Rate
The initial learning rate was employed to adjust the learning speed. A higher initial learning rate results in faster training but might produce suboptimal results. Conversely, a smaller initial learning rate reduces the training speed but also decreases the risk of overfitting. In this study, the initial learning rate was set to 0.0001 to balance training speed and training accuracy.
3.3.2. Number of Epochs
An epoch refers one processing of the entire training set by a model. The larger the number of epochs, the longer the training time, and the greater the possibility of overfitting. By contrast, the smaller the number of epochs, the shorter the training time but the less comprehensive the training results. In this study, the number of epochs was set to 1000.
4. Results
This study proposed an intelligent system based on CNN for detecting humidity in the red walls of historical buildings. In this study, two CNN models were trained for recognizing red walls and identifying the areas of walls that contained moisture. This study combined two CNN models and evaluated their results. To fairly evaluate the training results of the models, this study used , , , and as evaluation metrics, with their formulas shown in Equations (1)–(4).
K-fold cross-validation partitions the dataset multiple times into training and validation subsets, thereby reducing the risk of evaluation bias caused by a single random split. This approach enhances the reliability and stability of a model’s performance. To obtain more consistent and representative evaluation results, 5-fold cross-validation was adopted in this study. In this study, AlexNet, GoogLeNet [25], and InceptionV3 [26] were individually tested for detecting red walls from visible image and detecting moisture using thermal images, and their average accuracies are shown in Table 5 and Table 6. Based on the results in Table 5 and Table 6, AlexNet consistently demonstrated superior performance in both red wall and moisture detection. Accordingly, it was chosen as the classification model for this study.
Table 5.
The average results of 5-fold cross-validation for the detection of red walls in visible images.
Table 6.
The average results of 5-fold cross-validation for the detection of moisture in thermal images.
The results of 5-fold cross-validation for the detection of red walls in the visible images and the detection of moisture in the thermal images in this study are shown in Table 7 and Table 8. For the identification of red walls in visible images, the model achieved an average of 93.68%, a of 91.2%, a of 90.8%, and an of 91.0%. For moisture detection in the thermal images, the model achieved an average of 97.26%, a of 97.2%, a of 97.0%, and an of 97.2%. In comparison to the identification of red walls in the visible images, these results show improved performance. These findings highlight the model’s strong capability in accurately and consistently identifying moisture-related features in thermal images, indicating its potential for assisting in the nondestructive evaluation of moisture conditions in heritage structures.
Table 7.
The details of 5-fold cross-validation for the detection of red walls in visible images in this study.
Table 8.
The details of 5-fold cross-validation for the detection of moisture in thermal images in this study.
Furthermore, the overall system performance was evaluated using 100 pairs of thermal and visible images. After image preprocessing, the thermal images were processed by the moisture detection CNN model, and the visible images were processed by the red wall detection CNN model. The outputs from both models were integrated to produce the final results. The overall system achieved an accuracy of 91.18%. A comparative performance analysis with other methods is presented in Table 9. In this evaluation, 100 images were used to perform moisture detection using three approaches: a manual method, the methods from references [27,28], and the proposed method in this study. The corresponding accuracy and processing time were recorded. The manual method required personnel with professional expertise to conduct the analysis. Although it achieved a high accuracy of 100%, it took approximately 1200 times longer than the proposed method. Compared to the method in [27], our approach demonstrated superior performance in both accuracy and computational efficiency. As the method in [28] also employed CNN-based detection, the difference in processing time between our method and theirs was relatively small.
Table 9.
Comparison of the performance of different methods by using 100 images.
The schematic results of this study are shown in Figure 10. It input the images, which were divided into 12 blocks, and performed labeling and detection on each block individually. It separately used two CNN models for detecting red walls and detecting moisture, as shown in Table 10 and Table 11. When both the red wall detection and moisture detection results were above 50%, this method labeled the area as a water-containing area of the red wall on the thermal image.
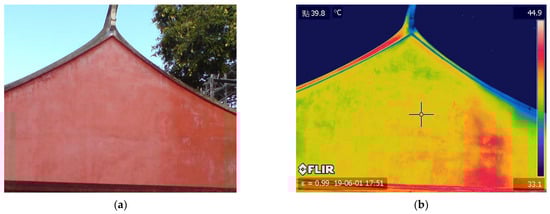
Figure 10.
A test schematic was used as the system input. (a) Visible image. (b) Thermal image.
Table 10.
The results from Figure 10a for detecting areas of red wall in visible images.
Table 11.
The results from Figure 10b for detecting moisture in thermal images.
5. Discussion
This study proposed an automated detection system that combines two CNN models to identify moisture within red walls. During model development, 5-fold cross-validation was employed to ensure the reliability and stability of the training and evaluation processes. The CNN model for red wall detection using visible images achieved an accuracy of 93.68%, while the model for moisture detection using thermal images reached a higher accuracy of 97.26%. To assess the overall performance of the proposed system, 100 pairs of visible and thermal images were input into the system, resulting in an average accuracy of 91.18%. This slightly lower accuracy could be attributed to certain cases where the red wall and non-red-wall regions occupied similar areas within the image, leading to occasional misclassification. Nevertheless, compared to manual assessment, the proposed system requires substantially less processing time, despite having slightly lower accuracy.
Although the advancements demonstrated in this study are significant, there remains room for improvement. The current image alignment method is based on central point matching, followed by minor adjustments. While some local misalignments persist, the positional differences are minimal and do not significantly affect the overall recognition results. However, for future applications that require higher precision, further work will focus on optimizing the image preprocessing pipeline to minimize the misalignment between thermal and visible images. In addition, future work will incorporate the identification of various wall materials commonly found in heritage buildings, thereby enhancing the practical value and applicability of the proposed system. To achieve this, we plan to explore more advanced deep learning models, such as Faster R-CNN, You Only Look Once (YOLO), and RetinaNet, to enable the accurate localization and classification of walls with diverse material compositions.
The primary goal of this study as to improve the efficiency of heritage restoration. The proposed system was designed to support restoration professionals by enabling the automated analysis of visible and thermal images. Once the images are input, the system automatically identifies and highlights areas of moisture on red wall surfaces. This capability significantly accelerates the analysis process and enhances the effectiveness of moisture detection in heritage conservation efforts. Ultimately, the proposed system aims to streamline the diagnostic workflow and improve the reliability of moisture detection, thereby supporting more efficient and informed preservation strategies.
6. Conclusions
This study developed an automated system aimed at identifying red wall regions as well as assessing the presence and distribution of moisture. To achieve this, the visible and thermal images of target red walls were captured and preprocessed to ensure uniform image dimensions and enhance key features. Two CNN models were trained in this study, one for detecting red wall boundaries and another for locating moist areas. The major contributions of this study include the following:
- A novel image calibration method: To address the misalignment caused by motion interference during image capture, this study proposes a novel image calibration method. After resizing thermal images, a 5 × 5 convolution and binarization are applied to both visible and infrared images, followed by iterative overlay analysis to determine the optimal alignment coordinates based on the highest pixel overlap.
- Automated detection of red wall moisture areas: Due to the current reliance on the manual interpretation of visible and thermal images in heritage restoration, the process remains labor-intensive and time-consuming. To solve this issue, this study proposes an automated red wall moisture detection system that integrates two CNN models. The system requires only 3 s to analyze 100 sets of visible and infrared images, achieving approximately 1200 times greater efficiency compared to manual inspection.
- A highly accurate system for detecting moisture in red wall structures: Before training the CNN, thermal images are masked to eliminate irrelevant information that could negatively impq1act model performance. During training, the CNN parameters are also fine-tuned to optimize accuracy. As a result, the proposed method achieves an accuracy of 91.18%, representing a 24.05% improvement over existing approaches.
Overall, the method developed in this study can be used to detect moisture in the lime-plaster-covered old brick walls of Confucian temples and other cultural heritage buildings. The proposed method reduces the workload of the professionals involved in cultural heritage preservation and restoration as well as efficiently and accurately determines the moisture condition of walls, thus contributing to the control of wall damage at cultural heritage sites.
Author Contributions
Conceptualization, Y.-Y.H.; methodology, Y.-Y.H. and C.-Y.Y.; software, C.-Y.Y.; validation, C.-Y.Y.; formal analysis, Y.-C.C.; investigation, Y.-C.C.; resources, Y.-C.C.; data curation, Y.-C.C.; writing—original draft preparation, Y.-Y.H.; writing—review and editing, Y.-Y.H.; visualization, Y.-Y.H.; supervision, S.-L.C.; project administration, S.-L.C.; funding acquisition, Y.-C.C. All authors have read and agreed to the published version of the manuscript.
Funding
This work was supported in part by the National Science and Technology Council, Taiwan, under grant numbers of 112-2221-E-033-049-MY3, 113-2622-E-033-001, and 112-2221-E-033-025.
Institutional Review Board Statement
Not applicable.
Informed Consent Statement
Not applicable.
Data Availability Statement
The model and trained models presented in this study are openly available from GitHub at https://github.com/m28124023/Red-Wall-Moisture-Detection.git (accessed on 5 June 2025). However, the dataset used in this study cannot be publicly released due to legal and data privacy restrictions.
Acknowledgments
The authors are grateful to the Bureau of Cultural Heritage of the Ministry of Culture, Taiwan, for supporting the research equipment.
Conflicts of Interest
The authors declare no conflict of interest.
References
- Vecco, M. A definition of cultural heritage: From the tangible to the intangible. J. Cult. Herit. 2010, 11, 321–324. [Google Scholar] [CrossRef]
- Valero, L.R.; Sasso, V.F.; Vicioso, E.P. In situ assessment of superficial moisture condition in façades of historic building using non-destructive techniques. Case Stud. Constr. Mater. 2019, 10, e00228. [Google Scholar]
- Grinzato, E.P.G.B.; Bison, P.G.; Marinetti, S.E.R.G.I.O. Monitoring of ancient buildings by the thermal method. J. Cult. Herit. 2002, 3, 21–29. [Google Scholar] [CrossRef]
- Moropoulou, A.; Labropoulos, K.C.; Delegou, E.T.; Karoglou, M.; Bakolas, A. Non-destructive techniques as a tool for the protection of built cultural heritage. Constr. Build. Mater. 2013, 48, 1222–1239. [Google Scholar] [CrossRef]
- Avdelidis, N.P.; Moropoulou, A. Applications of infrared thermography for the investigation of historic structures. J. Cult. Herit. 2004, 5, 119–127. [Google Scholar] [CrossRef]
- Lyberg, M.D.; Mattsson, M.; Sundberg, J. Detection of Moisture Damage in Buildings Using Thermography. Available online: https://www.spiedigitallibrary.org/conference-proceedings-of-spie/1313/0000/Detection-of-moisture-damage-in-buildings-using-thermography/10.1117/12.21918.full (accessed on 14 May 2025).
- Barreira, E.; Almeida, R.M.S.F.; Delgado, J.M.P.Q. Infrared thermography for assessing moisture related phenomena in building components. Constr. Build. Mater. 2016, 110, 251–269. [Google Scholar] [CrossRef]
- Resende, M.M.; Gambare, E.B.; Silva, L.A.; Cordeiro, Y.D.S.; Almeida, E.; Salvador, R.P. Infrared thermal imaging to inspect pathologies on façades of historical buildings: A case study on the Municipal Market of São Paulo, Brazil. Case Stud. Constr. Mater. 2022, 16, e01122. [Google Scholar] [CrossRef]
- Moropoulou, A.; Bakolas, A.; Karoglou, M.; Delegou, E.T.; Labropoulos, K.C.; Katsiotis, N.S. Diagnostics and protection of Hagia Sophia mosaics. J. Cult. Herit. 2013, 14, e133–e139. [Google Scholar] [CrossRef]
- Imposa, S. Infrared thermography and Georadar techniques applied to the ‘Sala delle Nicchie’ (Niches Hall) of Palazzo Pitti, Florence (Italy). J. Cult. Herit. 2010, 11, 259–264. [Google Scholar] [CrossRef]
- Kavuru, M.; Rosina, E. IR Thermography for the Restoration of Colonial Architecture in India—Case study of the British Residency in Hyderabad, Telangana. J. Cult. Herit. 2021, 48, 24–28. [Google Scholar] [CrossRef]
- Barbosa, M.T.G.; Rosse, V.J.; Laurindo, N.G. Thermography evaluation strategy proposal due moisture damage on building facades. J. Build. Eng. 2021, 43, 102555. [Google Scholar] [CrossRef]
- RPandian, R.; Vedanarayanan, V.; Kumar, D.R.; Rajakumar, R. Detection and classification of lung cancer using CNN and Google net. Meas. Sens. 2022, 24, 100588. [Google Scholar] [CrossRef]
- Wang, B.; Kang, Y.; Huo, D.; Chen, D.; Song, W.; Zhang, F. Depression signal correlation identification from different EEG channels based on CNN feature extraction. Psychiatry Res. Neuroimaging 2023, 328, 111582. [Google Scholar] [CrossRef]
- Satyanarayana, G.S.R.; Deshmukh, P.; Das, S.K. Vehicle detection and classification with spatio-temporal information obtained from CNN. Displays 2022, 75, 102294. [Google Scholar] [CrossRef]
- İnik, Ö. CNN hyper-parameter optimization for environmental sound classification. Appl. Acoust. 2023, 202, 109168. [Google Scholar] [CrossRef]
- Liu, F.; Liu, J.; Wang, L. Asphalt pavement fatigue crack severity classification by infrared thermography and deep learning. Autom. Constr. 2022, 143, 104575. [Google Scholar] [CrossRef]
- Huang, H.; Cai, Y.; Zhang, C.; Lu, Y.; Hammad, A.; Fan, L. Crack detection of masonry structure based on thermal and visible image fusion and semantic segmentation. Autom. Constr. 2024, 158, 105213. [Google Scholar] [CrossRef]
- Hatir, M.E.; Barstuğan, M.; İnce, İ. Deep learning-based weathering type recognition in historical stone monuments. J. Cult. Herit. 2020, 45, 193–203. [Google Scholar] [CrossRef]
- Hatir, M.E.; Ince, I. Lithology mapping of stone heritage via state-of-the-art computer vision. J. Build. Eng. 2021, 34, 101921. [Google Scholar] [CrossRef]
- Llorente-Alvarez, A.; Camino-Olea, M.S.; Cabeza-Prieto, A.; Saez-Perez, M.P.; Rodríguez-Esteban, M.A. The thermal conductivity of the masonry of handmade brick Cultural Heritage with respect to density and humidity. J. Cult. Herit. 2022, 53, 212–219. [Google Scholar] [CrossRef]
- Li, C.W.; Lin, S.Y.; Chou, H.S.; Chen, T.Y.; Chen, Y.A.; Liu, S.Y.; Liu, Y.L.; Chen, C.A.; Huang, Y.C.; Chen, S.L.; et al. Detection of Dental Apical Lesions Using CNNs on Periapical Radiograph. Sensors 2021, 21, 7049. [Google Scholar] [CrossRef] [PubMed]
- Krizhevsky, A.; Sutskever, I.; Hinton, G.E. ImageNet classification with deep convolutional neural networks. In Proceedings of the 25th International Conference on Neural Information Processing Systems—Volume 1 (NIPS’12), Lake Tahoe, NV, USA, 3–6 December 2012; pp. 1097–1105. [Google Scholar]
- Mao, Y.C.; Chen, T.Y.; Chou, H.S.; Lin, S.Y.; Liu, S.Y.; Chen, Y.A.; Liu, Y.L.; Chen, C.A.; Huang, Y.C.; Chen, S.L.; et al. Caries and Restoration Detection Using Bitewing Film Based on Transfer Learning with CNNs. Sensors 2021, 21, 4613. [Google Scholar] [CrossRef] [PubMed]
- Szegedy, C.; Liu, W.; Jia, Y.; Sermanet, P.; Reed, S.; Anguelov, D.; Erhan, D.; Vanhoucke, V.; Rabinovich, A. Going Deeper with Convolutions. arXiv 2014, arXiv:1409.4842. [Google Scholar] [CrossRef]
- Szegedy, C.; Vanhoucke, V.; Ioffe, S.; Shlens, J.; Wojna, Z. Rethinking the Inception Architecture for Computer Vision. arXiv 2015, arXiv:1512.00567. [Google Scholar] [CrossRef]
- Chiang, L.W. Deterioration Diagnostic Model for Aged Building External Wall Tiles. Doctoral Dissertation, National Taiwan University, Taipei, Taiwan, 2016. [Google Scholar]
- Yu, C.X.; Chen, W.P.; Ju, C.Y.; Chen, T.Y.; Li, K.C.; Chen, C.A.; Chan, M.L.; Chen, S.L. Application of Deep Learning Techniques for Thermal Imagery Analysis in Abnormal Identification of Floor Tiles in Heritage Environments. In Proceedings of the 2023 Asia Pacific Signal and Information Processing Association Annual Summit and Conference (APSIPA ASC), Taipei, Taiwan, 31 October–3 November 2023; pp. 1878–1884. [Google Scholar] [CrossRef]


Disclaimer/Publisher’s Note: The statements, opinions and data contained in all publications are solely those of the individual author(s) and contributor(s) and not of MDPI and/or the editor(s). MDPI and/or the editor(s) disclaim responsibility for any injury to people or property resulting from any ideas, methods, instructions or products referred to in the content. |
© 2025 by the authors. Licensee MDPI, Basel, Switzerland. This article is an open access article distributed under the terms and conditions of the Creative Commons Attribution (CC BY) license (https://creativecommons.org/licenses/by/4.0/).