Article

Permanent Deformation Mechanism of Steel Bridge Deck Pavement Using Three-Dimensional Discrete–Continuous Coupling Method on the Mesoscopic Scale

Road and Railway Engineering Research Institute, Hohai University, Nanjing 210098, China
*
Author to whom correspondence should be addressed.
Appl. Sci. 2025, 15(11), 6187; https://doi.org/10.3390/app15116187
Submission received: 11 April 2025 / Revised: 27 May 2025 / Accepted: 27 May 2025 / Published: 30 May 2025

Abstract

:
Unlike conventional asphalt pavements, steel bridge deck pavement (SBDP) is directly constructed on orthotropic steel deck plates characterized by relatively low flexural stiffness, rendering it more susceptible to rutting deformation under elevated temperatures and repeated loading. To investigate the mesoscopic mechanism underlying rutting formation in SBDP, a three-dimensional (3D) discrete–continuous coupled model of a steel–asphalt composite structural specimen (SACSS) was developed and employed to conduct virtual rutting simulations, which were subsequently validated against laboratory test results. The impact of surface cracking on rutting progression was then explored. In addition, the spatial motion and contact interactions of particles during the rutting process were monitored and analyzed. The influence of steel plate stiffness on the rutting resistance of SBDP was also evaluated. The numerical analyses yielded the following key findings: (1) Under three steel–asphalt interface bonding (SAIB) failure conditions (0%, 17%, and 100%), the virtual simulation results exhibited strong agreement with experimental trends in rutting depth over time, thereby confirming the validity and reliability of the coupled modeling approach. (2) At 30 °C, the presence of surface cracks is found to increase the rutting depth by 35.77%, whereas this effect is mitigated at 45 °C. (3) The meso-mechanical mechanisms governing rutting deformation in SBDP are further elucidated under different temperature conditions. (4) Moreover, at elevated temperatures, the use of a steel plate with an elastic modulus of 206 MPa effectively inhibit rutting development. This study offers mesoscopic-level insights into the effects of temperature, SAIB conditions, steel plate stiffness, and surface cracking on the macroscopic rutting behavior of SBDP, thereby providing a theoretical foundation for the design and optimization of long-lasting SBDPs.

1. Introduction

1.1. Research Background

According to the 2023 Statistical Bulletin on the Development of the Transportation Industry released by the Ministry of Transport of China, the total number of highway bridges nationwide reached 1.0793 million by the end of 2023, demonstrating a consistent upward trend. Simultaneously, the number of urban traffic bridges also increased steadily, reaching 89,300, thereby contributing to the enhancement of urban transportation networks and improving overall operational efficiency and load-bearing performance. With the continual expansion of the bridge inventory and the increasing complexity of service environments, heightened attention has been directed toward the durability and functional performance of bridge structures.
Steel bridges have been extensively employed in long-span structures—such as suspension bridges, cable-stayed bridges, and select overpass segments—owing to their distinctive advantages. As a vital structural component of steel bridges, the steel bridge deck pavement (SBDP) is directly installed on orthotropic steel deck plates, which possess relatively low flexural stiffness. In comparison with conventional asphalt pavements, SBDPs are more susceptible to temperature variations. Elevated temperatures have been shown to weaken the interfacial bonding between the pavement and the steel deck [1,2], thereby altering the mechanical response of the overall pavement system [3]. Consequently, the occurrence of rutting and other distress modes during service becomes more pronounced. Current research on rutting development in SBDP primarily focuses on two domains: experimental investigations and finite element method (FEM) analyses. These approaches are predominantly conducted at the macroscopic scale, which limits their capacity to capture particle-level interactions and kinematic behavior within the material. As a result, critical mesoscopic mechanisms remain inadequately understood. Therefore, it is of substantial importance to explore the rutting formation process of SBDP from a meso-mechanical perspective to bridge this knowledge gap and inform more effective design and maintenance strategies.

1.2. Review of Relevant Research Literature

1.2.1. Rutting Behavior of SBDP Investigated Through Experimental Study

When the concept of rutting was first introduced, it was widely accepted that rutting primarily originated from structural deformation induced by traffic loading [4]. Paterson [5] categorized rutting-related deformation into two fundamental types: densification and shear flow deformation. Building upon this framework, Kaloush et al. [6] delineated the rutting evolution process into two distinct stages: an initial stage characterized by vertical deformation due to material compaction, followed by a secondary stage dominated by shear deformation resulting from the lateral flow of asphalt mixtures.
In comparison with conventional asphalt pavements, the rutting progression in SBDPs is significantly more complex, owing to the distinctive substructure of steel decks and the severe constraints imposed by construction conditions [7]. Conventional laboratory testing methods have proven inadequate for accurately replicating the in-service conditions of SBDP or capturing the detailed evolution of rutting behavior. To address these limitations, full-scale accelerated pavement testing has been adopted by Shi and Cong [8], Jun et al. [9], and Huang et al. [10] to better simulate realistic operational environments and assess rutting development. Nevertheless, experimental investigations are inherently challenged by the difficulty of achieving consistent results under nominally identical conditions. Due to the inability to fully standardize all influencing parameters, measurement uncertainties are inevitable, leading to considerable variability in repeat trials. Moreover, the extended time requirements, high financial costs, and limited controllability associated with full-scale SBDP testing have increasingly constrained their practical application. As a result, numerical simulation has emerged as a promising alternative, offering greater efficiency, repeatability, and parameter control in the analysis of mechanical responses and damage evolution in SBDP systems.

1.2.2. Rutting Behavior of SBDP Investigated Through the Finite Element Method

The FEM and the discrete element method (DEM) are two widely utilized numerical approaches for analyzing pavement systems. By employing FEM software, detailed local or global models of steel bridge structures can be developed to simulate the overall mechanical response of the pavement system under various loading conditions [11]. In recent years, in response to the recurrent rutting problems observed in SBDPs under high temperatures and heavy traffic loads, considerable research attention has been devoted to the hierarchical design of steel–asphalt composite structural specimens (SACSS). FEM has been frequently employed to simulate various material layering configurations with the aim of optimizing rutting resistance. For instance, Liu et al. [12] and Luo et al. [13] constructed FEM models of commonly adopted composite systems incorporating gussasphalt (GA) and epoxy asphalt (EA). Yang et al. [14] demonstrated that a combination of EA and stone mastic asphalt (SMA) resulted in the lowest permanent deformation and superior rutting resistance under coupled temperature–load conditions. Cong et al. [15] developed a two-layer finite element model, consisting of SMA as the upper layer and mastic asphalt (MA) as the lower layer, to explore the effects of pavement thickness, loading conditions, and the geometric configuration of steel box girders on rutting development. Luo et al. [16] evaluated five different material combinations involving GA, EA, and SMA, and found that the application of EA as the surface layer markedly improved rutting resistance. In a practical engineering context, Zhu et al. [17] proposed an FEM-based rutting prediction approach for GA pavements implemented in the Nanjing Fourth Yangtze River Bridge. Despite these advances, most FEM-based studies on SACSS have overlooked the steel–asphalt interfacial bonding (SAIB) layer or have simplified its behavior by assuming either perfect bonding or complete debonding conditions [18,19,20]. In practice, however, SAIB degradation is prone to initiating various forms of distress in SBDPs [21,22,23,24]. While FEM analyses, grounded in the framework of continuum mechanics, are capable of discretizing materials into continuous elements to resolve global stress–strain fields, they inherently lack the capacity to capture the inter-particle contact forces and dynamic motion at the mesoscopic scale.

1.2.3. Rutting Behavior of SBDP Investigated Through the Discrete Element Method

The DEM, based on the assumption of a discontinuous medium, applies Newton’s second law to track both the translational and rotational motions of individual particles while simultaneously capturing contact forces and interparticle interactions. This approach enables the characterization of force chain transmission within granular assemblies, thereby providing a meso-mechanical basis for interpreting the macroscopic mechanical behavior of materials [25,26,27,28]. Extensive studies have employed DEM to investigate the permanent deformation behavior of asphalt mixtures. For example, virtual rutting simulations were performed by Ma et al. [29], in which internal displacement fields and contact force distributions were systematically examined. Their findings demonstrated that DEM-based simulations are particularly effective in capturing deformations resulting from the combined effects of material densification and lateral flow. Furthermore, DEM has been adopted by Zhang et al. [30] and Ma et al. [31] to evaluate the influence of porosity levels, spatial distribution, and void geometry on the rutting resistance of asphalt concrete. Zhang et al. [32] utilized DEM to simulate uniaxial static creep tests, in which aggregate angularity, orientation, surface texture, and distribution were precisely controlled. Their results highlighted the critical role of aggregate morphology in enhancing the deformation resistance of asphalt mixtures.
However, most existing DEM studies have been confined to conventional asphalt pavements, and investigations targeting the rutting evolution in SBDP remain limited. In practice, the SACSS, composed of a discontinuous asphalt mixture layer and a continuous isotropic steel plate, exhibits highly heterogeneous behavior that cannot be adequately represented using a single numerical technique. To overcome this limitation, a coupled discrete element–finite element (DEM–FEM) modeling framework can be employed. In this hybrid approach, the FEM is used to simulate the continuum response of the steel plate, while the DEM captures particle–scale interactions within the asphalt mixture. For instance, Zhong et al. [33] utilized DEM to represent the granular behavior of debris flows and FEM to simulate the structural response of reinforced concrete bridge piers, thereby investigating impact-induced stress and failure mechanisms. Zeng et al. [34] applied a DEM–FEM coupling method to examine the interaction between tires and granular foundations. Similarly, Ge et al. [35] modeled non-uniform load transfer from tires to the pavement structure using FEM and described the contact interactions and meso-mechanical behavior among asphalt mixture particles using DEM. Through this approach, particle displacement, velocity, and force chain evolution under rolling tire loads were effectively evaluated. Nonetheless, prior studies have primarily focused on the influence of material properties within the asphalt mixture, whereas external structural factors—such as the stiffness of the steel deck and the presence of surface cracks—have received insufficient attention.
To address this research gap, particularly regarding meso-scale analysis of rutting evolution mechanisms in SBDP, the remainder of this study is structured as follows. Section 2 presents laboratory rutting tests conducted at 30 °C and 45 °C, which were used to calibrate the contact model parameters between asphalt mortar and coarse aggregates in the numerical model. In addition, rutting tests were performed on SACSS under three different SAIB conditions at the same temperatures to provide a foundation for validating the numerical simulations. Section 3 details the development of a three-dimensional (3D) SACSS model using the DEM–FEM coupled method. Contact parameters between particles and the steel plate were determined through a combination of laboratory and virtual direct shear tests. In Section 4, the reliability of the proposed numerical model is verified. The influence of surface cracking on rutting development in SBDP is then evaluated. Moreover, the spatial motion and mechanical evolution of particles within SACSS containing surface cracks are analyzed as a special case. The effect of the steel plate’s elastic modulus on particle displacement during rutting progression is further examined. Finally, Section 5 summarizes the main conclusions of the study.

2. Materials and Methods

In accordance with the rutting test specifications outlined in the Test Procedure for Asphalt and Asphalt Mixtures in Highway Engineering (JTG E20-2011) [36], a dense-graded asphalt mixture designated as AC-13 with a nominal maximum aggregate size of 13 mm was prepared. The target gradation of the designed asphalt mixture is illustrated in Figure 1, while the key technical properties of the asphalt binder and basalt aggregates are presented in Table 1 and Table 2, respectively.
In order to determine the contact model parameters between asphalt mortar and coarse aggregates for numerical simulation, rutting tests were conducted using an automatic rutting tester at 30 °C and 45 °C, respectively. Rutting specimens with dimensions of 300 mm in length, 300 mm in width, and 60 mm in height were used in the tests, including a 10 mm thick steel plate. The specimen and test equipment of the wheel tracking test are shown in Figure 2. A load of 78 kg exerting a pressure of 0.7 MPa was applied to the slab specimen using a rubber wheel with a width of 50 mm. The rubber wheel oscillated 42 times per minute on the specimen, with each traversal measuring 230 mm. The total duration of the test was 60 min, and the equipment was paused after every 120 passes of the test wheel to record the rutting depth at that moment.
In order to verify the reliability of the SACSS model established in this study, rutting tests were conducted using an automatic rutting tester at 30 °C and 45 °C under three different SAIB conditions. The proportions of the SAIB failure area were set as 0%, 17%, and 100%. Three specimens were prepared for each SAI condition. The specimen preparation procedure was as follows: Epoxy asphalt binder was uniformly coated at a dosage of 0.68 L / m 2 on steel plates previously treated with epoxy zinc-rich paint. The binder was applied selectively according to the designed layout to create different SAIB scenarios. In the regions designated for SAIB failure, an anti-adhesive isolating agent was applied instead of epoxy asphalt binder, whereas epoxy asphalt binder was used in the non-failure regions. The arrangement of SAI failure and non-failure areas is illustrated in Figure 3. Subsequently, the asphalt mixture with specified aggregate gradation was compacted onto the steel plates to produce SACSSs. Finally, the specimens were placed in the automatic rutting tester for rutting tests, and the maximum rut depths obtained under three different SAIB failure conditions at 30 °C and 45 °C were recorded in Table 3 and Table 4, respectively. It was observed from a macroscopic viewpoint that the SAIB failure aggravated the development of rutting.

3. Numerical Analysis

3.1. Loading Method of the Wheel Tracking Test

To accommodate the limitations of available computational resources, a virtual wheel tracking test was conducted using a rutting specimen model with dimensions of 300 mm in length, 50 mm in width, and 60 mm in depth, incorporating a 10 mm thick steel plate, as illustrated in Figure 4. Due to the limited computational efficiency of PFC 3D, three-dimensional virtual wheel tracking simulations involving rolling loads could not be performed. Instead, a virtual loading area subjected to cyclic loading was implemented to emulate the effects of a wheel tracking test, as defined by Equation (1). This loading area, with a size of 50 × 50 mm 2 , was applied at the center of the asphalt mixture slab. The temporal variation of the loading stress is depicted in Figure 5.
y = A sin ( 0.7 π t )
where A is the half-sine amplitude, which is 0.7 MPa, and t is the loading time.

3.2. 3D Discrete–Continuous Coupling Model

3.2.1. Modeling Process

For the SBDP model, following a representative definition [37], aggregates with a sieve size smaller than 2.36 mm are classified as part of the asphalt mortar, whereas aggregates with a sieve size larger than 2.36 mm are categorized as coarse aggregates. In PFC, the modeling of SBDP begins with the creation of a virtual domain equivalent to the SBDP model using the ‘wall’ command. Spherical aggregates are then generated based on the designed gradation. The aggregate template is imported via the ‘geometry import’ command, followed by the use of the ‘clump distribute’ command to generate clump particles with specified sizes and volumes according to the template. These clumps are used to replace the spherical representations of coarse aggregates. Subsequently, after generating the coarse aggregates, uniformly distributed balls with a radius of 1 mm are created throughout the SBDP using the ‘ball generate’ command. Based on the spatial position and geometric shape of the coarse aggregate clumps, the regularly arranged balls are grouped: those with centers located inside the clumping geometry are defined as coarse aggregates, while the remaining balls are identified as asphalt mortar. As AC-13 is a multiphase material composed of coarse aggregates, asphalt mortar, and air voids, the number of balls representing voids is calculated according to the target air void ratio of the asphalt mixture. A random algorithm is employed to delete 5% of particles from the asphalt mortar domain to simulate the void structure. The SBDP modeling process is illustrated in Figure 6.
The steel bridge deck model was constructed using the ‘zone create brick’ command in FLAC 3D, based on a continuous geometry measuring 300 mm × 50 mm × 10 mm. As steel exhibits linear elastic behavior under normal service stress (well below its yield strength), it was modeled as an isotropic elastic material using the zone model assigned elastic command. The material properties were defined with ‘zone property young…poisson…’ of 206 GPa and a Poisson’s ratio of 0.19 via the zone property command. The mesh was generated using the ‘brick’ grid pattern, with the size keyword specifying the number of divisions in each coordinate direction. To ensure both computational accuracy and stability during coupled simulations, the mesh was discretized into one hundred and fifty, twenty-five, and five elements along the x-, y-, and z-axes, respectively, as illustrated in Figure 7.

3.2.2. DEM-FEM Coupling Model

Establishing the transition mode and boundary conditions between the DEM and FEM is essential for the discrete–continuous coupling model of SACSS. The wall was employed as an intermediate medium and defined as the contact interface between the DEM and FEM domains. The contact interaction between the wall and particles was modeled using contact springs characterized by normal and shear stiffnesses, and the linear parallel bond model (LPBM) was adopted as the contact model. Afterward, the SACSS model was finalized by introducing surface cracks with dimensions of 2 mm × 50 mm × 15 mm. Figure 8 illustrates the DEM–FEM coupled model of the SACSS, in which the yellow region represents the contact model of the SAIB.
In the coupling analysis, velocity and force are employed as the primary coupling variables. Initially, the contact forces among discrete element particles are calculated in PFC 3D based on force–displacement relationships, and the results are stored at the coupling boundary. These contact forces are subsequently imported into FLAC 3D, where the equations of motion are solved, and the resulting velocities are transferred to the PFC 3D model via the coupling boundary. PFC 3D then reads the velocity data from the boundary, updates the contact forces in accordance with Newton’s second law, and transmits the revised forces back to the boundary. These updated forces are subsequently returned to the FLAC 3D model and applied as boundary conditions to update its mechanical response. This iterative exchange process, illustrated in Figure 9, continues until the FLAC and PFC models reach equilibrium, the current computational time t reaches the specified total time T, and the coupling analysis is thereby concluded.

3.2.3. Contact Constitutive Model

Among various contact models, the LPBM is commonly adopted to simulate the inter-particle bonding forces and fracture behavior [38,39]. In DEM, the LPBM is capable of transmitting both forces and moments [40]. When the contact stress exceeds the strength limit, bond breakage occurs, and the constitutive model subsequently degrades into a linear contact model, as illustrated in Figure 10. In Figure 10, g s denotes the surface gap between contact particles; k n and k s represent the normal and shear stiffness of the particles, respectively; k ¯ n and k ¯ s represent the normal and shear stiffness of the bond, respectively; σ ¯ c is the normal strength; c ¯ is the cohesion; ϕ ¯ is the internal friction angle; and μ is the friction coefficient. Based on the mechanical properties of the SBDP and the epoxy asphalt bonding layer, the LPBM was selected as the contact model for both the pavement and bonding layer.

3.2.4. Mesoscopic Parameters

Laboratory tests commonly used to characterize the permanent deformation behavior of asphalt mixtures typically involve complex stress states encompassing both tensile and compressive components. These tests often require advanced and expensive equipment, which presents challenges for many testing laboratories in terms of accessibility and cost. In this context, uniaxial loading tests have been recognized as more practical and cost-effective alternatives to triaxial tests for evaluating the permanent deformation of asphalt mixtures [41].
Within the framework of the DEM, uniaxial compression tests are widely employed for mesoscopic parameter calibration. Since no direct correlation exists between the macroscopic mechanical properties of materials and the mesoscopic parameters in DEM, the LPBM parameters cannot be determined analytically. As recommended in the PFC user manual, a trial-and-error approach was adopted, in which the parameters were iteratively adjusted until the numerical results closely matched the corresponding laboratory measurements.
As an illustrative example, the calibration results at 30 °C are presented in Figure 11. To calibrate the mesoscopic parameters, virtual tests were conducted under the same conditions as those in laboratory experiments. Based on the findings of Liu et al. [42], the stress–strain curve of basalt specimens under virtual uniaxial compression was obtained (Figure 11a). The stress–strain response of asphalt mortar specimens under virtual uniaxial compression was derived from the work of Bai et al. [43] (Figure 11b). Then, the shear stress–displacement curve from virtual direct shear tests at the interface was obtained according to the results reported by Liu et al. [44] (Figure 11c). In addition, the contact parameters between asphalt mortar and aggregates were calibrated based on the results of laboratory rutting tests. Moreover, given that the interlayer shear strength decreases with increasing temperature [44], the mesoscopic parameters for the steel–asphalt interface at 45 °C were set slightly lower than those at 30 °C. The final calibrated mesoscopic parameters adopted in the model are summarized in Table 5.

4. Results and Discussion

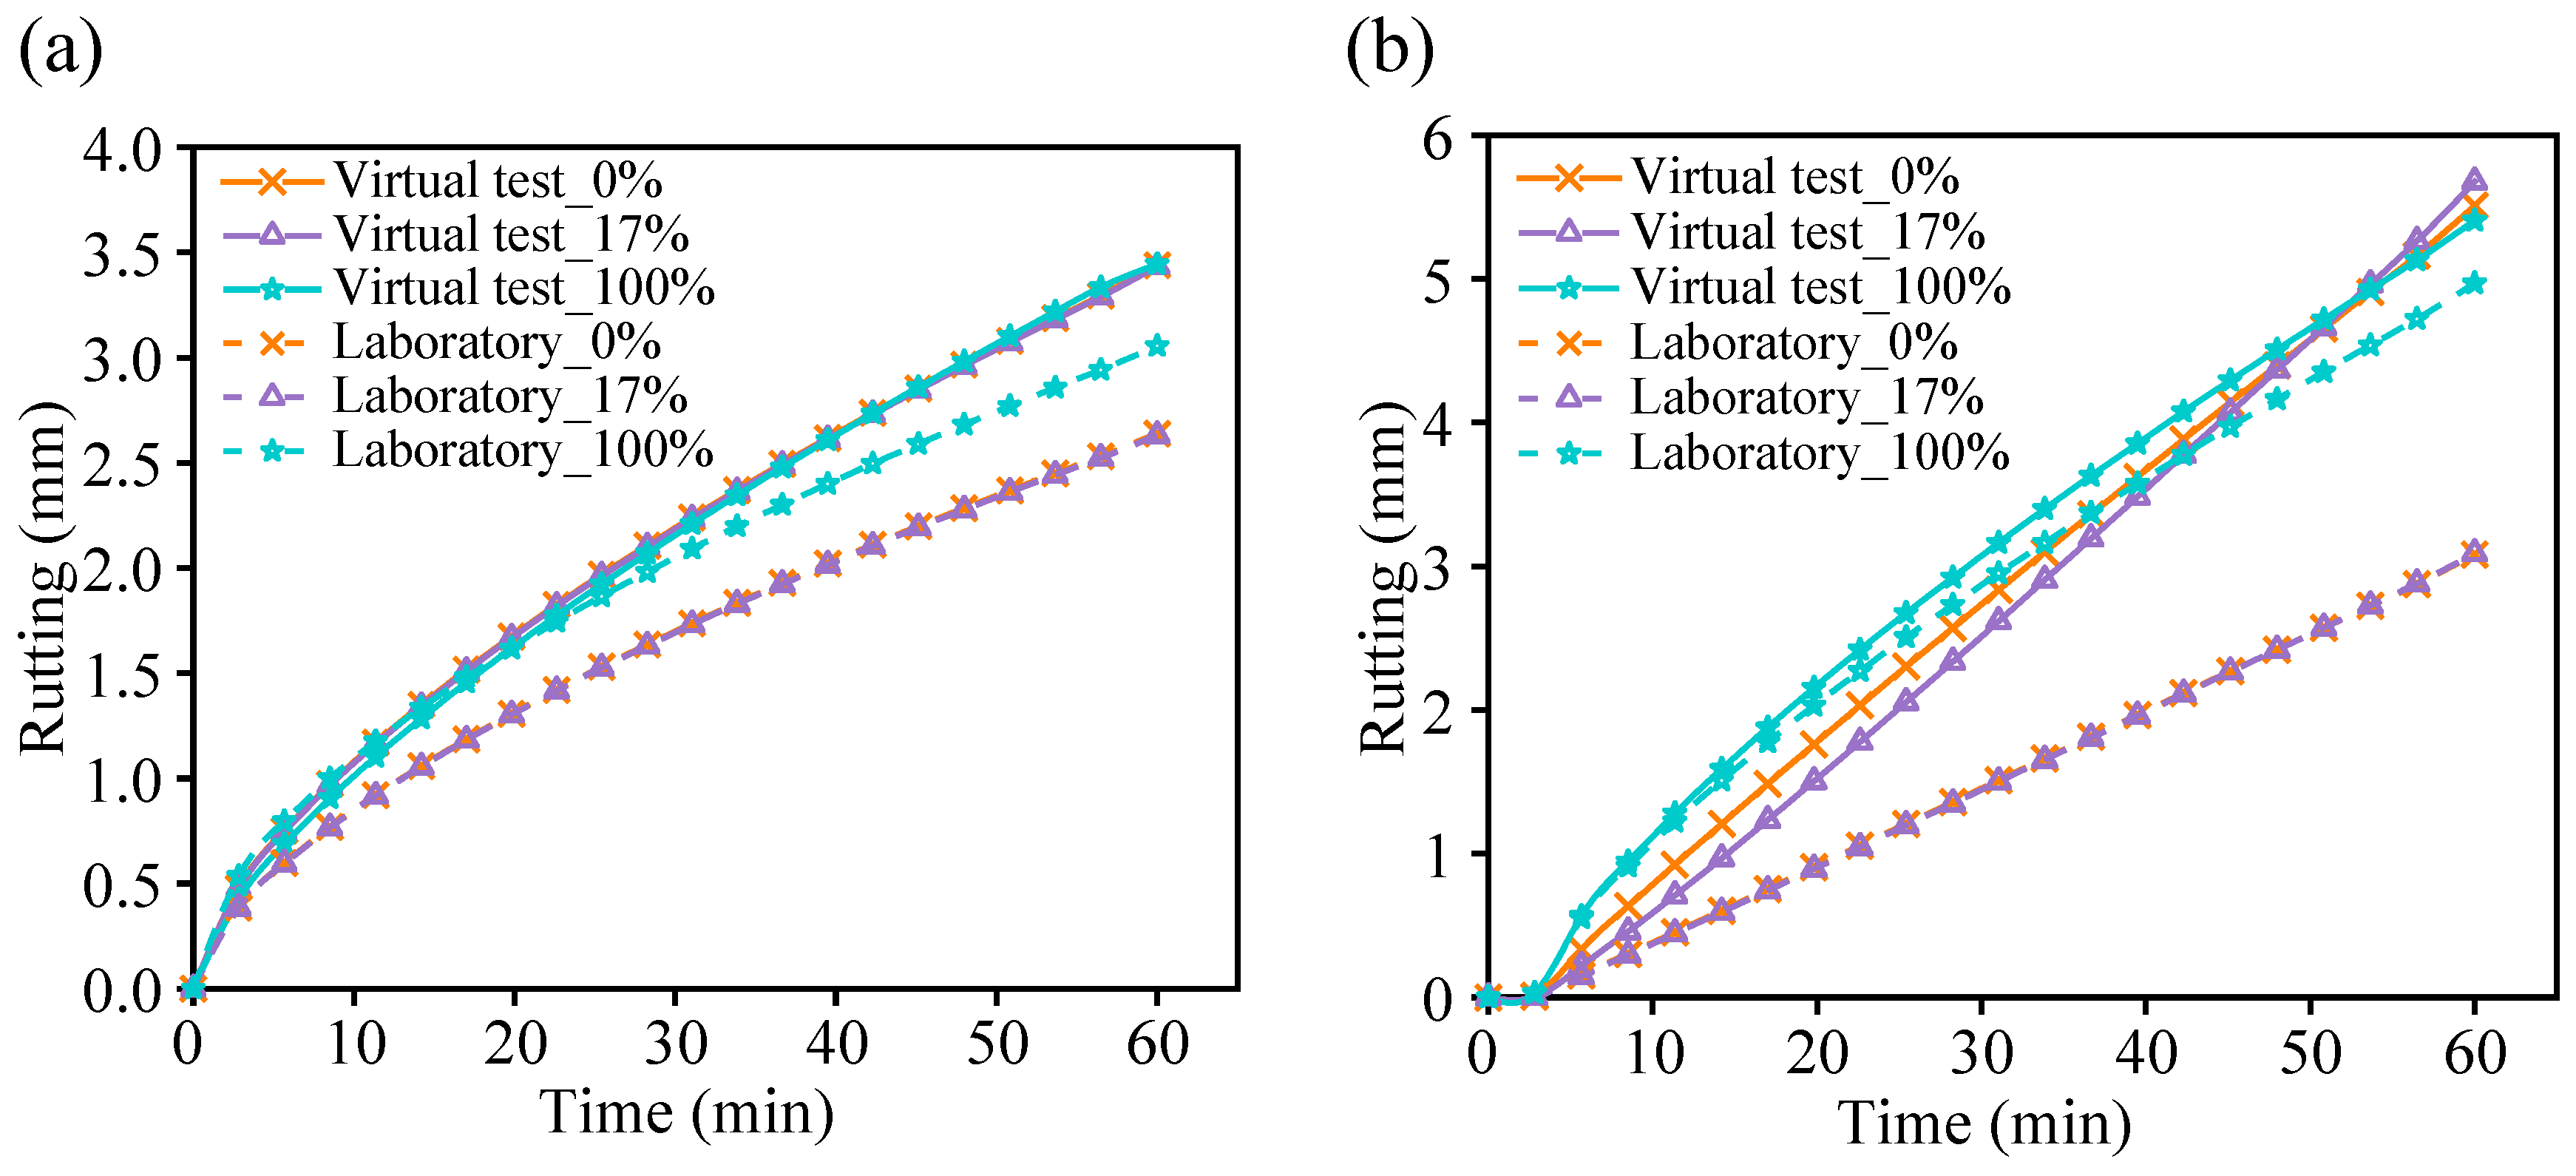
4.1. Model Verification

To validate the reliability of the numerical simulation results, virtual rutting tests under three SAIB conditions were conducted at 30 °C and 45 °C based on laboratory rutting experiments. Figure 12 presents the rutting depth versus loading time curves from both laboratory and virtual tests. From Figure 12, the following observations can be made: (1) Under both temperature conditions, the virtual test curves corresponding to SAIB failure area ratios of 0% and 17% were nearly coincident, consistent with the laboratory test results. (2) At 30 °C, when the SAIB failure area ratio was 100%, a significant increase in rutting depth was observed in the laboratory test, while the increase in the virtual test was relatively limited. This discrepancy can be attributed to the use of an anti-adhesion agent on the interface in the laboratory, resulting in a smooth surface with no friction, whereas the debonding in the virtual specimen was modeled using a linear contact model, in which the interface was affected by both linear forces and friction, thereby constraining the rutting development to some extent. (3) At 45 °C, when the SAIB failure area ratio was 100%, the numerical simulation curve showed a high degree of similarity in both shape and trend with the experimental curve, and the values were also close. In summary, the rutting depth-loading time curves from the virtual and laboratory tests at 30 °C and 45 °C exhibited good agreement, indicating that the proposed three-dimensional SACSS discrete–continuous coupled model and its parameters were reasonably established and can be effectively applied to simulate and investigate rutting behavior in SACSS structures.

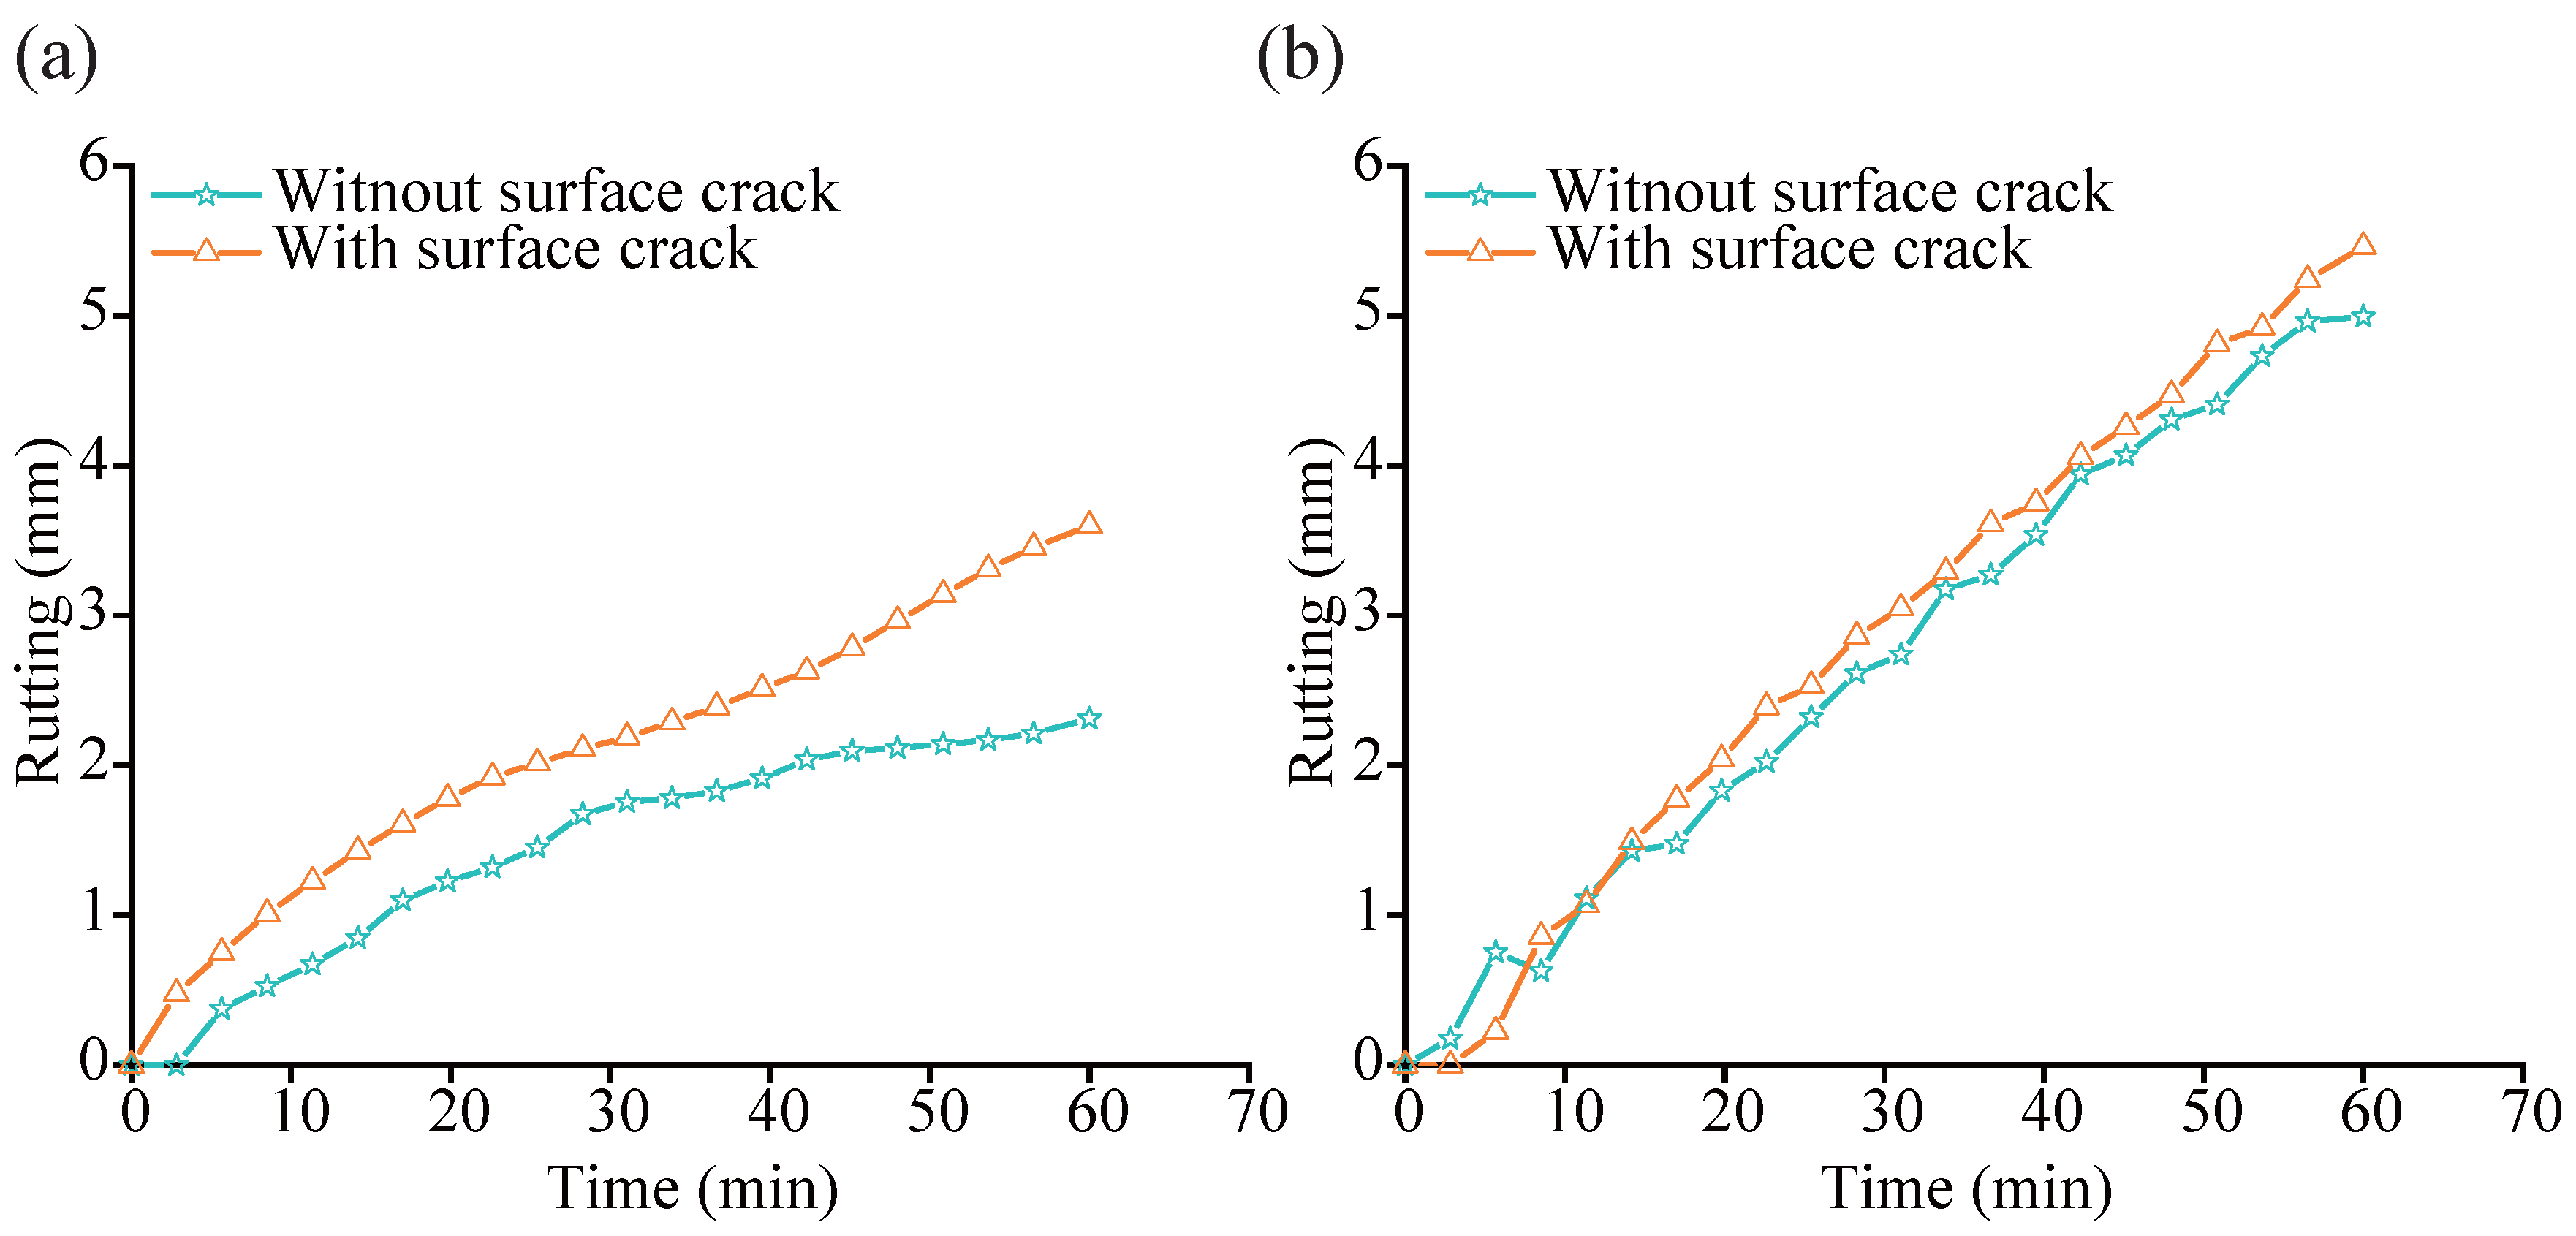
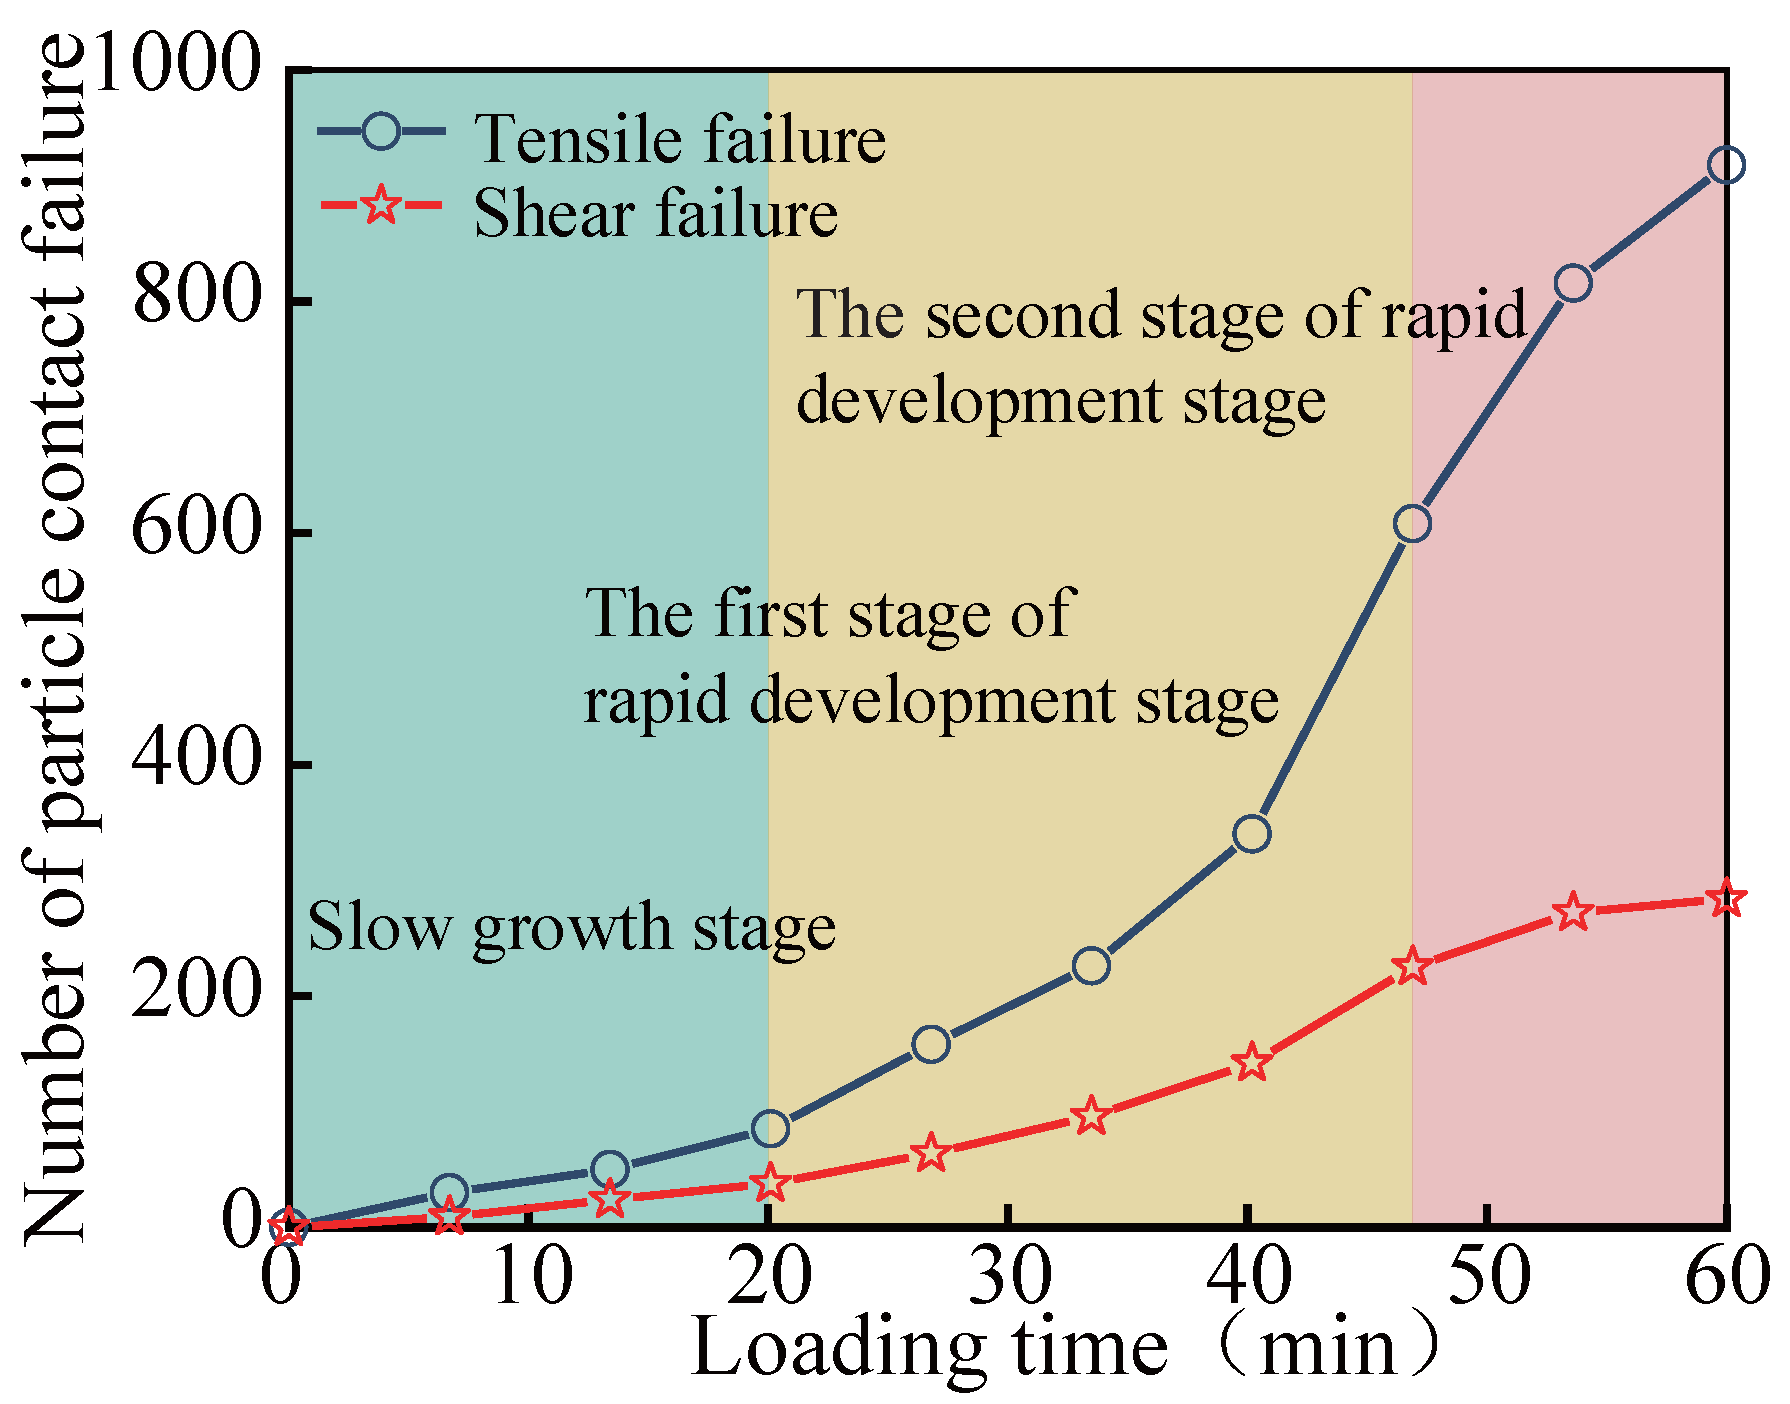
4.2. Coupled Evolution of Rutting and Cracking

Figure 13 presents the variation in rutting depth over time obtained from virtual rutting tests of the SACSS model under 30 °C and 45 °C conditions, comparing two scenarios: with and without surface cracks. As shown in Figure 13a, the SACSS model with a surface crack exhibited a faster rutting development rate from the early stages of loading. At 60 min, a rut depth of 3.598 mm was reached in the cracked model, while the rut depth in the model without cracks was 2.311 mm, indicating that the presence of surface cracks increased the rut depth by 35.77%. When the temperature was elevated to 45 °C, rut depths of 5.460 mm and 4.991 mm were observed in the cracked and crack-free models, respectively, with the presence of surface cracks contributing to a 9.4% increase in rut depth. These results indicate that the presence of a surface crack significantly accelerated rutting development. However, the influence of the crack was reduced under elevated temperature, at which point the rutting behavior was predominantly governed by the overall flow characteristics of the asphalt mixture.
Figure 14 illustrates the relationship between particle contact failure and loading duration at a temperature of 30 °C. The evolution of meso-cracks under continuous loading can be categorized into two distinct stages: a gradual development phase and a rapid propagation phase.
The initial gradual development phase corresponds approximately to the first 0–20 min of loading. During this period, 85 tensile contact failures and 38 shear contact failures were recorded. These results indicate that meso-cracks began to form within the specimen due to the applied external load; however, limited crack propagation was observed at the surface of the SBDP. At the mesoscopic scale, this can be attributed to the fact that only a small number of inter-particle contacts were fractured in the early stage, and the structural integrity of the asphalt mixture remained largely preserved.
As the loading continued to intensify, the asphalt mixture entered the rapid propagation phase, spanning approximately 20 to 60 min. This stage exhibited a characteristic cyclic trend described as ‘initial acceleration followed by deceleration’. From 20 to 46.9 min, a pronounced increase in contact failures was observed: tensile failures rose from 85 to 608, while shear failures increased from 38 to 225. In the subsequent interval (46.9 to 60 min), the growth rate of contact failures slowed, culminating in 918 tensile and 284 shear failures. Compared with the initial phase, a significant degradation of the mixture’s internal structure occurred due to widespread inter-particle bond breakage. As a result, the formation of meso-cracks surpassed a critical threshold and re-accelerated after a brief deceleration, indicating a recurrent escalation trend.
Throughout the loading process, the number of tensile contact failures consistently exceeded that of shear failures, with the disparity becoming more pronounced during the rapid propagation phase. This observation suggests that loading duration had a more substantial impact on normal tensile failure than on shear failure in the asphalt mixture.

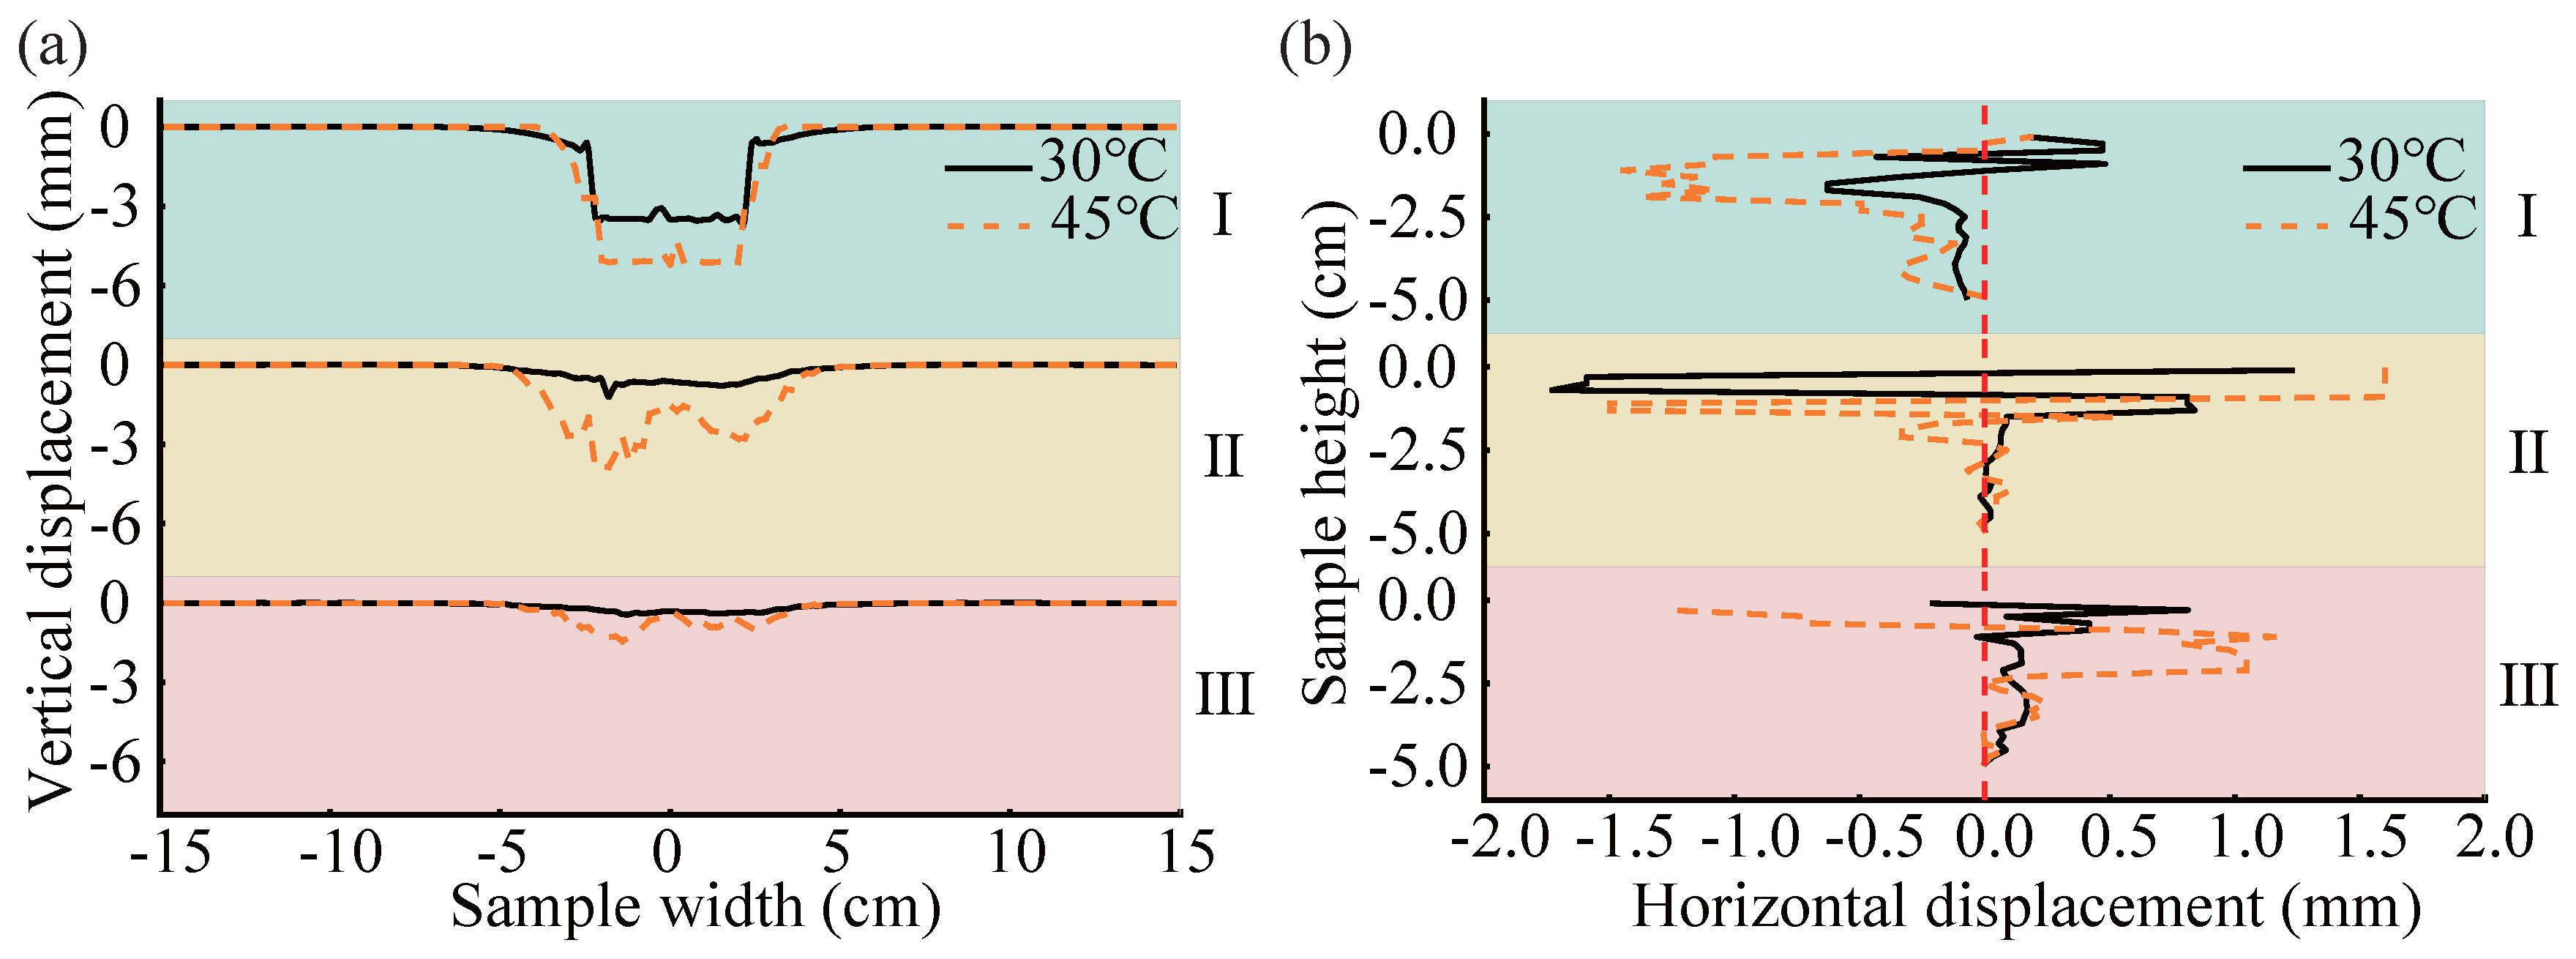
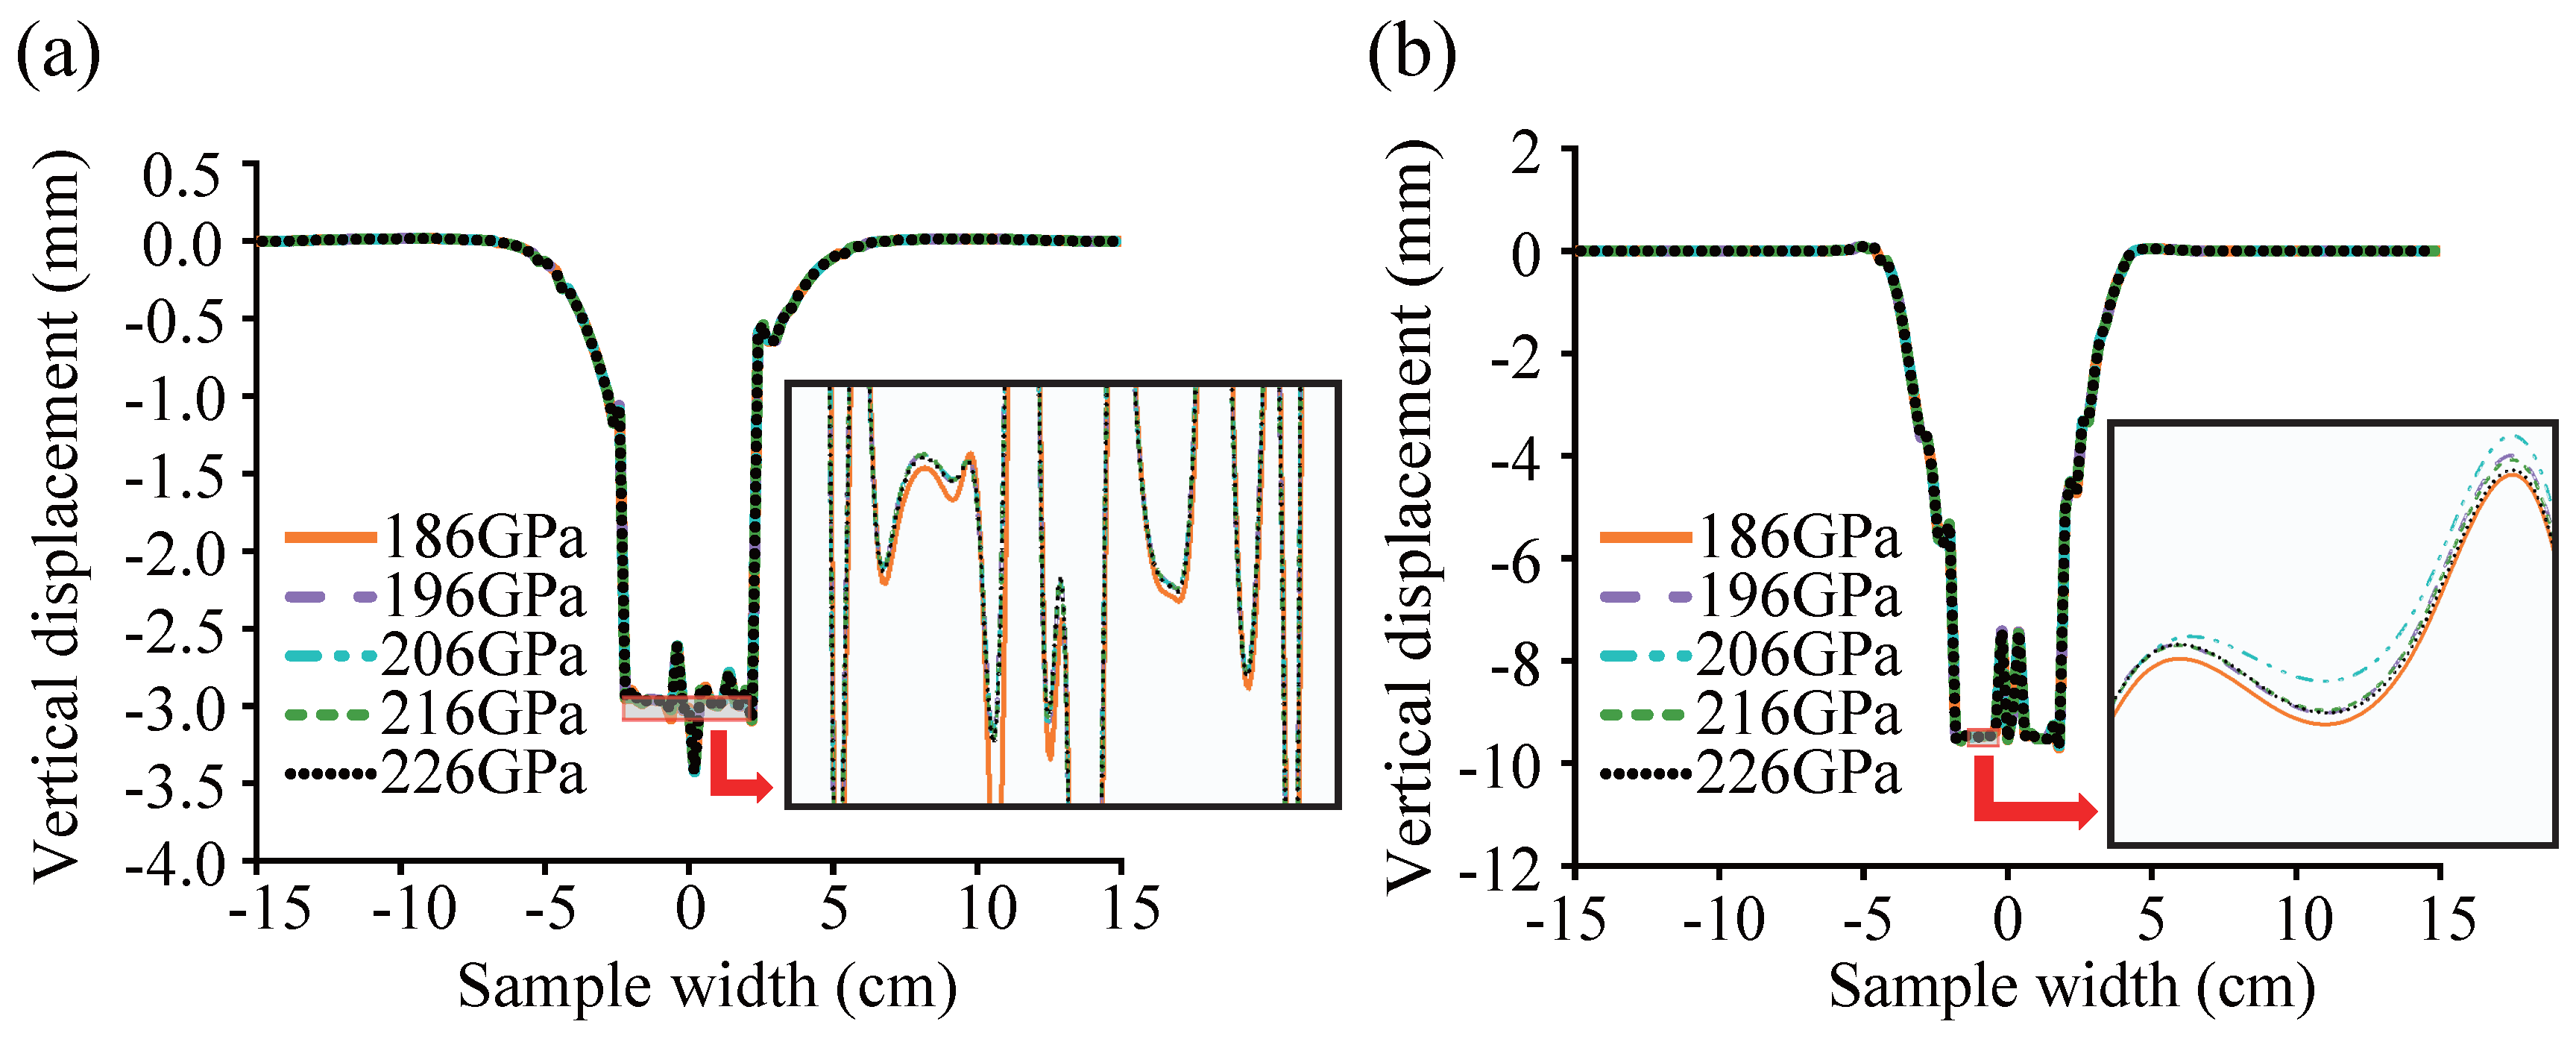
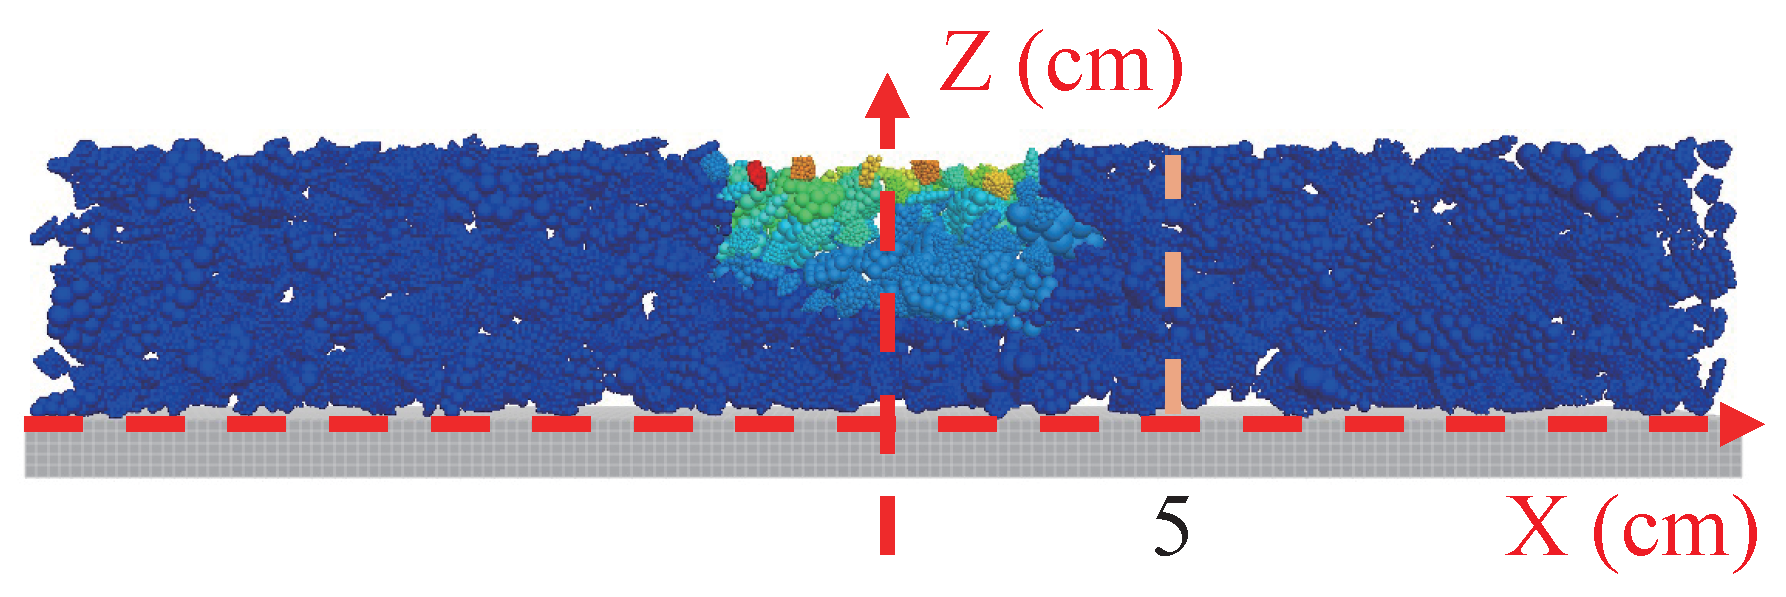
4.3. Displacement Distribution During the Virtual Test

The displacement behavior within the asphalt mixture exhibits significant non-uniformity due to the material’s inherent discontinuity and heterogeneity. To facilitate a more detailed analysis of the displacement distribution, both vertical and horizontal particle displacements were extracted at various sections, as illustrated in Figure 15. At two temperatures—30 °C and 45 °C—vertical displacements were recorded at cross-sections I, II, and III, positioned at depths of 0, 1.875, and 3.75 cm from the top surface (Figure 15a), while horizontal displacements were measured at vertical sections I, II, and III, corresponding to the left edge, center, and right edge of the loading area (Figure 15b). The resulting displacement data are presented in Figure 16.
The results reveal that both vertical and horizontal displacements are primarily concentrated within the loading zone. As shown in Figure 16a, the maximum vertical displacement occurs at the specimen’s top surface and gradually decreases with depth. In addition, material heterogeneity leads to noticeable variability in vertical displacement within the same cross-section. With respect to horizontal displacement (Figure 16b), Section I near the left edge exhibits predominantly leftward displacement, while Section III near the right edge shows a rightward trend. Section II at the center displays bidirectional fluctuations. In particular, horizontal displacements are mostly confined to the upper 2.5 cm of the specimen, particularly in the vicinity of the constructed fracture zone (0–1.5 cm depth).
These observations confirm that the combined effects of material densification and lateral flow constitute the primary mechanism of rutting in asphalt mixtures. As the temperature increases from 30 °C to 45 °C, the horizontal displacements in Sections I and III within the top 1.5 cm of the specimen significantly intensify. This indicates that higher temperatures promote greater lateral flow of the asphalt mixture in this region, thereby exacerbating rutting deformation. Furthermore, both vertical and horizontal particle displacements increase substantially with temperature. This behavior can be attributed to the reduced adhesive strength between the asphalt mortar and aggregates once the temperature approaches or exceeds the softening point of the asphalt. As a result, the asphalt mortar becomes more mobile, facilitating aggregate movement and ultimately undermining the high-temperature stability of the mixture.
Figure 17 illustrates the vertical displacement distribution of SBDP particles at location I (see Figure 15a) under varying steel plate moduli. As shown in Figure 17a, at 30 °C, the vertical displacement at certain positions within the loading area was greater when the elastic modulus of the steel plate was 186 GPa than in the other cases, indicating that the elastic modulus of the steel plate had an observable influence on particle displacement. Furthermore, Figure 17b reveals that at 45 °C, the vertical displacement was significantly smaller for the steel plate with a modulus of 206 GPa compared with that with 186 GPa. This suggests that the influence of steel plate stiffness on vertical displacement was negligible at lower temperatures but improved markedly under high-temperature conditions. Therefore, it can be concluded that selecting steel plates with a higher elastic modulus is beneficial for improving the rutting resistance of SBDP under elevated temperatures in practical engineering applications.

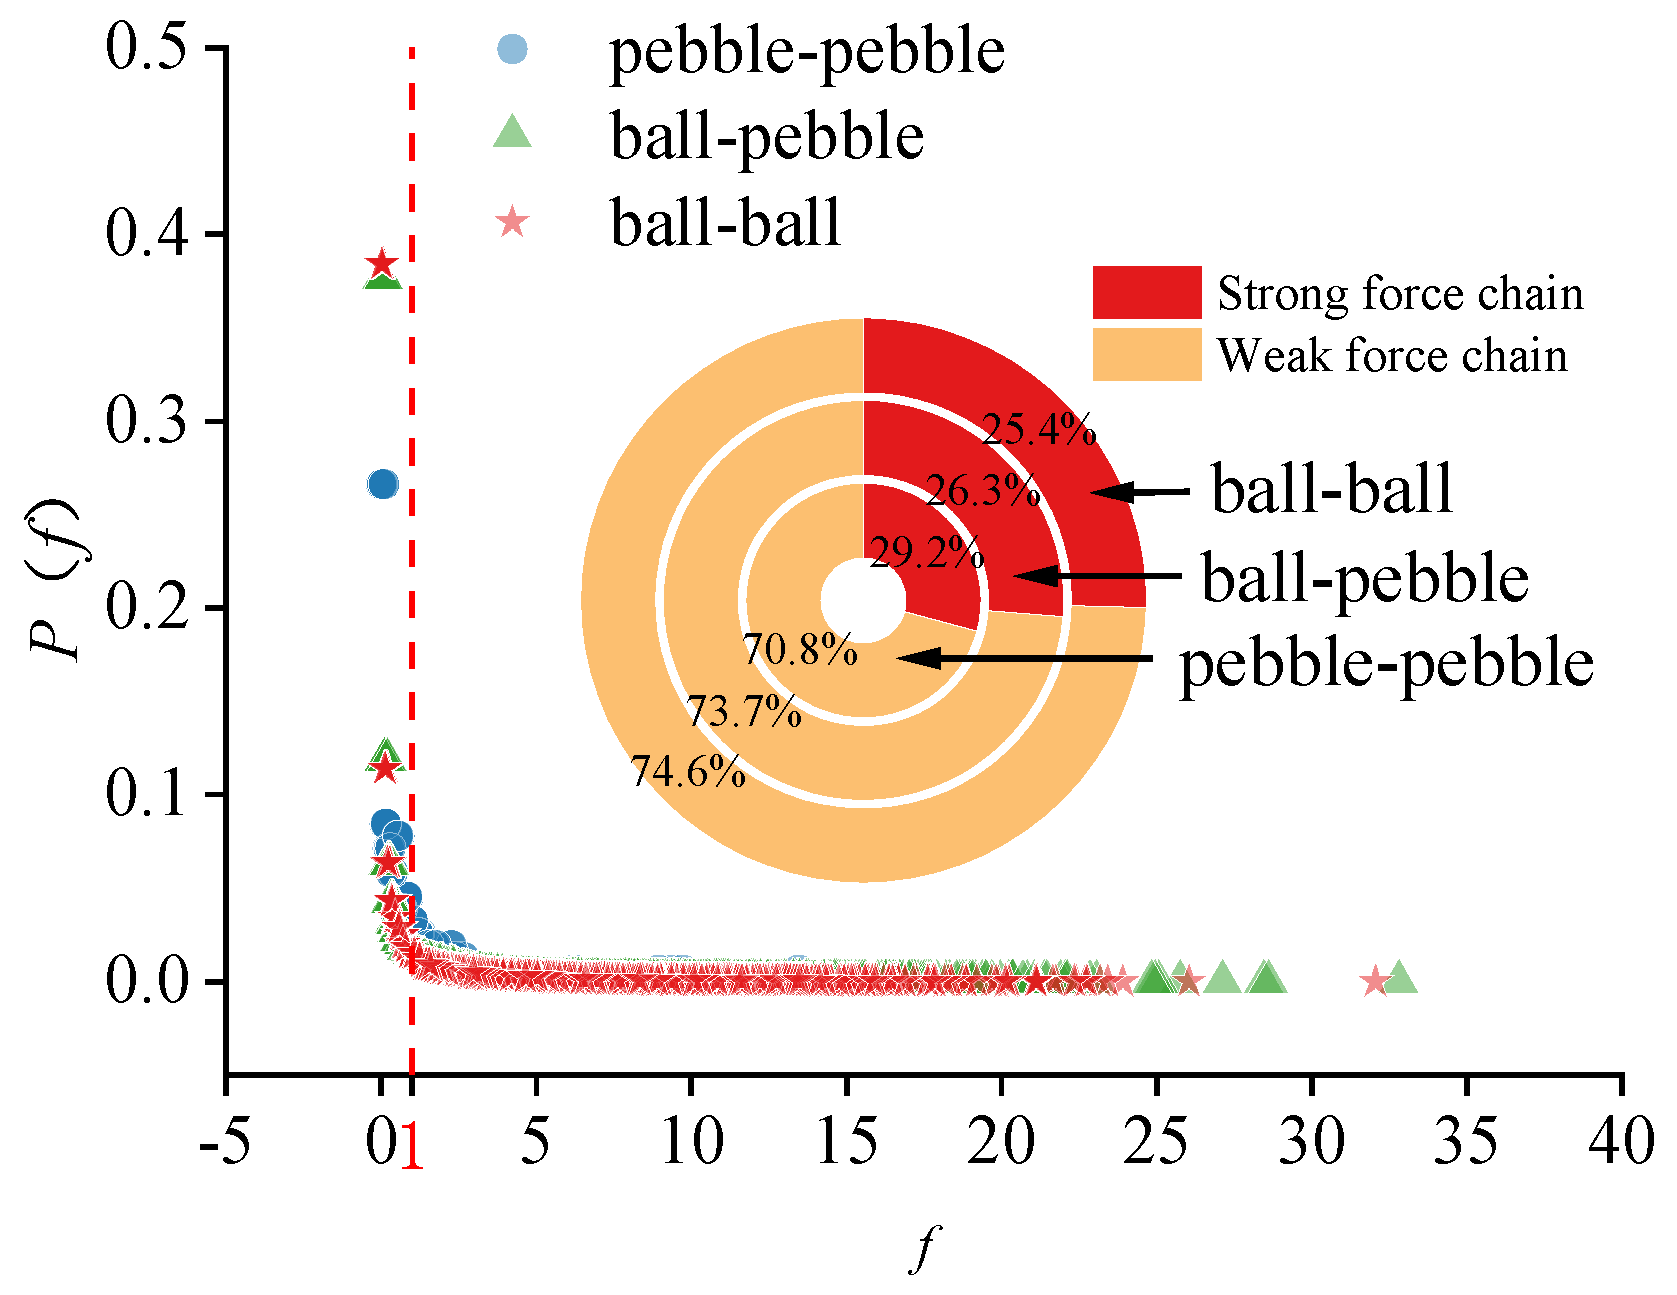
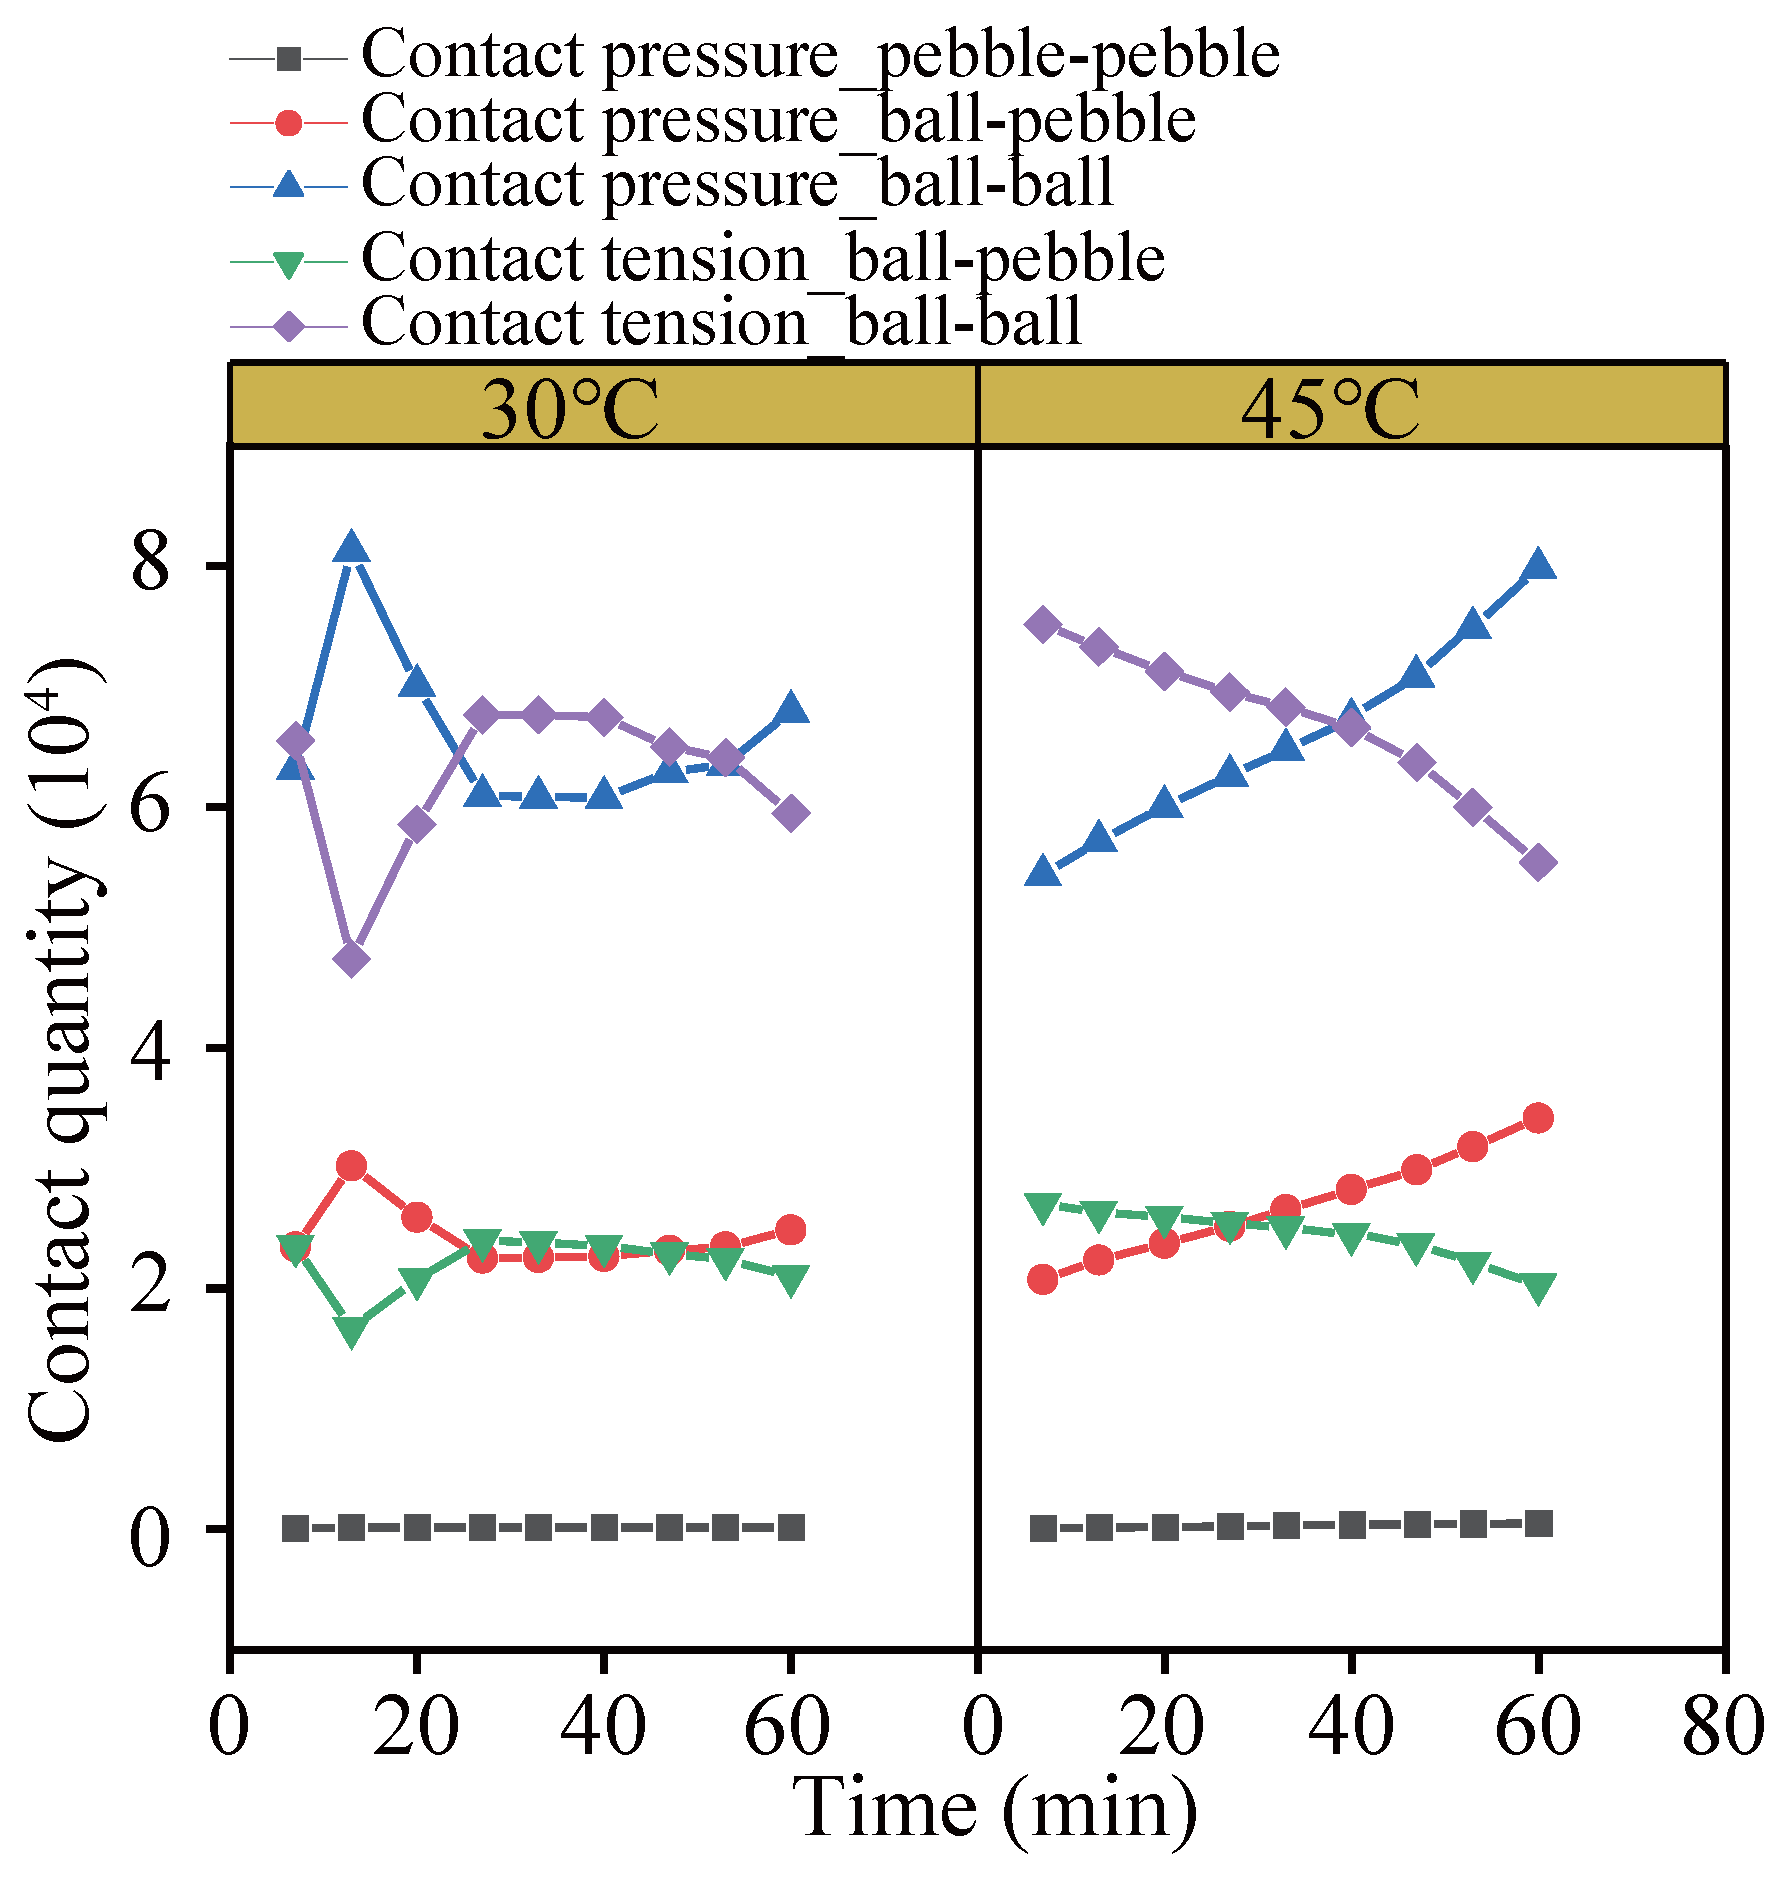
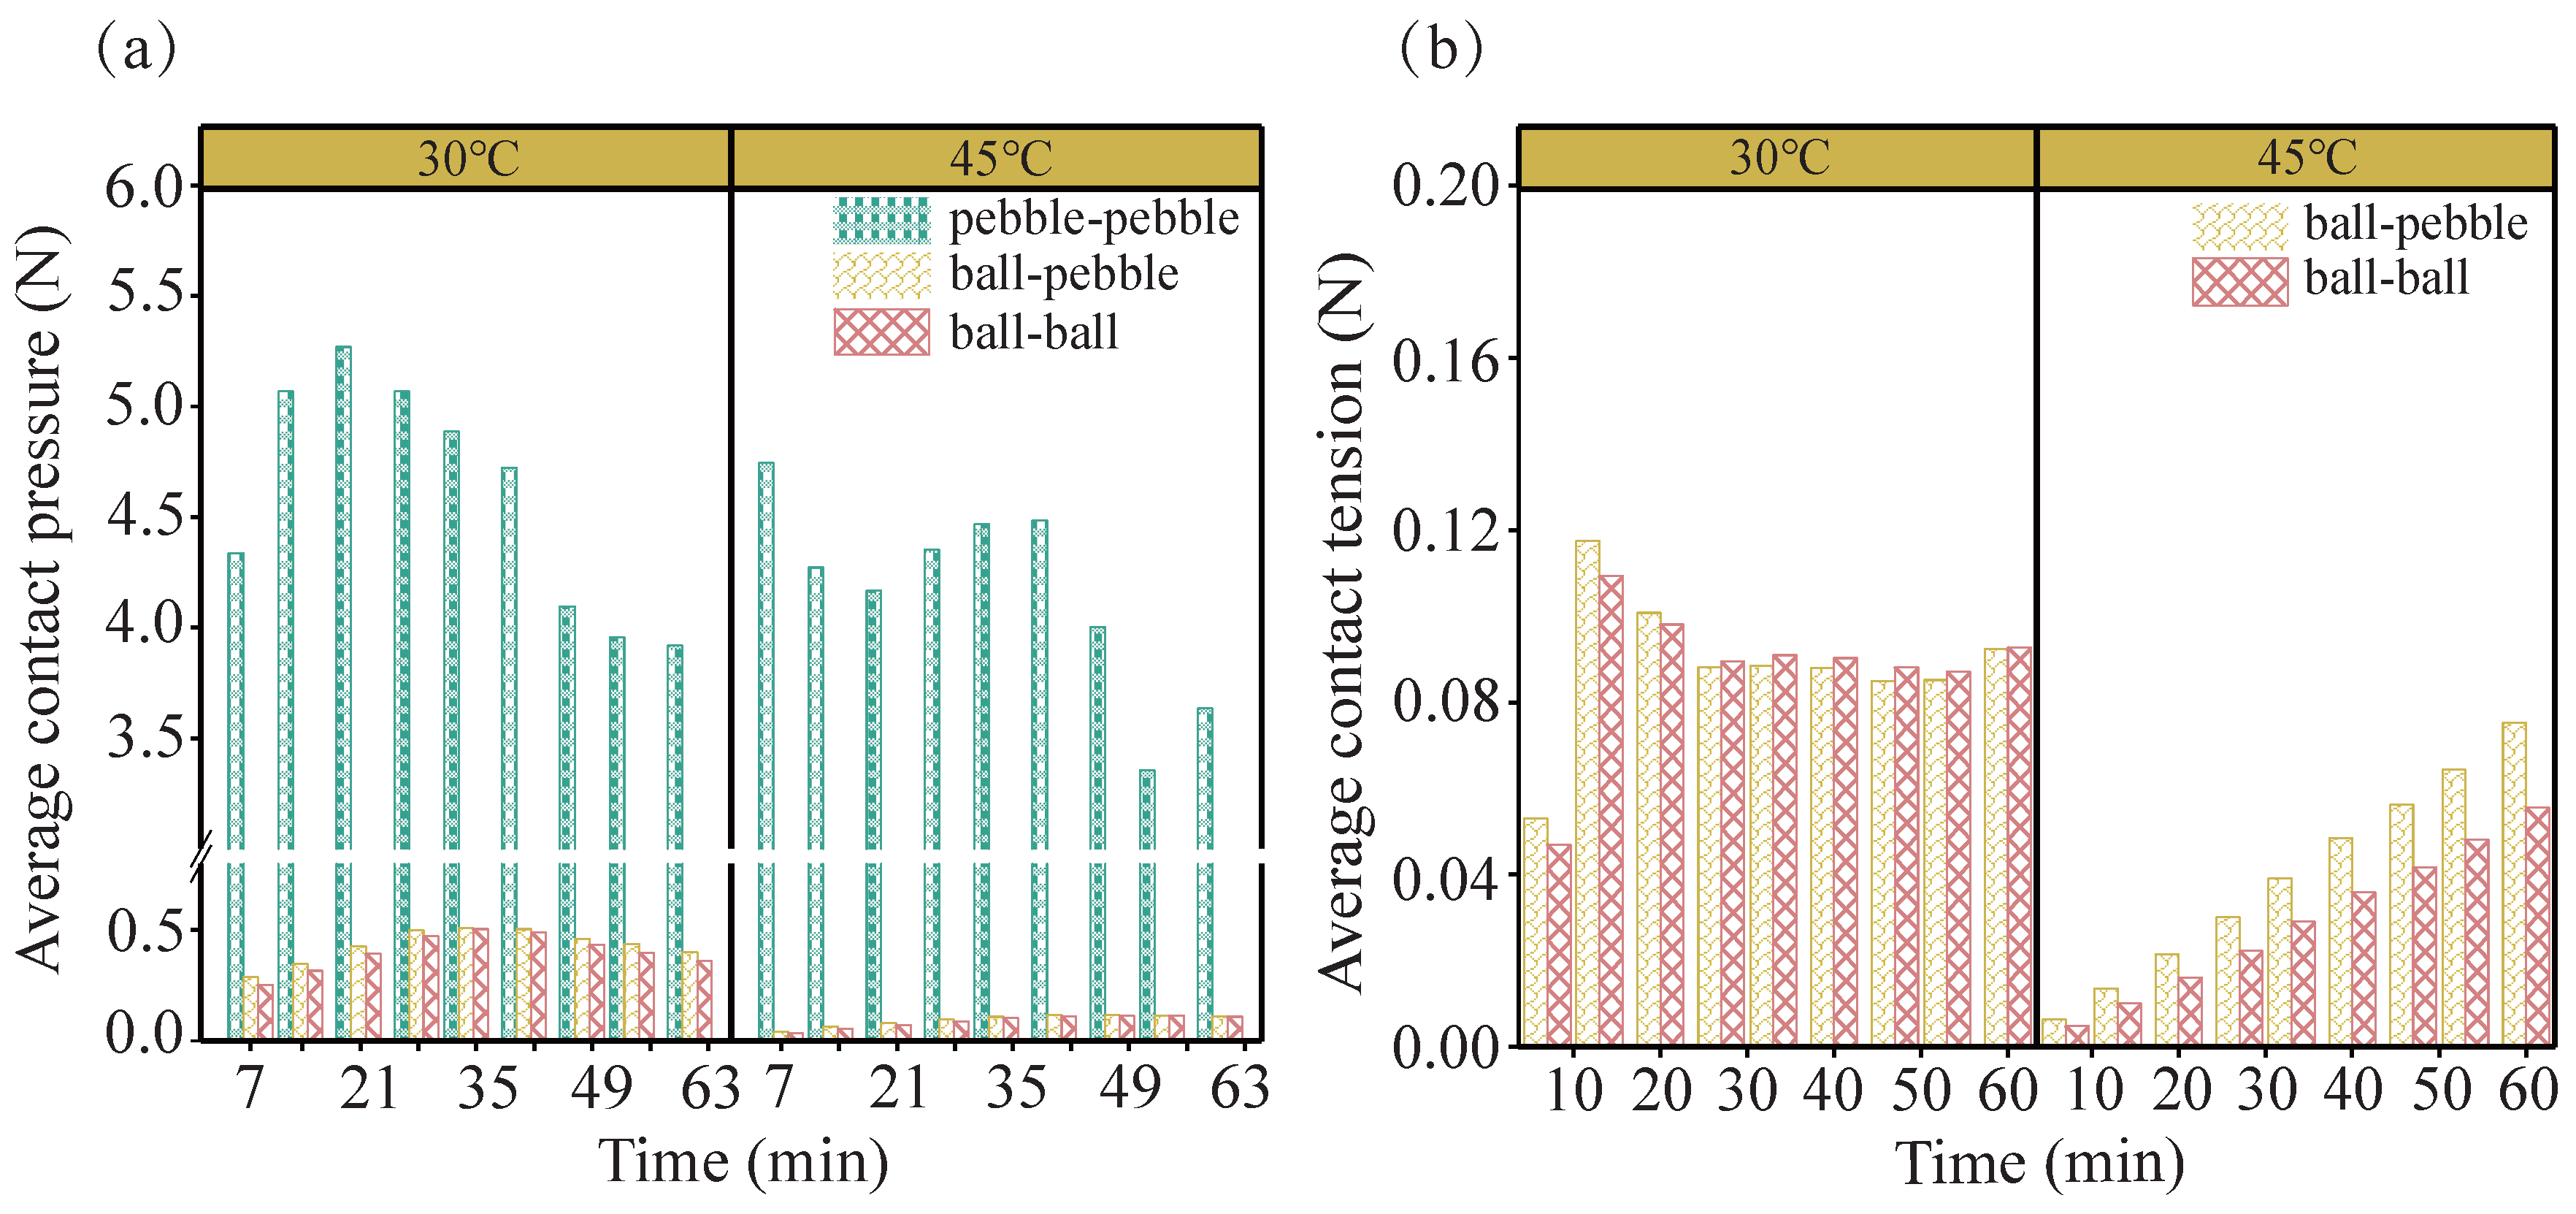
4.4. Mechanism of Force Distribution

In the DEM model, resistance to external loads within asphalt mixtures is primarily governed by inter-particle adhesion among discrete particle elements. The number of particle contacts and the magnitudes of contact forces directly reflect the mechanical response of the material to external loading. Among these factors, the force chain is considered a critical indicator for elucidating the internal load transfer mechanisms in granular systems.
To quantitatively assess the evolution of force chain structures in the virtual specimens, contact force data were extracted from the asphalt mixture and subjected to statistical analysis. The distribution characteristics of force chain strength were described using the probability distribution function of normalized contact forces, P(f), where f denotes the ratio of an individual contact force to the average contact force. This metric offers a robust and dimensionless means of characterizing the variability in contact forces under applied loading. The probability distribution P(f) was computed in accordance with Equation (2) [45,46].
P ( f ) = N [ ] k N
where N [ ] k is the number of force chains within the specified interval; [ ] 1 corresponds to the range [ 0 , 0.1 ] , [ ] 2 to [ 0.1 , 0.2 ] , and so on; N is the total number of force chains; k is the number of intervals.
Force chains associated with contact forces exceeding the average contact force are classified as strong force chains, whereas those with forces below the average are identified as weak force chains. Figure 18 presents the probability distributions of contact forces within the asphalt mixture at 30 °C, along with the corresponding distributions of strong and weak force chains.
The results indicate that the contact force distribution follows a negative exponential trend, wherein the probability P ( f ) decreases as the normalized contact force f increases. For values of f 1 , P ( f ) declines rapidly; however, the probability density remains relatively high in this range, suggesting a substantial presence of weak force chains. In contrast, for f > 1 , the decline in P ( f ) becomes more gradual, and the associated probability values are markedly lower. These findings imply that the majority of particles within the asphalt mixture are subjected to relatively small forces, while only a limited number of contact points bear larger forces. This non-uniform distribution results in localized stress concentrations, which constitute a fundamental meso-mechanical mechanism driving rutting development.
According to the pie chart analysis, strong force chains account for 25.4% of the total in asphalt mortar, 26.3% at asphalt mortar–aggregate interfaces, and 29.2% between aggregates. These results suggest that weak force chain networks are extensively distributed throughout the asphalt mixture. The weak and strong force chains form an interlaced network, wherein weak force chains function as structural fillers among the strong force chains, thereby enhancing the overall integrity of the material while facilitating deformation accommodation.
In this study, the number of contact forces across three types of contact interfaces was quantified, and the influence of temperature was systematically investigated. Figure 19 illustrates the distribution of compressive and tensile contacts among the three contact types under different temperature conditions.
At 30 °C, the number of contacts between aggregate particles is notably lower than those observed at aggregate–mortar interfaces and between asphalt mortar particles. The highest frequency of contact is recorded between asphalt mortar particles, consistent with the suspended dense skeleton structure commonly found in asphalt mixtures. Under repeated loading, alternating patterns are observed between compressive and tensile contacts within the asphalt mortar and at the aggregate–mortar interface. This behavior suggests that detachment and reattachment of particles occur during the loading process: previously compressed contact points may shift into tension due to relative displacement, while newly mobilized mortar particles migrate into voids and establish fresh compressive contacts.
As the temperature increases to 45 °C, a more pronounced dynamic alternation is observed between tensile contacts within asphalt mortar particles and compressive contacts at aggregate–mortar interfaces. Specifically, the number of compressive contacts at the aggregate–mortar interface increases while the number of tensile contacts within the asphalt mortar decreases. This shift indicates that temperature-induced changes in interparticle adhesion weaken the tensile bonding among mortar particles, thereby altering the internal mechanical response of the mixture.
These findings underscore that elevated temperatures induce a nonlinear and complex evolution of the alternating compression–tension contact network. This evolution reflects not only the internal force chain reconstruction mechanisms under thermal effects but also exhibits a strong correlation with the deterioration of meso-mechanical behavior and the reduction in rutting resistance at the macro scale.
To further quantify the influence of temperature on the distribution of contact forces, the temporal evolution of average contact forces for three types of interfaces was analyzed under different temperature conditions, as depicted in Figure 20. As shown in Figure 20a, the average contact pressure between aggregates is consistently higher than that at the aggregate–asphalt mortar and asphalt mortar–asphalt mortar interfaces. This observation reflects the structural characteristics of suspended dense-type asphalt mixtures, wherein a limited number of aggregate–aggregate contacts carry relatively greater loads and form the principal load-bearing skeleton. These findings indicate that aggregate–aggregate contacts constitute the primary force transmission pathways, while asphalt mortar primarily functions as a void-filling medium with limited contribution to load-bearing [47]. This behavior is attributable to the significantly higher stiffness of aggregates compared with asphalt mortar, which enables aggregates to sustain higher contact pressures under load. As a result, the aggregate skeleton plays a critical role in mitigating rutting, and the selection of aggregates with high compressive strength is essential for enhancing structural performance.
As the temperature rises from 30 °C to 45 °C, a decrease in the average contact pressure across all three interface types is observed, as shown in Figure 20a, indicating a reduction in the overall load-bearing capacity and efficiency of force transmission. This reduction is primarily caused by the thermal softening of the asphalt binder, which weakens the adhesion between asphalt mortar and aggregates. Consequently, relative displacements among aggregate particles increase, compromising the structural integrity of the mixture and impairing its capacity to effectively transmit and resist external loads. The observed decline in internal contact pressure accelerates the initiation and progression of rutting.
Figure 20b further reveals that at 45 °C, the average contact tension at the aggregate–asphalt mortar interface significantly exceeds that observed at the asphalt mortar–asphalt mortar interface. Additionally, the average tensile contact force for both interface types increases progressively with loading time. This trend suggests that under the coupled influence of elevated temperature and repeated loading, cumulative relative displacement and particle deformation occur, leading to continuous adjustments in interparticle interactions. Fewer particles bear the increasing tensile forces, particularly at the weakened asphalt mortar–asphalt mortar interface. These findings confirm that under combined thermal and mechanical effects, the internal structure of the asphalt mixture undergoes progressive degradation, ultimately undermining its rutting resistance.
As a filler among coarse aggregate particles, asphalt mortar plays a crucial role in determining the cracking and deformation behavior of the mixture. Enhancing the internal bonding strength—particularly the interfacial adhesion between aggregates and asphalt mortar—can effectively mitigate instability in contact force distributions and preserve the continuity of load transfer pathways under high-temperature conditions. Such reinforcement is essential for significantly improving the rutting resistance of asphalt mixtures.

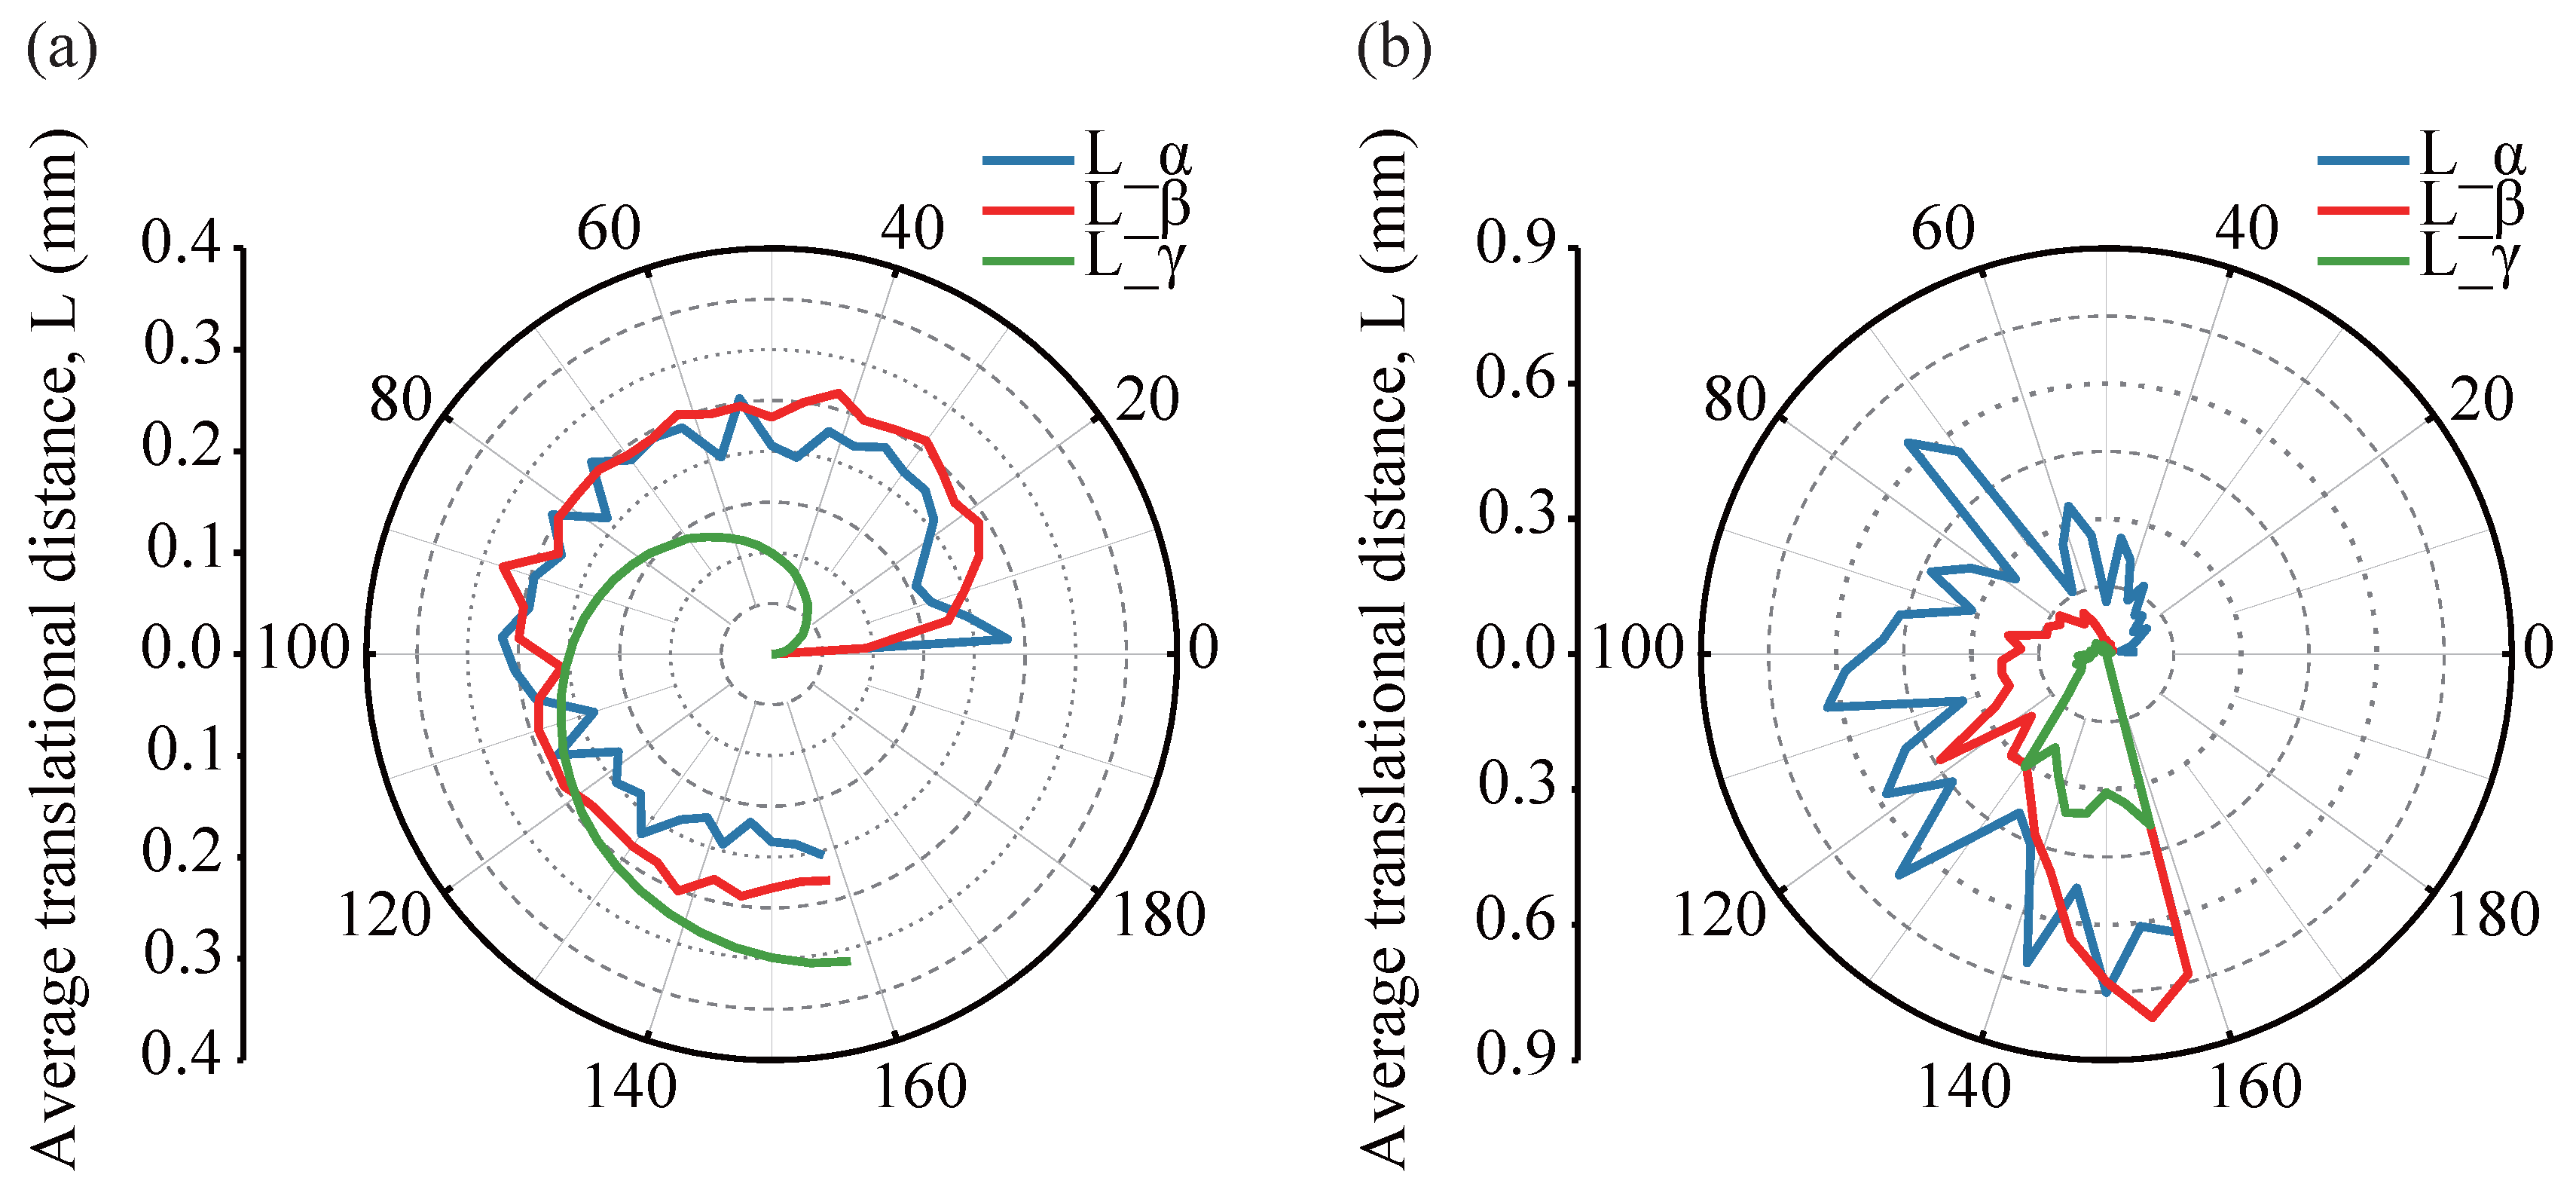
4.5. Movement Characteristics of Coarse Aggregate

Rutting is fundamentally the result of accumulated permanent deformation arising from the compaction and lateral flow of asphalt mixtures. Under repeated loading, coarse aggregates undergo both translational and rotational motions, which are regarded as primary contributors to the development of permanent deformation. As temperature increases, the viscosity of the asphalt mortar decreases, thereby facilitating the movement of coarse aggregates. Based on the data obtained from the PFC simulations—including the coordinates and angular velocities of coarse aggregate particle elements, as illustrated in Figure 21—the translational displacement of coarse aggregates was calculated using Equation (3), while the translational and rotational angles were determined according to Equations (4) and (5), respectively [48].
L = ( x 1 x 0 ) 2 + ( y 1 y 0 ) 2 + ( z 1 z 0 ) 2
α = arctan y 1 y 0 x 1 x 0 , β = arctan z 1 z 0 x 1 x 0 , γ = arctan z 1 z 0 y 1 y 0
θ j = w i Δ t i
where L is the translational distance of the coarse aggregate; ( x 0 , y 0 , z 0 ) and ( x 1 , y 1 , z 1 ) represent the centroid coordinates before and after aggregate translation, respectively; α , β , and γ are the translation angles of the coarse aggregate in the XY, XZ, and YZ planes, respectively; θ j is the rotation angle of coarse aggregate around the j-axis (j = x, y, z) direction; w i denotes the angular velocity at the ith time step; and Δ t i represents the time step at the ith iteration.
To quantitatively assess the directional characteristics of particle translational displacement in asphalt mixtures under varying temperatures, the translational angles α , β , and γ were employed as indicators to characterize the orientation of particle movement. The angular range from 0° to 200° was divided into 50 intervals, with the midpoint of each interval designated as the representative angle. For each interval, the average translational displacement L was computed to analyze the directional distribution patterns of coarse aggregate movements within the mixture. The results are illustrated in Figure 22, which presents the angular distribution of translational displacements at different temperatures.
A comparison of the data at 30 °C and 45 °C reveals that displacement variations at 30 °C are relatively moderate, with a more uniform overall distribution. The average translational displacement L generally ranges between 0 and 0.25 mm, with translational angles primarily distributed between 2° and 158°, indicating the presence of both vertical and horizontal aggregate motions. Notably, within the angular range of 45° to 135°, the maximum displacement L β in the z-direction increases from 0.27 mm at 30 °C to 0.64 mm at 45 °C. This increase indicates that higher temperatures intensify vertical particle motion, which, under vertical stress, promotes secondary compaction of the aggregate skeleton and contributes to irreversible plastic deformation—an essential mechanism driving rutting development.
As temperature rises from 30 °C to 45 °C, the directional distribution of particle displacements becomes increasingly non-uniform, particularly in the XY plane, where displacement fluctuations become more pronounced. The largest average translational displacement, L α , reaches 0.750 mm, with α angles predominantly distributed between 20° and 158°. The most substantial displacements are concentrated in the 140–158° range, indicating predominant translational movement along a direction approaching 180° in the XY plane—representing lateral flow along the x-axis. This phenomenon highlights the enhanced lateral mobility of asphalt mixtures under elevated temperatures. When the shear stress exceeds the adhesive strength of the asphalt mortar, non-uniform shear slip occurs between aggregates in the XY plane. In the XZ plane, the maximum average translational displacement L β reaches 0.812 mm, with L β angles primarily ranging from 60° to 158°; the peak displacement occurs at 154°, further indicating significant lateral movement of particles in the vertical plane along the x-direction.
In summary, elevated temperatures soften the asphalt binder and reduce its adhesive strength, weakening the constraints between particles and promoting their relative movement and rearrangement. Under repeated wheel loading, the mobility of coarse aggregates increases—particularly in terms of lateral displacement in the XY and XZ planes and vertical compaction. These behaviors collectively accelerate the initiation and propagation of rutting deformation in asphalt pavements.
As illustrated in Figure 23, a distinct pattern of aggregate movement is observed within the loading zone, and the displacement distribution of aggregates at various positions within the virtual specimen displays a notable degree of symmetry. On this basis, the rotational behavior of coarse aggregates within the 0–5 cm region was extracted for further analysis. Figure 24 presents the average rotation angles of coarse aggregates in the asphalt mixture at 30 °C and 45 °C under different loading durations.
At 30 °C, the average rotation angles of coarse aggregates about the x- and z-axes ( θ x and θ z ) remain relatively stable, exhibiting minor fluctuations and consistently low values throughout the loading period. In contrast, the average rotation angle about the y-axis ( θ y ) displays a fluctuating trend in the initial loading phase—characterized by an initial increase, followed by a decrease, and subsequently another increase. At 45 °C, both θ x and θ z gradually increase, reaching approximately 18°, while θ y rises sharply and peaks at 54.8°. These results suggest that the rotational motion of coarse aggregates around the y-axis is highly sensitive to elevated temperatures. The combined effects of high temperature and repeated loading modify the rheological behavior of asphalt mortar, thereby facilitating internal rearrangement within the aggregate skeleton. Consequently, the significant increase in θ y reflects intensified internal structural adjustments within the mixture under thermo-mechanical coupling.

5. Conclusions

This study established a 3D discrete–continuous coupling model of SACSS and conducted virtual rutting tests to analyze the meso-mechanism of the permanent deformation of SBDP under the temperature–stress coupling effect. The primary conclusions are as follows:
(1) The SBDP was simulated using the DEM, while the steel plate was constructed in FLAC3D and coupled to the DEM domain through a defined contact model. The finalized SACSS model was subjected to virtual rutting tests under three SAIB conditions. The simulation results showed that, under 0% and 17% SAIB debonding conditions, the virtual test curves closely matched the laboratory test results. Under the 100% SAIB debonding condition, although the rutting depth at 30 °C was slightly lower in the simulation compared with the experimental value, this discrepancy was attributed to differences in interface friction settings. At 45 °C, the simulated and experimental curves demonstrated excellent agreement in both trend and magnitude. Overall, SAIB failure was found to aggravate rutting development, and the simulation results exhibited good agreement with the experimental data. This consistency fully validates the rationality of the proposed 3D SACSS model and its parameter configuration, providing a reliable basis for further elucidation of the rutting evolution mechanism in SBDP.
(2) A comparative analysis of rutting depth evolution between models with and without surface cracks at 30 °C and 45 °C revealed that the presence of surface cracks significantly accelerated rutting development during the initial loading stage. At 30 °C, the rutting depth in the cracked model was approximately 35.77% higher than that of the intact model within 60 min, whereas at 45 °C, this difference reduced to 9.4%. These results indicate that the influence of surface cracks on rutting behavior is more pronounced at lower temperatures, while at elevated temperatures, the overall flowability of the asphalt mixture becomes the dominant factor. In addition, the evolution of interparticle contact failures (including tensile and shear failures) in the asphalt mixture at 30 °C was examined. The development of cracking followed a two-stage pattern: an initial slow-growth phase (0–20 min) and a subsequent rapid-growth phase (20–60 min). During the initial phase, tensile failures at the mesoscale were predominant, while the structural integrity of the material remained largely intact. In the rapid phase, the number of contact failures increased sharply, leading to a notable decline in structural stability, accompanied by periodic ‘acceleration–deceleration’ fluctuations. Throughout the entire loading process, tensile contact failures consistently outnumbered shear failures, with the disparity becoming more evident in the later stage. This suggests that loading duration exerts a significantly greater influence on tensile failure mechanisms within the asphalt mixture than on shear failure mechanisms.
(3) The elastic modulus of the steel plate was found to have a significant impact on the vertical displacement of the asphalt mixture. At 45 °C, a steel plate with an elastic modulus of 206 MPa effectively suppressed vertical deformation, thereby enhancing the high-temperature stability of the SBDP structure. The probability distribution of contact forces within the asphalt mixture exhibited a negative exponential trend. Strong force chains accounted for 25.4% within the asphalt mortar, 26.3% at the mortar–aggregate interfaces, and 29.2% between aggregates. Weak force chains dominated the internal force network, comprising approximately 70–75% of all contacts. By analyzing the displacement distributions, contact force evolution, and particle motion characteristics of the asphalt mixture under different temperature and loading conditions, the meso-mechanical mechanisms underlying rutting deformation development were effectively revealed.
The simulation of rutting processes provides critical insights into the mechanisms underlying distress initiation and progression in SBDP. These findings offer a reference for understanding the degradation behavior of SBDP under service conditions. Furthermore, they provide practical implications for optimizing material design, interface treatment, and temperature-adaptive pavement technologies to enhance rutting resistance and crack mitigation in steel bridge deck systems.
In this study, the rutting behavior of the SACSS was analyzed from a meso-mechanical perspective using the DEM-FEM modeling approach. As a valuable supplement to experimental research, the DEM provided a reliable means to uncover the meso-mechanical mechanisms underlying observable phenomena. However, several limitations of the present study should be acknowledged. The current model involved simplifications in structural geometry and loading boundary conditions, and the simulation results were primarily intended to reveal relative trends in rutting evolution rather than to provide precise quantitative predictions of structural performance. Additionally, the model did not incorporate temperature gradients within the SBDP or the thermal conductivity of the steel plate—factors that may influence mixture deformation under actual high-temperature service conditions and should be addressed in future work. Due to computational constraints, a medium-scale simplified model was adopted, which did not capture the full-scale behavior of the structure. Future studies should incorporate larger-scale numerical models and more realistic boundary conditions to obtain results that are both more representative and more accurate.

Author Contributions

Conceptualization, X.M. and Y.L.; methodology, X.M. and Y.L.; investigation, X.M. and Y.L.; resources, X.M. and Y.L.; writing—original draft preparation, X.M. and Y.L.; writing—review and editing, X.M. and Y.L.; funding acquisition, X.M. and Y.L. All authors have read and agreed to the published version of the manuscript.

Funding

This research received no external funding.

Institutional Review Board Statement

Not applicable.

Informed Consent Statement

Not applicable.

Data Availability Statement

The data will be available upon reasonable request to the corresponding author.

Conflicts of Interest

The authors declare no conflicts of interest.

References

  1. Liu, Y.; Qian, Z.; Zheng, D.; Zhang, M. Interlaminar thermal effect analysis of steel bridge deck pavement during gussasphalt mixture paving. Int. J. Pavement Eng. 2019, 20, 1323–1335. [Google Scholar] [CrossRef]
  2. Liu, Y.; Yao, B.; Yu, C.; Wu, J.; Chen, J.; Zhang, L. Experimental evaluation of the shear performance of steel-asphalt interface considering temperature and humidity coupling. Int. J. Adhes. Adhes. 2018, 84, 360–367. [Google Scholar] [CrossRef]
  3. Wang, X.; Zhang, C.; Sun, R. Response analysis of orthotropic steel deck pavement based on interlayer contact bonding condition. Sci. Rep. 2021, 11, 23692. [Google Scholar] [CrossRef]
  4. Chou, Y.T. Analysis of Permanent Deformations of Flexible Airport Pavements; Technical Report, No. Tech. Rpt. S-77-7 Final Rpt.; U.S. Army Engineer Waterways Experiment Station: Vicksburg, MS, USA, 1977. [Google Scholar]
  5. Paterson, W.D. Road Deterioration and Maintenance Effects: Models for Planning and Management; the TRIS and ITRD database; World Bank: Washington, DC, USA, 1987. [Google Scholar]
  6. Kaloush, K.; Witczak, M.; Roque, R.; Brown, S.; D’Angelo, J.; Marasteanu, M.; Masad, E. Tertiary flow characteristics of asphalt mixtures. In Proceedings of the Asphalt Paving Technology 2002, Colorado Springs, CO, USA, 18–20 March 2002; pp. 248–280. [Google Scholar]
  7. Skoglund, O.; Leander, J.; Karoumi, R. Overview of steel bridges containing high strength steel. Int. J. Steel Struct. 2020, 20, 1294–1301. [Google Scholar] [CrossRef]
  8. Shi, J.; Cong, L. Testing and evaluating the high-temperature rutting development of steel deck asphalt pavement using full-scale accelerated pavement testing. J. Test. Eval. 2023, 51, 1094–1104. [Google Scholar] [CrossRef]
  9. Jun, Y.; Ling, C.; Haoran, Z.; Juan, C. Circular Road Tracking Test on Steel Bridge Deck Pavement and its Rutting Prediction. In Proceedings of the APT’08, Third International Conference Centro de Estudios y Experimentación de Obras Públicas (CEDEX) Transportation Research Board, Madrid, Spain, 1–3 October 2008. [Google Scholar]
  10. Huang, W.-K.; Zhang, X.-N.; Rong, H.-L.; Chen, B. Finite element method for predicting rutting depth of steel deck asphalt pavement based on accelerated pavement test. In Proceedings of the 2015 3rd International Conference on Mechanical Engineering and Intelligent Systems, Yinchuan, China, 15–16 August 2015; Atlantis Press: Dordrecht, The Netherlands, 2015; pp. 935–942. [Google Scholar] [CrossRef]
  11. Ellobody, E. Finite element modelling and design of composite bridges with profiled steel sheeting. Adv. Struct. Eng. 2017, 20, 1406–1430. [Google Scholar] [CrossRef]
  12. Liu, Y.; Qian, Z.; Gong, M.; Bo, W.; Zhang, X.; Xu, C. Investigation of the Rutting Evolution of Double-Layered Heterogeneous Asphalt Pavement on a Steel Bridge Deck under the Coupling of Heavy Load and Variable Temperature. J. Mater. Civ. Eng. 2025, 37, 04025175. [Google Scholar] [CrossRef]
  13. Luo, S.; Zhong, K.; Qian, Z. Permanent deformation prediction of steel deck pavements with different combinations. J. Tongji Univ. Nat. Sci. 2013, 41, 397–401. [Google Scholar]
  14. Yang, J.; Tan, L.; Qi, X.; Zhang, C. Investigation on permanent deformation in steel-concrete composite beam bridge deck pavement under temperature-load coupling effect. Front. Mater. 2023, 10, 1284928. [Google Scholar] [CrossRef]
  15. Cong, L.; Yang, J.; Zhu, H.; Cui, J. A study on rutting prediction of the asphalt pavement for orthotropic steel bridge decks. J. Test. Eval. 2009, 37, 505–509. [Google Scholar] [CrossRef]
  16. Luo, S.; Lu, Q.; Qian, Z.; Wang, H.; Huang, Y. Laboratory investigation and numerical simulation of the rutting performance of double-layer surfacing structure for steel bridge decks. Constr. Build. Mater. 2017, 144, 178–187. [Google Scholar] [CrossRef]
  17. Zhu, J.; Dong, Z.; Jiang, S.; Ma, T.; Huang, S.; Chen, F.; Zhang, W. Long-term rutting prediction of gussasphalt steel bridge deck pavement based on comprehensive finite element modelling. Int. J. Pavement Eng. 2024, 25, 2428419. [Google Scholar] [CrossRef]
  18. Kim, H.; Arraigada, M.; Raab, C.; Partl, M.N. Numerical and experimental analysis for the interlayer behavior of double-layered asphalt pavement specimens. J. Mater. Civ. Eng. 2011, 23, 12–20. [Google Scholar] [CrossRef]
  19. Jiang, X.; Zeng, C.; Yao, K.; Gu, H.Y.; Li, Z.K.; Qiu, Y.J. Influence of bonding conditions on flexible base asphalt pavement under non-uniform vertical loads. Int. J. Pavement Eng. 2021, 22, 1491–1503. [Google Scholar] [CrossRef]
  20. Lamichhane, R.; Zhang, S.; Zheng, P.; Bahadur, S. Stress Analysis of Hollow Slab Bridge Deck Pavement. Civ. Environ. Eng. Rep. 2022, 18, 589–602. [Google Scholar] [CrossRef]
  21. Chen, Z.; Xu, W.; Zhao, J.; An, L.; Wang, F.; Du, Z.; Chen, Q. Experimental study of the factors influencing the performance of the bonding interface between epoxy asphalt concrete pavement and a steel bridge deck. Buildings 2022, 12, 477. [Google Scholar] [CrossRef]
  22. Zheng, X.; Ren, Q.; Xiong, H.; Song, X. An experimental study on a composite bonding structure for steel bridge deck pavements. Adv. Civ. Eng. 2021, 2021, 5685710. [Google Scholar] [CrossRef]
  23. Xu, Y.; Lv, X.; Ma, C.; Liang, F.; Qi, J.; Chou, Z.; Xu, S. Shear fatigue performance of epoxy resin waterproof adhesive layer on steel bridge deck pavement. Front. Mater. 2021, 7, 618073. [Google Scholar] [CrossRef]
  24. Zha, X.; Xiao, Q. Shear analysis for asphalt concrete deck pavement of steel bridges. In Advances in Steel Structures (ICASS’99), Proceedings of the Second International Conference on Advances in Steel Structures, Hong Kong, China, 15–17 December 1999; Elsevier: Amsterdam, The Netherlands, 1999; pp. 553–560. [Google Scholar] [CrossRef]
  25. Zhu, H.P.; Zhou, Z.Y.; Yang, R.; Yu, A. Discrete particle simulation of particulate systems: Theoretical developments. Chem. Eng. Sci. 2007, 62, 3378–3396. [Google Scholar] [CrossRef]
  26. Minh, N.; Cheng, Y.; Thornton, C. Strong force networks in granular mixtures. Granul. Matter 2014, 16, 69–78. [Google Scholar] [CrossRef]
  27. Gu, X.; Huang, M.; Qian, J. DEM investigation on the evolution of microstructure in granular soils under shearing. Granul. Matter 2014, 16, 91–106. [Google Scholar] [CrossRef]
  28. Zhu, J.; Ma, T.; Lin, Z.; Zhu, H. Effect of aggregate structure on load-carrying capacity and deformation resistance of porous asphalt concrete based on discrete-element modelling. Int. J. Pavement Eng. 2022, 23, 4023–4033. [Google Scholar] [CrossRef]
  29. Ma, T.; Zhang, D.; Zhang, Y.; Wang, S.; Huang, X. Simulation of wheel tracking test for asphalt mixture using discrete element modelling. Road Mater. Pavement Des. 2018, 19, 367–384. [Google Scholar] [CrossRef]
  30. Zhang, Y.; Ma, T.; Ding, X.; Chen, T.; Huang, X.; Xu, G. Impacts of air-void structures on the rutting tests of asphalt concrete based on discretized emulation. Constr. Build. Mater. 2018, 166, 334–344. [Google Scholar] [CrossRef]
  31. Ma, T.; Zhang, D.; Zhang, Y.; Zhao, Y.; Huang, X. Effect of air voids on the high-temperature creep behavior of asphalt mixture based on three-dimensional discrete element modeling. Mater. Des. 2016, 89, 304–313. [Google Scholar] [CrossRef]
  32. Zhang, D.; Gu, L.; Zhu, J. Effects of aggregate mesostructure on permanent deformation of asphalt mixture using three-dimensional discrete element modeling. Materials 2019, 12, 3601. [Google Scholar] [CrossRef]
  33. Zhong, H.; Yu, Z.; Zhang, C.; Lyu, L.; Zhao, L. Dynamic mechanical responses of reinforced concrete pier to debris avalanche impact based on the DEM-FEM coupled method. Int. J. Impact Eng. 2022, 167, 104282. [Google Scholar] [CrossRef]
  34. Zeng, H.; Lin, Z.; Huang, G.; Yang, X.; Li, Y.; Su, J.; Xu, W. Parameter identification of DEM-FEM coupling model to simulate traction behavior of tire-soil interaction. J. Terramech. 2025, 117, 101012. [Google Scholar] [CrossRef]
  35. Ge, H.; Quezada, J.C.; Le Houerou, V.; Chazallon, C.; Sha, A. From macro to micro: Investigation of three-dimensional particle-scale responses of asphalt mixtures under non-uniform rolling tire loads via coupled FEM-DEM simulations. Road Mater. Pavement Des. 2025, 1–30. [Google Scholar] [CrossRef]
  36. JTG E20-2011; Standard Test Methods of Bitumen and Bituminous Mixtures for Highway Engineering. Ministry of Transport of the People’s Republic of China and China Communications Press: Beijing, China, 2011; pp. 265–270.
  37. Chen, J.; Wang, H.; Li, L. Virtual testing of asphalt mixture with two-dimensional and three-dimensional random aggregate structures. Int. J. Pavement Eng. 2017, 18, 824–836. [Google Scholar] [CrossRef]
  38. Zhang, H.; Liu, H.; You, W. Microstructural behavior of the low-temperature cracking and self-healing of asphalt mixtures based on the discrete element method. Mater. Struct. 2022, 55, 18. [Google Scholar] [CrossRef]
  39. Chen, X.; Ai, C.; Du, J.; He, H.; Huang, Y. Effect of gradation segregation on low-temperature crack resistance of asphalt pavement using 3D DEM. Constr. Build. Mater. 2021, 274, 122060. [Google Scholar] [CrossRef]
  40. Zhao, G.; Wang, Q.; Yan, Z. Research on Asphalt Mixture Bending Test and Micromechanical Evolution Based on 2D Discrete-Element Method. J. Mater. Civ. Eng. 2021, 33, 04021179. [Google Scholar] [CrossRef]
  41. Albayati, A. A review of rutting in asphalt concrete pavement. Open Eng. 2023, 13, 20220463. [Google Scholar] [CrossRef]
  42. Liu, G.; Ran, G.; Li, Z.; Duan, S.; Su, G.; Yan, C.; Dong, K. An insight into the effect of primary hidden microfissures on mechanical behaviors and failure characteristics of brittle basalt. Theor. Appl. Fract. Mech. 2023, 128, 104138. [Google Scholar] [CrossRef]
  43. Bai, F.; Yang, X.; Yin, A.; Zeng, G. Modified Cross model for predicting long-term creep behavior of sand asphalt. Constr. Build. Mater. 2014, 65, 43–50. [Google Scholar] [CrossRef]
  44. Liu, Y.; Zhao, X.; Xia, G.; Wang, W. Shear mechanism of steel-asphalt interface using three-dimensional discrete-continuous coupling method on the mesoscopic scale. Constr. Build. Mater. 2023, 364, 129977. [Google Scholar] [CrossRef]
  45. Chang, M.; Huang, P.; Pei, J.; Zhang, J.; Zheng, B. Quantitative analysis on force chain of asphalt mixture under haversine loading. Adv. Mater. Sci. Eng. 2017, 2017, 7128602. [Google Scholar] [CrossRef]
  46. Chang, M.; Pei, J.; Zhang, J.; Xing, X.; Xu, S.; Xiong, R.; Sun, J. Quantitative distribution characteristics of force chains for asphalt mixtures with three skeleton structures using discrete element method. Granul. Matter 2020, 22, 1–18. [Google Scholar] [CrossRef]
  47. Xue, B.; Xu, J.; Pei, J.; Zhang, J.; Li, R. Investigation on the micromechanical response of asphalt mixture during permanent deformation based on 3D virtual wheel tracking test. Constr. Build. Mater. 2021, 267, 121031. [Google Scholar] [CrossRef]
  48. Liu, Y.; You, Z. Discrete-element modeling: Impacts of aggregate sphericity, orientation, and angularity on creep stiffness of idealized asphalt mixtures. J. Eng. Mech. 2011, 137, 294–303. [Google Scholar] [CrossRef]
Figure 1. Synthetic gradation curve of AC-13.
Applsci 15 06187 g001
Figure 2. Wheel tracking test: (a) rutting specimen; (b) test equipment.
Applsci 15 06187 g002
Figure 3. Preparation of specimens with three interfacial bonding failure area ratios.
Applsci 15 06187 g003
Figure 4. Applied wheel loading assumption.
Applsci 15 06187 g004
Figure 5. The stress-time relationship of cyclic loading.
Applsci 15 06187 g005
Figure 6. Modeling procedure of the SBDP.
Applsci 15 06187 g006
Figure 7. Modeling procedure of the steel plate.
Applsci 15 06187 g007
Figure 8. Modeling procedure of the steel plate.
Applsci 15 06187 g008
Figure 9. Schematic diagram of the discrete–continuous coupling algorithm.
Applsci 15 06187 g009
Figure 10. Parallel bonding model: (a) bonded; (b) unbonded.
Applsci 15 06187 g010
Figure 11. Meso-parameters calibration: (a) aggregate–aggregate; (b) asphalt mortar–asphalt mortar; (c) interlaminar bonding; (d) aggregate–asphalt mortar.
Applsci 15 06187 g011
Figure 12. Rutting depth-loading time curve of laboratory and virtual tests at (a) 30 °C and (b) 45 °C.
Applsci 15 06187 g012
Figure 13. The effect of surface cracks on SBDP rutting at different temperatures: (a) 30 °C; (b) 45 °C.
Applsci 15 06187 g013
Figure 14. Relationship between particle contact failure and the loading time at 30 °C.
Applsci 15 06187 g014
Figure 15. Contour plots of displacement: (a) vertical displacement; (b) horizontal displacement.
Applsci 15 06187 g015
Figure 16. Displacements at different sections under different temperatures: (a) vertical displacement; (b) horizontal displacement.
Applsci 15 06187 g016
Figure 17. Effect of steel plate elastic modulus on vertical displacement at different temperatures: (a) 30 °C; (b) 45 °C.
Applsci 15 06187 g017
Figure 18. The probability distribution of contact force borne by different contacts.
Applsci 15 06187 g018
Figure 19. The variation curves of the number of different contact forces with different temperatures.
Applsci 15 06187 g019
Figure 20. The results of average contact force in asphalt mixtures with loading time: (a) average contact pressure; (b) average contact tension.
Applsci 15 06187 g020
Figure 21. Illustration for the movement characteristics of coarse aggregates: (a) translation; (b) rotation.
Applsci 15 06187 g021
Figure 22. Angular probability distribution of translational distance for coarse aggregates at different temperatures: (a) 30 °C; (b) 45 °C.
Applsci 15 06187 g022
Figure 23. Method for extracting the rotational information of aggregates within the specimen.
Applsci 15 06187 g023
Figure 24. Variation curves of the average rotation angle of coarse aggregates at different temperatures.
Applsci 15 06187 g024
Table 1. Asphalt technical index.
Detection IndexUnitTest ValueSpecification Requirements
Penetration (25 °C, 100 g, 5 s)0.1 mm6960∼80
Ductility (15 °C)cm>150≥100
Softening Point (R&B)°C47.0≥46.0
Table 2. Technical properties of the aggregate.
PropertiesSieve Size (mm)
3∼55∼1010∼15
Apparent relative density2.7172.9582.927
Bulk density2.6672.8582.859
Table 3. Maximum rut depth for different SAIB failure areas at 30 °C.
Failure Area Ratio (%)Maximum Rut Depth (mm)Average Depth (mm)
123
02.7334.3550.8272.638
172.8351.2953.7632.631
1003.3193.0292.8173.055
Table 4. Maximum rut depth for different SAIB failure areas at 45 °C.
Failure Area Ratio (%)Maximum Rut Depth (mm)Average Depth (mm)
123
03.1784.8001.2723.083
172.9654.1652.1413.091
1005.2334.9434.7314.969
Table 5. Meso-parameters of the LPBM.
T (°C)Contact RelationshipLinear Parallel Bond Modulus (Pa)Linear Parallel Bond Stiffness RatioLinear Parallel Bond Strength (Pa)Friction Coefficient
30Aggregate-inner 18 × 10 9 2.0 27.3 × 10 6 0.6
Mastic-inner 6 × 10 8 2.0 3 × 10 7 1.2
Aggregate-mastic 1.81 × 10 8 2.0 1.2 × 10 7 1.2
Steel–asphalt mixtures interface 1.22 × 10 9 2.0 3.6 × 10 6 0.8
45Aggregate-inner 18 × 10 9 2.0 27.3 × 10 6 0.6
Mastic-inner 8.93 × 10 7 2.0 2.52 × 10 5 0.8
Aggregate-mastic 6.82 × 10 7 2.0 1.36 × 10 5 0.8
Steel–asphalt mixtures interface 60 × 10 6 2.0 2.4 × 10 6 0.8
Disclaimer/Publisher’s Note: The statements, opinions and data contained in all publications are solely those of the individual author(s) and contributor(s) and not of MDPI and/or the editor(s). MDPI and/or the editor(s) disclaim responsibility for any injury to people or property resulting from any ideas, methods, instructions or products referred to in the content.

