Article

Evaluating the Quality of Light Emitted by Smartphone Displays

by
Nina Piechota
,
Krzysztof Skarżyński
* and
Kamil Kubiak
Lighting Technology Division, Electrical Power Engineering Institute, Warsaw University of Technology, Koszykowa 75, 00-662 Warsaw, Poland
*
Author to whom correspondence should be addressed.
Appl. Sci. 2025, 15(11), 6119; https://doi.org/10.3390/app15116119
Submission received: 15 April 2025 / Revised: 22 May 2025 / Accepted: 27 May 2025 / Published: 29 May 2025

Abstract

:
The increased use of smartphones in daily life challenges researchers regarding the quality of light emitted by screens. This study aims to analyze displays’ qualitative and quantitative light parameters from various smartphone models available on the market over the last decade. Advanced photometric and colorimetric measurements using complex instrumentation were performed. It covered the color gamut, channel linearity response, refresh rate, flickering, spatial radiation distribution, luminance, uniformity, and static contrast. The analysis showed that, despite advances in smartphone display technology, differences in visible radiation parameters between older and newer models are surprisingly marginal. However, improvements were observed in newer models in terms of viewing angles and compliance with the sRGB standard. Tested built-in blue light reduction filters were ineffective. It only slightly reduces light between 380 nm and 480 nm. In contrast, much higher decreases in this spectral range were achieved for dedicated applications. However, it lowered radiant power density across the visible spectrum, significantly decreasing the displays’ correlated color temperature. Enabling the power-saving mode caused the deterioration of parameters such as refresh rate, but the flicker depth remained constant. Static contrast for most tested devices was also at the same level. The findings confirm the need for further studies on display technology development that supports user well-being while minimizing its harmful effects.

1. Introduction

1.1. Everyday Use of Smartphones

Nowadays, it is increasingly difficult to imagine daily life without a smartphone. Although these devices have become available relatively recently, their technical capabilities and functionality are continuously growing, and they have become an essential part of daily life. The technology of their production is constantly developing. Smartphones are no longer just tools for communication. These devices can replace many other devices, such as digital cameras, music players, GPS navigation, and computers. They have found applications in many aspects of human life, including health, education, and entertainment [1,2]. Their popularity is driven by easy internet access and the device’s versatility and universality, thanks to the ability to download apps based on user preferences. The rise of multimedia apps (social media, games, and streaming) has increased demand on smartphone displays [3]. The smartphone industry is constantly evolving, and manufacturers continuously improve the specifications of their models to increase their appeal in customers’ eyes [4].
The advanced capabilities of smartphones and the growing diversity of available applications for mobile devices have also contributed to an increase in the amount of time an average user spends using their smartphone each day. Currently, the average owner of an Android smartphone spends from 2 to more than 5 h a day looking at the phone’s screen [5,6]. Most of this time is spent by young people, primarily from Generation Z, but older generations are also very susceptible [7,8]. This phenomenon raises many questions regarding the impact of such devices on human functioning and especially addictions [9,10,11]. However, the effects of visible radiation from displays on general health, well-being, and eye performance are also discussed widely [12,13,14,15]. The growing use of smartphones and advancements in technology create a rising demand for research into the visible radiation parameters of their displays as any other light sources [16,17].

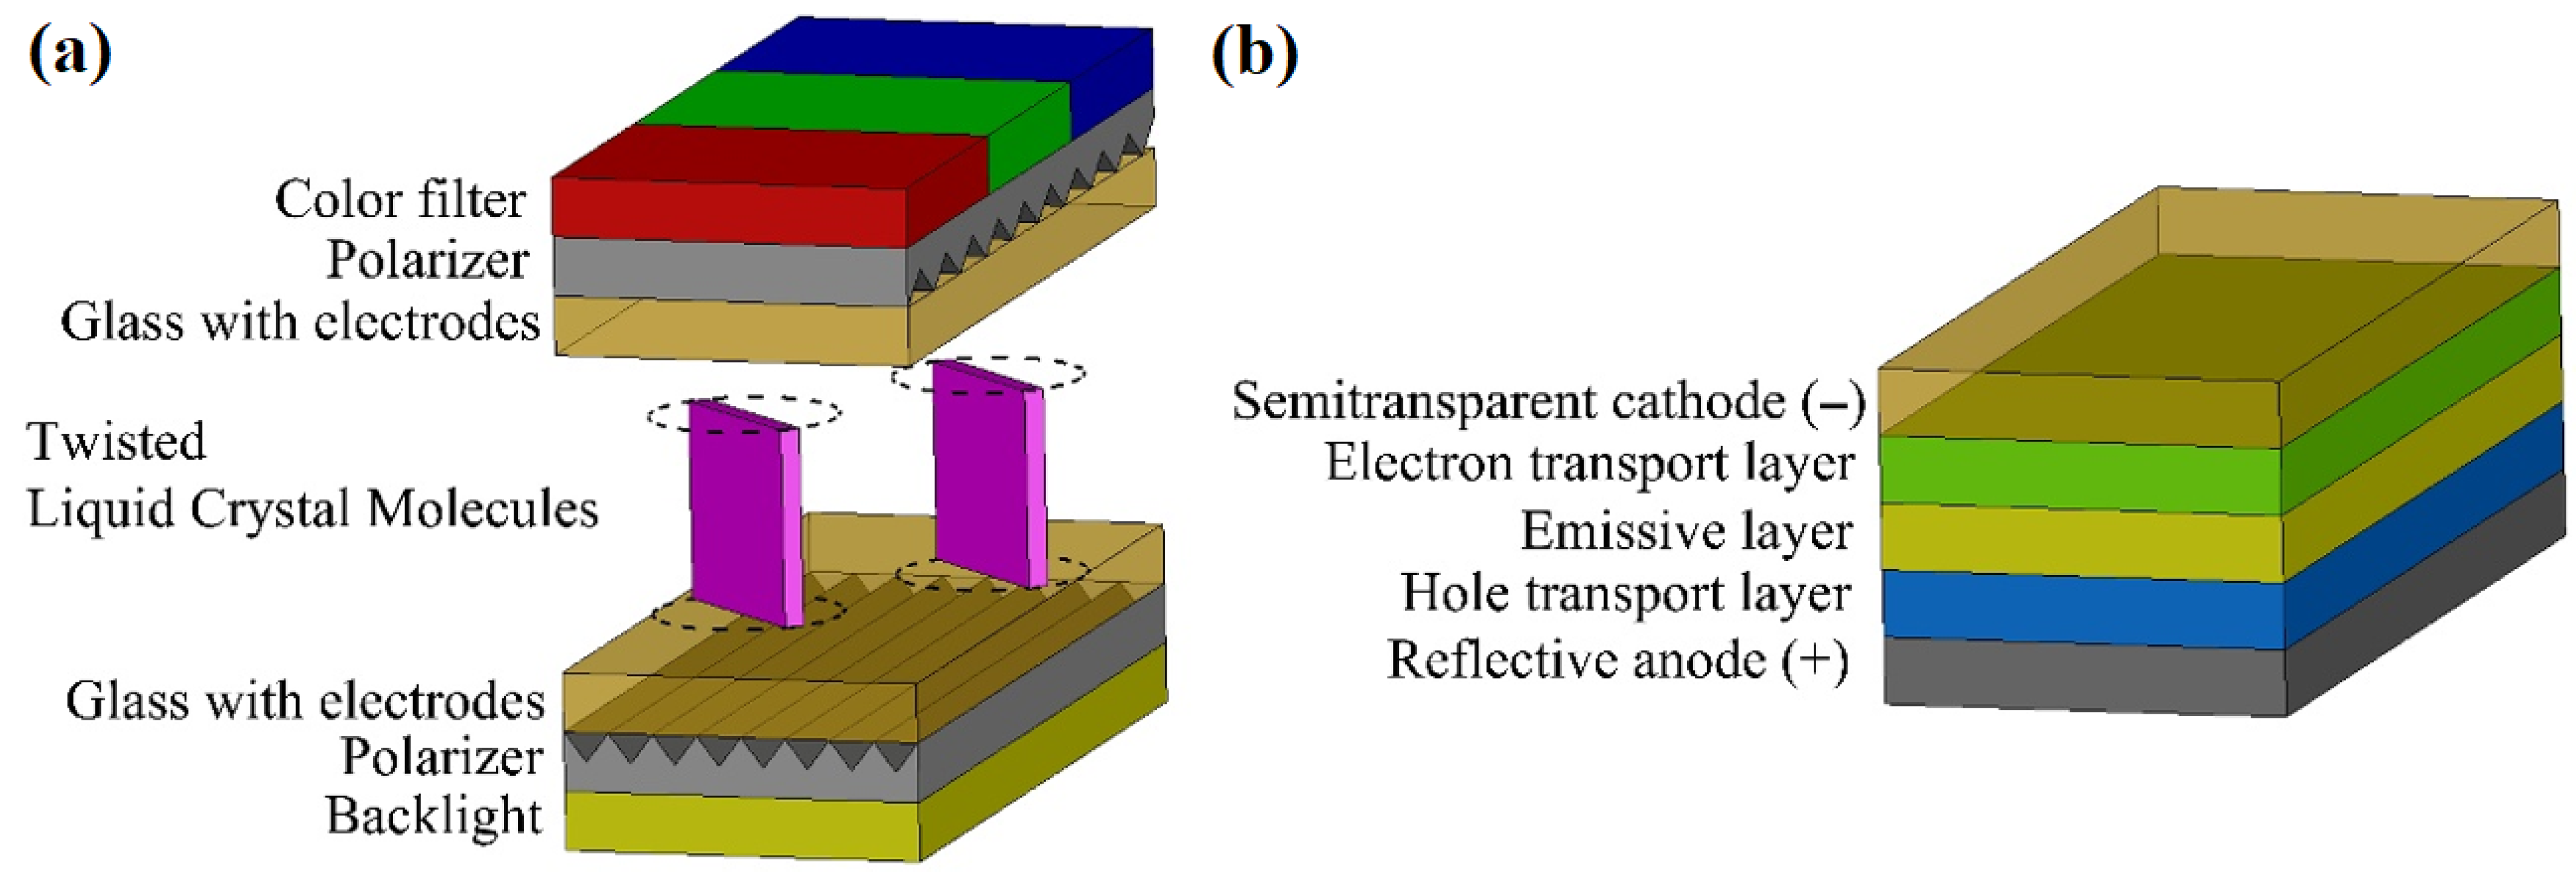
1.2. Display Technologies

One of the oldest displays available on the first smartphones is the liquid crystal display (LCD) [18,19]. This technology is constantly being improved to enhance image quality. An LCD is most commonly operated through twisted nematic (TN) technology. Figure 1a schematically shows the cross-section of such a display. The liquid crystals used in the display do not emit light but modify light coming from another source to present the image [20]. For this reason, special backlighting is usually used, which is placed directly behind the display or in an edge-lit configuration [21]. The backlight typically uses a cold cathode fluorescent lamp (CCFL) or light-emitting diodes (LED) [22]. The CCFL is inadequate for smartphones due to the size and power consumption, so LEDs are typically used. The backlight passes through the first polarizing filter, a set of electrodes, the surface of the alignment layer, and then reaches the liquid crystal layer. The liquid crystal layer is positioned between two alignment layers designed so that the liquid crystal molecules rotate 90 degrees, which is their resting position. Due to this twisting, the light changes its polarization direction. It allows the light to pass through the second polarizing filter, which results in the pixel’s illumination on the screen [23]. When a voltage is applied to the electrodes, the liquid crystal molecules align according to the electric field, eliminating their twist. It prevents the light from changing its polarization direction, blocking it from passing through the second polarizing filter, resulting in a black pixel.
Another type of LCD is the in-plane switching (IPS) [24]. This solution was proposed to widen the viewing angle and improve the performance of displays. It differs from the above-described TN technology primarily in the orientation of the electrodes (horizontal instead of vertical). Therefore, the liquid crystal molecules rotate differently. These molecules move in a single plane, remaining parallel to the surface of both filters [25].
Special filters are used to achieve colors on LCD. Each display pixel consists of smaller subpixels: red, green, and blue. A black matrix separates the subpixels to prevent light leakage [26]. The filter responsible for each subpixel only passes wavelengths corresponding to its specific color and absorbs all others. The human eye cannot distinguish between the individual subpixels due to their miniature size. Instead, it perceives the pixel as a single color, which is the result of the combination of the following three colors: red (R), green (G), and blue (B).
OLED displays are gaining increasing popularity even for scientific research [27,28,29]. They use electroluminescent diodes made from organic compounds to produce images. Unlike LCD, the OLED displays do not require backlighting [30], and the light leakage is also eliminated by the black matrix [31]. Typically, they consist of two electrodes (anode and cathode), with organic semiconductor layers between them (Figure 1b). These layers can be divided into emissive and conductive layers, depending on the type of semiconductor used. The emissive layer comprises a “p-type” organic semiconductor, while the conductive layer is an “n-type” organic semiconductor. When voltage is applied and the junction is polarized in the conduction direction, the emissive layer becomes negatively charged, and the conductive layer becomes rich in positively charged holes. Due to electrostatic interaction, electrons and holes attract each other, leading to their recombination. This process involves electrons transitioning from the conduction band to one of the available states in the valence band. The electron then moves to a lower energy level, and the energy released in this process is emitted as a photon. Photon emission occurs closer to the emissive layer, as holes are more mobile carriers in organic semiconductors [32]. New devices often use multilayer OLED displays to improve the screen’s performance, such as greater efficiency, longer lifespan, and better color reproduction [33,34]. Similar to LCDs, the color of each pixel is obtained by combining three different subpixels: R, G, and B. OLED displays use several technologies to achieve a color image, including RGB side-by-side and white emission with a color filter. The first method is the most common, and its advantage is high efficiency and full utilization of the capabilities offered by OLED technology. However, a combination of white OLED emission with color filters is also frequently used. This method is more straightforward to produce but reduces the screen’s brightness (luminance) and efficiency [35].
Active-matrix organic light-emitting diode (AMOLED) displays are an improved version of OLED displays [36]. They are typically driven by thin-film transistor (TFT) technology. As a result, they can have a high information content, which is especially important when the screen is large or has a high resolution [37]. These technologies differ in the light parameters they achieve, such as luminance and uniformity. OLED displays with active matrices are more energy-efficient than passive matrices or LCD matrices [38].
Recently, LED displays using colloidal quantum dot technology have been gaining popularity in industrial applications due to significant improvements in their quality [39]. However, these displays are not yet widely or frequently used in smartphones.

1.3. Research Objectives

The rapid development and widespread use of smartphones and the available technologies have led to a continuous deficiency of research on their visible radiation. Therefore, this article focuses on the measurement of photometric and colorimetric parameters of various smartphone displays and provides a comparative analysis of the obtained results. This study primarily aims to determine the quality of light emitted by individual displays and to examine how this has changed over the past few years. It also addresses issues related to the impact of light on the comfort of using smartphones. However, each user may experience different visual perception. Therefore, the presented research is not based on subjective impressions but on advanced analysis of light radiation parameters.

2. Materials and Methods

2.1. The Selected Samples

This study was conducted on nine different smartphones. The basic technical data of the sample selected are presented in Table 1. Most of the samples were produced by one manufacturer. On the one hand, this determines certain limitations of the presented research. On the other hand, different samples released in different years were examined, which, considering the continuous development of mobile phone display technology, will help observe specific trends over the last few years. Moreover, the nine samples were due to the low availability of older models and the low budget for this study. The chosen samples vary in terms of release date, type of display, specific technical parameters, and price range. The oldest smartphone tested (sample 9) was released in 2014, while the newest was released in 2024 (sample 1). The smartphones under study also feature different displays, mainly Super AMOLED. One sample has a Super AMOLED+, which the manufacturer claims primarily improves color quality and higher brightness (luminance). Two different LCDs (both backlight types) were also tested. LCDs in smartphones are becoming increasingly rare. However, it was tested for wider comparison purposes.
All tested smartphone samples are relatively new and do not have manufacturing defects or mechanical damage resulting from a short use time, similar to each sample. On the one hand, this allowed for better stabilization of parameters during the tests; on the other hand, the use times are relatively short, which does not contribute to internal degradation of individual screens. All the collected samples are claimed to support 16.7 million colors, corresponding to a color depth of 24 bits. The sample group includes budget smartphones (samples 1 and 9), mid-range smartphones (samples 2, 3, 4, 5, and 8), and two of the highest models from different manufacturers (samples 6 and 7). Many of the selected phone models have a screen refresh rate of at least 60 Hz (samples 4–7). For some older models, no such data were found from the manufacturer. Higher screen refresh rates, ranging from 90 Hz to 120 Hz, can be found among the newer smartphones (samples 1–3).

2.2. The Laboratory Tests

This study focuses on measuring the light parameters of smartphones, which was conducted in the photometric laboratory of the Lighting Technology Division at Warsaw University of Technology. The measurement setup is schematically shown in Figure 2. Before each test, all smartphones were adequately prepared. It must be noted that different operating systems may influence screen performance. Each user can also have their preferences and settings. So, the operating state of each sample was adjusted to be as close as possible to the factory settings. Moreover, functions such as screen protection and other possible filters, battery-saving modes, white balance, and personalized color settings were disabled. The phones were also free of any protective glass or film. Their surfaces were thoroughly cleaned to ensure that any contaminants on the screen would not affect radiation emission. Each sample was operated for approximately 20–30 min before the measurements were taken to provide stable indications during the measurement process. This unification guarantees the adequacy of the visible radiation tests performed under controlled conditions. This means that all measurements were performed in a photometric darkroom, which meets the requirements for this type of laboratory and does not have daylight access. The environmental conditions (ambient temperature, humidity, and pressure) were the same during the measurements for all samples and did not affect the measurements in any way.

2.2.1. Color Gamut Measurements

A Konica Minolta (Tokio, Japan) CS-200 was used to measure the color gamut of the smartphone screen. It is a luminance camera with three different viewing angles (0.1°, 0.2°, and 1.0°) and an integrated colorimeter. This instrument allows the measurement of luminance and colorimetric properties such as tristimulus values or correlated color temperature (CCT). Each smartphone was placed on a tripod. The luminance meter was mounted on a tripod, allowing adjustment of its position and height. The measuring device was oriented toward the smartphone perpendicular to the screen surface, and its measurement field was set to 1°. The meter was positioned at a distance such that its field of view covered only the part of the screen that emits visible radiation. Due to the different sizes of the individual screens, the distance was changed so that the meter’s field of view did not include the screen frame or background, which could significantly increase measurement errors. A free application was installed on the smartphones, allowing the display of a test screen in one of four colors: red (R = 255, G = 0, and B = 0), green (R = 0, G = 255, and B = 0), blue (R = 0, G = 0, and B = 255), or white (R = 255, G = 255, and B = 255). For each variant mentioned, the tristimulus values (x, y) were measured at the maximum screen brightness for each selected smartphone sample. The measurement reference was the most popular color gamut standard, sRGB [40].

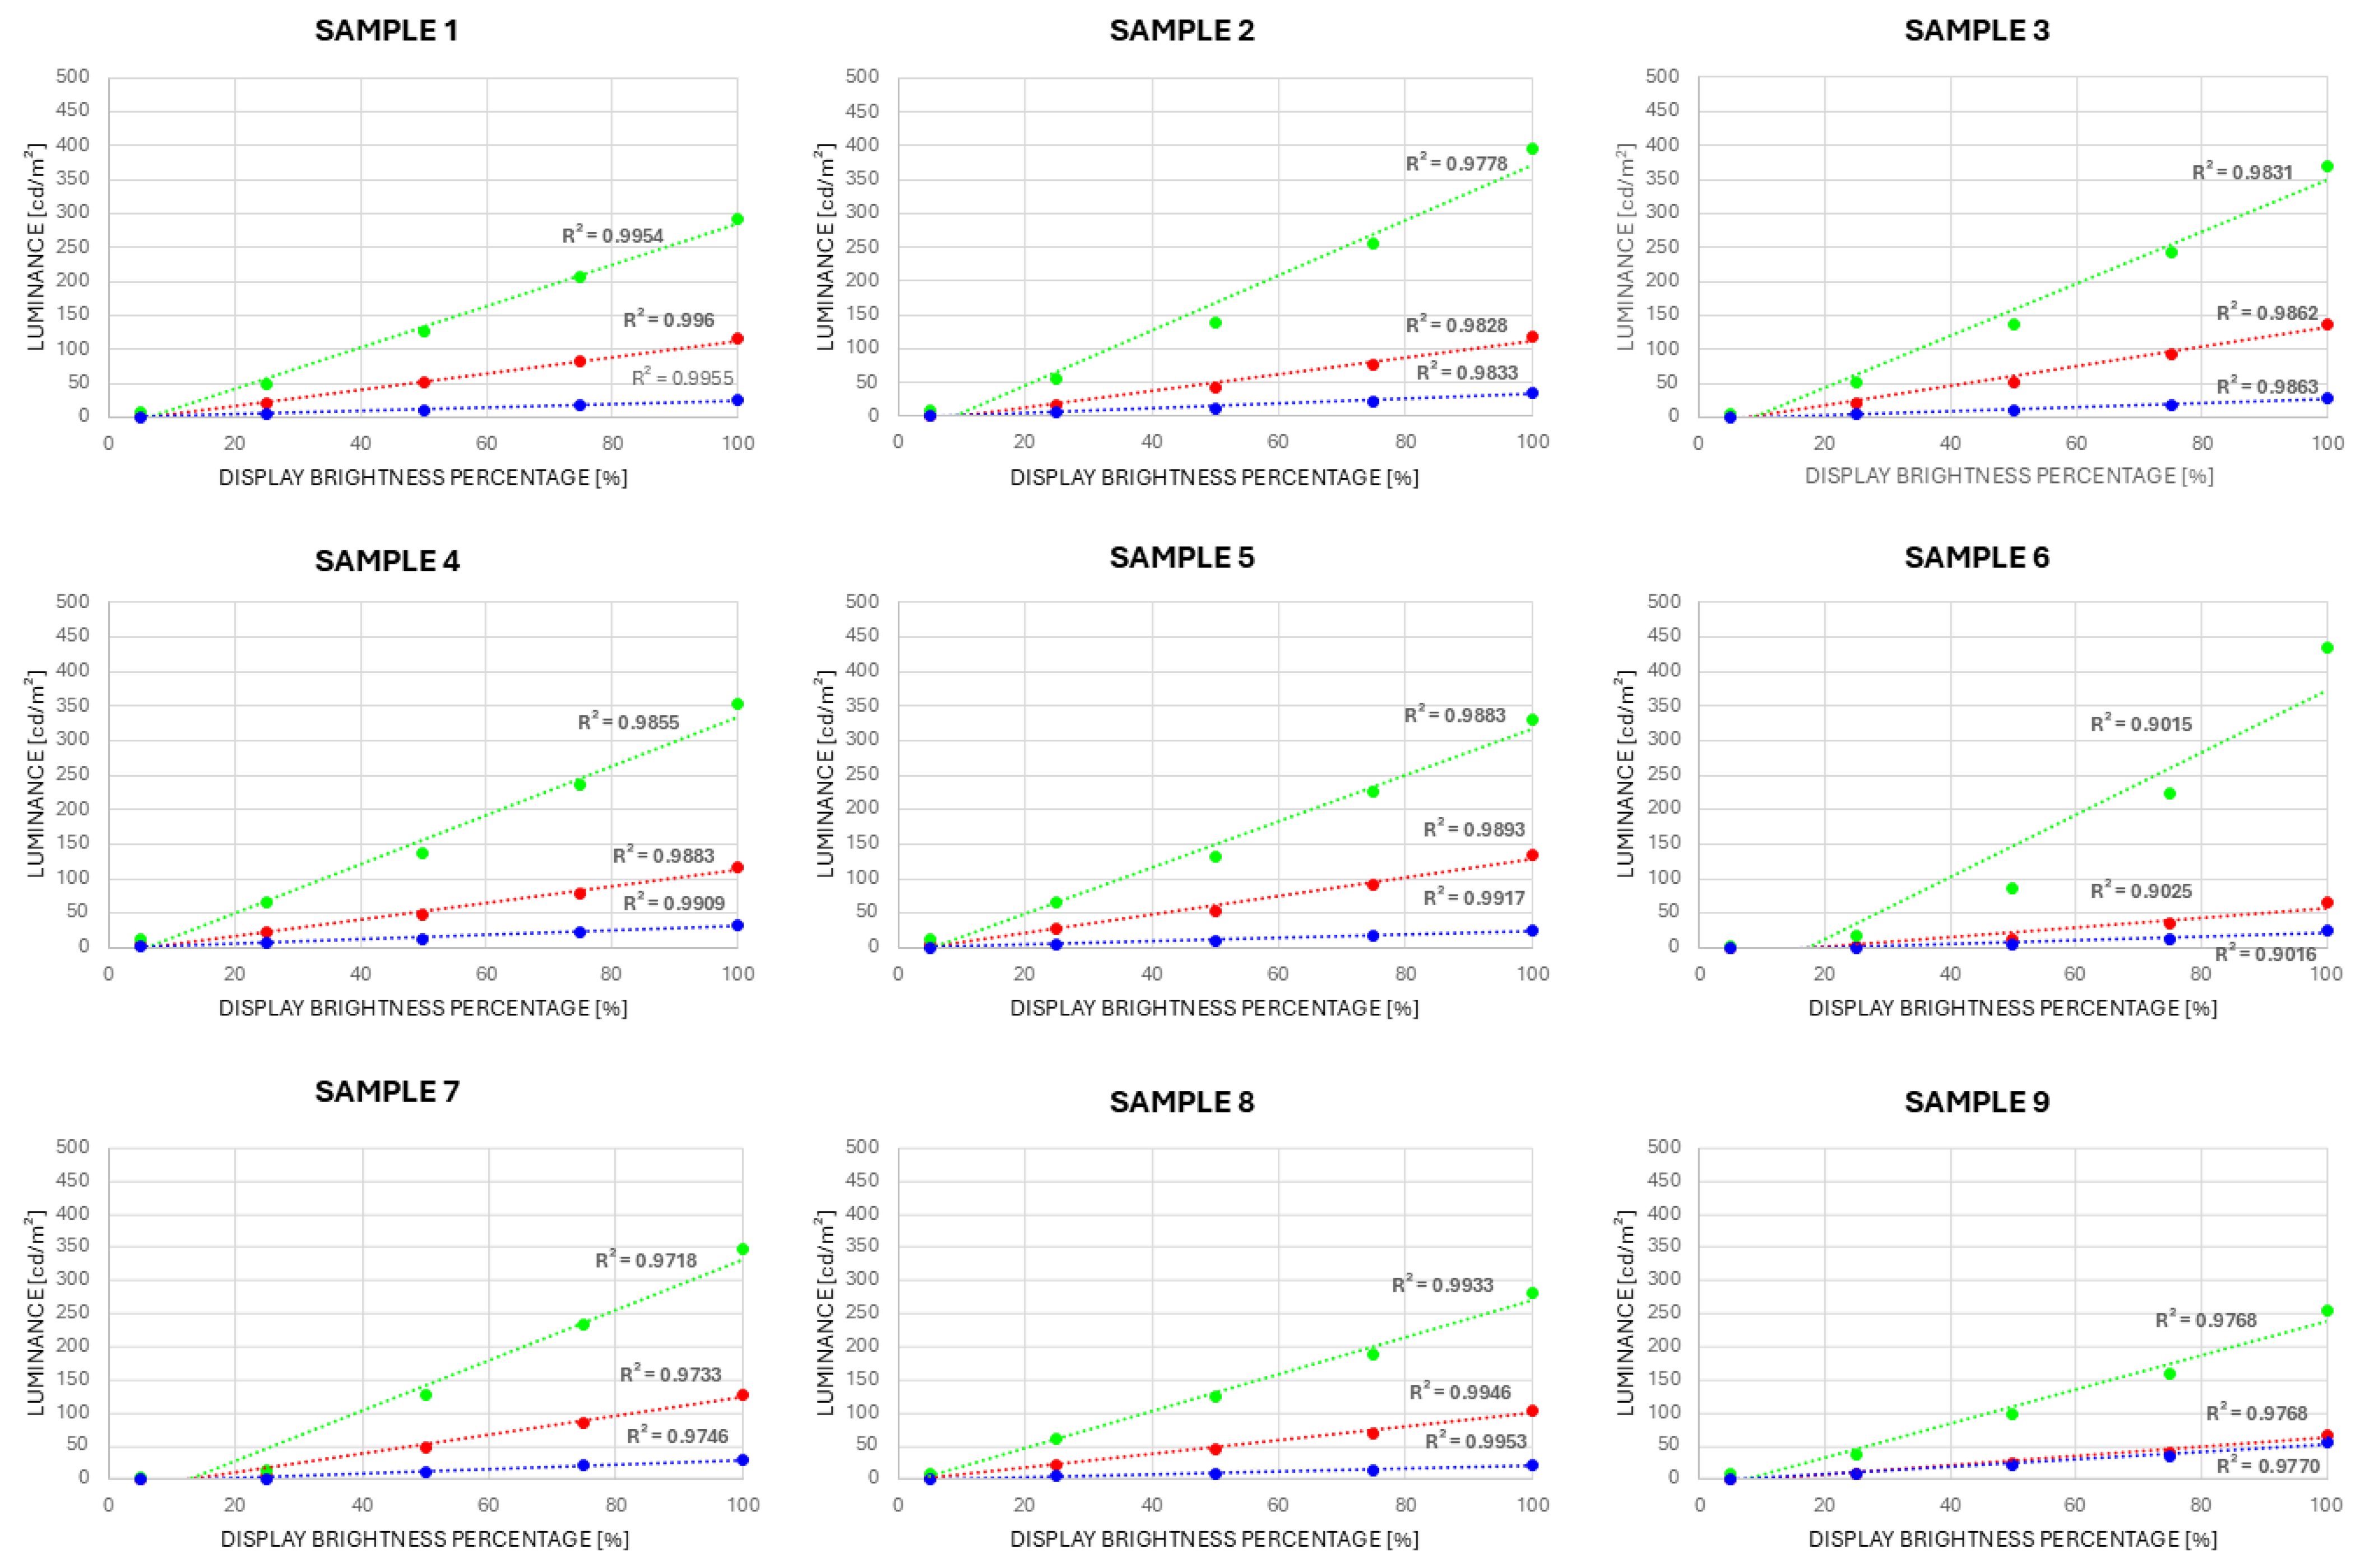
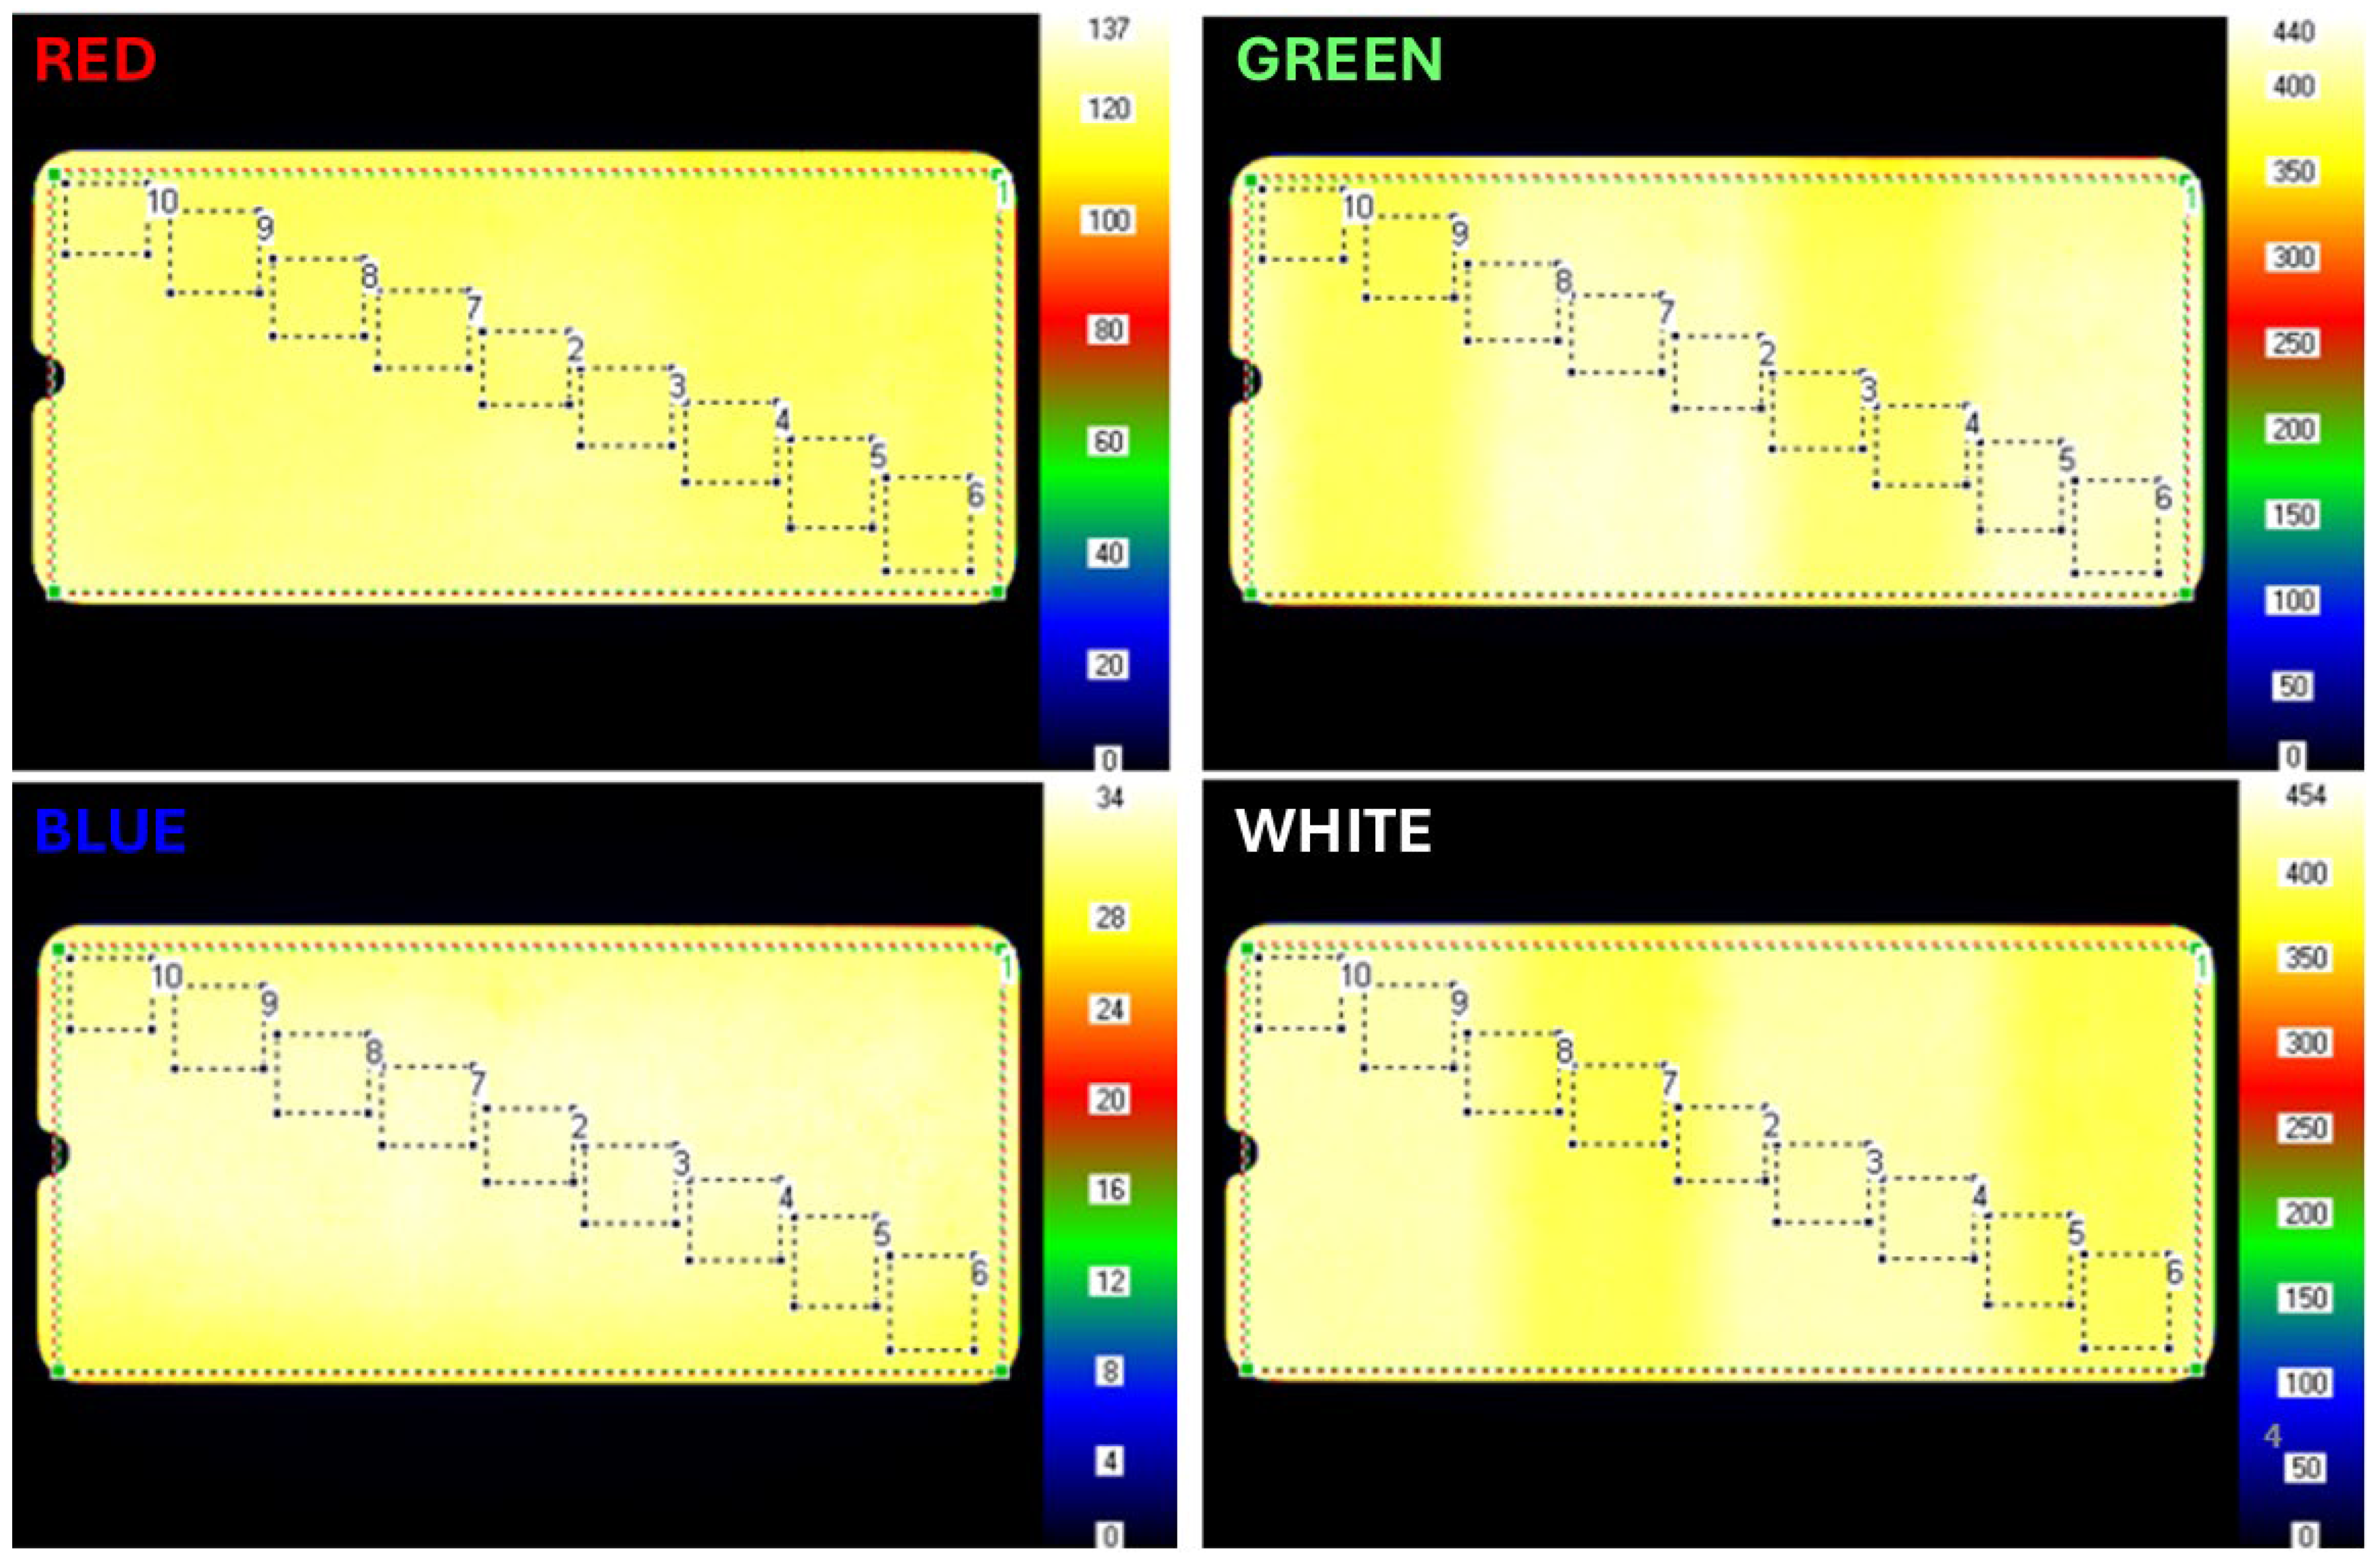
2.2.2. R, G, and B Channel Linearity Measurements

The Konica Minolta CS-200 meter was also used to measure RGB channel linearity. The positioning of the meter relative to the test sample was the same as in the case of the color gamut measurement. For the test screens in the following colors: red (R = 255, G = 0, and B = 0), green (R = 0, G = 255, and B = 0), and blue (R = 0, G = 0, and B = 255), luminance measurements were taken at screen brightness settings of 5%, 25%, 50%, 75%, and 100%.

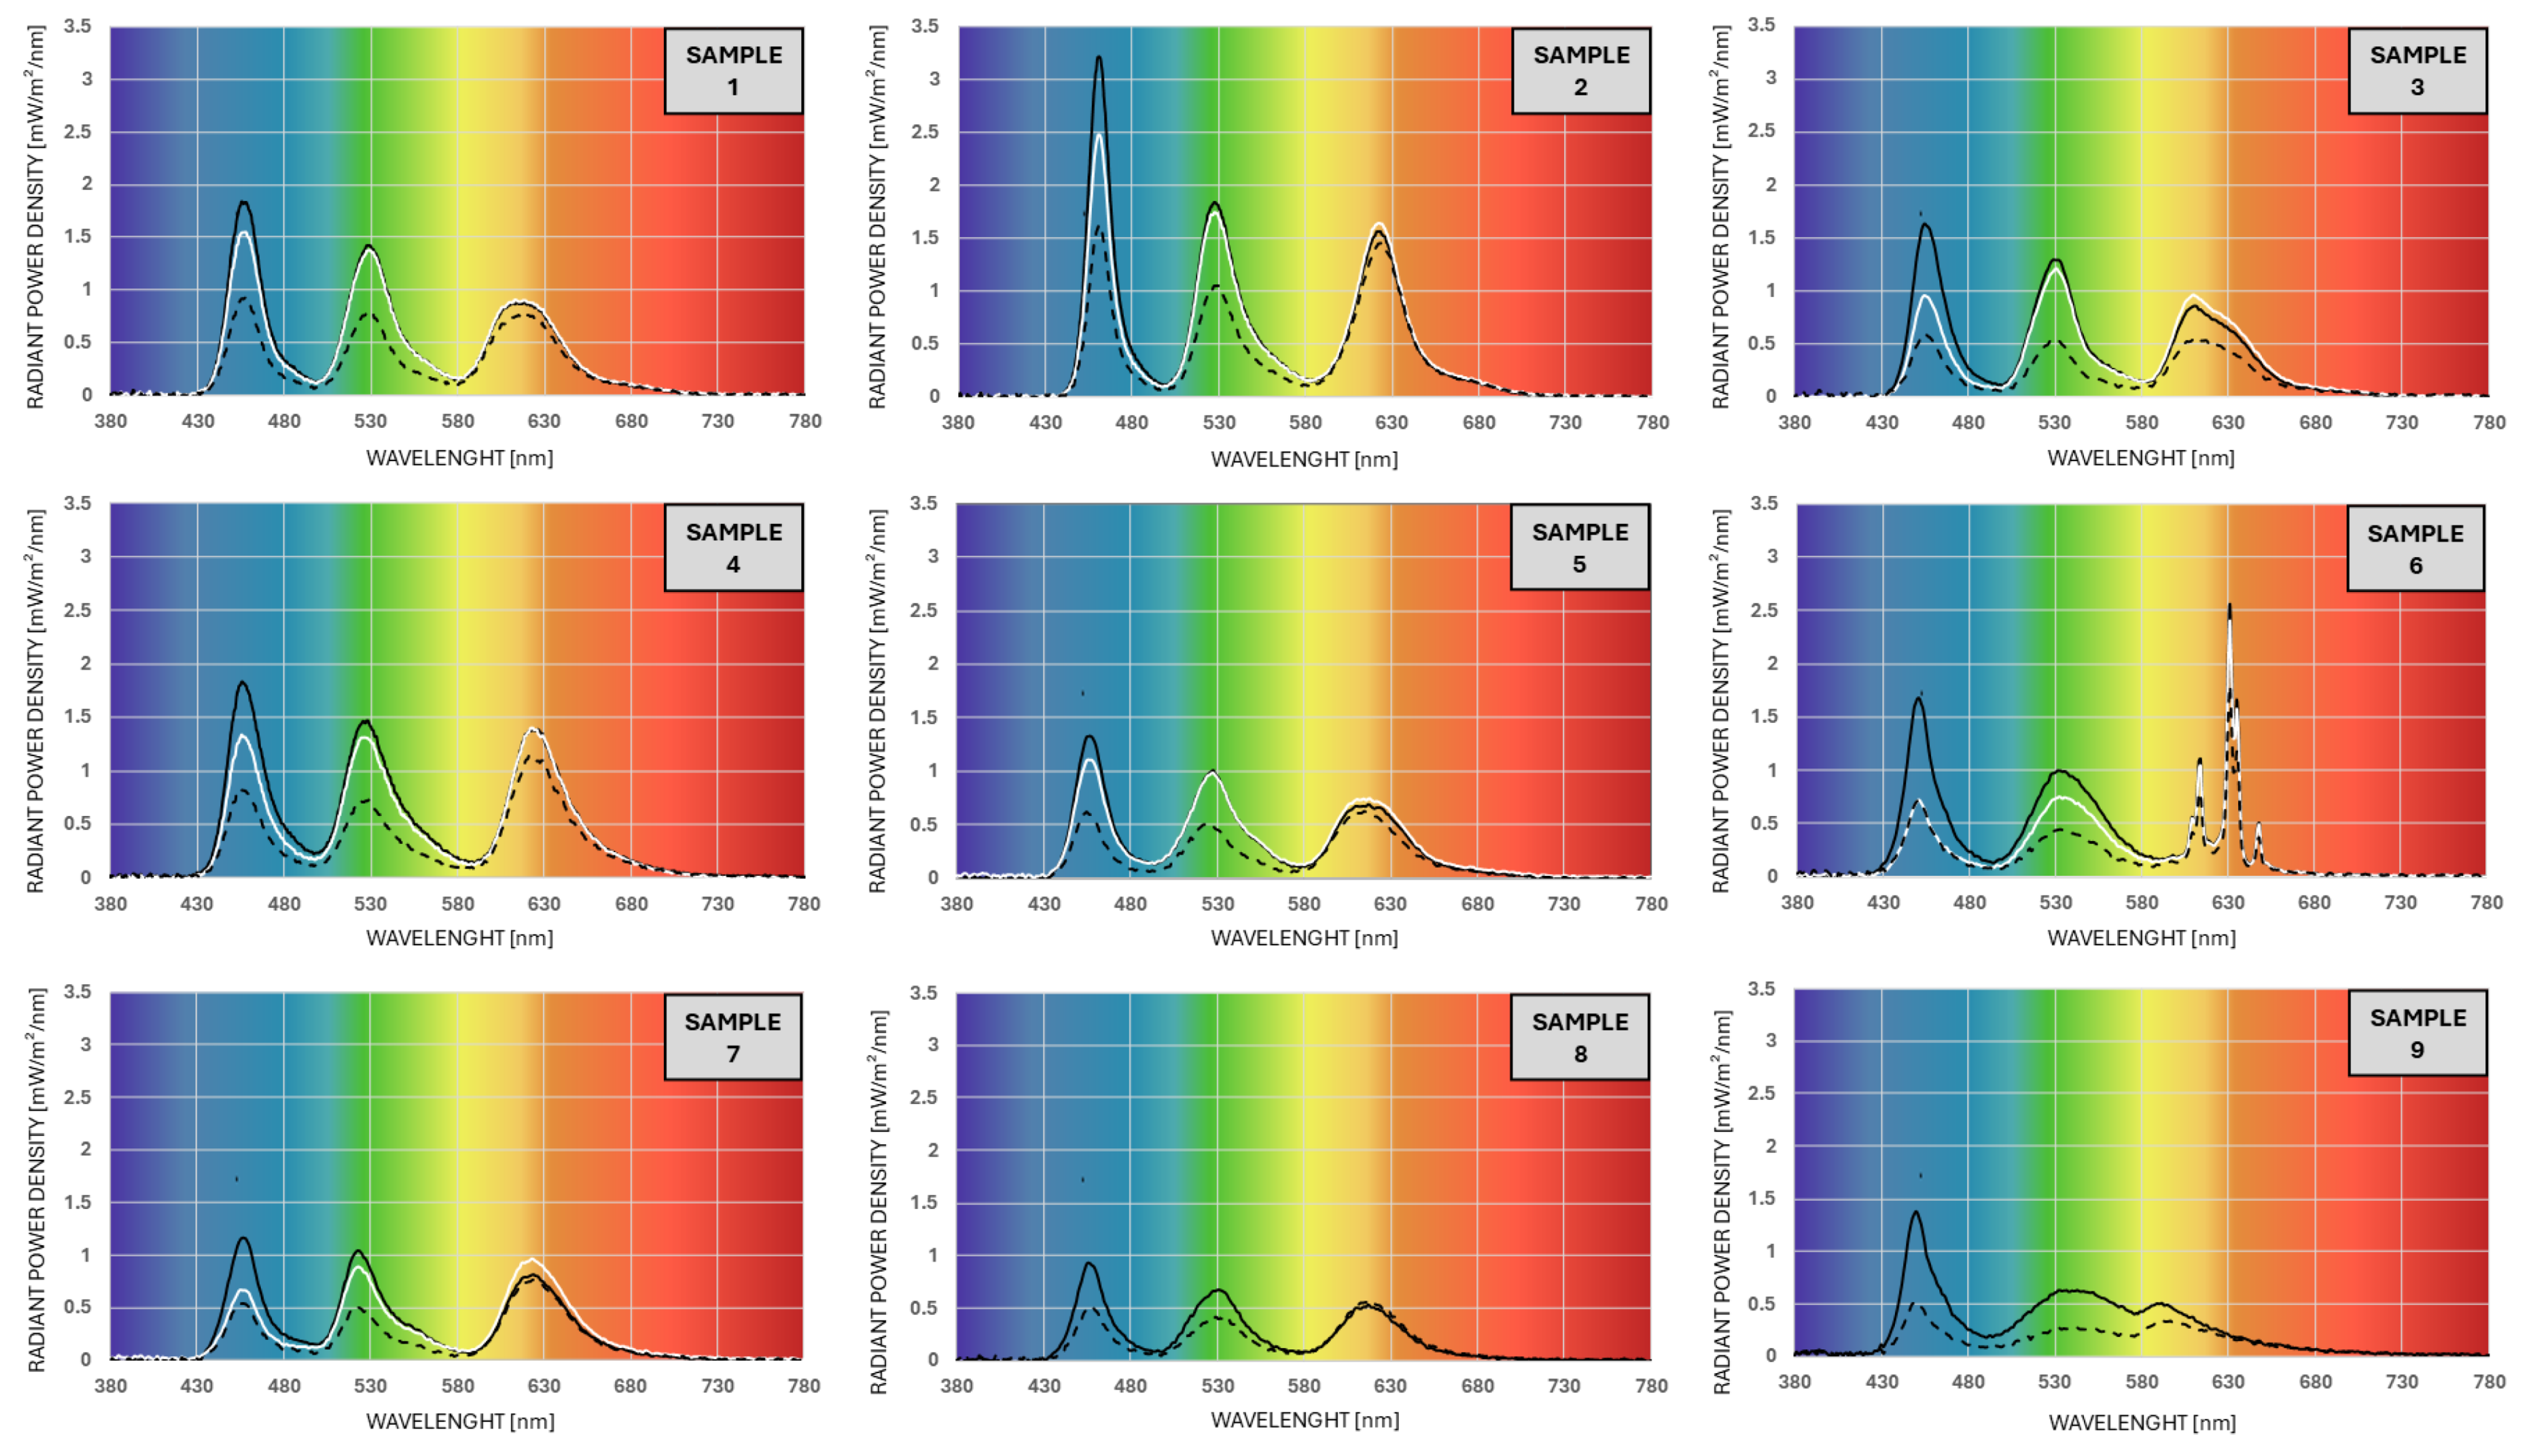
2.2.3. Spectral Properties Measurements

The GL Optic (Puszczykowo, Poland) Spectis 4.0 device was used with a dedicated measurement probe and appropriate software for spectral measurements. It was assumed that the average distance from which a user observes the smartphone display during the day is about 30 cm, and measurements of the spectral power distribution (SPD) emitted by the screen and the correlated color temperature (CCT) were taken at this distance. The probe and smartphone were positioned opposite each other to align their centers in a straight line. The displays of the tested phones were set to the maximum brightness level for the white test screen (R = 255, G = 255, and B = 255). The SPD and CCT for each smartphone sample were measured under three different screen setting variants. The first option was the screen with no additional filters. In the second variant, the built-in blue light filter was turned on. In the third variant, one of the free, publicly available apps that reduce blue light was enabled.

2.2.4. Refresh Rate and Flicker Measurements

The screen refresh rate measurements were performed using the GL Optic (Puszczykowo, Poland) Photometer 3.0 + Flicker probe, which allows the measurement of light flicker parameters. The probe and test sample were aligned coaxially, similar to the previous cases. For each selected smartphone, two measurement series were conducted: one with the battery-saving mode turned off and the other with it turned on. The obtained screen refresh rate and flicker percent values were read from the software dedicated to the probe. The percent flicker parameter is the primary parameter for quantitatively characterizing light modulation by determining its maximum and minimum values [41].

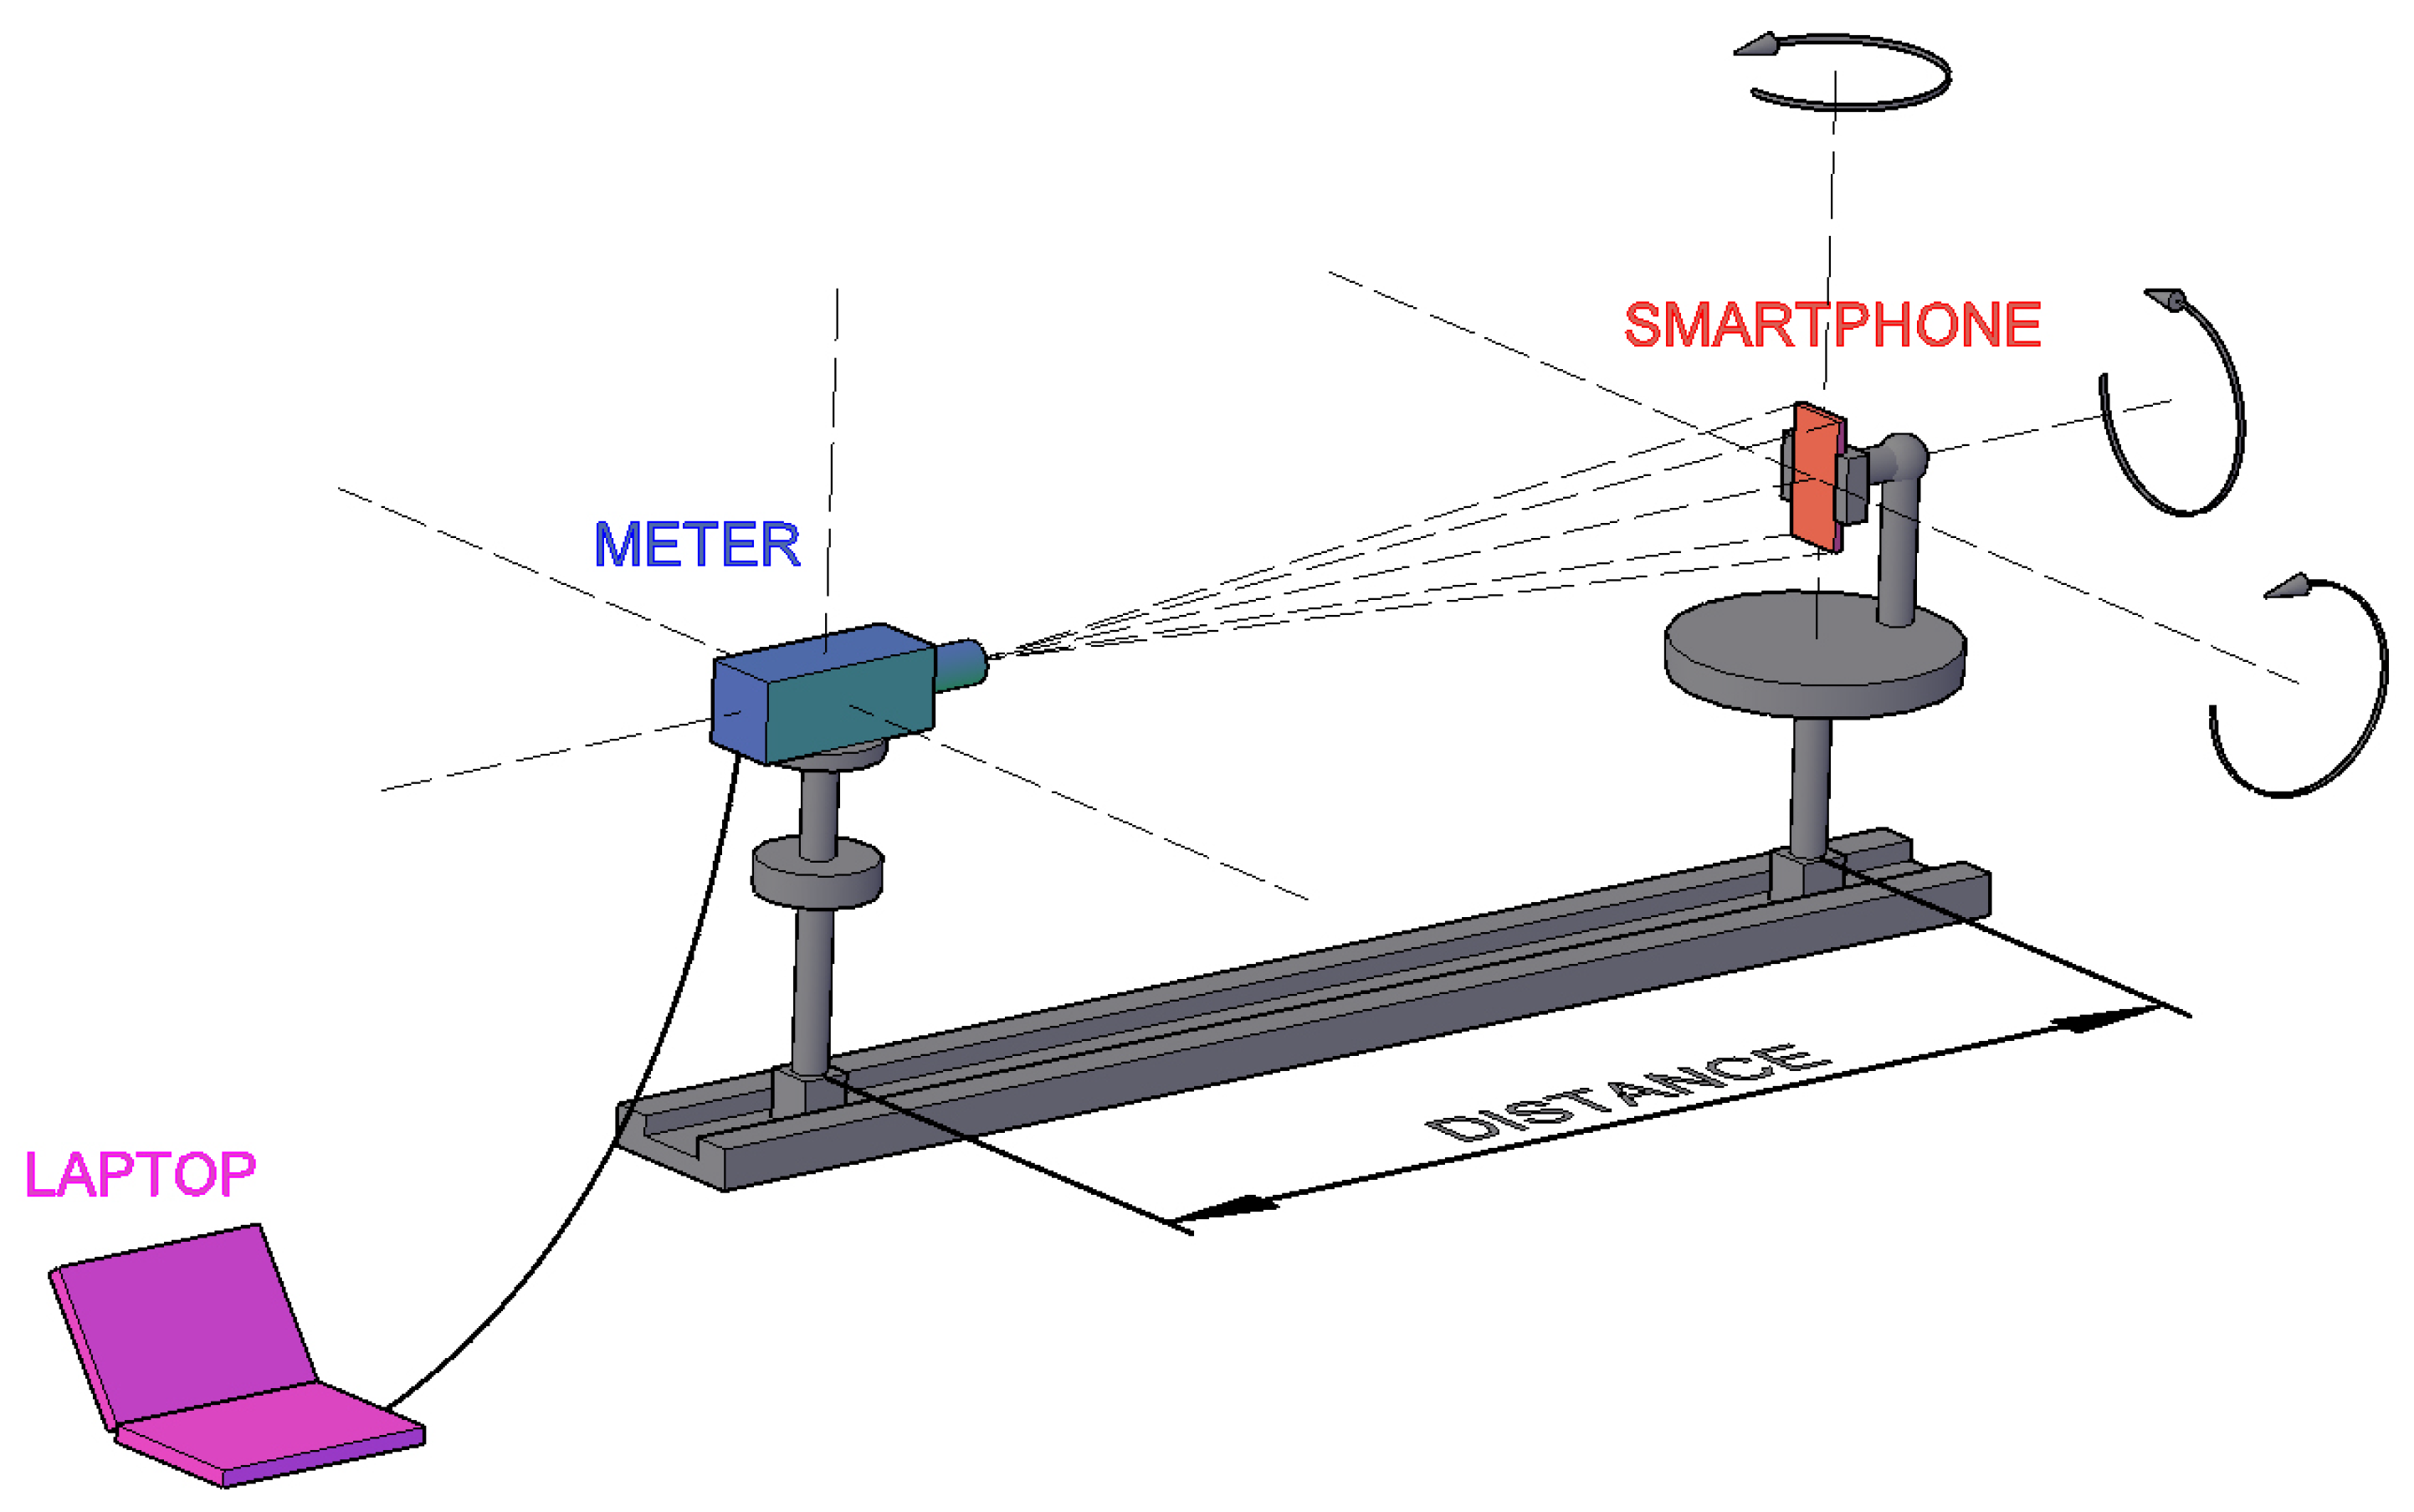
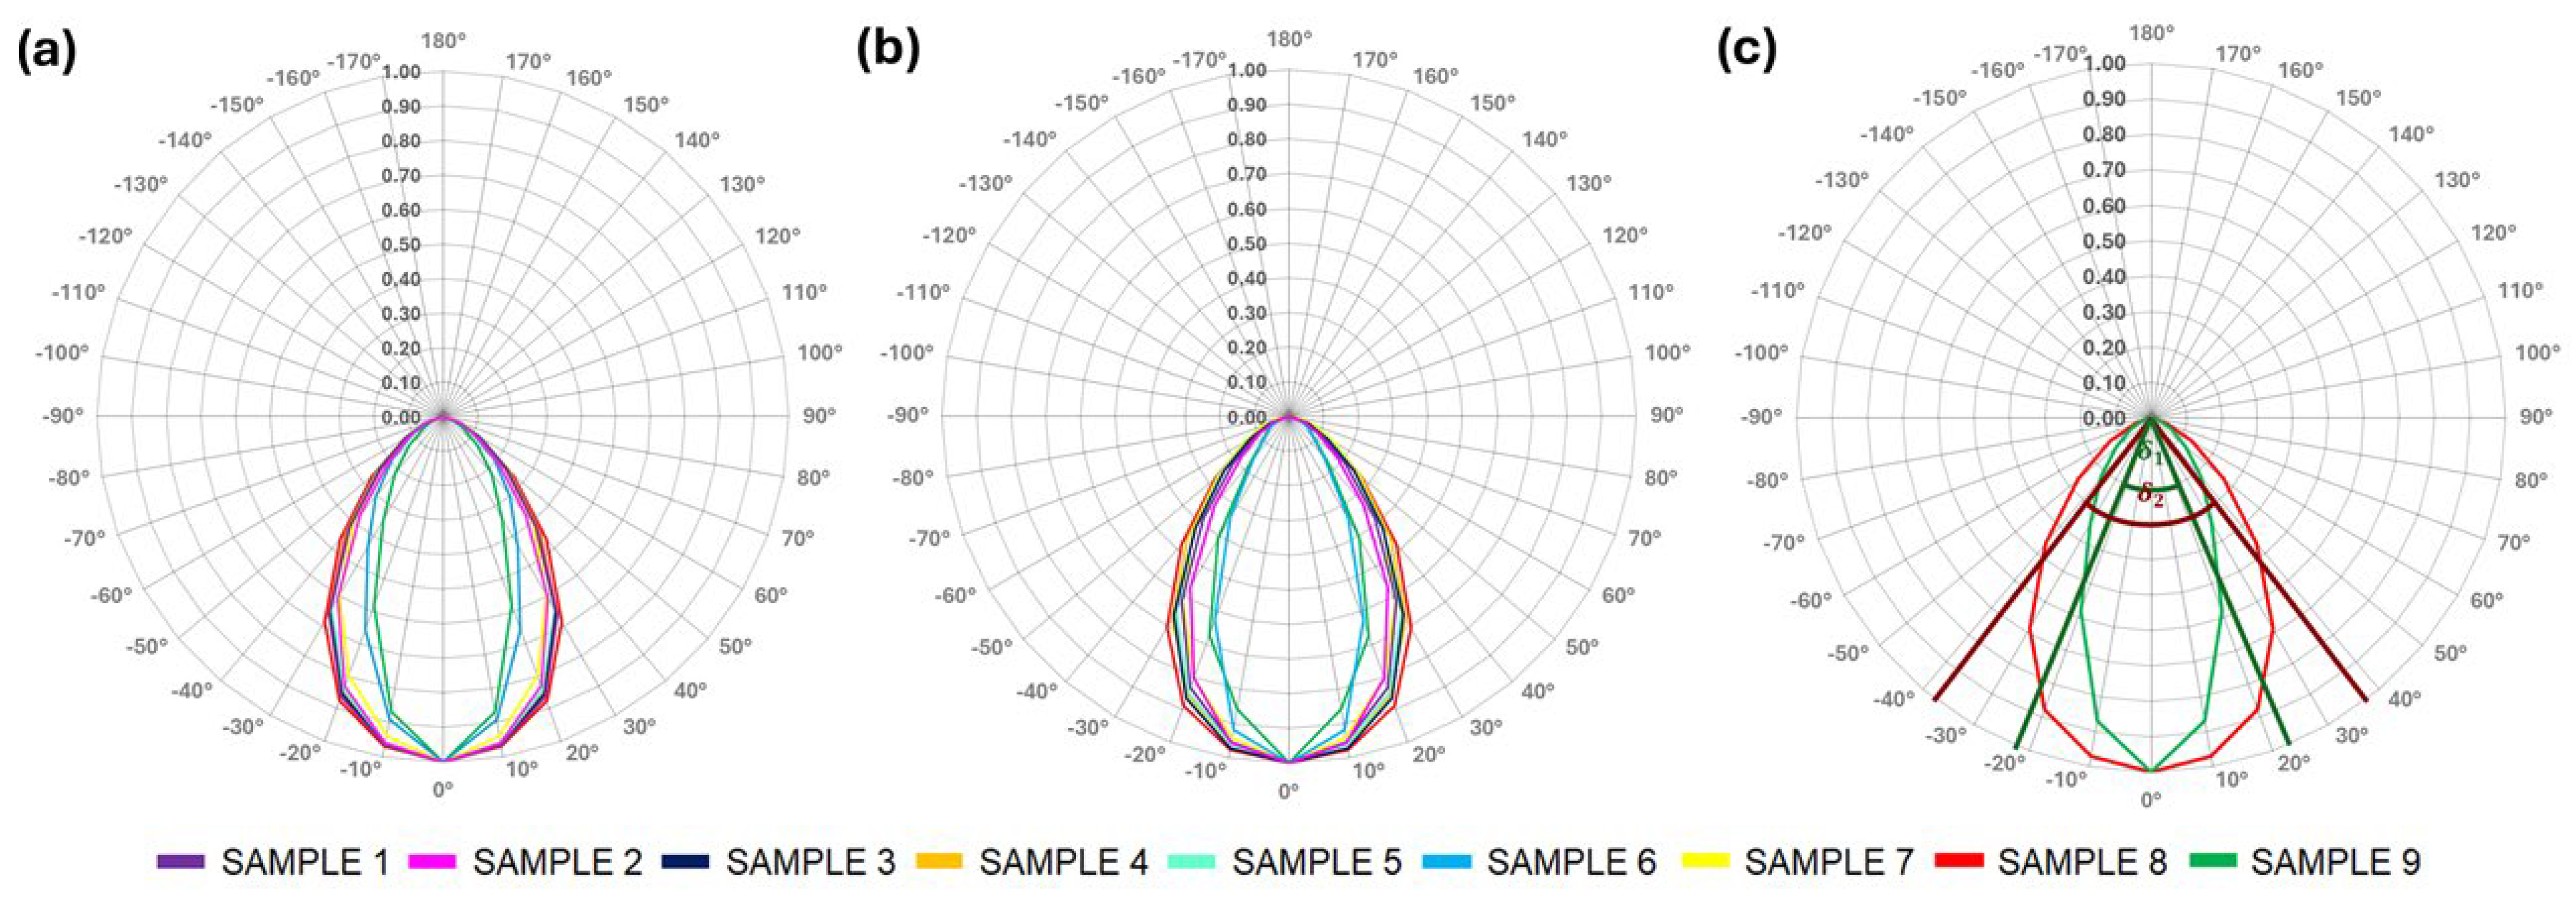
2.2.5. Spatial Radiation Distribution Measurements

The goniophotometric method determined the spatial radiation distribution of the tested smartphone displays. The smartphone sample was mounted on a goniophotometer and aligned coaxially with the measurement probe, which was an illuminance meter. The luminous intensity for different angular settings of the smartphone screen relative to the measurement probe was calculated using the typical method with the inverse square law [42]. The measurements were made in two planes: along the shorter edge of the smartphone (C0–C180) and the longer edge of the smartphone (C90–C270), for angular positions from 0° to 90°, with a step of 10°. The measurements were performed for the white test screen (R = 255, G = 255, and B = 255) with the maximum brightness.

2.2.6. Luminance Distribution, Uniformity, and Static Contrast Measurements

The luminance camera LMK 98-3 Color from Technoteam (Imenau, Germany) and its dedicated software were used for these measurements. The focal length of the lens was 50 mm. The meter was positioned perpendicular to the phone screen. The image from the meter was focused, the appropriate dynamic range was selected, the integration time was adjusted, and a correction for the measurement distance was considered [43]. The field of view covered the smartphone’s entire screen, primarily the light-emitting area. Measurements were conducted on properly prepared test screens with the brightness set to maximum. The luminance distribution and uniformity were measured for the following four test screens: red, green, blue, and white, similar to the gamut measurement. For static contrast measurements, two test screens consisting of two measurement fields, black and white, each covering 50% of the screen area, were used.

3. Results

3.1. Color Gamut Performance

Based on the measured x and y values for the red, green, and blue colors, graphs were created to illustrate the color gamut of the selected smartphone screens (Figure 3). The fill of the sRGB triangle was also calculated (Table 2). It was performed by comparing the area of the sRGB triangle with the area obtained from experimental measurements. A value above 100% indicates that the gamut of a given screen exceeds the sRGB standard.
Based on the results, it can be stated that 8 out of 9 samples exceed the sRGB standard, as the calculated fill values of the triangle are well above 100%. Only sample 9 does not meet these requirements. Its color gamut fills only about 73% of the sRGB triangle. It is the oldest smartphone on the set, featuring an LCD TFT display. In comparison, sample 8 also premiered in 2014. Still, it has a significantly larger available color gamut, which could be attributed to the AMOLED screen technology, and it competes closely with much newer models.
The smartphone that meets the sRGB color triangle standards but performed the worst compared to the other models is sample 6. It is one of the best smartphone models available from 2017. Its color gamut exceeds the standard by only 20%. A competing flagship model with an AMOLED display, released a month earlier (sample 4), has a broader color gamut and ranks first among all tested samples. Its color gamut exceeds the sRGB standard by more than 50%.
All AMOLED display smartphones selected for the tests achieved similar values for the color gamut area (ranging from 140% to 150% of the sRGB triangle). However, the smartphones with LCDs (TFT and IPS) tested have a significantly smaller available color gamut than those with AMOLED displays. This fact occurs regardless of the device’s price or release year.
The color gamut of smartphones most frequently showed a noticeable shift of one color triangle vertex toward the green colors. It was most evident for phones with AMOLED displays. These smartphones had chromatic coordinates for this color that extended well beyond the range defined by the standard. For many models, the color space was also shifted beyond the required range for the red color (samples 2–8). The most significant shift toward the red color was observed for samples 2, 4, and 7. All phones (except for the non-compliant sRGB sample 9) had the closest values to the sRGB standard for the blue color.

3.2. Channel Linearity

Figure 4 shows the linearity curves of the R, G, and B channels. These are functions of the measured luminance for each test screen relative to the set brightness. For all the tested smartphone samples, the increase in luminance depending on the screen brightness for different colors was similar to a linear function. The trendline fitted to their graphs most often had a determination coefficient R2 greater than 0.97 for each channel. Only sample 6 had a slightly worse result. Its linear trendline had an R2 value of 0.90, with slight differences between the R, G, and B channels. In comparison, the oldest tested smartphone model (sample 9) showed much better linearity in the response of the individual channels, even though both samples have an LCD screen. An entirely linear response for the individual channels was achieved for the oldest (sample 8) and the newest (sample 1) smartphone with an AMOLED display.

3.3. Spectral Power Distribution and Blue Light Reduction

Several similarities can be observed when analyzing the selected smartphone displays’ SPD using the spectroradiometer, as shown in Figure 5. The most characteristic common feature is the high radiant power density values from 430 nm to 480 nm in the wavelength range. Except for sample 6, all samples reached the maximum radiant power density value within this wavelength range. The highest value, 3.21 mW/m2/nm, was obtained for sample 2 at a wavelength of 461 nm. The lowest value, 0.93 mW/m2/nm, was obtained for the older sample 8 at a wavelength of 456 nm. This result is more than three times smaller. The displays of both smartphones use AMOLED technology. However, those samples differ significantly in their release dates. Sample 2 was released in 2023, while sample 8 debuted in 2014. It indicates that despite recent reports about the harmful effects of blue light on human health [44,45], this is not always considered when manufacturing electronic device screens. It is noticeable that built-in blue light filters are not present in older models released in 2014.
A similar SPD was observed for all AMOLED displays. Three areas can be distinguished where the radiant power density increases noticeably. These wavelength ranges correspond to blue, green, and red colors. It directly results from how color images are generated using AMOLED technology, which uses organic light-emitting diodes emitting light in these three colors. More significant differences were observed in phones with LCDs in the SPD. Sample 9 is characterized by the SPD typical for white LED chips, which is most likely because such a light source was used to backlight the screen. For sample 6, the distribution also resembles the LED SPD, but there is an increase in radiation emission in the wavelength range responsible for the red color. This type of backlight is likely used to improve the available color gamut in the phone.
As mentioned above, most smartphones currently have a built-in blue light filter due to the need to limit it. Many free apps also claim to offer similar functionality. By comparing the SPDs from smartphone screens before and after activating the manufacturer’s filters, it can be concluded that they serve their purpose (white lines in Figure 5) but in minimalistic ways. For each phone model tested, a reduction in radiant power density was recorded in the desired wavelength range (from 380 nm to 480 nm). The most minor decrease of about 25% was noted for samples 1 and 5, which could be because these are budget versions. For some models, radiation in the red wavelength range was additionally increased. It can be seen for samples 3, 5, and 7.
A decrease in the radiant power density for all wavelengths in the visible spectrum can be observed for the installed free app. This app more effectively reduces the emitted blue light values compared to the manufacturer’s filter. For sample 9, the app reduces the maximum value in the blue light range by more than 80%. However, despite the significant reduction of emitted blue light, the restriction of other wavelengths makes the app less useful, as a similar effect can be achieved simply by dimming the screen.
A high CCT characterizes all of the tested phones. For most of them, it is around 7000 K for the variant without any filters applied (Table 3). It is cold light, associated with daylight on a cloudy day. It may have a stimulating effect on humans [46]. The highest values in this case were obtained for smartphones 6 and 9, which are equipped with LCDs. Their CCTs were even closer to 8000 K. Some of the CCTs were also recorded for the two newest smartphone models, samples 1 and 2. It may also be due to using significantly cheaper and lower-quality displays since these are budget smartphones.
After applying the built-in blue light filter, the CCT significantly decreased, which occurred differently for each phone. The correlated color temperatures vary more among the devices, ranging from 4000 K to 6200 K. The largest difference between the variant with and without the filter, almost 3000 K, can be observed for sample 6. A vast difference (around 2600 K) is also noted for sample 7, where the manufacturer applied a filter to reduce blue light and increased radiation emission in the wavelength range responsible for the red color. More minor differences (around 1000 K) occurred for samples 2 and 5. Sample 5 is a smartphone where the manufacturer’s filter performed the worst in reducing blue light. Nearly all smartphones achieved the lowest CCT for measurements taken with the blue light filter app. The exception is sample 6, which had a lower CCT for the variant with the manufacturer’s filter. After using this app, the phones’ screens exhibited CCTs in the 3300 K to 5200 K range.

3.4. Refresh Rate and Flickering

The results of the screen refresh rate and flicker depth measurements are presented in Table 4. In all cases, the smartphone samples’ measured screen refresh rate matches the frequency their manufacturers declared. For older smartphone models (samples 8 and 9), where no information was found, the measured refresh rate is 60 Hz. It is the standard for older devices. All samples released before 2020 feature this refresh rate. Due to the high energy consumption of high refresh rates, devices reduce them to 60 Hz in battery-saving mode. The results for samples 1, 2, and 3 confirm this.
For many models in the set, an increase in the flicker percent parameter was observed after enabling battery-saving mode. This phenomenon occurred for most phones, regardless of whether the refresh rate changed. The phone where no change in the flicker depth was observed in battery-saving mode is sample 7. The most significant flicker increase was observed for the oldest model tested (sample 9). Substantial changes also occurred for a newer phone (sample 3). In battery-saving mode, it reached FP values of around 6%. This value is higher than that of older phone models, which feature a standard frequency of 60 Hz. However, these values are still acceptable since the flicker percent parameter should not exceed 15–20% to avoid eye strain [47]. From this perspective, only one of the newer models (sample 2), released in 2023, performs poorly. In this case, the flicker depth of its screen exceeds 20% in both modes.

3.5. Spatial Radiation Distribution

The relative luminous intensity distribution curves (Figure 6a,b) were created to compare the spatial radiation distributions of the screens of individual smartphones. The obtained luminous intensity curves show many similarities. First of all, it can be observed that the luminous intensity distributions for all the screens tested are practically identical across different photometric planes, C0-C180 and C90-C270. It means that the luminous intensity distributions of the tested screens are rotationally symmetrical, which aligns with theoretical expectations. Phones with LCDs exhibit a slightly narrower luminous intensity distribution than those equipped with AMOLED displays.
The entire luminous flux of the displays is emitted into one hemisphere, with the majority of the luminous flux occurring at a solid angle of 100°. For 8 of the tested smartphones (except for sample 8), the luminous intensity values for angles greater than 50° are less than 20% of the maximum luminous intensity. A division by display technology is also visible in the luminous intensity distribution. LCDs (samples 6 and 9) have a narrower light distribution than phones with AMOLED displays. The phone with the broadest light distribution is one of the oldest devices in the tested group (sample 8).
The screens of the tested smartphones also differ in maximum luminous intensity, which in each case occurred in the direction normal to the screen surface. The phones’ displays reach luminous intensity values from 1.7 cd to 3.9 cd. The lowest maximum luminance was obtained by sample 8, while the highest was obtained by sample 2. These phones have AMOLED displays and belong to the same manufacturer series. However, they differ in their release date. The oldest smartphone obtained the lowest luminous intensity value (sample 9).
The maximum half-peak divergence (HPD) was defined as the angle from which 50% of the maximum luminous intensity value of the display is achieved. The set of calculated values for these angles, characterizing the spatial radiation distribution, is presented in Table 5. Most phones with AMOLED technology achieved similar values for the HPD based on the average photometric curve. There was a 9° difference between the maximum and minimum HPD. The average value for smartphones with AMOLED displays was 73°. The best result in this comparison was achieved by sample 8, which directly relates to its wide distribution.
In contrast, sample 2, although one of the newer models, performed the worst among phones with AMOLED displays. This phone reaches higher luminous intensity values, but its distribution is much narrower and more concentrated. It means that the content displayed on the screen will not be visible from a large angle, which may reduce user comfort.
A significant difference in HPD was observed for LCDs. For these models, there was a drop of about 22° compared to the average value obtained by AMOLED displays. The lowest HPD was recorded for the oldest model in comparison (sample 9). Figure 6c compares the biggest and smallest HPD for smartphones in comparison, for samples 8 and 9, respectively.

3.6. Luminance Distribution and Its Uniformity

An example of the luminance distribution measurement and its uniformity is presented in Figure 7. The exact summary of the average luminance values and uniformity for the various test screens (red, green, blue, and white) can be found in Table 6.
The average luminance values for the white screen ranged from 292 to 437 cd/m2, depending on the type and age of the model. LCD displays (samples 6 and 9) achieved the highest values of this parameter. One of the newest models with an AMOLED display obtained a similarly high result, released in 2023 (sample 2). Most smartphones with this display type achieved values approximately equal to 350 cd/m2. The lowest luminance for the white screen was obtained by sample 8, the oldest model with an AMOLED display. The smartphone screen’s high average luminance value can positively affect display visibility during the day. However, it may also negatively impact the use of smartphones at night [48,49].
The tested samples exhibited average uniformity values between 0.73 and 0.92, averaging 0.83. The highest uniformity values were achieved by two smartphones: sample 1, the newest model in the set, and a slightly older, mid-priced model—sample 4. All smartphones released after 2019 achieved average uniformity values better than the set’s average. Sample 9, the oldest model, achieved the worst result and was the only smartphone to record a value of 0.75 or below in each of the R, G, and B channels and for white light. Surprisingly low values were also noted for sample 7 (the flagship smartphone from 2017), as an older and more budget model outperformed it.
Smartphones with LCDs showed low red luminance values. Their values were nearly twice as low as the average results obtained by phones with AMOLED displays. However, sample 9 reached a very high blue luminance value, which was more than twice as high as the blue luminance of the newest smartphone in the set. No similarities were observed for the newer smartphone with the same type of display (sample 6), which had blue luminance values close to those of phones with AMOLED displays.
A significant difference was also observed between the green and white luminance for the LCD models. It is likely why the white screen luminance reached much higher values. For sample 9, the white screen luminance was 26% higher than the green luminance, while for sample 6, it was 37% higher. The luminance values of the aforementioned green and white screens were similar for AMOLED smartphones. However, the green screen luminance often reached higher values than the white screen luminance. This situation was not observed for the two newest models in the set (samples 1 and 2), where, despite achieving similar values, the white screen luminance was higher.

3.7. Static Contrast

An example of static contrast measurement is presented in Figure 8, and a summary of the results is provided in Table 7. The contrast values for the selected smartphones are varied. The ratio of the average white field luminance to the black field luminance displayed on the screen at the same time ranged from 312:1 to 527:1. The static contrast for devices with LCDs was significantly lower and was closer to a value of 300:1. Moreover, the static contrast for devices with AMOLED displays was typically around 500:1.
The worst performance among the phones with AMOLED displays was achieved for sample 2. It achieved the highest white field luminance values of all the smartphones tested. However, the black field luminance values it achieved were also high. It is the only phone not using LCD technology for which the black field luminance exceeded 1.0 cd/m2. The older model obtained a slightly higher static contrast value (sample 8). The best static contrast values were achieved by samples 3 and 4. These achieved both high white luminance and low black luminance. It is beneficial for proper content display. Over the years, it has not improved significantly, and for AMOLED displays, it will remain at 500:1 regardless of the price of a given smartphone. It is surprising because high static contrast is desirable and determines the display’s observation comfort.

4. Discussion

First of all, the color gamut measurements revealed that 8 out of 9 tested smartphones meet the requirements of the sRGB standard. The oldest phone in the group, which features an LCD, has a narrower color gamut. LCDs achieved lower values compared to AMOLED displays. AMOLED displays produced similar values regardless of the phone’s release date, with their color gamut area reaching 140–150% of the area defined by the standard. There is a noticeable difference between older and newer LCD models. It is rather connected with the type of LCD technology used. However, the older model (TFT LCD) does not meet the sRGB requirements, while the newer one (IPS LCD) has a color gamut that is more than 20% larger than required. Despite that, the newer LCD smartphone still did not match the AMOLED displays in color gamut. It indicates the advantage of AMOLED displays over LCDs.
Almost all phones in this study exhibited excellent RGB linearity. The R2 value for the linear trend fitting generally exceeded 0.97. It means that the luminance for each R, G, and B channel increases similarly. The linearity of response in the R, G, and B channels is crucial for displays, as it helps prevent color distortion and image discoloration.
Thanks to the spectral distributions of radiation from the displays, fundamental differences can be observed in the radiation emitted by different types of displays. The SPD from smartphones with AMOLED displays is characterized by high radiant power density values in three typical wavelength ranges. These correspond to the blue, green, and red colors. It is due to the construction of these displays, which use LED sources emitting light in these three colors to create a color image. The spectral distribution of LCDs largely depends on the type of backlighting used. In the older model, the SPD resembles the spectrum of white LED light. In the newer model, there are also narrowband increases in radiant power density in the red light range. It is performed to expand the color gamut [50].
It must be stated that the blue light emitted by digital devices such as smartphones is often classified as hazardous. The radiation between approximately 400 nm and approximately 500 nm, characterized by the high energy, may harm the human eye and cause permanent effects of tissue degradation [13]. The peak emissions of blue light from smartphone displays obtained in this study are far lower than those humans encounter in the natural environment, resulting from solar radiation [51]. However, extensive exposure to visible radiation lasting very long may adversely affect the circadian rhythm [52,53]. A precise assessment of how it is in the case of long-term use of these smartphones requires separate studies. Nevertheless, reducing blue light radiation from electronic devices, especially smartphones, is better because, as mentioned earlier, the daily usage time is increasing alarmingly. The growing awareness of the harmful effects of blue light radiation on health and well-being can be seen easily in the features available on smartphones.
Older phones in this study did not have a built-in blue light filter. Nowadays, most models are equipped with such a filter, and many free apps claiming similar functionality are also available. In the SPDs of almost all selected displays, the highest radiant power density values occurred in the blue light wavelength range (from 380 nm to 480 nm). By comparing the SPD before and after applying the filter, it can be concluded that the blue light filters offered by manufacturers serve their purpose and reduce the highest blue light radiation values by about 20–30% without changing the rest of the visible spectrum. A more significant reduction in radiation across the entire visible spectrum was observed for the free app, especially for the blue light spectrum range. However, it must be considered that different apps can work differently, and further study of this phenomenon is required. High values characterize the CCT of the selected displays. Each tested display without a blue light filter had a CCT above 6500 K. The high values of this parameter further indicate the dominance of blue light radiation emitted by the screen, which is probably linked to the generally known higher efficiency of such blue LEDs compared to red and green ones. The highest CCT was exhibited by LCDs, probably due to the backlighting type used, which mainly uses white phosphor-converted white LEDs. The phosphor changes some blue light to green and red, but some remains [54]. In contrast, the high CCT for AMOLED screens is related to the fact that OLEDs responsible for blue pixels age faster than those responsible for green and red pixels [55]. The lowest values of CCT were usually obtained after activating a blue light filter app. It effectively lowered the CCTs. However, the yellowing of the display may not be well received by all smartphone users.
The results of the refresh rate measurements of the phone screens were consistent with the data declared by the manufacturers. For phones where no information about this parameter was found from the manufacturer, the measured frequency was 60 Hz. It is the standard frequency for older models. However, high refresh rates are an energy-consuming solution, so phones with high refresh rates lower them in battery-saving mode, as confirmed by the results. The displays achieved quite low values of the Flicker Percent parameter, usually below 6%, regardless of the mode. Only one sample had values for this parameter exceeding 20%, which should be considered unfavorable from the perspective of using the screen. For many models in this study, an increase in the Flicker Percent parameter was observed after enabling battery-saving mode.
The measurements of the spatial radiation distribution showed that the entire luminous flux from the smartphone display is sent into one hemisphere. LCDs have a narrower spatial radiation distribution than AMOLED displays, which is related to their construction. The second polarization filter used for backlighting the subpixels passes light polarized in a specific direction, significantly limiting the width of the spatial distribution.
All smartphones in this study exhibited average luminance from approximately 300 cd/m2 to 440 cd/m2. Higher values were obtained for LCD than AMOLED displays. At the same time, uniformity values were reasonably good for all samples. For most models, the uniformity was around 0.80–0.85. Differences were observed in the luminance values for screens of different colors. LCDs were characterized by lower red and green luminance values than AMOLED displays. This feature is also influenced by the type of backlighting used in these phones and/or the type of color filter applied.
The selected smartphone samples achieved relatively low static contrast values. The most noticeable differences occurred between the different types of displays. The contrast of LCDs was lower, close to 300:1, while the contrast of AMOLED displays was higher, close to 500:1. This is directly caused by how dark and bright pixels are generated in these types of devices. The backlighting in smartphones using LCD technology is always on, and black is achieved by not passing light through the polarization filter. In OLED displays, the image is created by organic diodes, which turn entirely off to display a black pixel. This is why smartphones with this type of display have much deeper blacks.
By comparing the older and newer smartphone models, it is difficult to point out a clear improvement in radiation parameters in the visible range. Smartphone manufacturers often deliberately choose displays with worse light radiation parameters to increase energy efficiency or lower production costs. However, more attention is now paid to required standards, as evidenced by color space measurements, where newer models meet the sRGB standard, unlike the oldest model tested. Newer smartphones also generally exhibit higher screen luminance than older models with the same display type. In newer smartphones, greater attention is paid to previously ignored aspects, such as the impact of blue light radiation on humans and screen refresh rate. For this reason, modern phones feature refresh rates higher than 60 Hz and have a built-in blue light filter. Higher screen refresh rates are also recommended due to their lower potential for eye strain, but they increase the cost of the entire device.

5. Conclusions

This study of visible radiation emitted by electronic device displays, including smartphones, represents a broad research area. In this article, the intended objectives were successfully achieved. Most notably, advanced and comprehensive photometric and colorimetric analyses were conducted. The results of these analyses were used to characterize and compare the radiation quality of nine different smartphone models released over the past ten years. The findings are surprising. Despite the continuous development of light-emitting technologies in displays, technological performance remains very similar. Regardless of the release year or device price (both budget models and flagship devices were analyzed), the color gamut coverage displayed very similar quantitative characteristics in terms of meeting the standard (150%) and shifting toward monochromatic hues. It is particularly evident in AMOLED displays. Only two LCDs were examined, and they showed significantly poorer color parameters and screen response linearity across individual color channels. Many of the drawbacks of LCDs are directly related to the characteristics of their backlighting, which means that the development of LED backlighting technology could significantly improve their parameters in the future. Additionally, this is a cheaper technology, offering a wide range of applications in more budget-friendly electronic devices. Indeed, both technologies will continue to evolve in the coming years, creating an ongoing need for further research into the quality of light emitted by these screens. However, in the case of small electronics such as smartphones, the primary interest and development are rather keen for highly efficient and developmental technologies such as AMOLED and, recently, micro-LED [56].
Attention Should Be Drawn to Health Risks and Design Trade-Offs Related to Visible Light Exposure. Raising awareness about the potentially harmful and adverse health effects of exposure to visible light is vital. Newer smartphone models are equipped with built-in light filters, unlike older devices. Unfortunately, these filters do not always function as intended. Issues related to screen refresh rates have also been noted, particularly when battery-saving modes are enabled. In such cases, increased ripple depth has occasionally been observed. Additionally, there have been changes in the angular distribution of emitted radiation—the viewing angle has increased, which is undoubtedly beneficial, as it improves the comfort of viewing screen content from different directions. Surprisingly, there has been no significant improvement in static contrast, which, particularly for AMOLED devices, remains around 500:1. The measured average screen luminance levels of smartphones—around 350 cd/m2—are also notable. This brightness level appears insufficient for comfortable screen visibility during outdoor use on sunny days. The authors suspect that the main reasons for the lack of improvement or increase in these parameters are the high production costs or excessive energy consumption, which shortens device battery life.
The light emitted from smartphone displays is a vast area of study. Although the measurements significantly approach the issues of visible radiation parameters in phone screens, there are still many opportunities for continuing research. A fascinating way to expand this study of light parameters in smartphone displays would be to investigate user comfort and subjective perception through surveys. Furthermore, topics such as the impact of displays with higher refresh rates on user fatigue or incorporating non-visual quantitative parameters of visible radiation into the analysis of the obtained results are also worth attention.

Author Contributions

Conceptualization, K.S.; methodology, N.P. and K.S.; validation, K.S. and K.K.; formal analysis, N.P., K.S. and K.K.; investigation, N.P. and K.S.; resources, N.P. and K.S.; data curation, N.P.; writing—original draft preparation, N.P., K.S. and K.K.; writing—review and editing, N.P., K.S. and K.K.; visualization, N.P., K.S. and K.K.; supervision, K.S.; project administration, K.S.; funding acquisition, K.S. All authors have read and agreed to the published version of the manuscript.

Funding

This research received no external funding.

Institutional Review Board Statement

Not applicable.

Informed Consent Statement

Not applicable.

Data Availability Statement

The original contributions presented in this study are included in the article. Further inquiries can be directed to the corresponding author.

Conflicts of Interest

The authors declare no conflicts of interest.

References

  1. Ahn, H.; Wijaya, M.E.; Esmero, B.C. A Systemic Smartphone Usage Pattern Analysis: Focusing on Smartphone Addiction Issue Heejune. Int. J. Multimed. Ubiquitous Eng. 2014, 9, 9–14. [Google Scholar] [CrossRef]
  2. Stachl, C.; Hilbert, S.; Au, J.Q.; Buschek, D.; De Luca, A.; Bischl, B.; Hussmann, H.; Bühner, M. Personality Traits Predict Smartphone Usage. Eur. J. Personal. 2017, 31, 701–722. [Google Scholar] [CrossRef]
  3. Dinaryanti, R.F. Indrawati Analysis of Consumer Preferences in Choosing Smartphone Through User Comments on Youtube. Qual.—Access Success 2024, 25, 323–330. [Google Scholar] [CrossRef]
  4. Chen, H.W.; Lee, J.H.; Lin, B.Y.; Chen, S.; Wu, S.T. Liquid crystal display and organic light-emitting diode display: Present status and future perspectives. Light Sci. Appl. 2018, 7, 17168. [Google Scholar] [CrossRef] [PubMed]
  5. Woo, K.S.; Bong, S.H.; Choi, T.Y.; Kim, J.W. Mental health, smartphone use type, and screen time among adolescents in south korea. Psychol. Res. Behav. Manag. 2021, 14, 1419–1428. [Google Scholar] [CrossRef] [PubMed]
  6. Park, J.H.; Park, M. Smartphone use patterns and problematic smartphone use among preschool children. PLoS ONE 2021, 16, e0244276. [Google Scholar] [CrossRef]
  7. Kuss, D.J.; Kanjo, E.; Crook-Rumsey, M.; Kibowski, F.; Wang, G.Y.; Sumich, A. Problematic Mobile Phone Use and Addiction Across Generations: The Roles of Psychopathological Symptoms and Smartphone Use. J. Technol. Behav. Sci. 2018, 3, 141–149. [Google Scholar] [CrossRef]
  8. Mason, M.C.; Zamparo, G.; Marini, A.; Ameen, N. Glued to your phone? Generation Z’s smartphone addiction and online compulsive buying. Comput. Hum. Behav. 2022, 136, 107404. [Google Scholar] [CrossRef]
  9. Ting, C.H.; Chen, Y.Y. Smartphone addiction. In Adolescent Addiction (Second Edition): Epidemiology, Assessment, and Treatment; Academic Press: Cambridge, MA, USA, 2020; pp. 215–240. [Google Scholar] [CrossRef]
  10. Panova, T.; Carbonell, X. Is smartphone addiction really an addiction? J. Behav. Addict. 2018, 7, 252–259. [Google Scholar] [CrossRef]
  11. James, R.J.E.; Dixon, G.; Dragomir, M.G.; Thirlwell, E.; Hitcham, L. Understanding the construction of ‘behavior’ in smartphone addiction: A scoping review. Addict. Behav. 2023, 137, 107503. [Google Scholar] [CrossRef]
  12. Heo, J.Y.; Kim, K.; Fava, M.; Mischoulon, D.; Papakostas, G.I.; Kim, M.J.; Kim, D.J.; Chang, K.A.J.; Oh, Y.; Yu, B.H.; et al. Effects of smartphone use with and without blue light at night in healthy adults: A randomized, double-blind, cross-over, placebo-controlled comparison. J. Psychiatr. Res. 2017, 87, 61–70. [Google Scholar] [CrossRef]
  13. Ouyang, X.; Yang, J.; Hong, Z.; Wu, Y.; Xie, Y.; Wang, G. Mechanisms of blue light-induced eye hazard and protective measures: A review. Biomed. Pharmacother. 2020, 130, 110577. [Google Scholar] [CrossRef] [PubMed]
  14. Höhn, C.; Schmid, S.R.; Plamberger, C.P.; Bothe, K.; Angerer, M.; Gruber, G.; Pletzer, B.; Hoedlmoser, K. Preliminary Results: The Impact of Smartphone Use and Short-Wavelength Light during the Evening on Circadian Rhythm, Sleep and Alertness. Clocks Sleep 2021, 3, 66–86. [Google Scholar] [CrossRef]
  15. Hipólito, V.; Coelho, J.M.P. Blue Light and Eye Damage: A Review on the Impact of Digital Device Emissions. Photonics 2023, 10, 560. [Google Scholar] [CrossRef]
  16. Supronowicz, R.; Fan, J.; Listowski, M.; Watras, A.; Fryc, I. Application of different metrics for describing light color quality of a white LED. Photonics Lett. Pol. 2021, 13, 31–33. [Google Scholar] [CrossRef]
  17. Vu, T.; Nguyen, Q. Precision optical model of asymmetry emission band of red light emitting diodes and its application in improving the color rendering index of white LEDs. Results Opt. 2025, 21, 100825. [Google Scholar] [CrossRef]
  18. Schadt, M. Milestone in the history of field-effect liquid crystal displays and materials. Jpn. J. Appl. Phys. 2009, 48, 03B001. [Google Scholar] [CrossRef]
  19. Lee, Z.Y.; Pai, C.C. Operation analysis and performance assessment for TFT-LCD manufacturers using improved DEA. Expert Syst. Appl. 2011, 38, 4014–4024. [Google Scholar] [CrossRef]
  20. Schadt, M. Nematic liquid crystals and twisted-nematic LCDs. Liq. Cryst. 2015, 42, 646–652. [Google Scholar] [CrossRef]
  21. Cheng, W.C.; Pedram, M. Power minimization in a backlit TFT-LCD display by concurrent brightness and contrast scaling. IEEE Trans. Consum. Electron. 2004, 50, 25–32. [Google Scholar] [CrossRef]
  22. Alberts, I.L.; Barratt, D.S.; Ray, A.K. Hollow cathode effect in cold cathode fluorescent lamps: A review. IEEE/OSA J. Disp. Technol. 2010, 6, 52–59. [Google Scholar] [CrossRef]
  23. Li, J.; Yin, Y.; Meng, H. Research progress of color photoresists for TFT-LCD. Dyes Pigments 2024, 225, 112094. [Google Scholar] [CrossRef]
  24. Hong, H.; Shin, H.; Chung, I. In-plane switching technology for liquid crystal display television. IEEE/OSA J. Disp. Technol. 2007, 3, 361–370. [Google Scholar] [CrossRef]
  25. Wang, F.; Zhan, H.; Ji, L.; Yang, T.; Meng, Q.; Li, Y.; Li, B.; Zang, Y.; Chen, J.; Huang, Y.; et al. The elimination of stressed induced light leakage for in-plane-switching LCD. Sci. Rep. 2022, 12, 3340. [Google Scholar] [CrossRef] [PubMed]
  26. Choi, J.; Lee, W.; Namgoong, J.W.; Kim, T.M.; Kim, J.P. Synthesis and characterization of novel triazatetrabenzcorrole dyes for LCD color filter and black matrix. Dyes Pigments 2013, 99, 357–365. [Google Scholar] [CrossRef]
  27. Chwang, A.B.; Hack, M.; Brown, J.J. Flexible OLED display development: Strategy and status. J. Soc. Inf. Disp. 2005, 13, 481. [Google Scholar] [CrossRef]
  28. Qiu, J.; Jin, C.; Lin, Y.; Gao, Y.; Tsou, C. Effects of display screen type on perception and visual performance: Does AMOLED screen perform better than LCD screen? In Proceedings of the International Conference on Logistics Engineering, Management and Computer Science (LEMCS 2014), Shenyang, China, 29–31 July 2015; pp. 1087–1090. [Google Scholar] [CrossRef]
  29. Haila, T.A.; Kunst, K.; Khanh, T.Q.; Wallis, T.S.A. Recent consumer OLED monitors can be suitable for vision science. J. Vis. 2025, 25, 11. [Google Scholar] [CrossRef]
  30. Khazanchi, A.; Kanwar, A.; Saluja, L.; Damra, A.; Damara, V. OLED: A New Display Technology. Int. J. Eng. Comput. Sci. 2012, 1, 75–84. [Google Scholar]
  31. Chen, L.; Gu, H.; Jiao, S.; Liu, S. Optical modeling and analysis of pixel organic light-emitting diode using a mixed-level algorithm considering light leakage effects. Thin Solid Films 2023, 769, 139741. [Google Scholar] [CrossRef]
  32. Giannini, S.; Di Virgilio, L.; Bardini, M.; Hausch, J.; Geuchies, J.J.; Zheng, W.; Volpi, M.; Elsner, J.; Broch, K.; Geerts, Y.H.; et al. Transiently delocalized states enhance hole mobility in organic molecular semiconductors. Nat. Mater. 2023, 22, 1361–1369. [Google Scholar] [CrossRef]
  33. Fernández, M.R.; Casanova, E.Z.; Alonso, I.G. Review of display technologies focusing on power consumption. Sustainability 2015, 7, 10854–10875. [Google Scholar] [CrossRef]
  34. Wu, T.; Sher, C.W.; Lin, Y.; Lee, C.F.; Liang, S.; Lu, Y.; Chen, S.W.H.; Guo, W.; Kuo, H.C.; Chen, Z. Mini-LED and Micro-LED: Promising candidates for the next generation display technology. Appl. Sci. 2018, 8, 1557. [Google Scholar] [CrossRef]
  35. Hsiang, E.L.; Yang, Z.; Yang, Q.; Lan, Y.F.; Wu, S.T. Prospects and challenges of mini-LED, OLED, and micro-LED displays. J. Soc. Inf. Disp. 2021, 29, 446–465. [Google Scholar] [CrossRef]
  36. Rjoub, A.; Tarawneh, B.; Alghsoon, R. Active matrix organic light emitting diode displays (AMOLED) new pixel design. Microelectron. Eng. 2019, 212, 42–52. [Google Scholar] [CrossRef]
  37. Luo, Z.; Wu, S.-T. OLED versus LCD: Who wins? Opt. Photonics News 2015, 2015, 19–21. [Google Scholar]
  38. Bagher, A.M. Comparison of LED and OLED. Sch. J. Eng. Technol. 2016, 4, 206–210. [Google Scholar]
  39. Chen, Z.; Li, H.; Yuan, C.; Gao, P.; Su, Q.; Chen, S. Color Revolution: Prospects and Challenges of Quantum-Dot Light-Emitting Diode Display Technologies. Small Methods 2024, 8, e2300359. [Google Scholar] [CrossRef]
  40. Smith, E.; Heckaman, R.L.; Lang, K.; Penczek, J.; Bergquist, J. Measuring the color capability of modern display systems. J. Soc. Inf. Disp. 2020, 28, 548–556. [Google Scholar] [CrossRef]
  41. Miller, N.J.; Leon, F.A.; Tan, J.; Irvin, L. Flicker: A review of temporal light modulation stimulus, responses, and measures. Light. Res. Technol. 2022, 55, 5–35. [Google Scholar] [CrossRef]
  42. Skarżyński, K.; Żagan, W.; Krajewski, K. LED luminaires: Many Chips—Many Photometric and Lighting ng Simulation Issues to Solve Simulation Issues to Solve. Energies 2021, 14, 4646. [Google Scholar] [CrossRef]
  43. Słomiński, S. Typical Causes of Errors during Measuring Luminance Distributions in Relation to Glare Calculations. In Proceedings of the 2018 VII. Lighting Conference of the Visegrad Countries (Lumen V4), Trebic, Czech Republic, 18–20 September 2018; pp. 1–5. [Google Scholar] [CrossRef]
  44. Wong, N.A.; Bahmani, H. A review of the current state of research on artificial blue light safety as it applies to digital devices. Heliyon 2022, 8, e10282. [Google Scholar] [CrossRef]
  45. Hipólito, V.; Coelho, J.M.P. Blue Light of the Digital Era: A Comparative Study of Devices. Photonics 2024, 11, 93. [Google Scholar] [CrossRef]
  46. de Toledo, L.H.S.; Moraes, M.N.; de Oliveira Poletini, M.; Neto, J.C.; Baron, J.; Mota, T. Modeling the influence of nighttime light on melatonin suppression in humans: Milestones and perspectives. J. Photochem. Photobiol. 2023, 16, 100199. [Google Scholar] [CrossRef]
  47. Wiśniewski, A. Tętnienie światła wytwarzanego przez lampy LED—Zamienniki żarówek tradycyjnych i halogenowych. Prz. Elektrotechniczny 2017, 93, 63–66. [Google Scholar] [CrossRef]
  48. Chiu, H.P.; Liu, C.H. The effects of three blue light filter conditions for smartphones on visual fatigue and visual performance. Hum. Factors Ergon. Manuf. 2020, 30, 83–90. [Google Scholar] [CrossRef]
  49. Senyer, N.; Durmus, D. An AI-driven framework for perceived display spectra: The effects of dimming, observer age, and viewing distance. Displays 2025, 88, 103024. [Google Scholar] [CrossRef]
  50. Banerjee, S.; Singh, P.; Purkayastha, P.; Kumar Ghosh, S. Evolution of Organic Light Emitting Diode (OLED) Materials and their Impact on Display Technology. Chem.—Asian J. 2024, 20, e202401291. [Google Scholar] [CrossRef]
  51. Moyano, D.B.; Sola, Y.; González-Lezcano, R.A. Blue-Light levels emitted from portable electronic devices compared to sunlight. Energies 2020, 13, 4276. [Google Scholar] [CrossRef]
  52. Tähkämö, L.; Partonen, T.; Pesonen, A.K. Systematic review of light exposure impact on human circadian rhythm. Chronobiol. Int. 2019, 36, 151–170. [Google Scholar] [CrossRef]
  53. Silvani, M.I.; Werder, R.; Perret, C. The influence of blue light on sleep, performance and wellbeing in young adults: A systematic review. Front. Physiol. 2022, 13, 943108. [Google Scholar] [CrossRef] [PubMed]
  54. Sun, C.C.; Chang, Y.Y.; Yang, T.H.; Chung, T.Y.; Chen, C.C.; Lee, T.X.; Li, D.R.; Lu, C.Y.; Ting, Z.Y.; Glorieux, B.; et al. Packaging efficiency in phosphor-converted white LEDs and its impact to the limit of luminous efficacy. Drug Saf. 2014, 1, 19. [Google Scholar] [CrossRef]
  55. Zhao, N.; Li, Z.; Qin, L.; Cui, Z.; Sun, Z.; Cheng, Z.; Jiang, C.; Wang, S.; Zhao, T.; Liao, Y.; et al. Lifetime measurement and aging mechanism analysis of OLED subpixels. Displays 2022, 75, 102326. [Google Scholar] [CrossRef]
  56. Chen, D.; Chen, Y.-C.; Zeng, G.; Zhang, D.W.; Lu, H.-L. Integration Technology of Micro-LED for Next-Generation Display. Research 2023, 6, 47. [Google Scholar] [CrossRef] [PubMed]
Figure 1. Basic display technologies: (a) LCD and (b) OLED.
Applsci 15 06119 g001
Figure 2. The schematic illustration of the measurement setup.
Applsci 15 06119 g002
Figure 3. The fillings of the sRGB standard color gamut (red line) by the color gamut of the particular sample (blue line).
Applsci 15 06119 g003
Figure 4. The linearity response of particular channels for selected smartphone samples: green, red, and blue lines represent, respectively, R, G, and B channels.
Applsci 15 06119 g004
Figure 5. The spectral power distributions for different variants: black continuous line—without internal filter, white line—with internal filter, and black dashed line—with dedicated app.
Applsci 15 06119 g005
Figure 6. The spatial distribution of selected smartphone samples: (a) C0-C180, (b) C90-C270, and (c) comparison between the biggest and the smallest half-peak divergence.
Applsci 15 06119 g006
Figure 7. The exemplary luminance distribution measurements outcome, including mean luminance and uniformity (values in cd/m2).
Applsci 15 06119 g007
Figure 8. The example of static contrast measurement outcome: (a) left-side test and (b) right-side test (values in cd/m2).
Applsci 15 06119 g008
Table 1. The specification of selected smartphone samples.
SampleRelease DateModelDisplay TypeSizeRatioLength (px)Width (px)PPIFrequency (Hz)Color Depth
1April 2024Samsung
Galaxy M15
Super
AMOLED
6.5″19.5:9234010803969024 bit
2March 2023Samsung
Galaxy A34
Super
AMOLED
6.6″19.5:92340108039012024 bit
3October 2020Samsung
Galaxy S20 FE
Super
AMOLED
6.5″20:92400108040712024 bit
4December 2019Samsung
Galaxy A71
Super
AMOLED+
6.7″20:9240010803936024 bit
5April 2019Samsung
Galaxy A40
Super
AMOLED
5.9″19.5:9234010804376024 bit
6April 2017LG G6IPS LCD5.7″18:9288014405646024 bit
7March 2017Samsung
Galaxy S8
Super
AMOLED
5.8″18.5:9296014405706024 bit
8December 2014Samsung Galaxy A5Super
AMOLED
5.0″16:91280720294No data24 bit
9February 2014Samsung
Galaxy Grand Neo
TFT LCD5.0″15:9800480186No data24 bit
Table 2. The results of color gamut measurements.
SampleRedGreenBluesRGB
Filling
(%)
Shift
xyxyxy
10.66660.33330.25300.70460.14140.0433140.5G
20.68160.31840.25610.70330.13650.0458145.4R, G
30.66670.33310.24300.71790.14200.0423145.1R, G
40.68770.31190.24780.70930.14040.0505148.4R, G
50.66460.33490.23510.71450.14200.0423144.6R, G
60.66190.31370.26820.64380.15000.0575120.4R, G
70.68360.31610.23260.71700.14150.0485150.8R, G
80.66910.33070.24030.71500.14120.0448145.2R, G
90.59220.33780.33210.57460.15100.107773.3R, B
Table 3. Summary of the CCT results.
SampleCCT (K)
Without Internal FilterWith Internal FilterWith Dedicated App
1710856164141
2720361944493
3684646044084
4676253903937
5680256733808
6776249535151
7681142023381
86850-3811
97841-4903
Table 4. Summary of the refresh rate (frequency) and flickering results.
SampleFlicker Percent (%)Frequency (Hz)
Energy
Saving Mode
Normal
Mode
Energy
Saving Mode
Normal
Mode
14.3%3.3%60.090.0
222.3%21.2%60.0120.0
36.3%5.1%60.3119.8
44.5%4.4%60.160.1
53.5%3.0%60.160.1
63.0%2.7%60.660.7
72.7%2.9%60.060.0
84.4%2.9%60.060.0
94.3%2.1%60.060.0
Table 5. Summary of half peak divergences (HPD) for light distribution from sample displays.
SampleHalf Peak Divergence (°)
C0C90Mean
1787577
2737574
3737373
4737373
5707472
6727071
7666968
8485451
9534750
Table 6. The results of mean luminance and uniformity measurements.
SampleRedGreenBlueWhite
U o   ( ) L m   ( c d m 2 ) U o   ( ) L m   ( c d m 2 ) U o   ( ) L m   ( c d m 2 ) U o   ( ) L m   ( c d m 2 )
10.85122.60.91298.70.8723.20.90352.6
20.84122.30.83405.70.8431.90.84414.1
30.85139.20.84354.50.8222.40.90353.3
40.90121.50.88358.00.8329.40.92356.0
50.87139.60.86337.10.8522.50.82352.1
60.8068.30.78274.10.8024.10.80437.0
70.73130.50.78347.60.7527.70.80325.1
80.83109.00.84284.10.8119.40.84292.9
90.7370.90.74267.70.7456.20.75396.2
Table 7. The results of contrast measurements.
SampleLeft Side TestRight Side Test L w m   ( c d m 2 ) L b m   ( c d m 2 ) Static Contrast
L w   ( c d m 2 ) L b   ( c d m 2 ) L w   ( c d m 2 ) L b   ( c d m 2 )
1413.60.813431.00.874422.30.844500:1
2517.51.065538.11.206527.81.136465:1
3460.90.890486.10.920473.50.905523:1
4448.90.820488.00.955468.50.887528:1
5431.30.851480.00.961455.70.906503:1
6367.71.081377.11.041372.41.061351:1
7425.30.888462.70.888444.00.888500:1
8381.00.815361.60.755371.30.785473:1
9393.41.272406.91.286400.21.279313:1
Disclaimer/Publisher’s Note: The statements, opinions and data contained in all publications are solely those of the individual author(s) and contributor(s) and not of MDPI and/or the editor(s). MDPI and/or the editor(s) disclaim responsibility for any injury to people or property resulting from any ideas, methods, instructions or products referred to in the content.

