Abstract
Smoking food products is one of the methods of preserving them and giving them unique qualities. The proper selection of process parameters significantly affects the sensory attributes of the products, as well as their health benefits. An experimental station was built and verified to optimize the process parameters to monitor the smoking process. The purpose of the publication is to present an experimental station that will be used for optimization studies of the parameters of the processing of food products by smoking. The condition parameters, i.e., temperature and smoke level, were monitored. The products (pork loin, feta cheese, Camembert, Italian-type cheese, and curd) after smoking were analyzed from a qualitative point of view. The weight loss, change in the product’s moisture content, and color change were measured. The measurements proved the stability of the process parameters for the 12 samples of meat and cheese of regular size and that a uniform amount of smoke penetrated them at comparable temperatures. A comparison was also made between changes in the basic physical parameters of the meat and cheese during smoking. The change in the physical parameters of the pork loin was used as a reference point for changes in these parameters in other products.
1. Introduction
Smoking is one of the methods for the thermal processing of food that is widespread among manufacturers, especially those producing regional products. The smoking process has been extensively described in a published literature review [1]. The main purpose of the process is to impart unique sensory characteristics to food products, namely aroma, color, and texture, and to enhance the product by extending its shelf life. During this process, due to the action of smoke created by the pyrolysis of wood chips, water is displaced from the structures, and the smoke aroma is saturated, resulting in and intensifying the flavor and texture of the product. It is a multi-step process involving both adsorption on the surface and the penetration of chemicals in the smoke into the interior of the food product [2,3]. On the surface, there is an initial interaction between the smoke chemicals and the surface components of the product, such as proteins or fats, resulting in the formation of a characteristic crust. Subsequently, smoke molecules, including polycyclic aromatic hydrocarbons, phenolic compounds, aldehydes, and ketones, penetrate the product’s structure, shaping the flavor characteristics [4,5]. Smoking efficiency is mainly affected by temperature, humidity, product texture, and exposure time to physical agents. A raised temperature results in shearing the product’s outer layers, which leads to the closure of pores and prevents the smoke from penetrating deep into the product. A high level of ambient humidity causes changes in smoke absorption efficiency due to the impaired diffusion of water molecules. The porous texture of the product contributes to the even distribution of flavor and aroma throughout the product [6,7].
Cold smoking and hot smoking are the two basic types of smoking. Cold smoking is carried out at lower temperatures, often below 30 °C, making the process take longer, but the product retains a milder flavor. On the other hand, hot smoking is carried out at higher temperatures, usually above 60 °C, shortening the processing time but resulting in a more intense flavor [8]. The advantage of cold smoking is that it reduces the amount of harmful substances produced, resulting in less absorption from the smoke. The reason for this is the lower combustion temperature of the smoking raw material and the condensation of the smoke on the path between the smoke generator and the smoke chamber. Both variants of smoking give products different organoleptic qualities and have a unique effect on their physical and chemical parameters, which makes it possible to create products with unique characteristics. Another method is to cool the smoke, which helps retain heavy compounds in the smoke, which precipitate out of it before reaching the products [9].
The smoking effect is also influenced by the choice of smoking raw material [10]. The quality of the smoke produced is determined by the tree species, the moisture content, and the absence of chemical and microbiological contamination in the wood [11]. Hardwoods from deciduous trees, especially fruit trees, are recommended for the smoking process, as they have the proper density and, above all, a low content of resinous substances, responsible for the products’ bitter aftertaste and unpleasant smell. Different taste and odor characteristics can be obtained using the appropriate wood species; e.g., using apple or cherry wood will result in a slightly fruity aftertaste and dark brown color, and using ash gives the products a sharp taste and golden color. Coniferous wood is not recommended, as its combustion generates large amounts of soot deposited inside the smokehouse [12,13].
The smoking process results in the accumulation of many chemicals, including undesirable ones [14]. The removal of aromatic hydrocarbons (PAHs) from smoke is not possible. Moreover, their presence affects the quality of smoked products [15]. The level of absorption of these compounds is influenced by the quality and type of raw material and process parameters, as well as a significantly prolonged exposure time to raw materials close to the smoke source [16,17]. Optimizing the smoking process by controlling the process conditions effectively reduces a product’s PAHs without negatively affecting its taste or visual qualities [18,19].
Therefore, research was undertaken using proprietary process control and monitoring solutions to optimize the smoking process parameters. In addition, a smoke cooler in the form of a 2.2 m pipe feeding the chamber was used to condense tar compounds and cool the smoke to ambient temperature. For the purposes of this publication, an experimental stand and a computerized measurement system were designed. The publication presents the results of research on changes in the physical parameters of pork loin subjected to low-temperature smoking and four types of cheese (feta cheese, Camembert, Italian-type cheese, and curd). Pork loin is one of the most popular smoked products available on the smoked products market. For this reason, the changes in physical parameters in the loin presented in the publication are a reference point for changes in these parameters in other products subject to smoking.
2. Materials and Methods
2.1. Design of the Measuring Stand
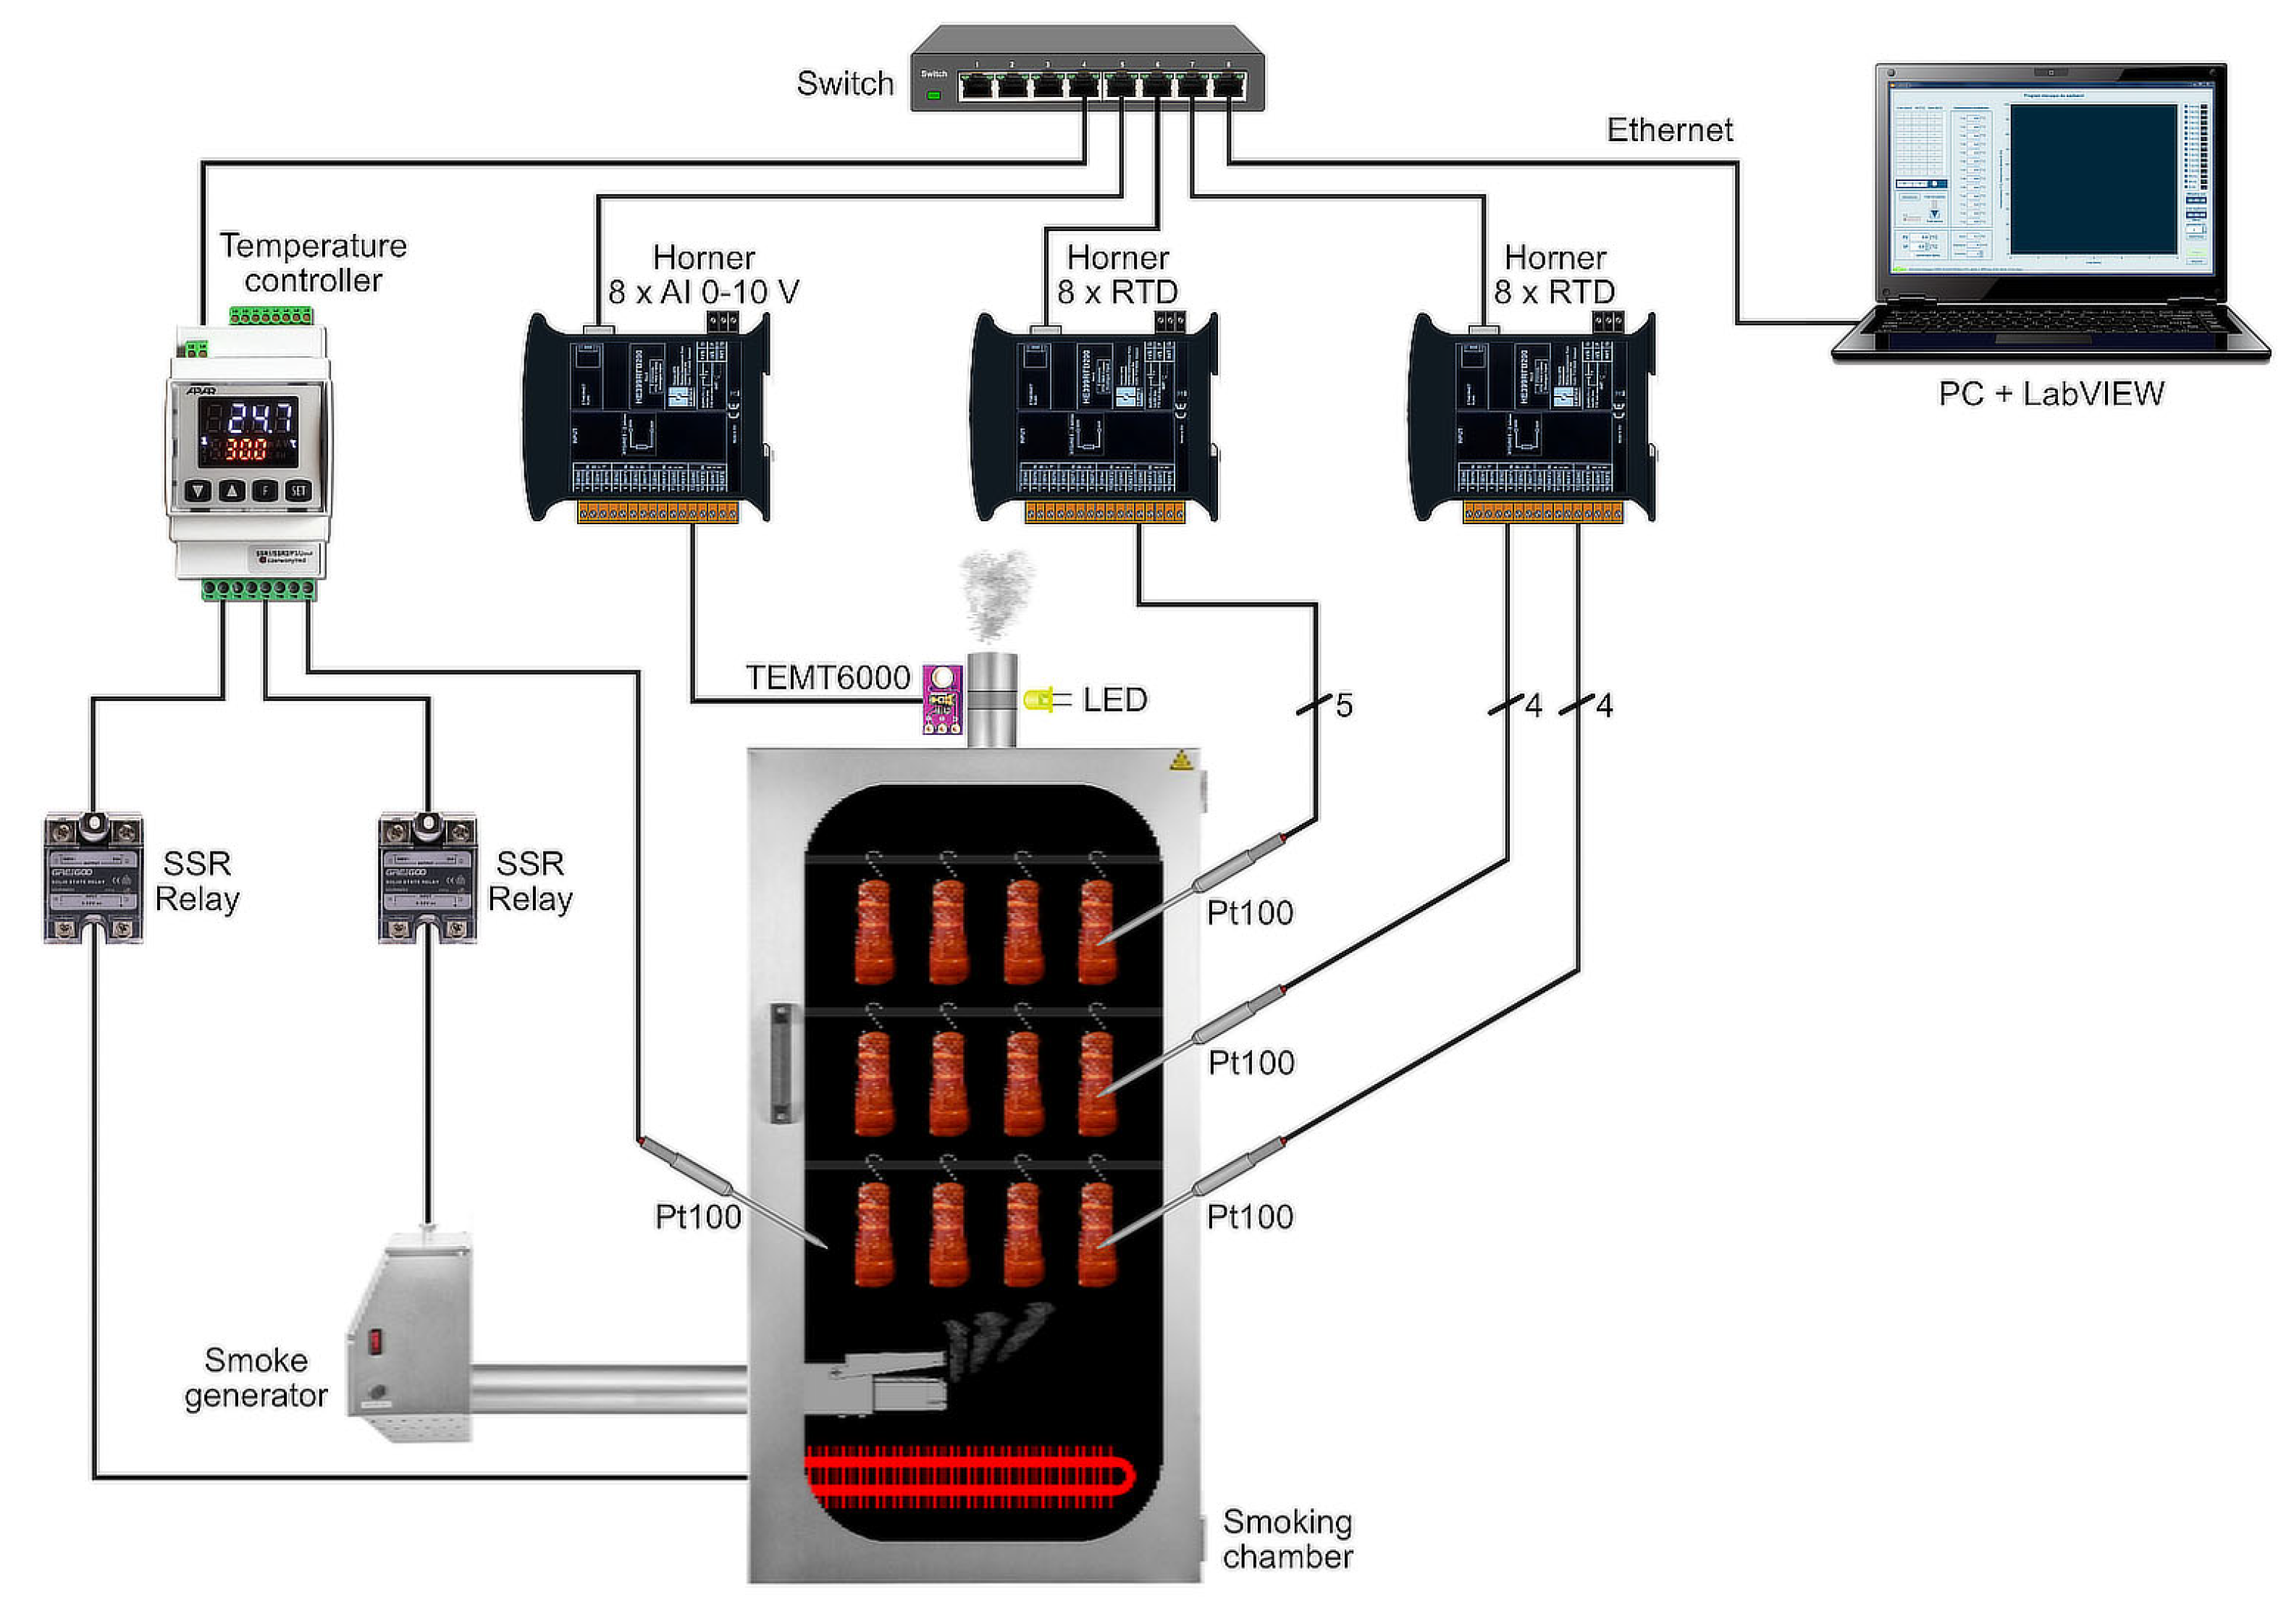
A widely available BBDS-150 Simple V1.3 smoking chamber from Borniak (Borne Sulinowo, Poland) was used for the experiments (Figure 1). It is made of food-grade stainless steel with a capacity of 150 L, allowing it to suspend up to 20 kg of smoked food on seven levels. The smokehouse is equipped with a 2015 W electric heater and can be operated up to 150 °C. A 115 W electric smoke generator, GDS-01 (Borne Sulinowo, Poland), is responsible for producing smoke. Smoke chips are transported from the tray to the heating element, where the glowing of the chips without fire is achieved due to being at the appropriate temperature.
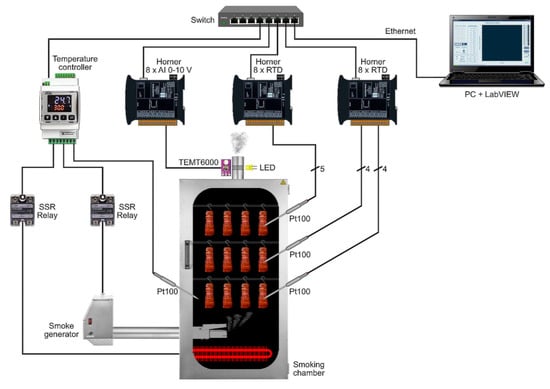
Figure 1.
Diagram of the computer control system for the operation of the smoke chamber.
The ability to control the course of food-smoking experiments was achieved by connecting the smoke chamber components to a computer-aided measurement and control system with dedicated software (Figure 1).
The PC, measurement, and control devices were communicated using Ethernet and the Modbus TCP/IP communication protocol. Instead of the original temperature controller attached to the smokehouse, APAR’s AR662.B controller for temperature and other physical quantities with three SSR two-state control outputs was used in the computer system. The functioning of the temperature control algorithm was based on the original Pt100 temperature sensor installed in the smokehouse as standard. The controller’s outputs are connected to Greegoo’s GDH4066ZD3 (Greegoo, Yidu, China) single-phase zero-switched solid-state relays. The relays allow for the control of the operation of actuators supplied with 66 to 660 V AC and consuming up to 40 A of current using a control voltage in the range of 3 to 32 V DC. Connected to one of the relays is an electric heater located inside the smoking chamber, responsible for maintaining the temperature at the set level. The second two-state output of the AR662.B controller was used to control the operation of the smoke generator.
The control measurement system can monitor the temperature inside smoked food products. Thirteen TOPS1 Pt100 Class B temperature sensors from Kompart-Pomiar (Kraków, Poland), made of 1.4541 stainless steel as a dipstick with a spike, have been used for this purpose. Twelve sensors are provided for puncturing smoked products. A thirteenth sensor is used to measure the temperature inside the smoking chamber. Two SmartMod+ HE399RTD200 analog input modules from Horner (Cork, Ireland) were used to process the signals from the Pt100 sensors. Each module contains eight isolated input channels, each allowing for temperature measurement using resistive temperature sensors (including Pt100) from −200 °C to 850 °C with a resolution of 0.1 °C.
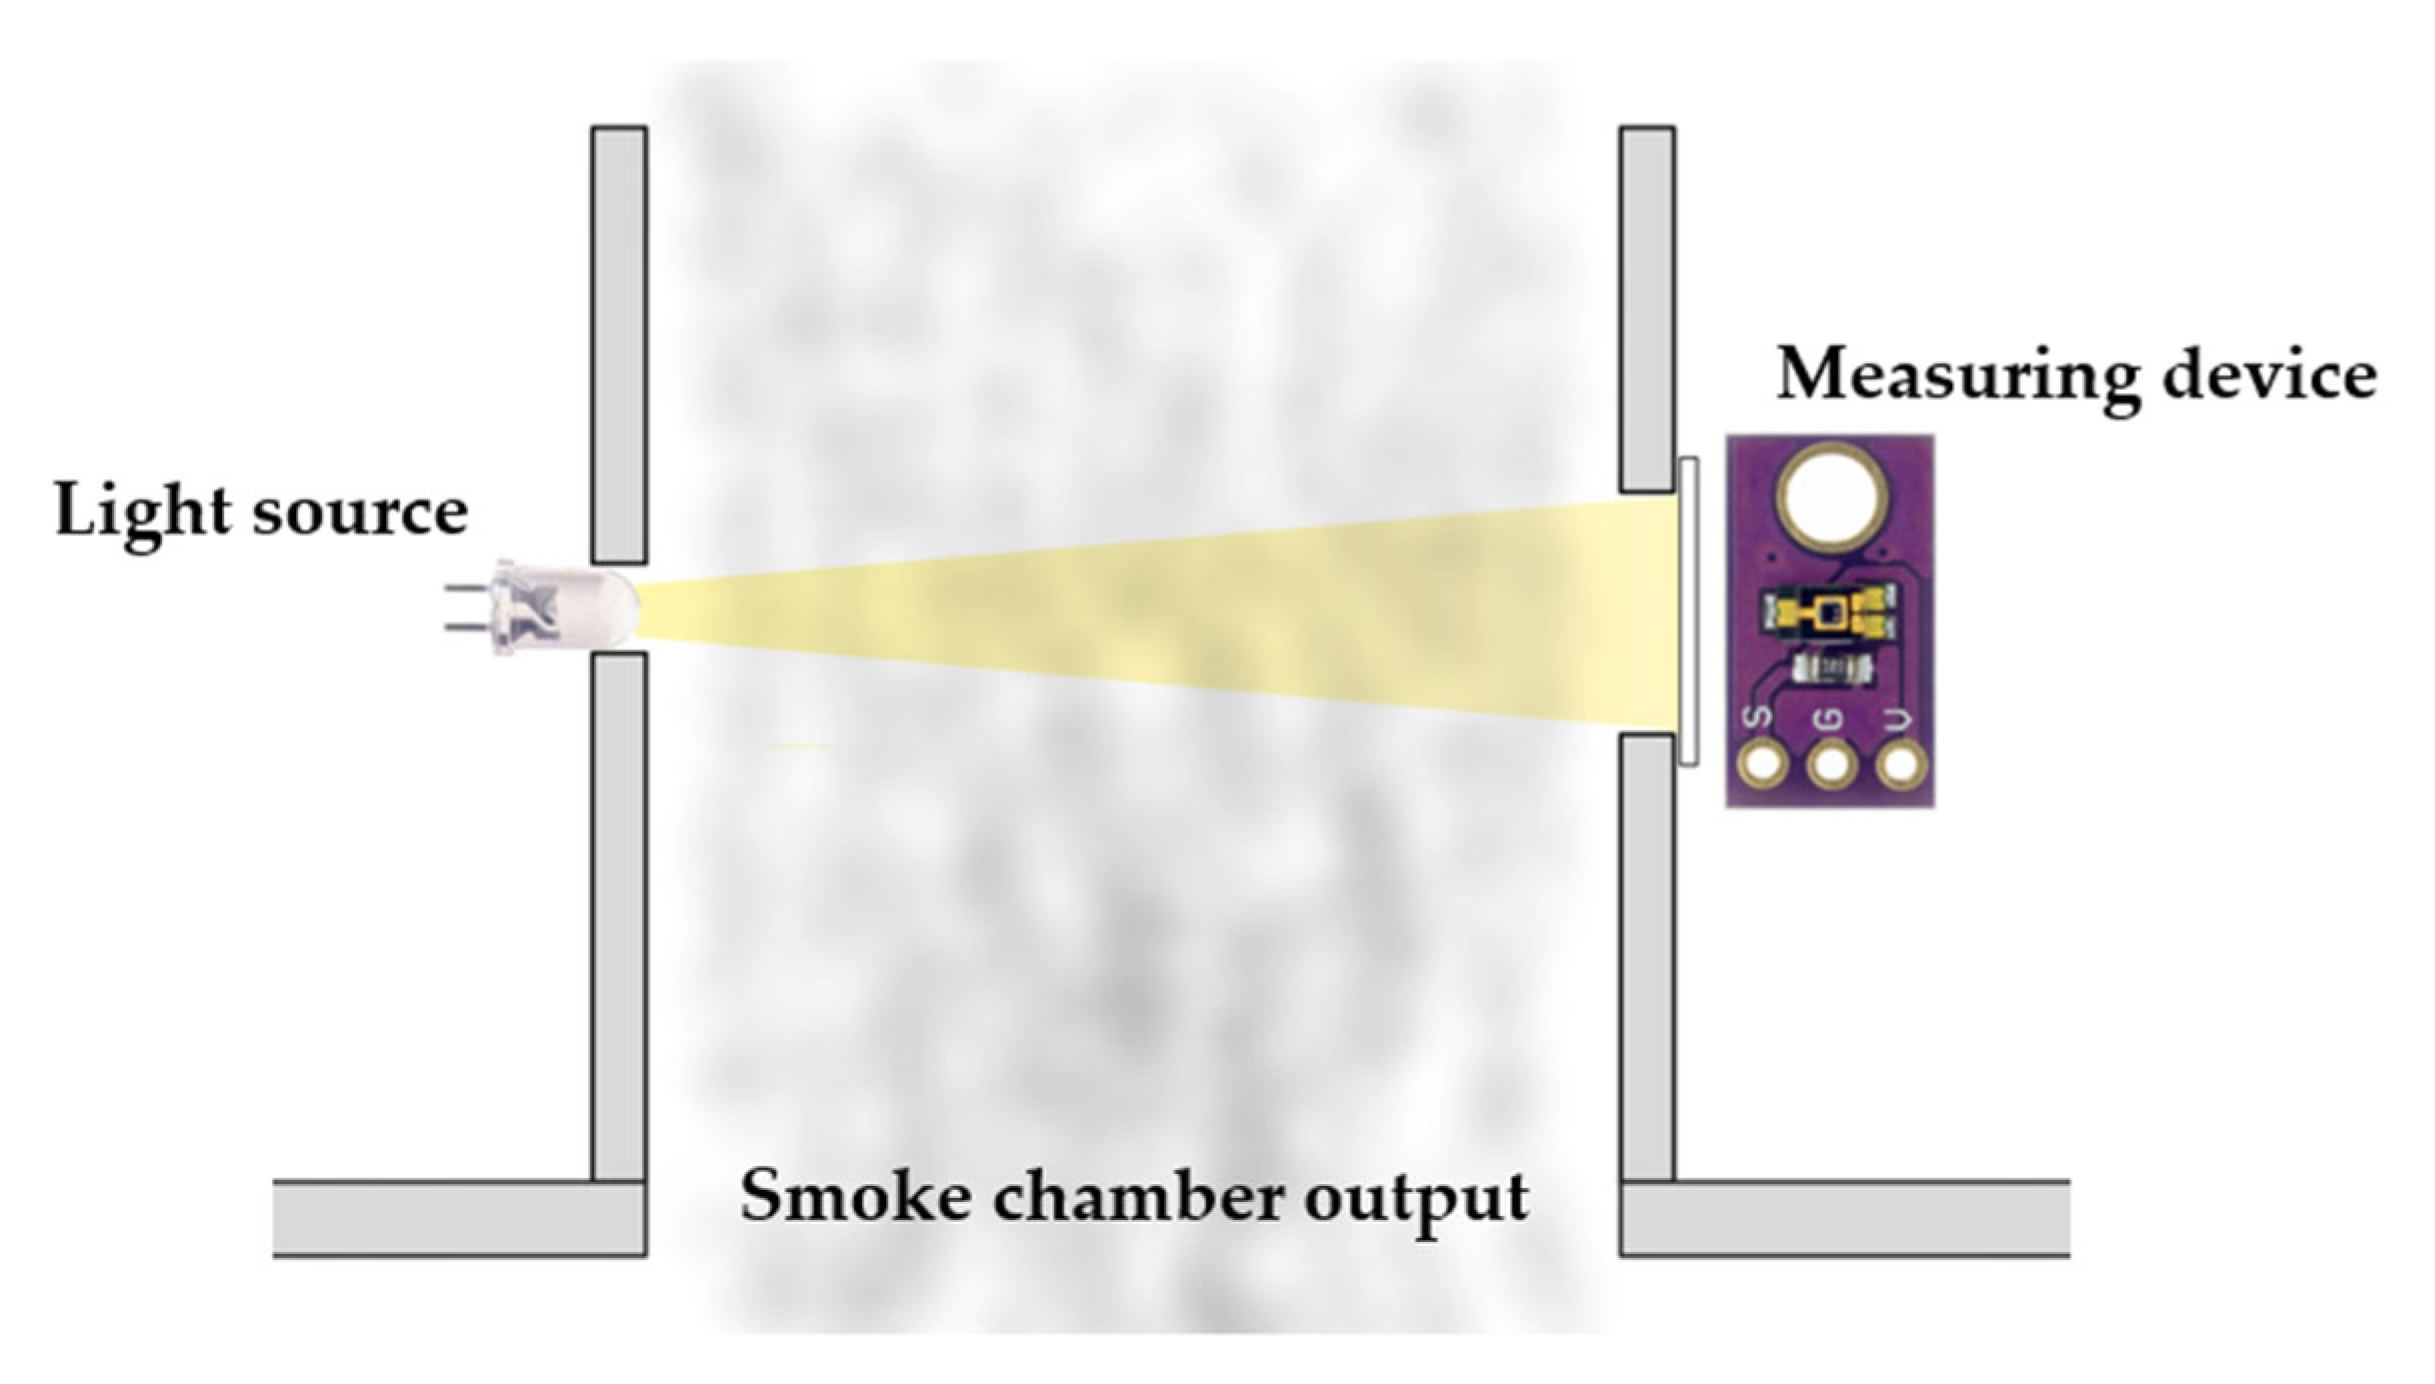
A prototype circuit was developed for the experiments to measure the relative presence of smoke at the smoke chamber outlet. The system was built with a white LED and a TEMT6000 analog light intensity sensor (Figure 2).
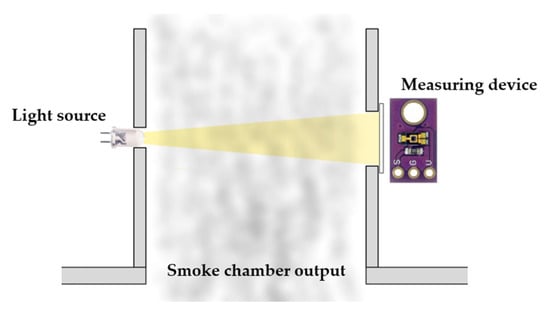
Figure 2.
Schematic of the system for measuring the presence of smoke at the smoke chamber outlet.
The TEMT6000 sensor (Vishay Semiconductors, Malvern, PA, USA) has 5 V of DC power, which allows for the conversion of the intensity of the incident light (wavelength λ0.5 = 440 nm to 800 nm) in the range of 1–1000 lux into a proportional output voltage value. The higher the intensity of the incident light, the higher the voltage value at the sensor output. The LED and TEMT6000 sensors were installed at the smoke outlet of the smoke chamber in such a way that external light would not affect the measurement results. To avoid the problems associated with the deposition of dirt and condensation during smoking and its effect on the measurement results, a slide was installed between the wall of the smoke outlet pipe and the TEMT6000 sensor. The mounting method allows the slides to be changed before each experiment or even during smoking. One of the eight isolated voltage analog inputs of Horner’s SmartMod+ HE399ADC207 module (Horner, Indianapolis, Indiana) was used to measure the voltage at the output of the light intensity sensor. This module has a 16-bit resolution analog-to-digital converter and allows for voltage measurement in the range of −10 V to +10 V with a resolution of 1 mV.
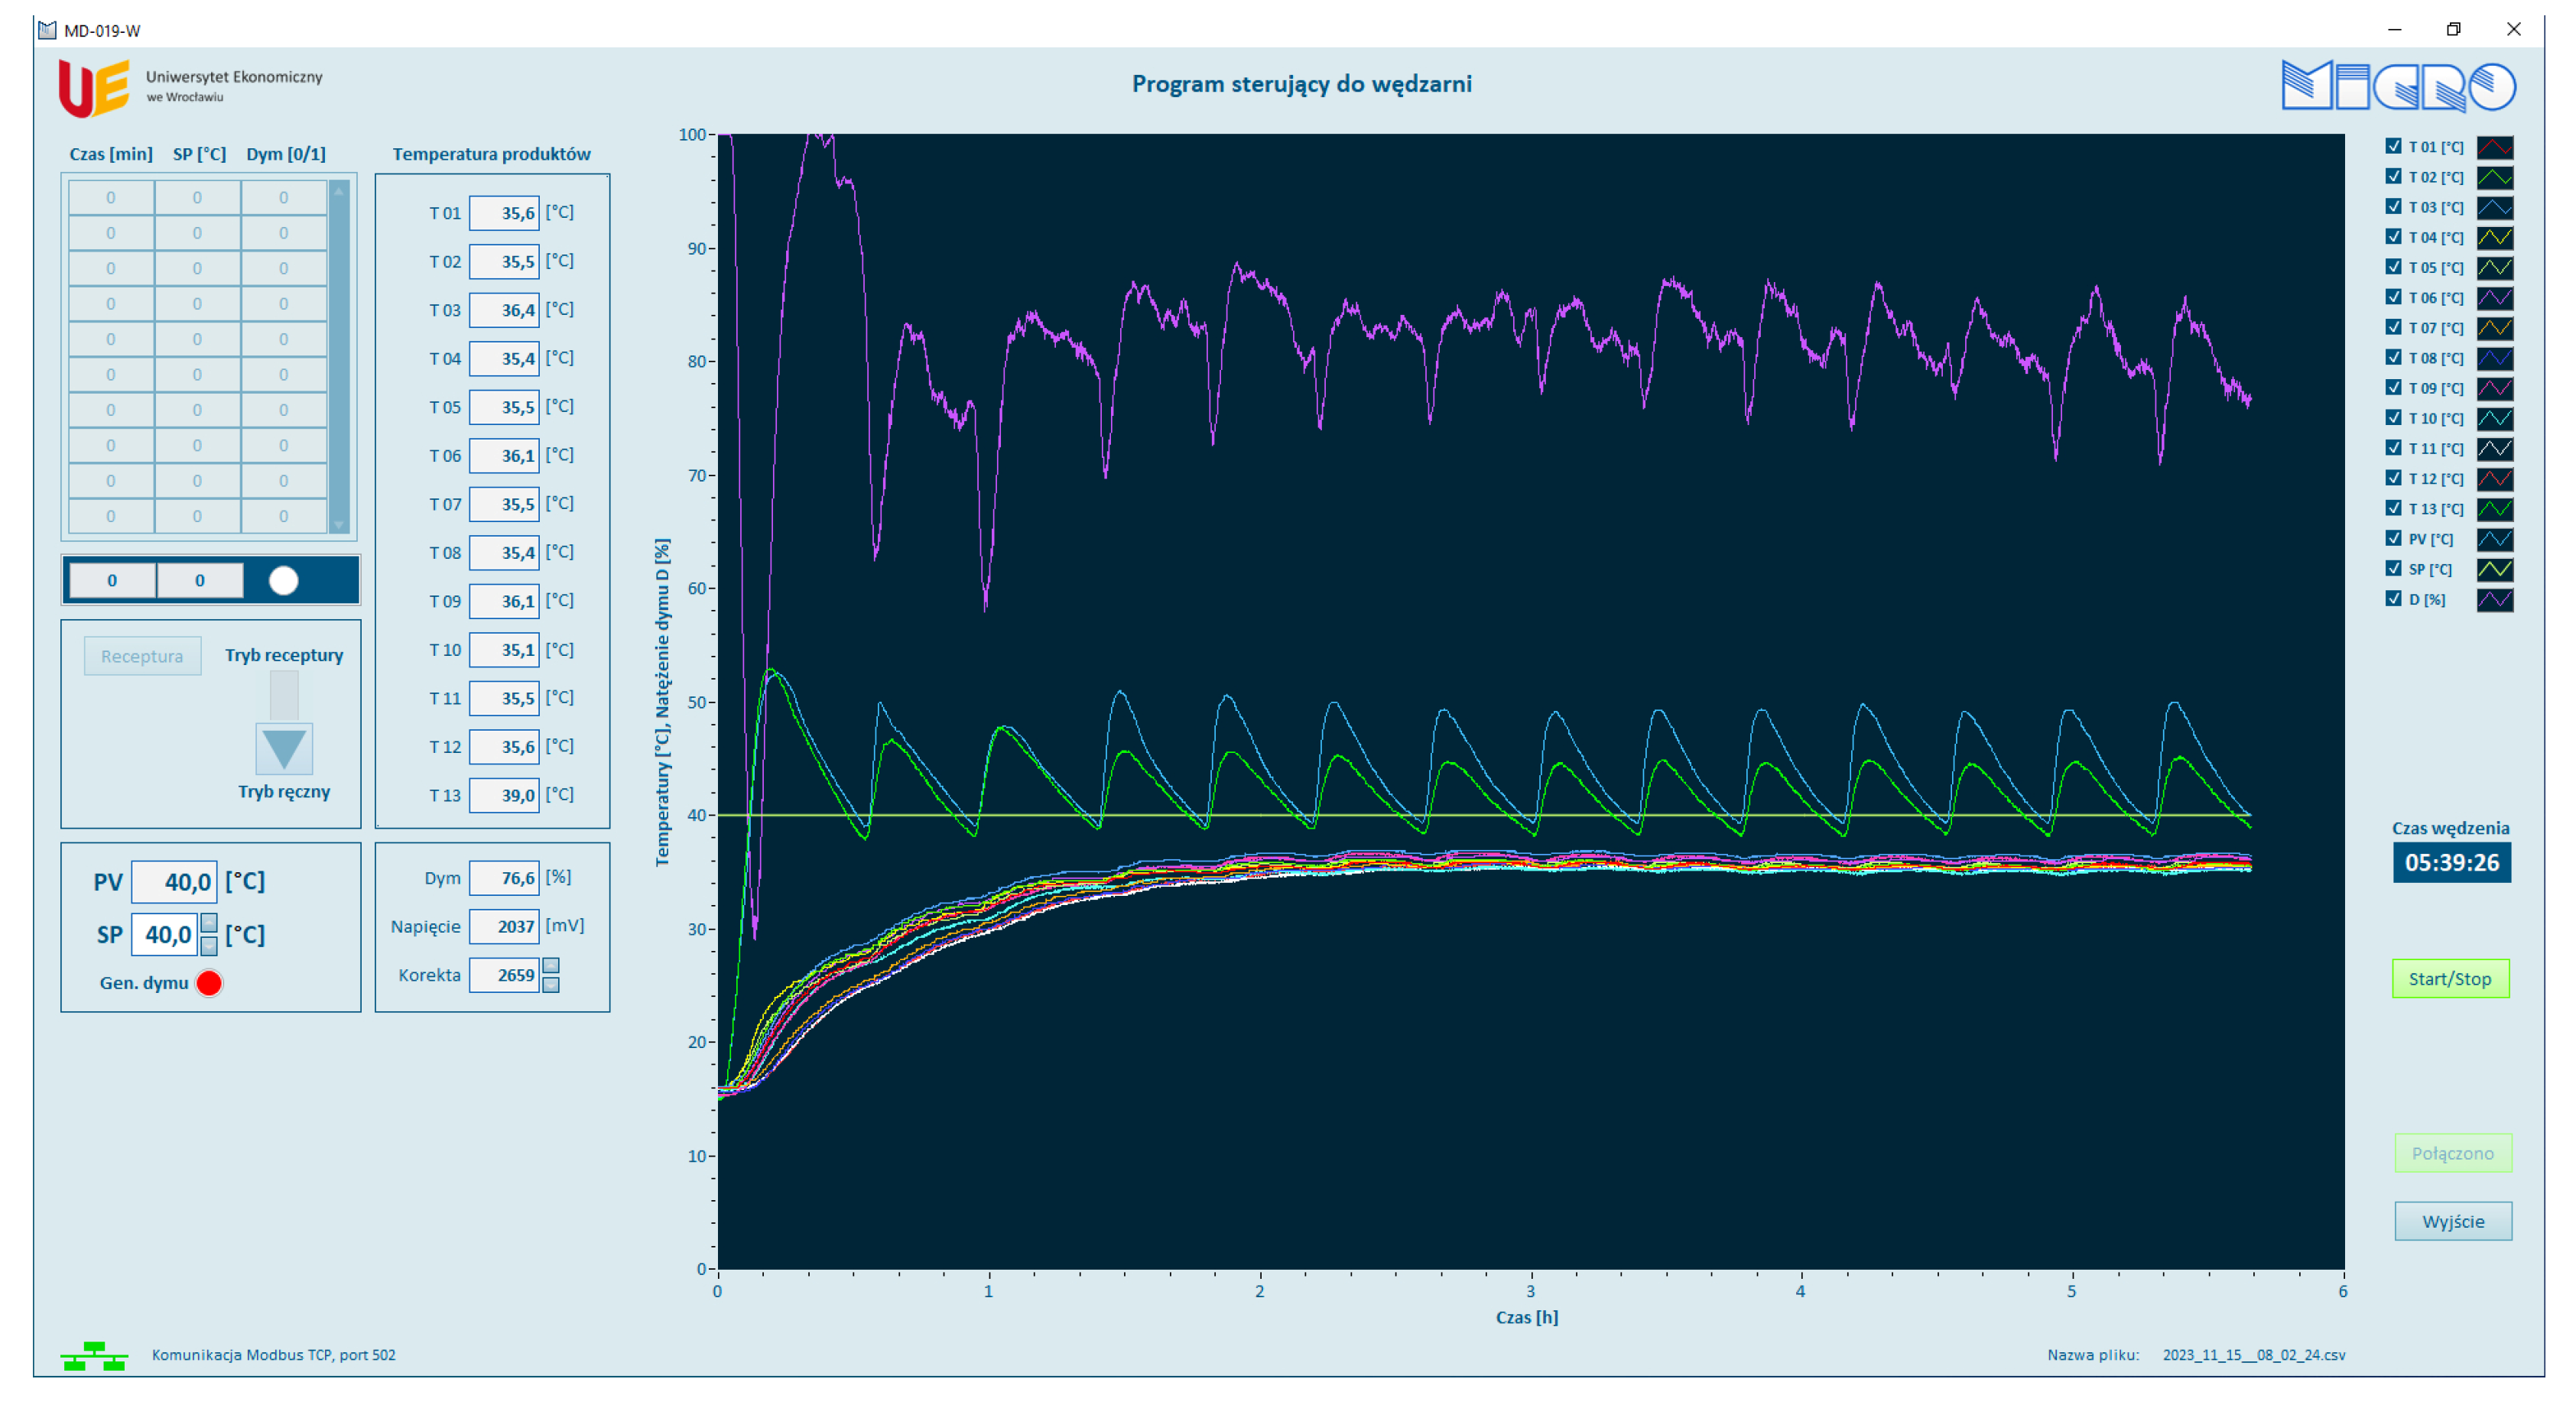
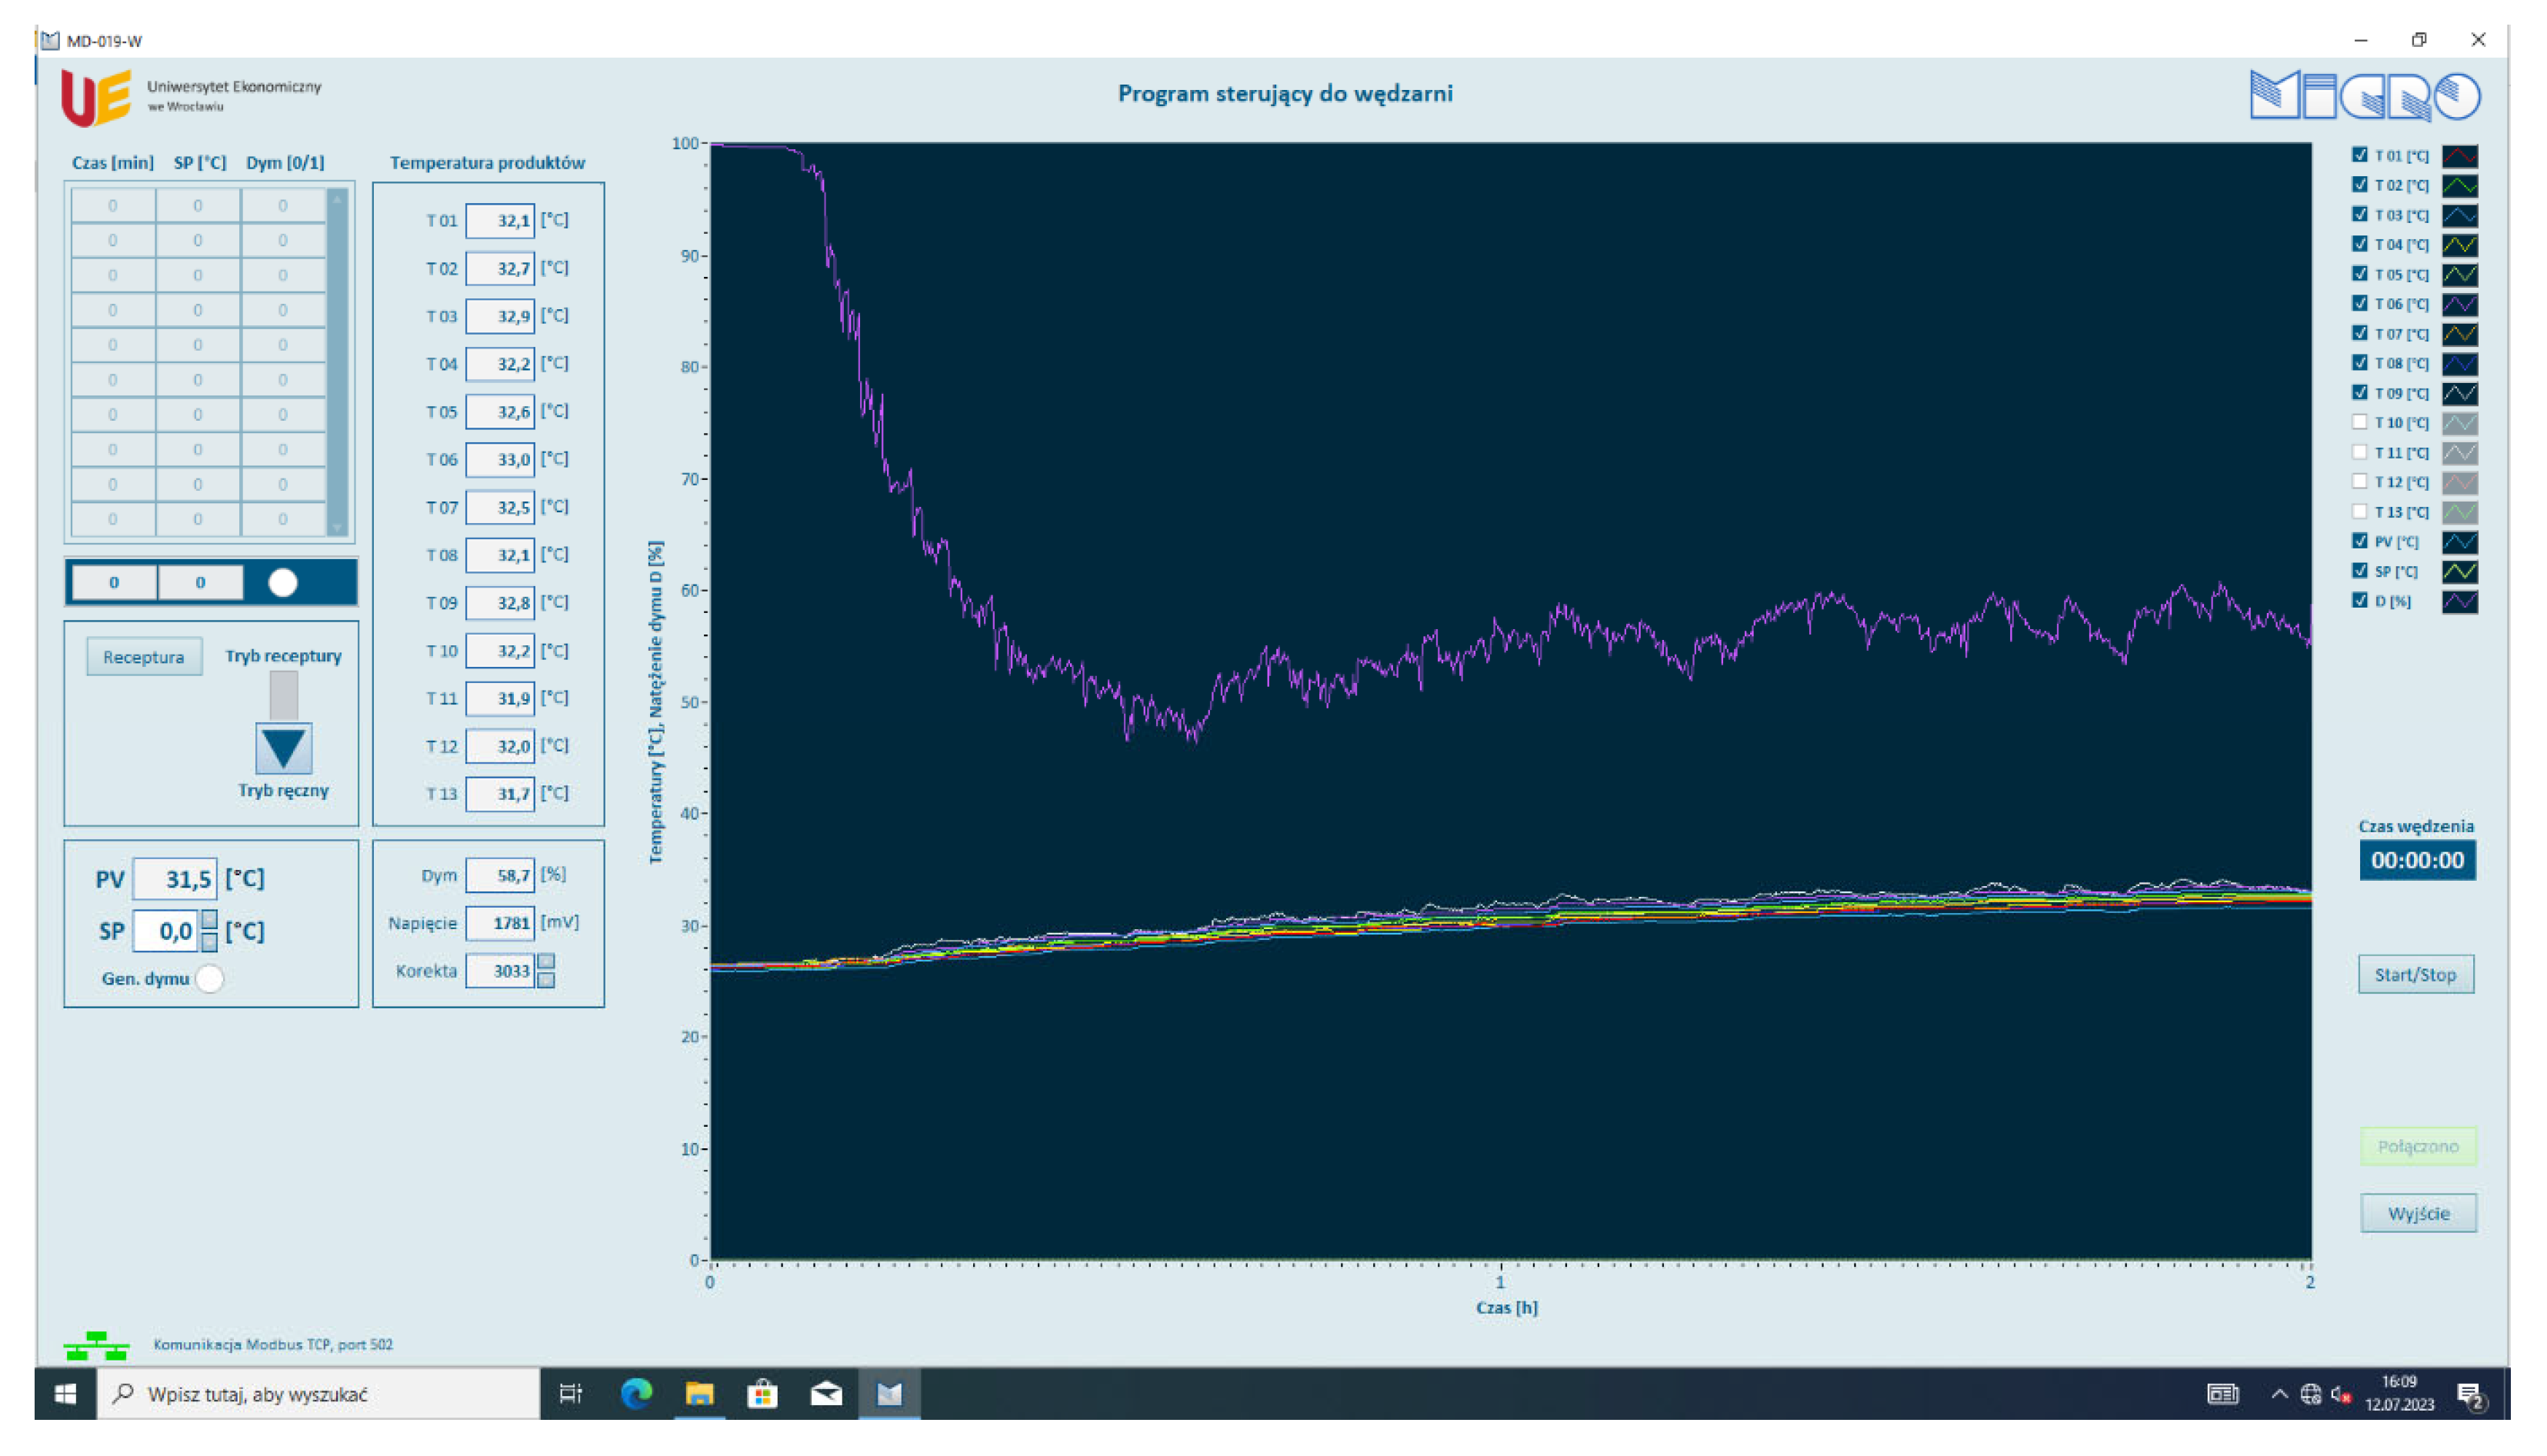
Dedicated software in National Instruments’ LabVIEW 2020 graphical programming environment was prepared to control the experiments (Figure 3).
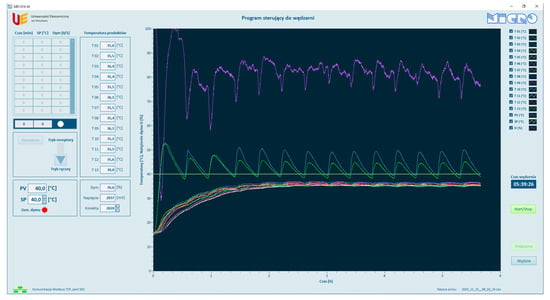
Figure 3.
The software user interface for controlling the smoking process.
During the smoking process, the results of measurements from all thirteen temperature sensors (T1 to T13) are displayed on the screen, as well as the temperature setpoint (SP) and the temperature measurement result realized with the Pt100 sensor connected to the AR662.B (PV) controller. In addition, these results are presented on a graph and saved to a file on the PC.
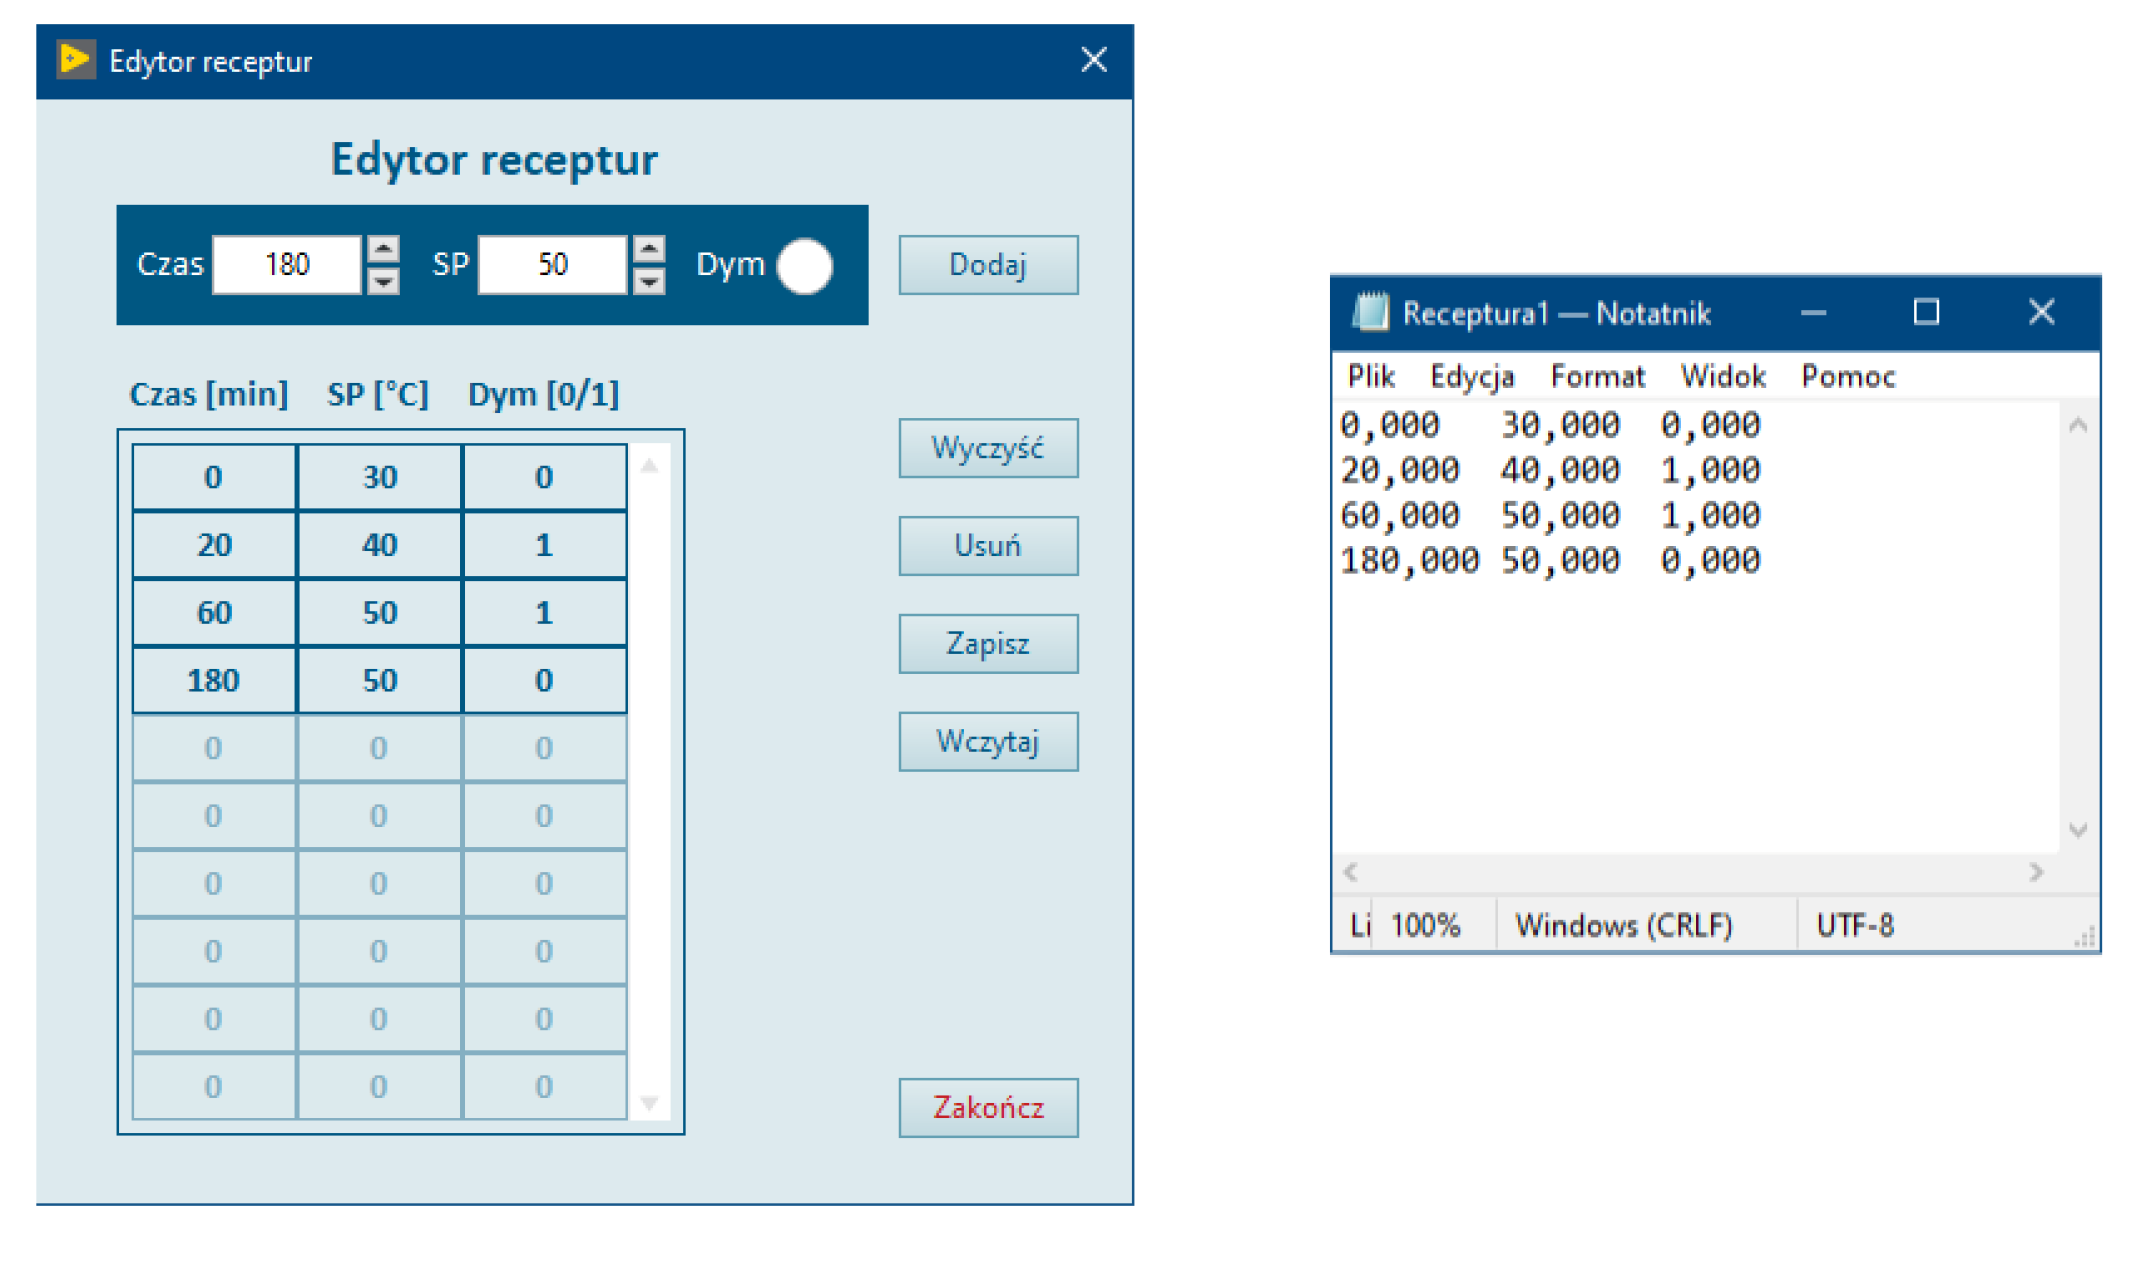
The program allows experiments to be conducted in manual mode and recipe mode. In manual mode, it is possible to manually set the temperature set point (SP—Set Point) and control the two-state operation of the smoke generator (Smoke Gen.). In recipe mode, the program allows us to save the successive steps of the smoking recipe, which contains information about the time of the process, the set temperature, and the operating status of the smoke generator (Figure 4), for example, from the 20th minute (Time [min]), at the set temperature of 40 °C (SP [°C]), and with the smoke generator on (Smoke [0/1]).
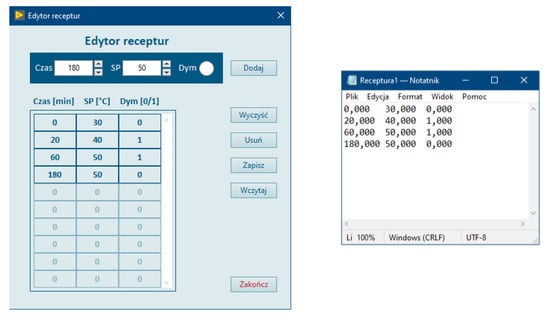
Figure 4.
Recipe editor and contents of the saved recipe file.
This solution allows for scheduling of many hours of experiments, saving the next steps in the smoking procedure (recipe), and automatically executing them after the smokehouse is started.
The software also implements support for the TEMT6000 light intensity sensor. When the process is started, the measured voltage value (“Voltage”) at the sensor output is displayed when there is no smoke in the smoke chamber. It is the initial state, and the value of this voltage is stored as the “Correction” parameter and considered as a light intensity of 100%. The appearance of smoke in the smoke chamber reduces the amount of light falling on the TEMT6000 sensor, causing a reduction in the value of the “Smoke” parameter expressed in %.
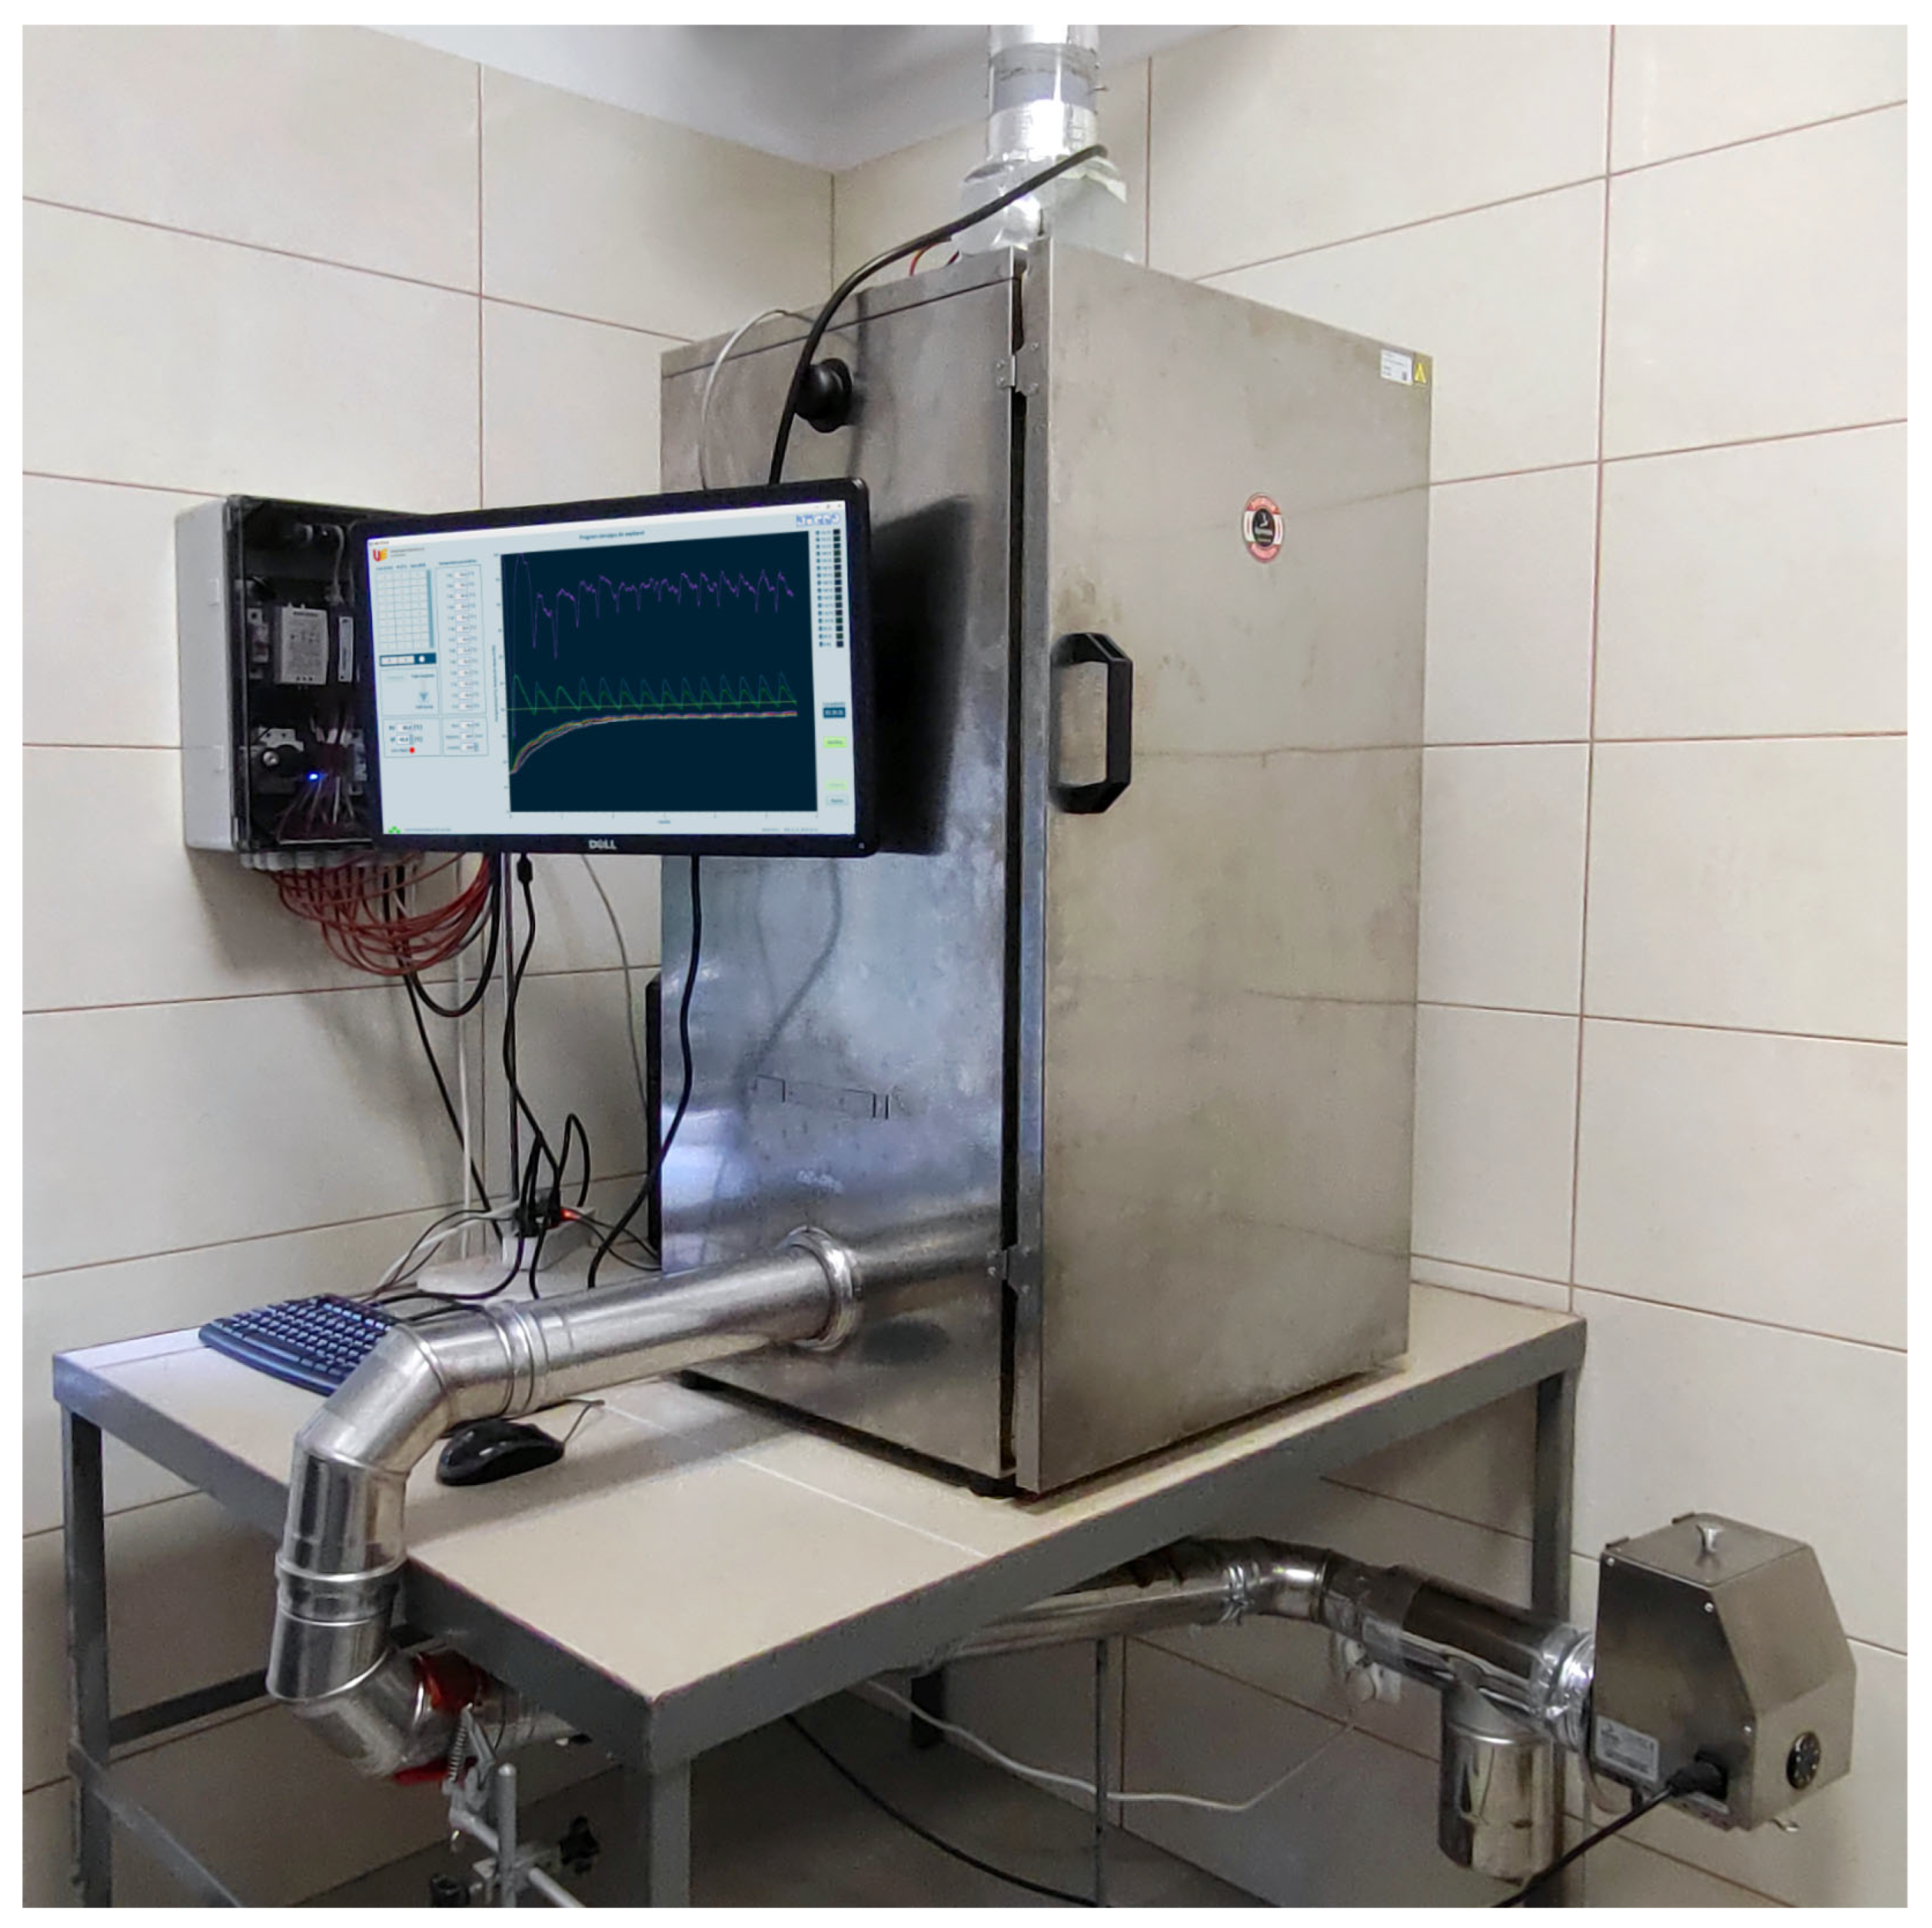
The commercially available smoke chamber has also been subjected to design modifications that make it possible to realize the smoking process using the cold smoke method, i.e., at temperatures up to 30 °C (Figure 5). Without these design modifications, in experiments in which the only heat source was the smoke generated by the smoke generator, temperatures above 80 °C were achieved after two hours of operation in the smoke chamber. The design modification consisted of lowering the height of the smoke generator’s position and lengthening the smoke supply pipe to 2.2 m. The change in the smoke’s path was intended to cool it down, translating into the chamber’s temperature stability. Thanks to these measures, the smoke from the generator to the smoking chamber cooled and precipitated tarry compounds in liquid form, trickling by gravity into the settling tank.
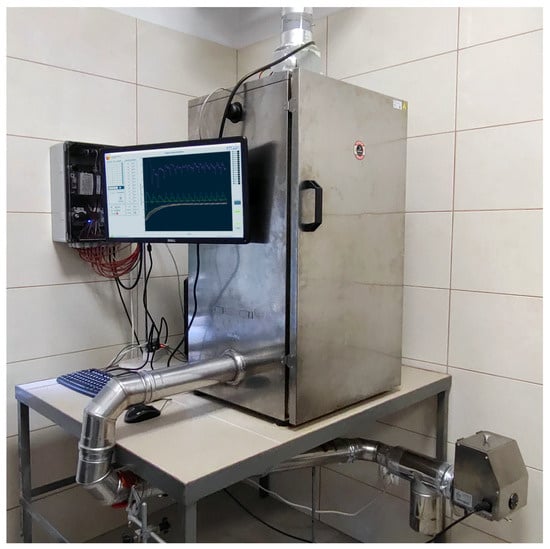
Figure 5.
Experimental stand.
2.2. Method of the Smoking Process in the Constructed Smoking Chamber
Twelve pork samples (from Polish Landrace pigs) were suspended in the smoking chamber each time, or three pieces of four kinds of cheese (feta cheese, Camembert, Italian-type cheese, and curd). These were pork loins with a comparable sample weight of about 1.4 kg, feta cheese with a weight of about 0.13 kg, Camembert with a weight of about 0.12 kg, Italian-type cheese with a weight of about 0.23 kg, and curd with a weight of about 0.30 kg. Each meat sample was cured in a 10% aqueous curing salt solution with spices, and each cheese sample was cured in a 3.5% solution. The process was carried out in a 10 dm3 tank for 1 day for cheese and 5 days for pork loin at a temperature of 4–6 °C. After the curing process, the products were hung on smoking hooks in a sterile environment. The laboratory was closed for 12 h to drip off the excess curing mixture and then weighed. A T1–T12 thermocouple was inserted into each sample. A T13 thermocouple was placed between the samples to control the temperature in the chamber. In addition, the SP programmed temperature and smoke level (Smoke) were recorded. The measurement frequency was 5s. The pork loin smoking process was programmed for 24 h. During the whole process, the chamber was not heated, so the temperature was increased to be lower than 25 °C. The second experiment aimed to measure the changes in cheese during smoking. Twelve pieces of cheese were suspended, in which thermocouples were placed. The chamber was heated to 60 °C. The measurement lasted 6 h. After smoking, the initial physical parameters of the meat and cheese were determined. The process was repeated with three separate iterations.
2.3. Methods of Measuring the Products’ Physical Parameters
2.3.1. Color Change of Products After Smoking
The color of products subjected to smoking was measured using a Minolta CR 400 colorimeter, measuring the change in the parameters L* (photometric brightness), a* (transition from green to red), and b* (transition from blue to yellow). In twelve repetitions, the products’ color change was determined in their interiors and external areas. The device was thoroughly washed with distilled water and wiped dry after each measurement to ensure repeatability. The total color change was calculated using Formula (1) based on the method described by Nkhata [20].
where
∆L*—change in photometric brightness;
∆a*—change in parameter (greenness for negative or redness for positive values);
∆b*—change in parameter (blueness for negative or yellowness for positive values).
2.3.2. Moisture Content of Products After Smoking
The moisture content of the products was measured using a Radwag MA 50/1.X.2 IC. moisture analyzer (Radwag, Radom, Poland). Approximately 10 g of a sample taken from a cross-section of each analyzed product was weighed. The moisture content of the products was measured in triplicate, and the average water content of each product was calculated.
2.3.3. Changes in the Texture of Products After Smoking
Texture parameters were conducted using texture profile analysis (TPA) and shear force (SF) tests on raw (A0, B0, C0, D0, and E0) and smoked meat (A) and cheeses (B1, C1, D1, and E1) with twelve repetitions. Pork loin samples were collected from multiple cuts to ensure sample representativeness. For the TPA test, meat samples were sectioned with a diameter of 14 mm and a height of 12 mm vertical to the muscle fiber axis. The tests were performed using the Shimadzu EZ-Test Texture Analyzer (Shimadzu Corporation, Tokyo, Japan), equipped with a 35 mm diameter probe at a feed rate of 50 mm/min, a deformation level of 50%, and a sample detection threshold of 0.5 N. For cheeses, these were set to 60 mm/min and 40%. The SF test was conducted using a Warner–Bratzler V-blade at a feed rate of 2 mm/s. Samples were cut horizontally along the muscle fiber axis with 10 mm × 40 mm × 10 mm dimensions for pork loin. The SF test was not performed for feta or Camembert cheese, as it was impossible to obtain representative samples following the smoking process.
2.4. Statistical Analyses
The analytical tools were Microsoft Excel and principal component analysis in Statistica 13.3 (StatSoft, Krakow, Poland). At first, the increments/decrements of the studied parameters were determined, and then the PCA was analyzed in graphs. The analysis was based on the factor value coefficients presented in Table 1 based on correlations.

Table 1.
Factor value coefficients based on correlations.
3. Results
When conducting the first test of the smoke chamber, it was essential to see if the temperature of the smoke entering the chamber significantly affected the temperature change. Figure 6 shows a screenshot of the control computer.
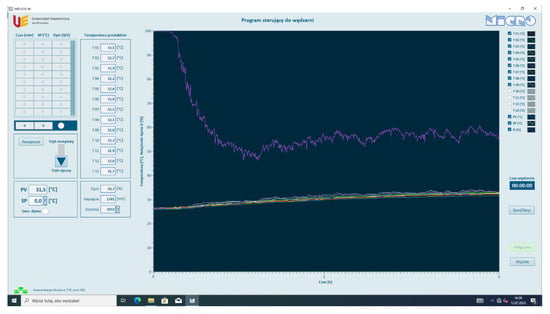
Figure 6.
Measurement of parameters with an empty chamber without the heater on.
The stabilization period of the smokehouse during operation, in which the purple line indicates the smoke filling level of the ZD chamber, is at 50% light transparency after 30 min of operating the smoke generator. The smoke level did not change until the end of the trial, which lasted 2 h. The initial temperature in the chamber was 26.2 ± 0.15 °C, which increased to 32.6 ± 0.43 °C after two hours and remained constant. The measurement error did not exceed 2.5% throughout the measurement period. The smoke level after 30 min was 55.3 ± 3.0%, while the absolute deviation from the mean was 5.5%. The applied modification allowed us to achieve the target parameters of the stability of the smoking process in the presented chamber. In connection with the above, a controlled smoking process of pork loin and cheeses was carried out using the methodology in Section 2.2. The samples before and after the smoking process were subjected to physical parameter tests, the results of which are presented in the section ‘Changes in Physical Product Parameters’.
Changes in Physical Product Parameters
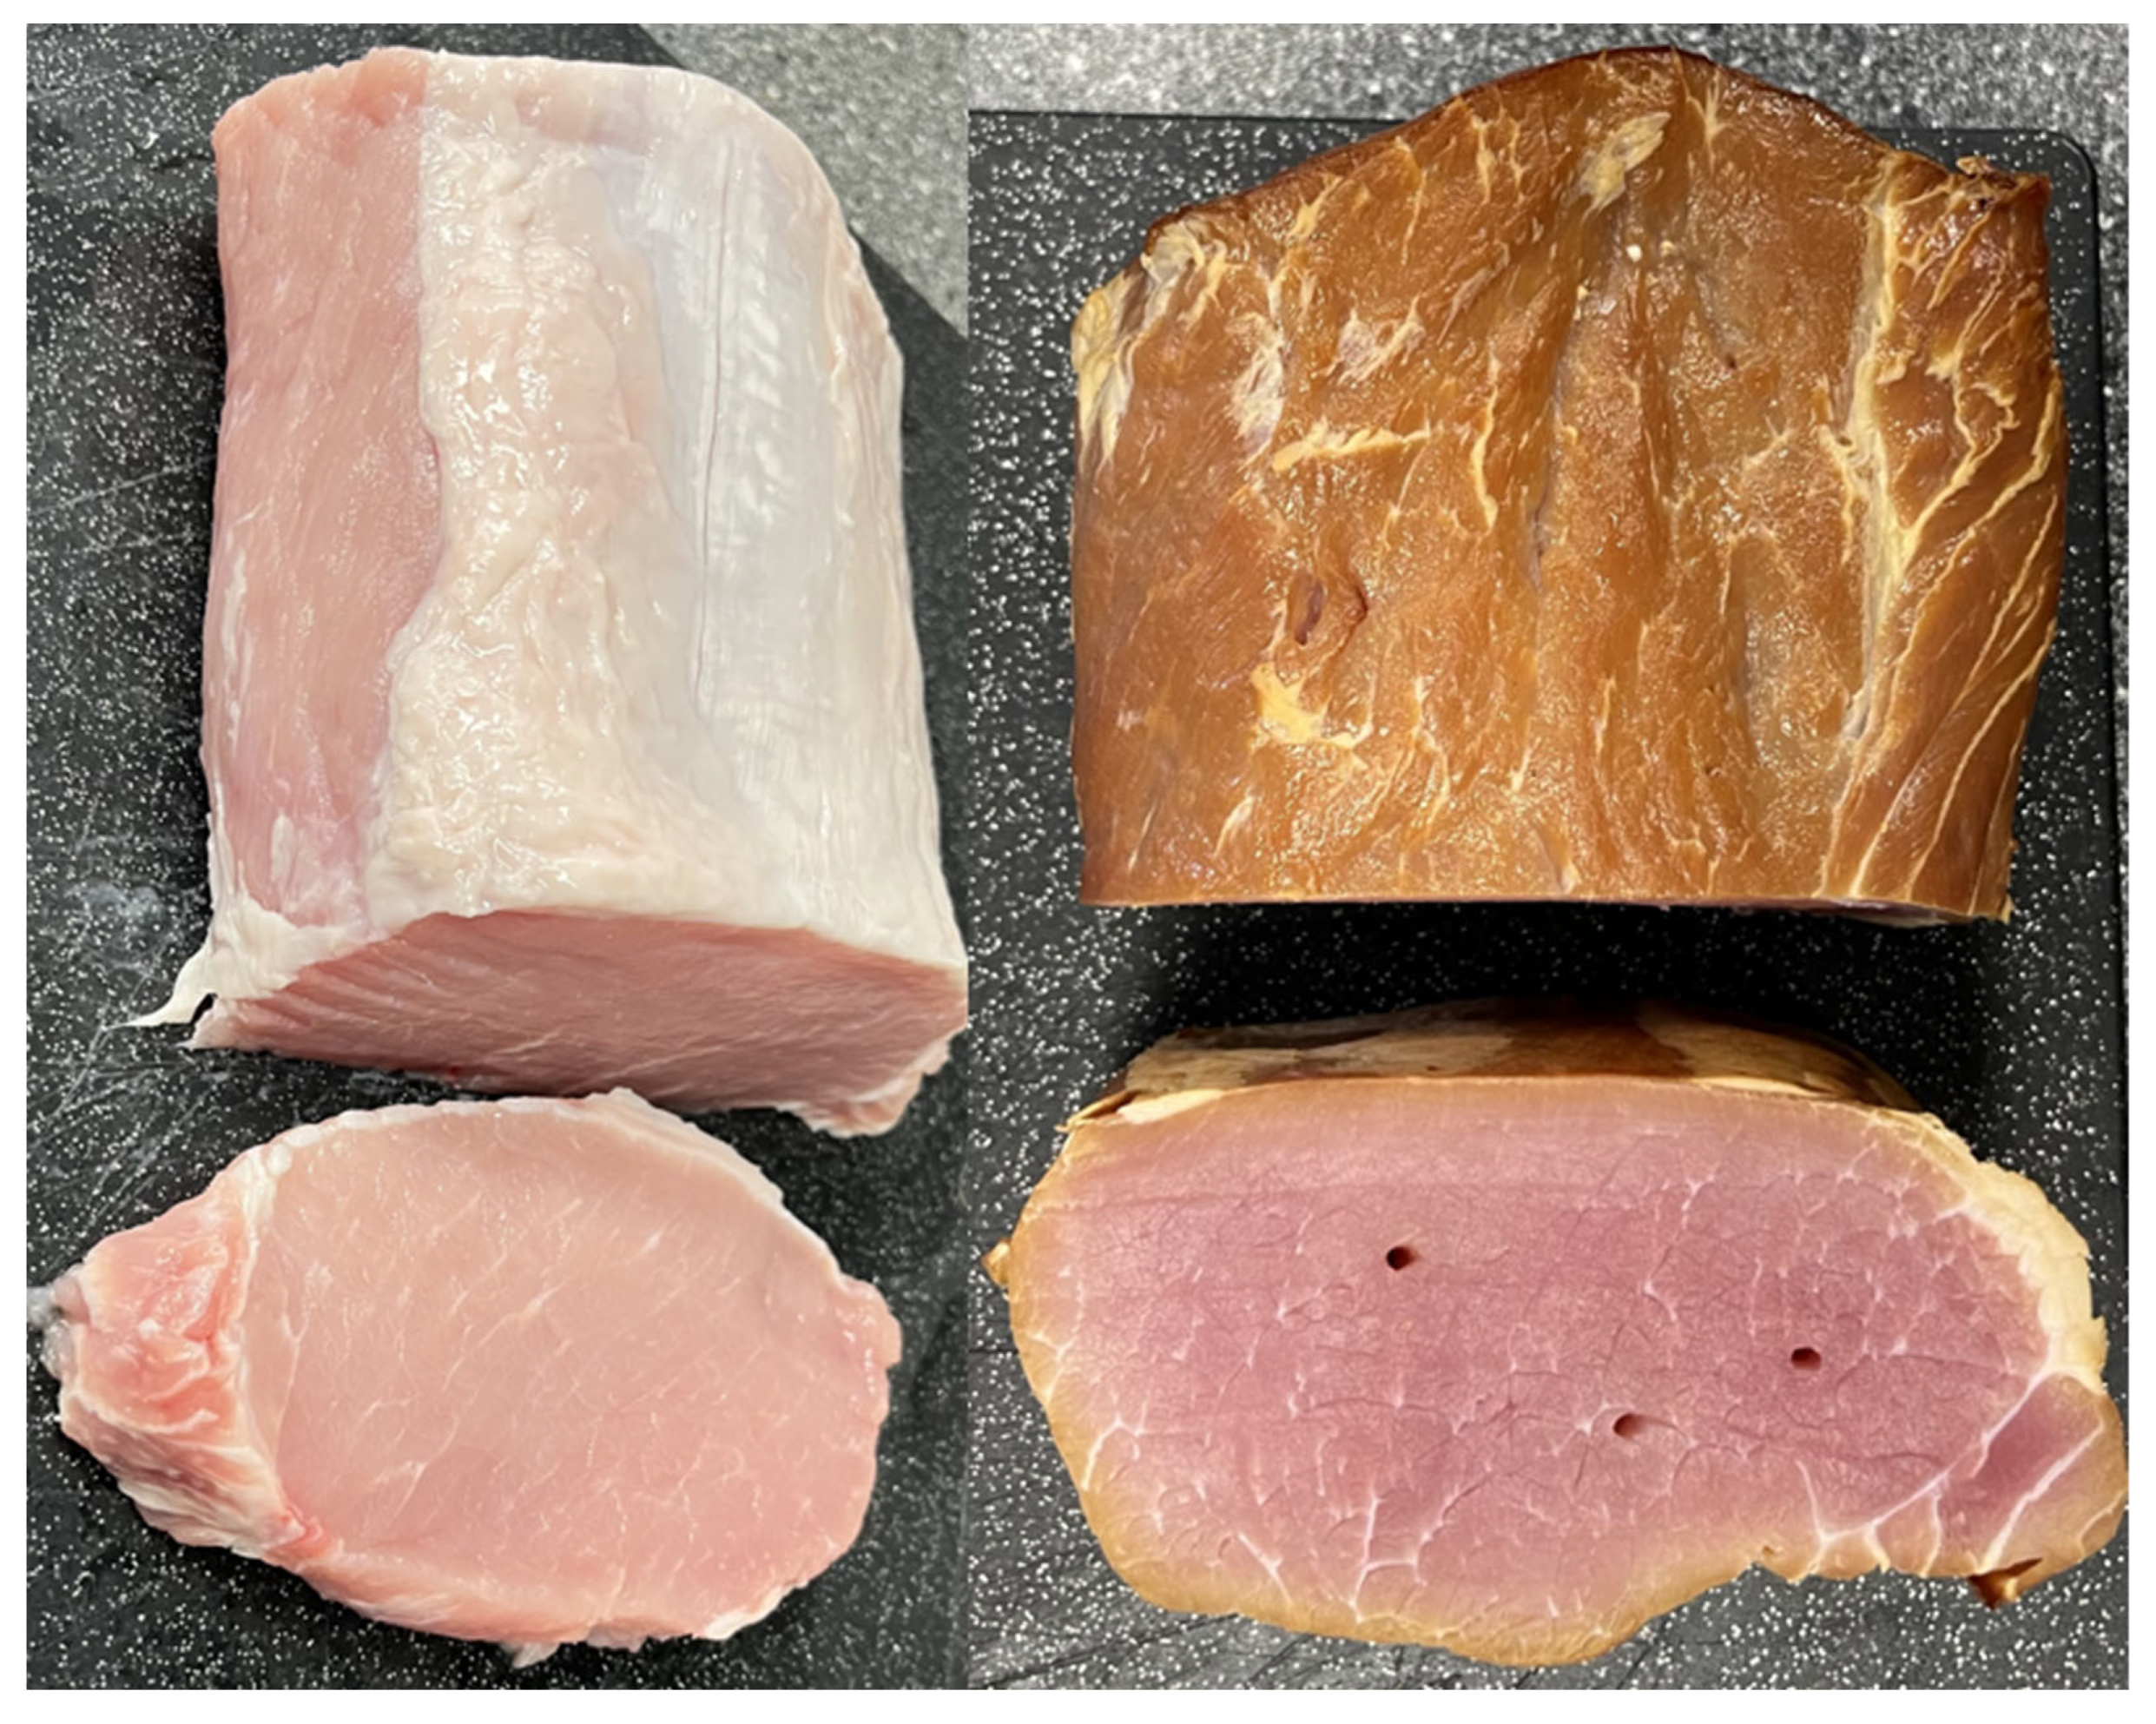
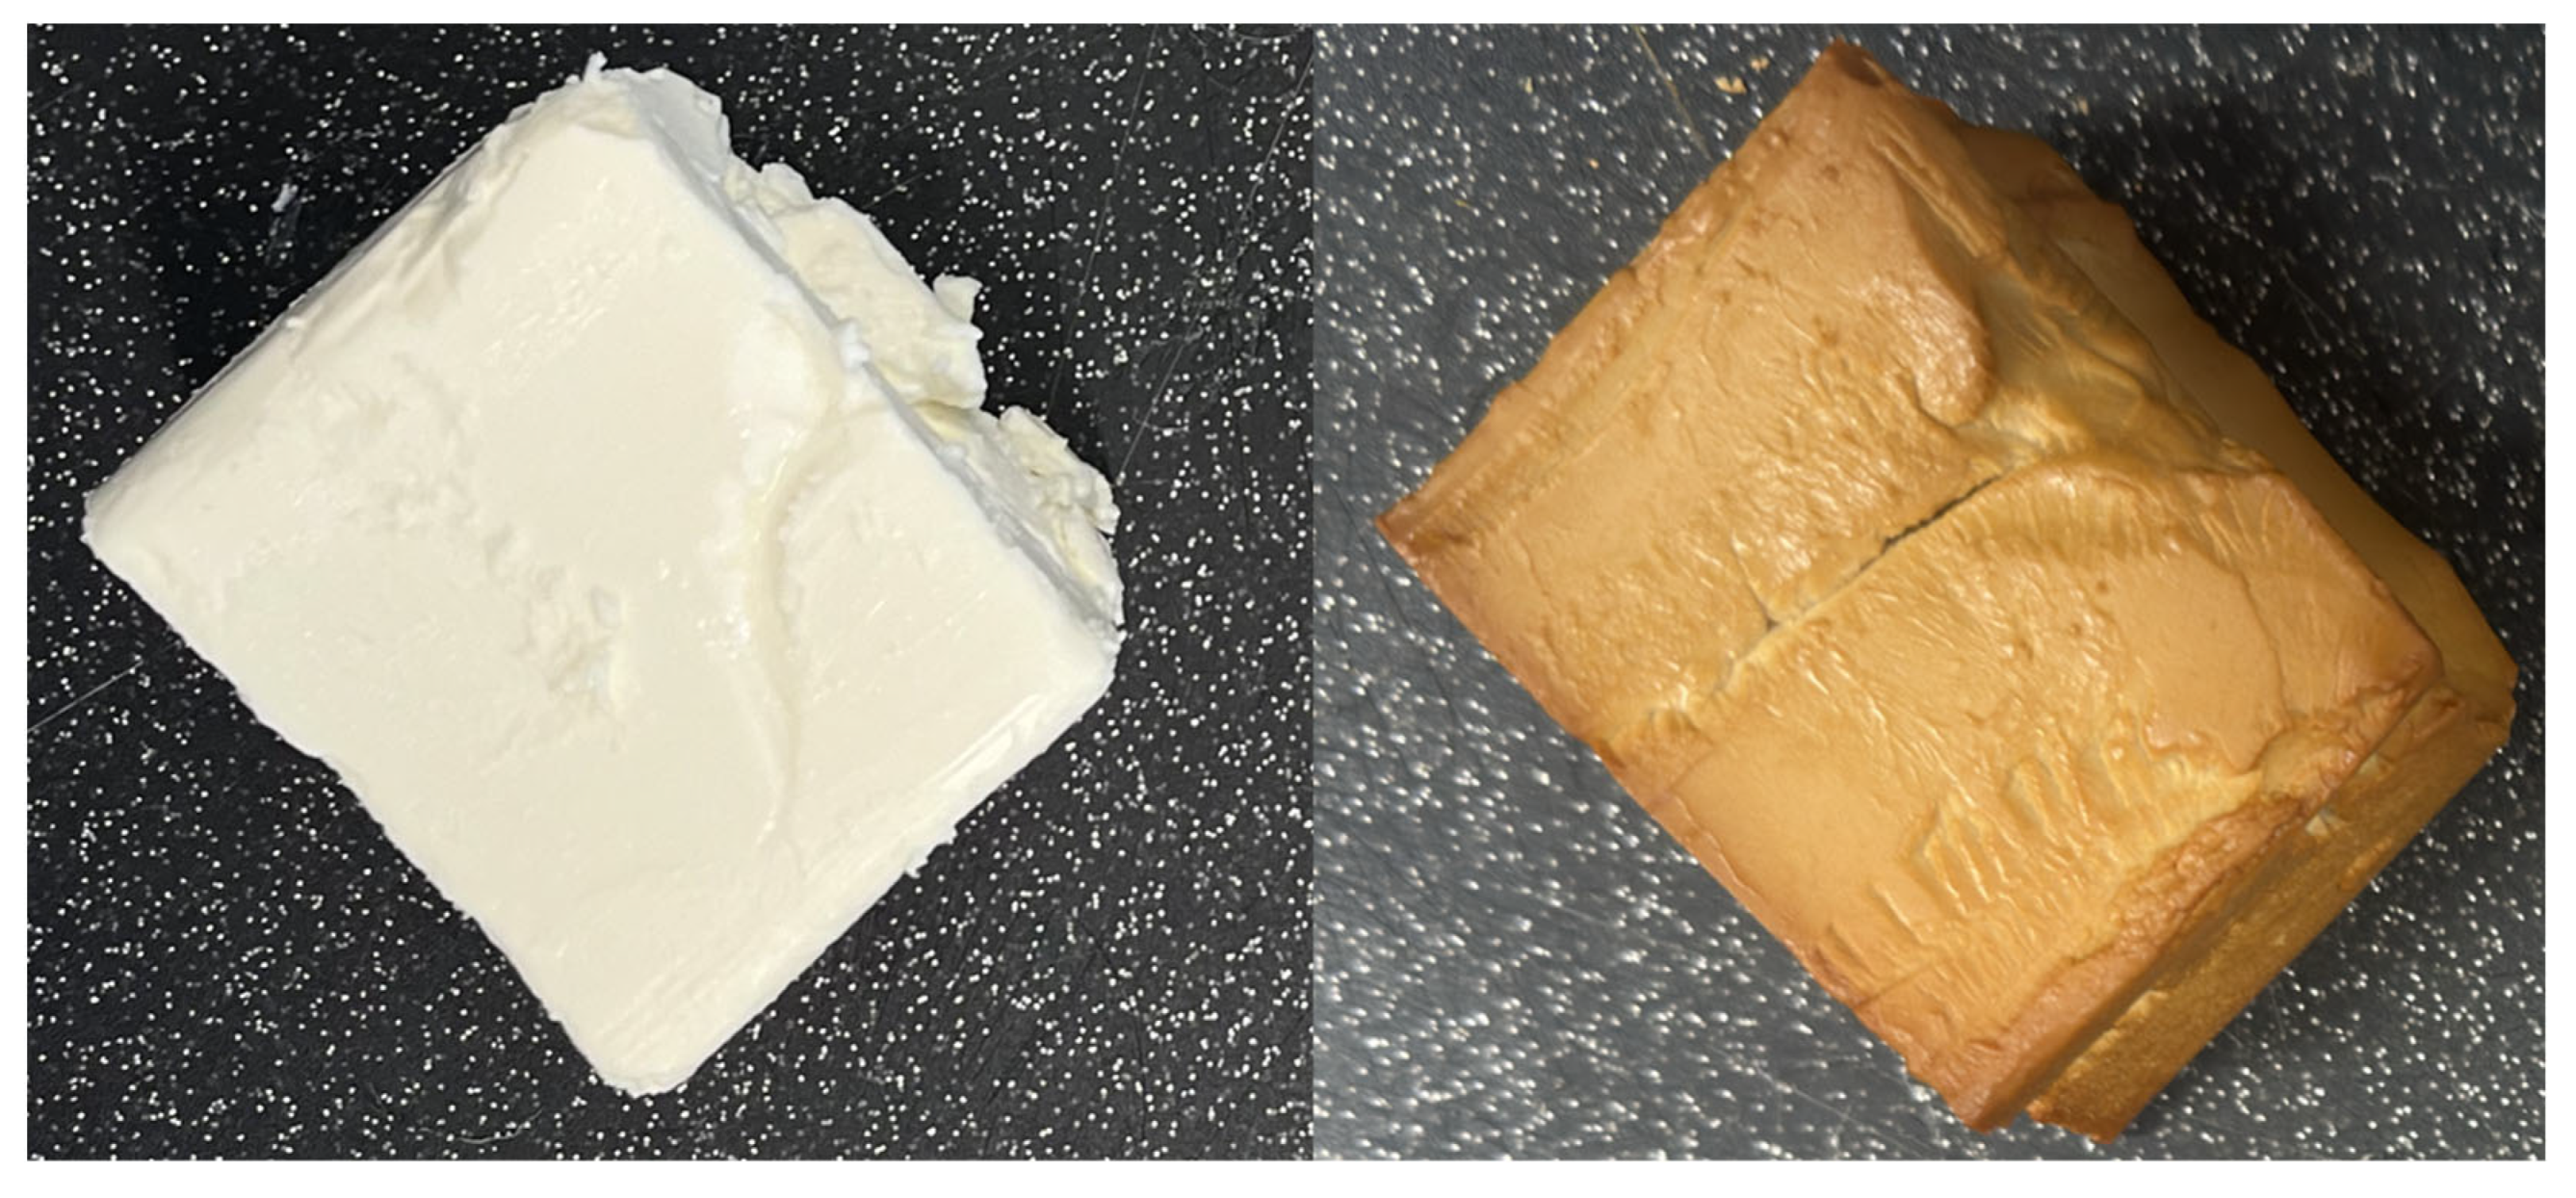
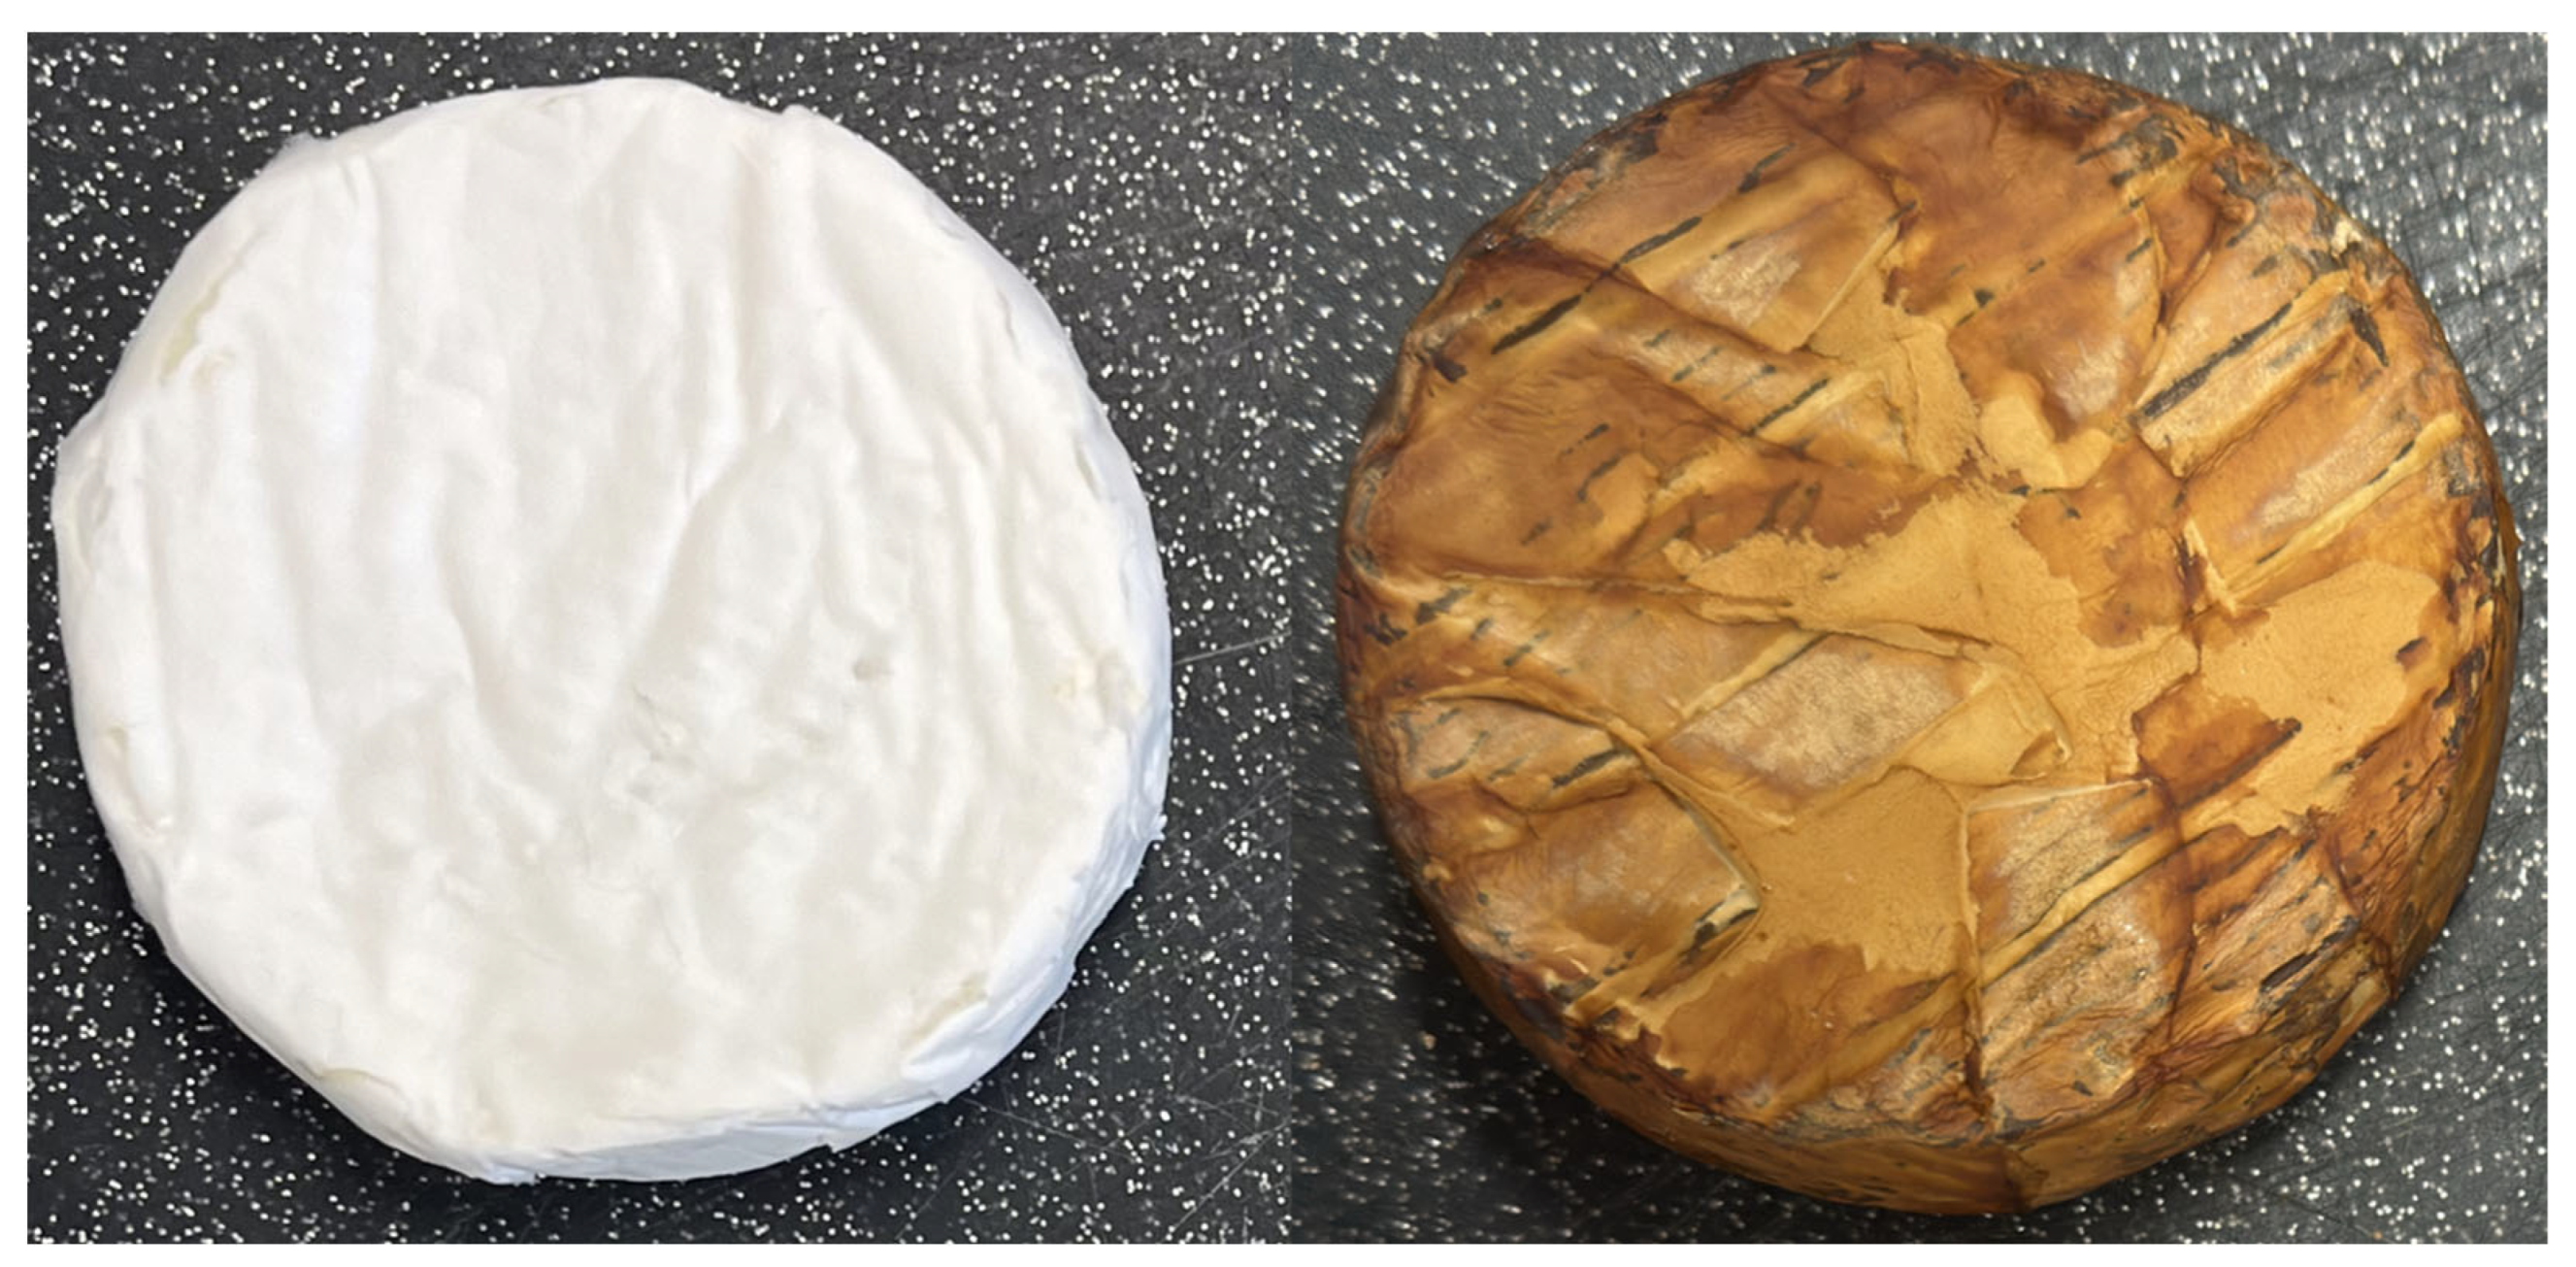
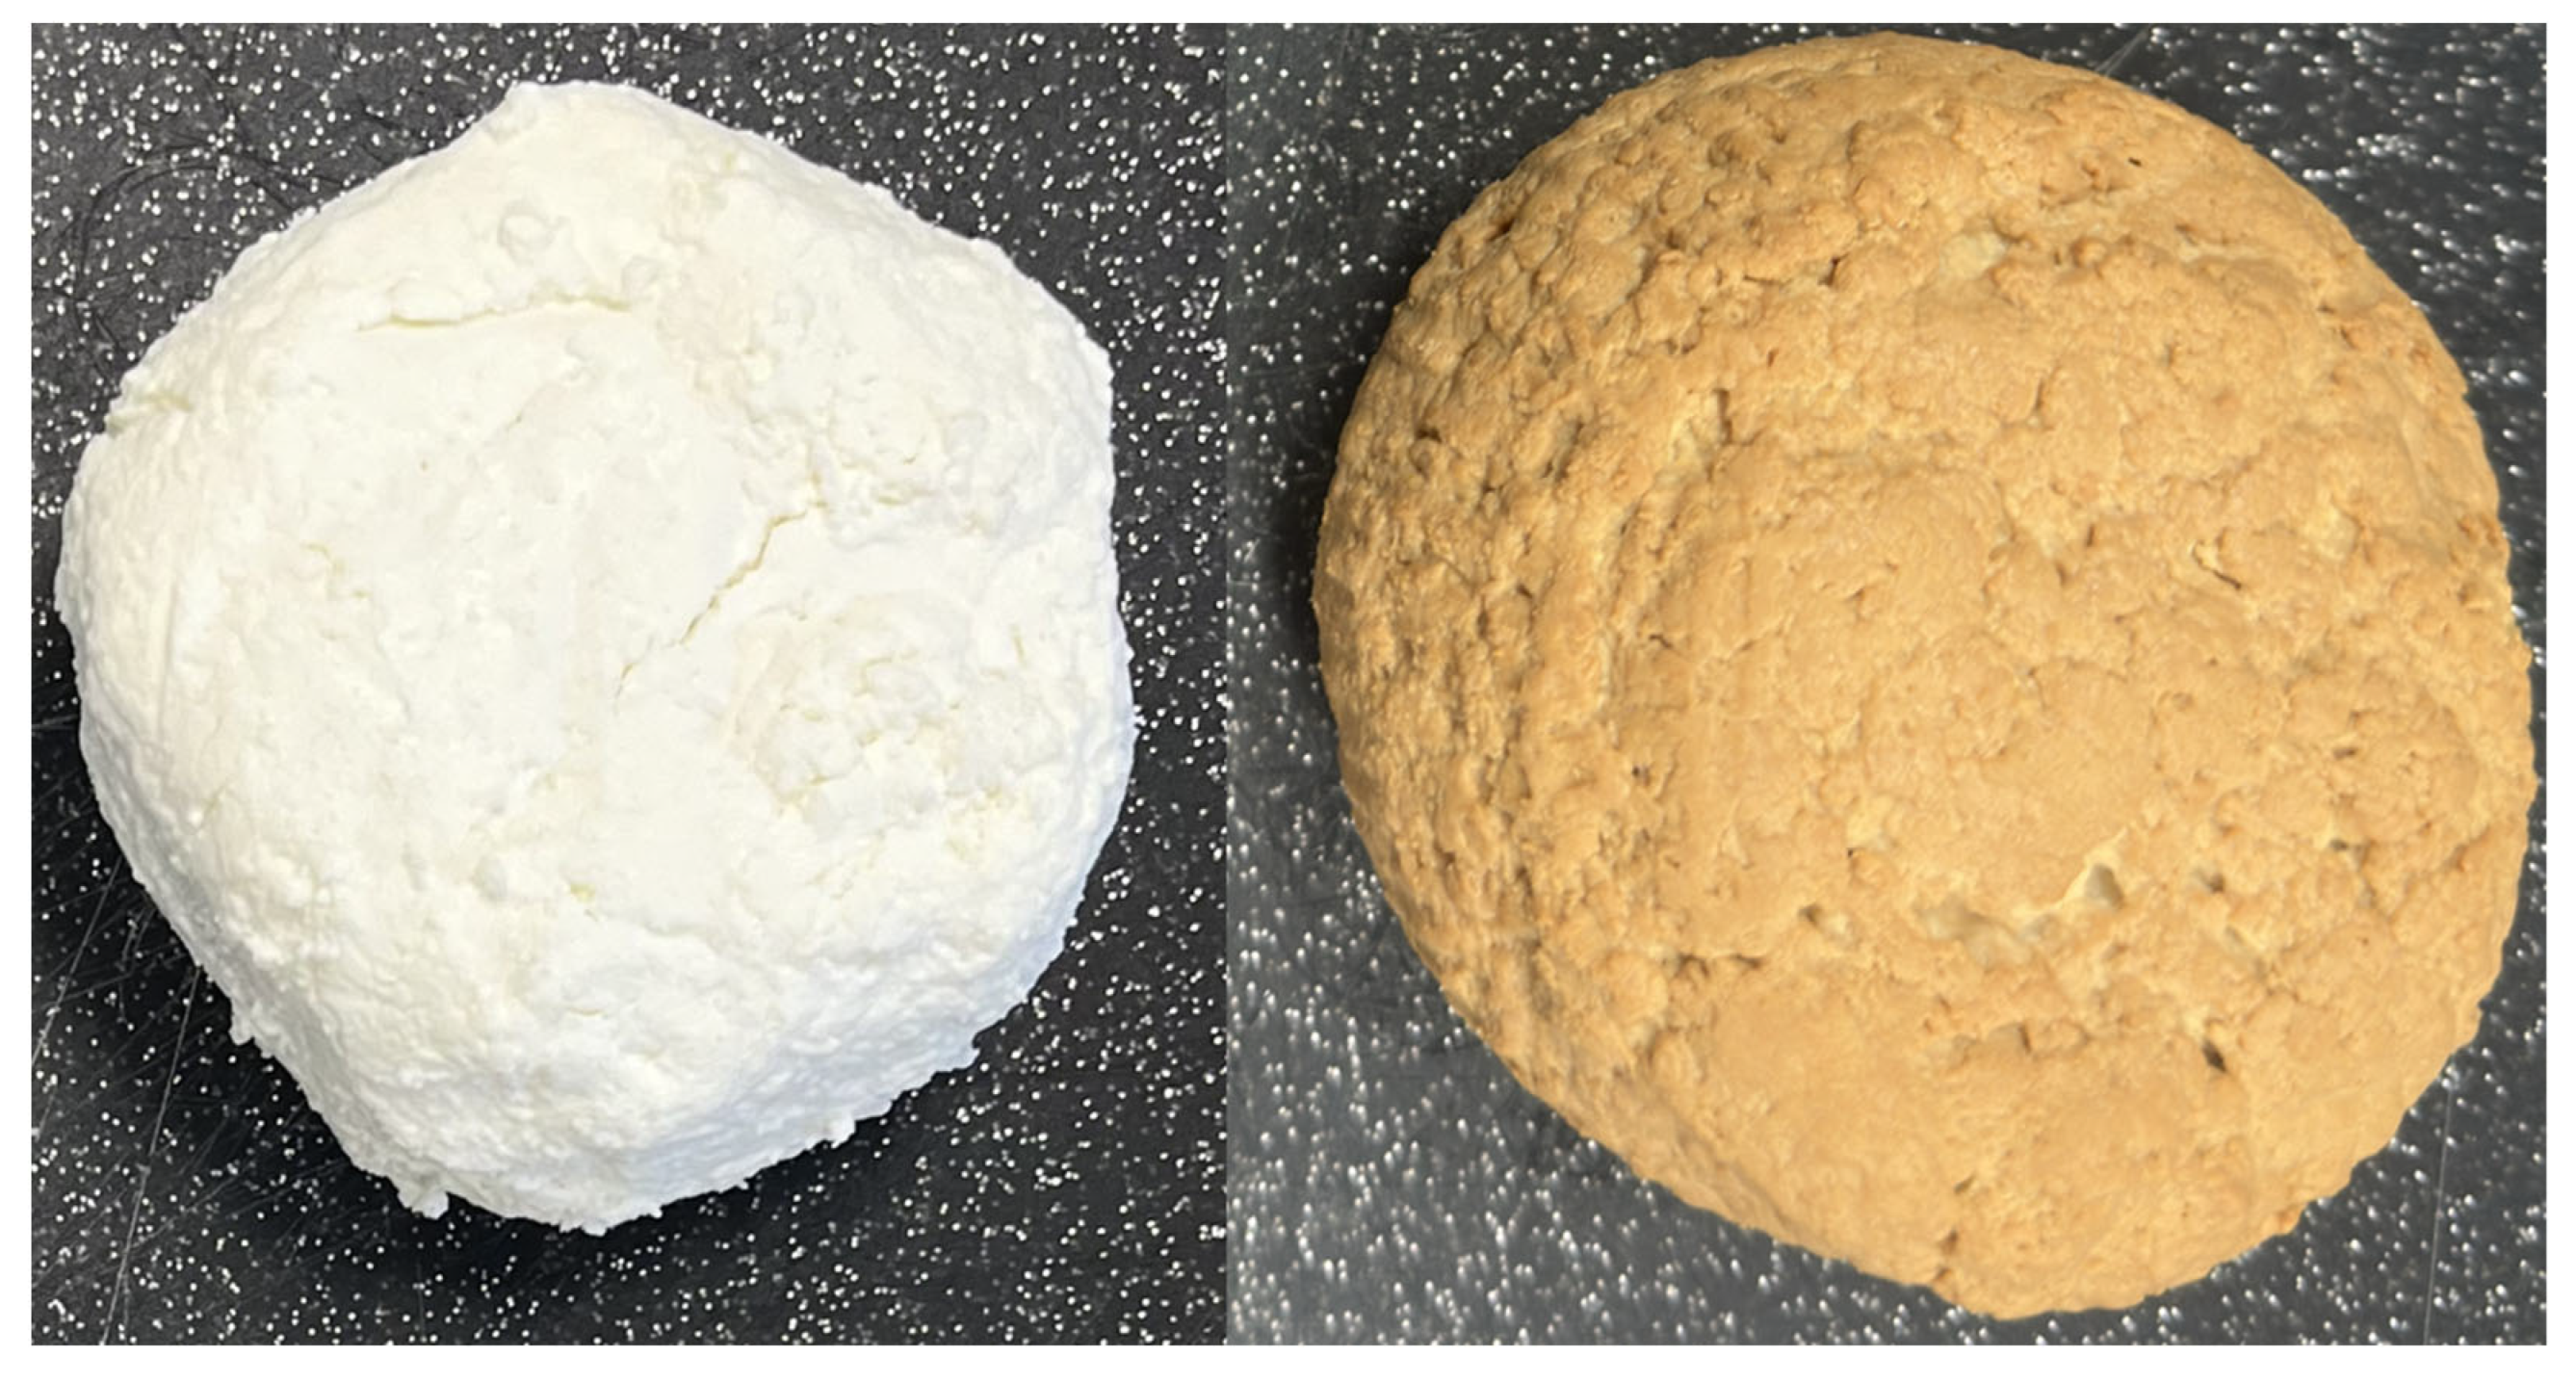
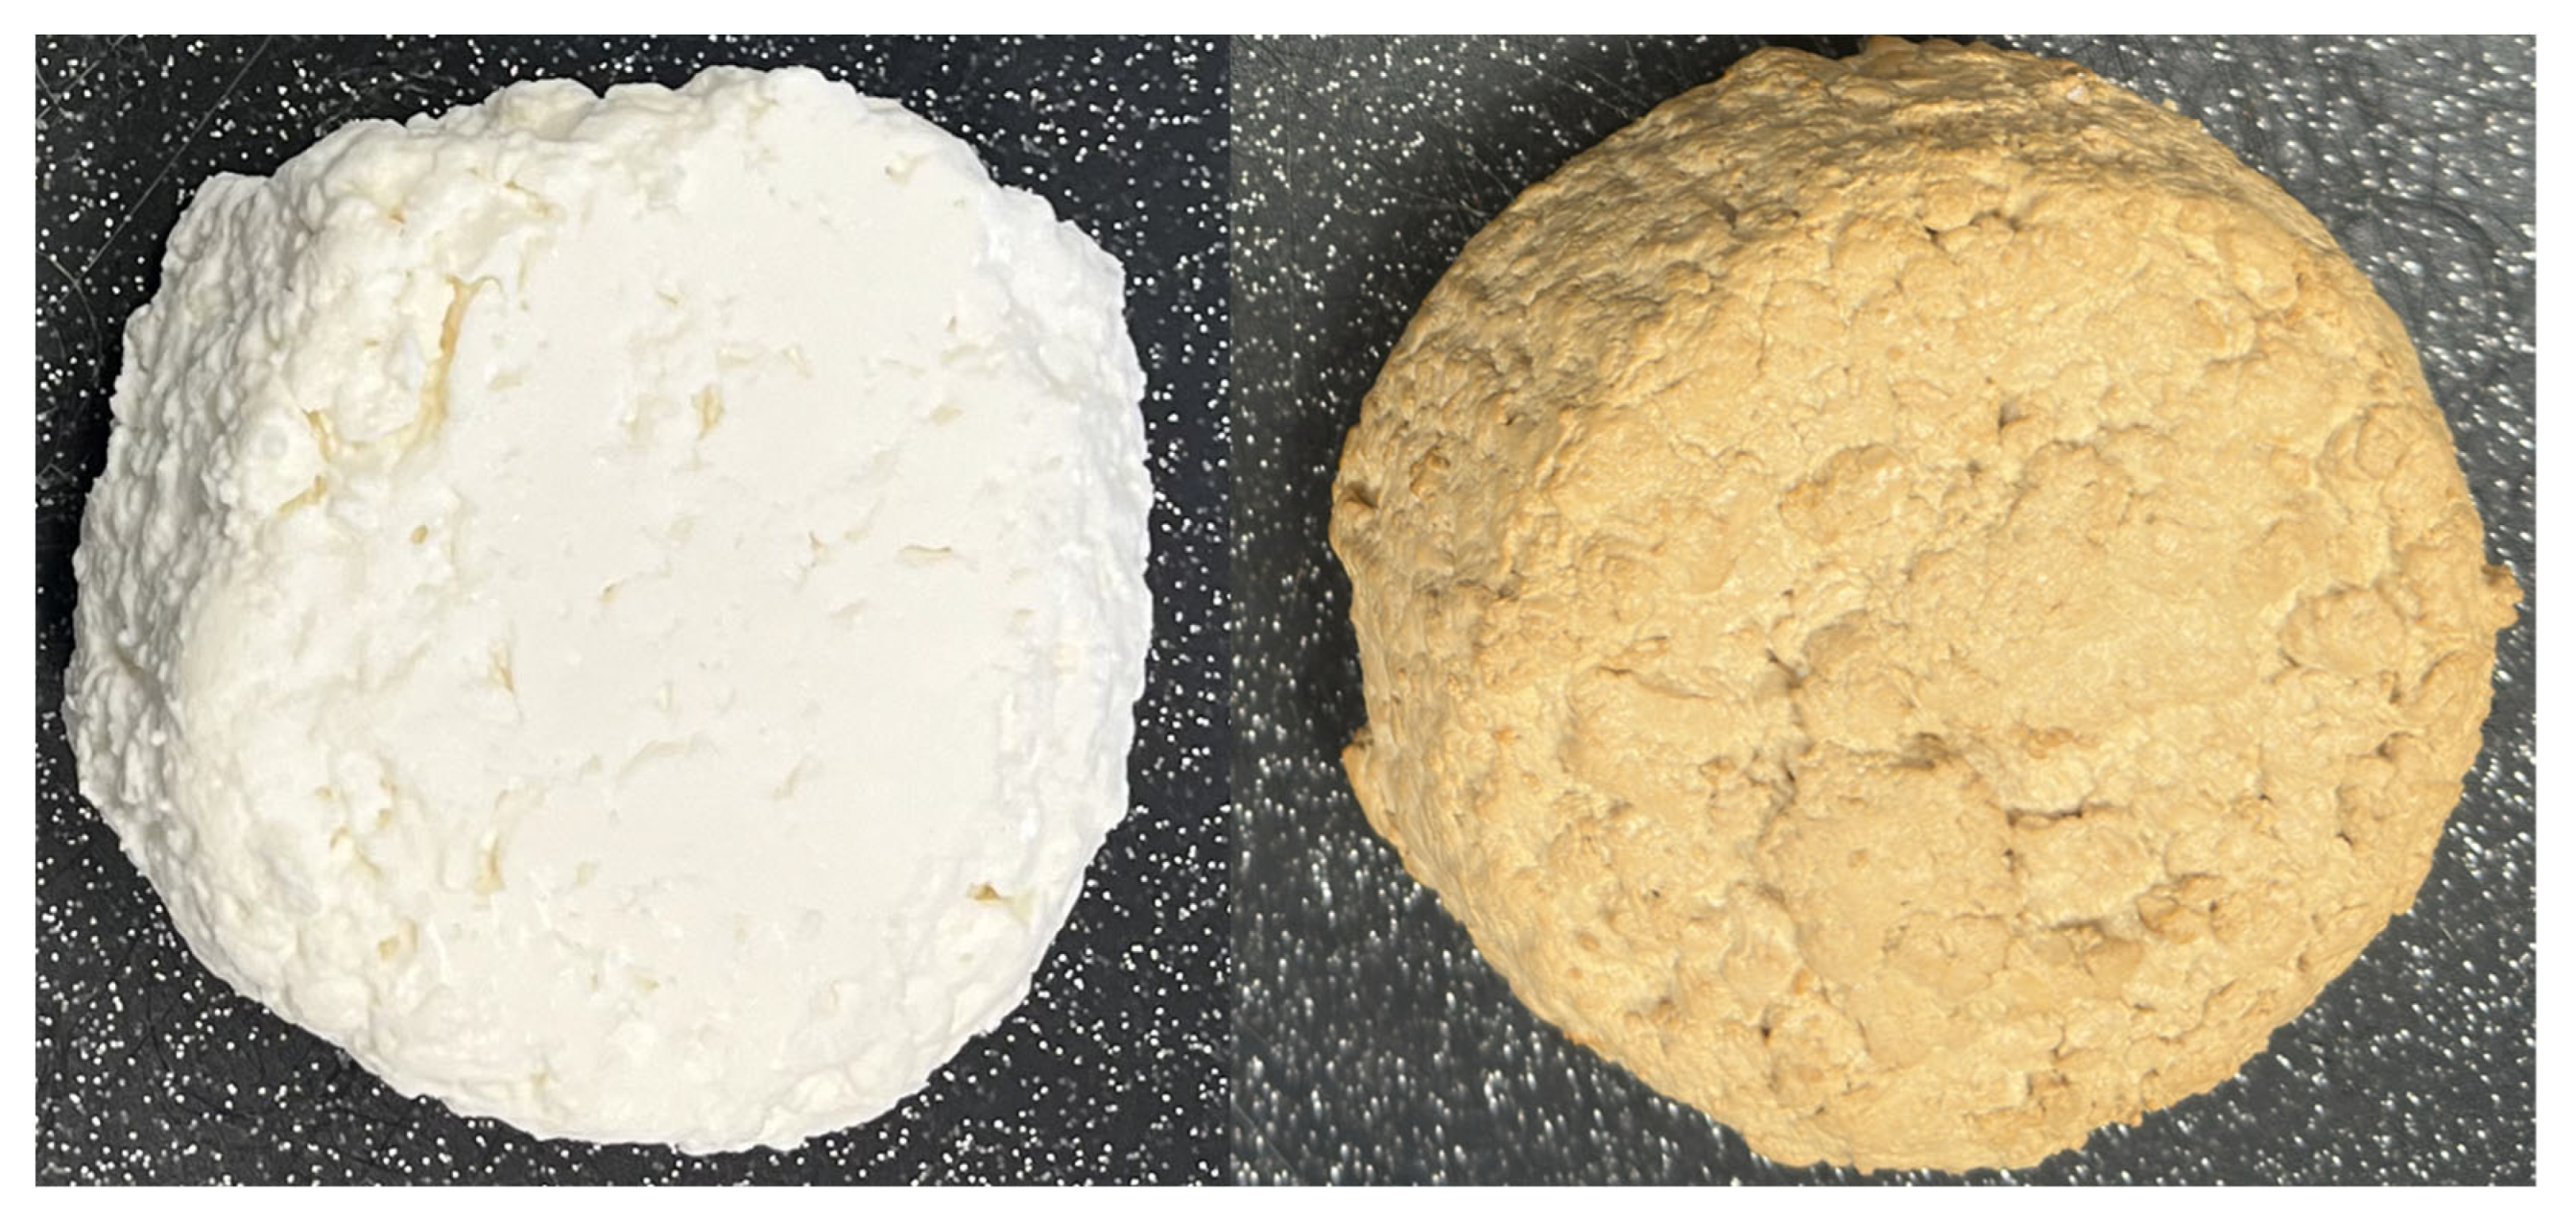
Figure 7, Figure 8, Figure 9, Figure 10 and Figure 11 show the comparison of the samples before and after the smoking process, and Table 2 and Table 3 show a comparison of the samples before and after the smoking process, as well as the effect of the smoking process on the basic physical parameters of the samples.
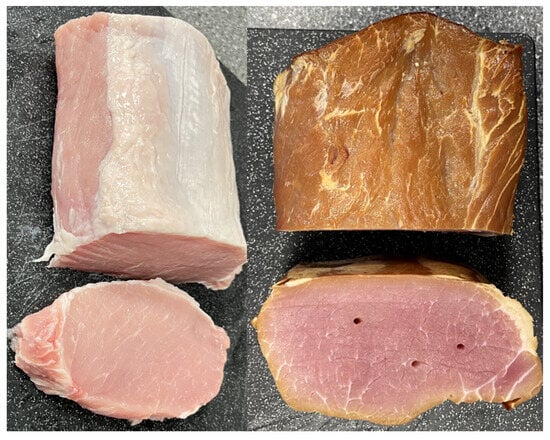
Figure 7.
The comparison of the pork loin samples before and after the smoking process.
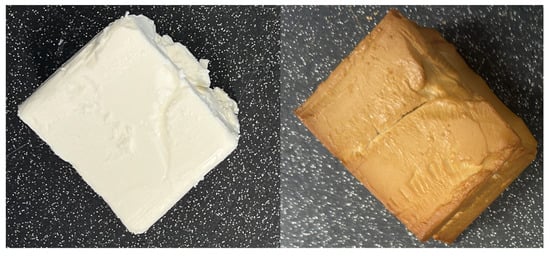
Figure 8.
The comparison of the feta cheese samples before and after the smoking process.
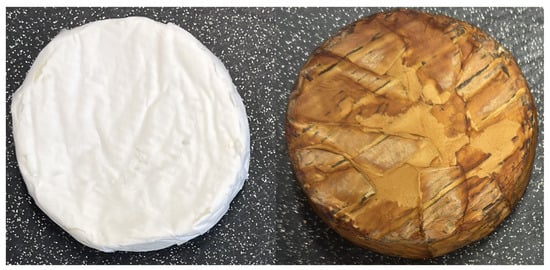
Figure 9.
The comparison of the Camembert samples before and after the smoking process.
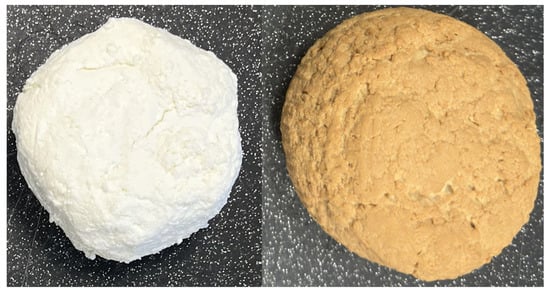
Figure 10.
The comparison of the Italian-type cheese samples before and after the smoking process.
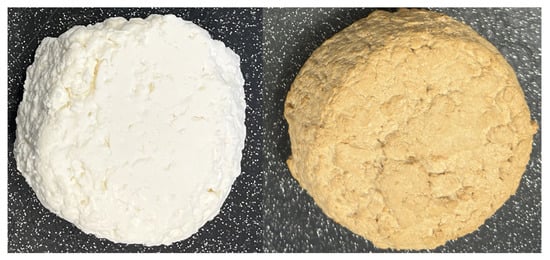
Figure 11.
The comparison of the curd samples before and after the smoking process.

Table 2.
Average changes in moisture and color after the smoking process.

Table 3.
Average changes in texture parameters after the smoking process.
The effects of the smoking process on selected physicochemical and textural properties were analyzed for various food products: pork loin, feta cheese, Camembert, Italian-type cheese, and curd. All products showed a decrease in weight and moisture after smoking, which is natural due to the smoking process, as confirmed by the study of Bhat et al., 2021 [21]. The most significant weight loss was observed in feta (−37.0%) and curd (−26.6%), typical of products with a loose and/or granular texture. Similar results were obtained by Ledesma et al., 2016 [22]. The most significant decrease in moisture in Camembert (−24.8%) was observed to affect its creaminess significantly. According to Racovita et al., 2020, pork loin retains the most water due to the presence of membranes and muscle structures that limit evaporation [23]. After smoking, most products show the following:
- L* increases inside the pork loin (lighter interior), but L* decreases in cheeses and pork loin on their surfaces (darker), which, according to Guo et al. (2020), may be correlated with the possibility of smoke components penetrating the product [24]. It should also be noted that the cheeses were smoked at a higher temperature than the pork loin, due to the fact that low temperatures do not affect the structure of cheeses as much as they do the structure of meat;
- An increase in a* and b* that is especially evident in cheeses, indicating strong reddening and yellowing after smoking (the Maillard effect and absorption of compounds from the smoke are responsible for the increase in a* and b*—typical with heat treatment, as shown by Varlet et al.’s research [25]).
In addition, the surface color changes are much more pronounced than the internal ones, which indicates the accumulation of most of the smoke substances on top of the product and is the result of the temperature. As for the relationship between the color change in the samples (ΔE) and the change in texture parameters (TPA/SF), as the samples darken during smoking, a complete change in texture occurs (especially in the case of cheeses). The products become harder, more elastic, and rubbery and will also require one to chew them for longer. This is partly due to the decrease in moisture and denaturation of the proteins contained in the products, which, according to Odoli et al., 2019, are already intensively denatured at 60 °C [26].
Significant changes in the textural properties of the products were also observed:
- For the pork loin, a significant increase in hardness (+187.4%), shear force (+54.4%), and gumminess (+172.4%), in addition to increases in cohesiveness (+13.0%) and springiness (+41.0%), indicate a denser and resistant product structure;
- For the feta cheese, an increase in hardness (+68.2%) and gumminess (+111.4%) and a decrease in springiness (−48.9%) and cohesiveness (−300.0%) indicate that the product becomes more complex and more compact, but its surface becomes intensely sticky (the cheese becomes semi-hard and slightly crusty);
- The Camembert showed a significant decrease in hardness (−45.9%) and gumminess (−40.2%), indicating that the product became softer. In contrast, increasing resilience (+42.1%), springiness (+92.9%), and adhesiveness (+83.7%) indicate a change in its structure to a more malleable one;
- The Italian-type cheese showed the most moderate change in textural properties. The exceptions were shear strength (+93.6%) and adhesiveness (−156.5%), indicating an improvement in this product’s structural properties for slicing and grinding;
- The curd became firmer (101.1% increase in shear force), less compact, and less smeary (as evidenced by moderate changes in hardness, gumminess, and springiness) but more sticky (a 127.8% decrease in adhesiveness).
A comparison of the results of the smoked cheese texture tests to the results of the research by Xin et al., 2022 shows that the changes in the cheese texture occur at a similar level regardless of whether traditional smoking or liquid smoke flavoring during preparations is used. This is due to the accumulation of smoke components inside the smoked product, which causes a change in structure [27].
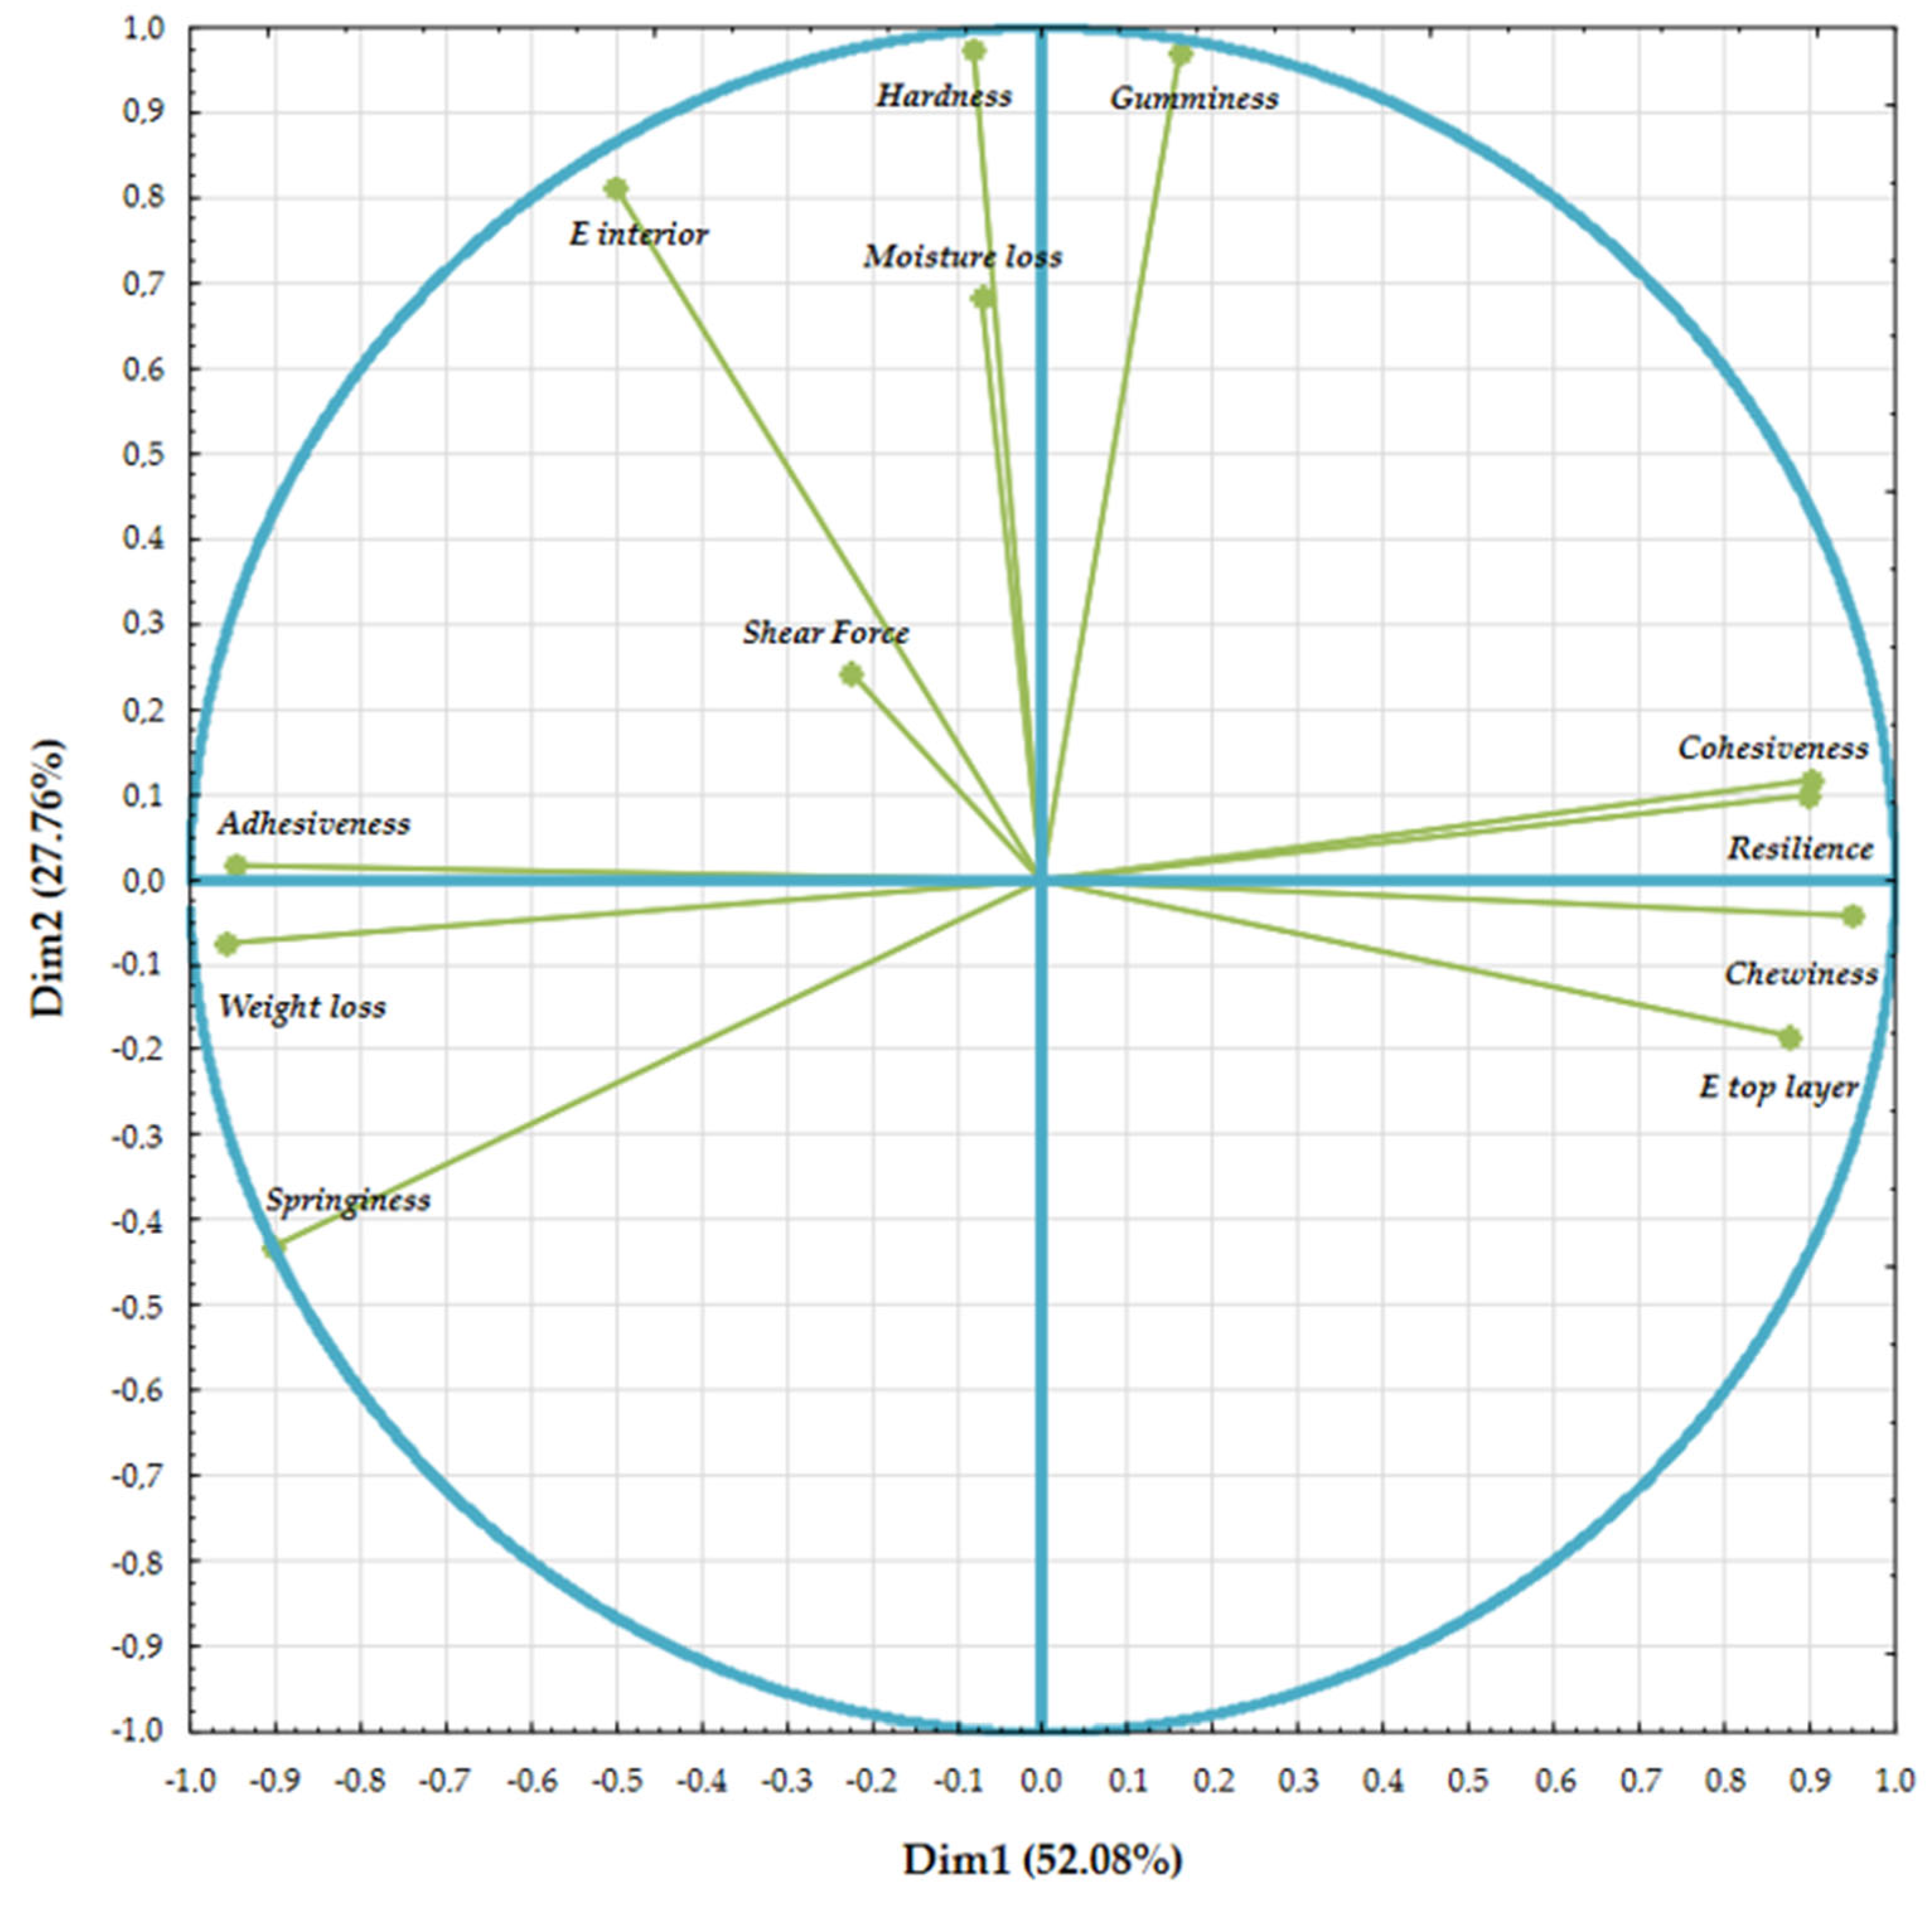
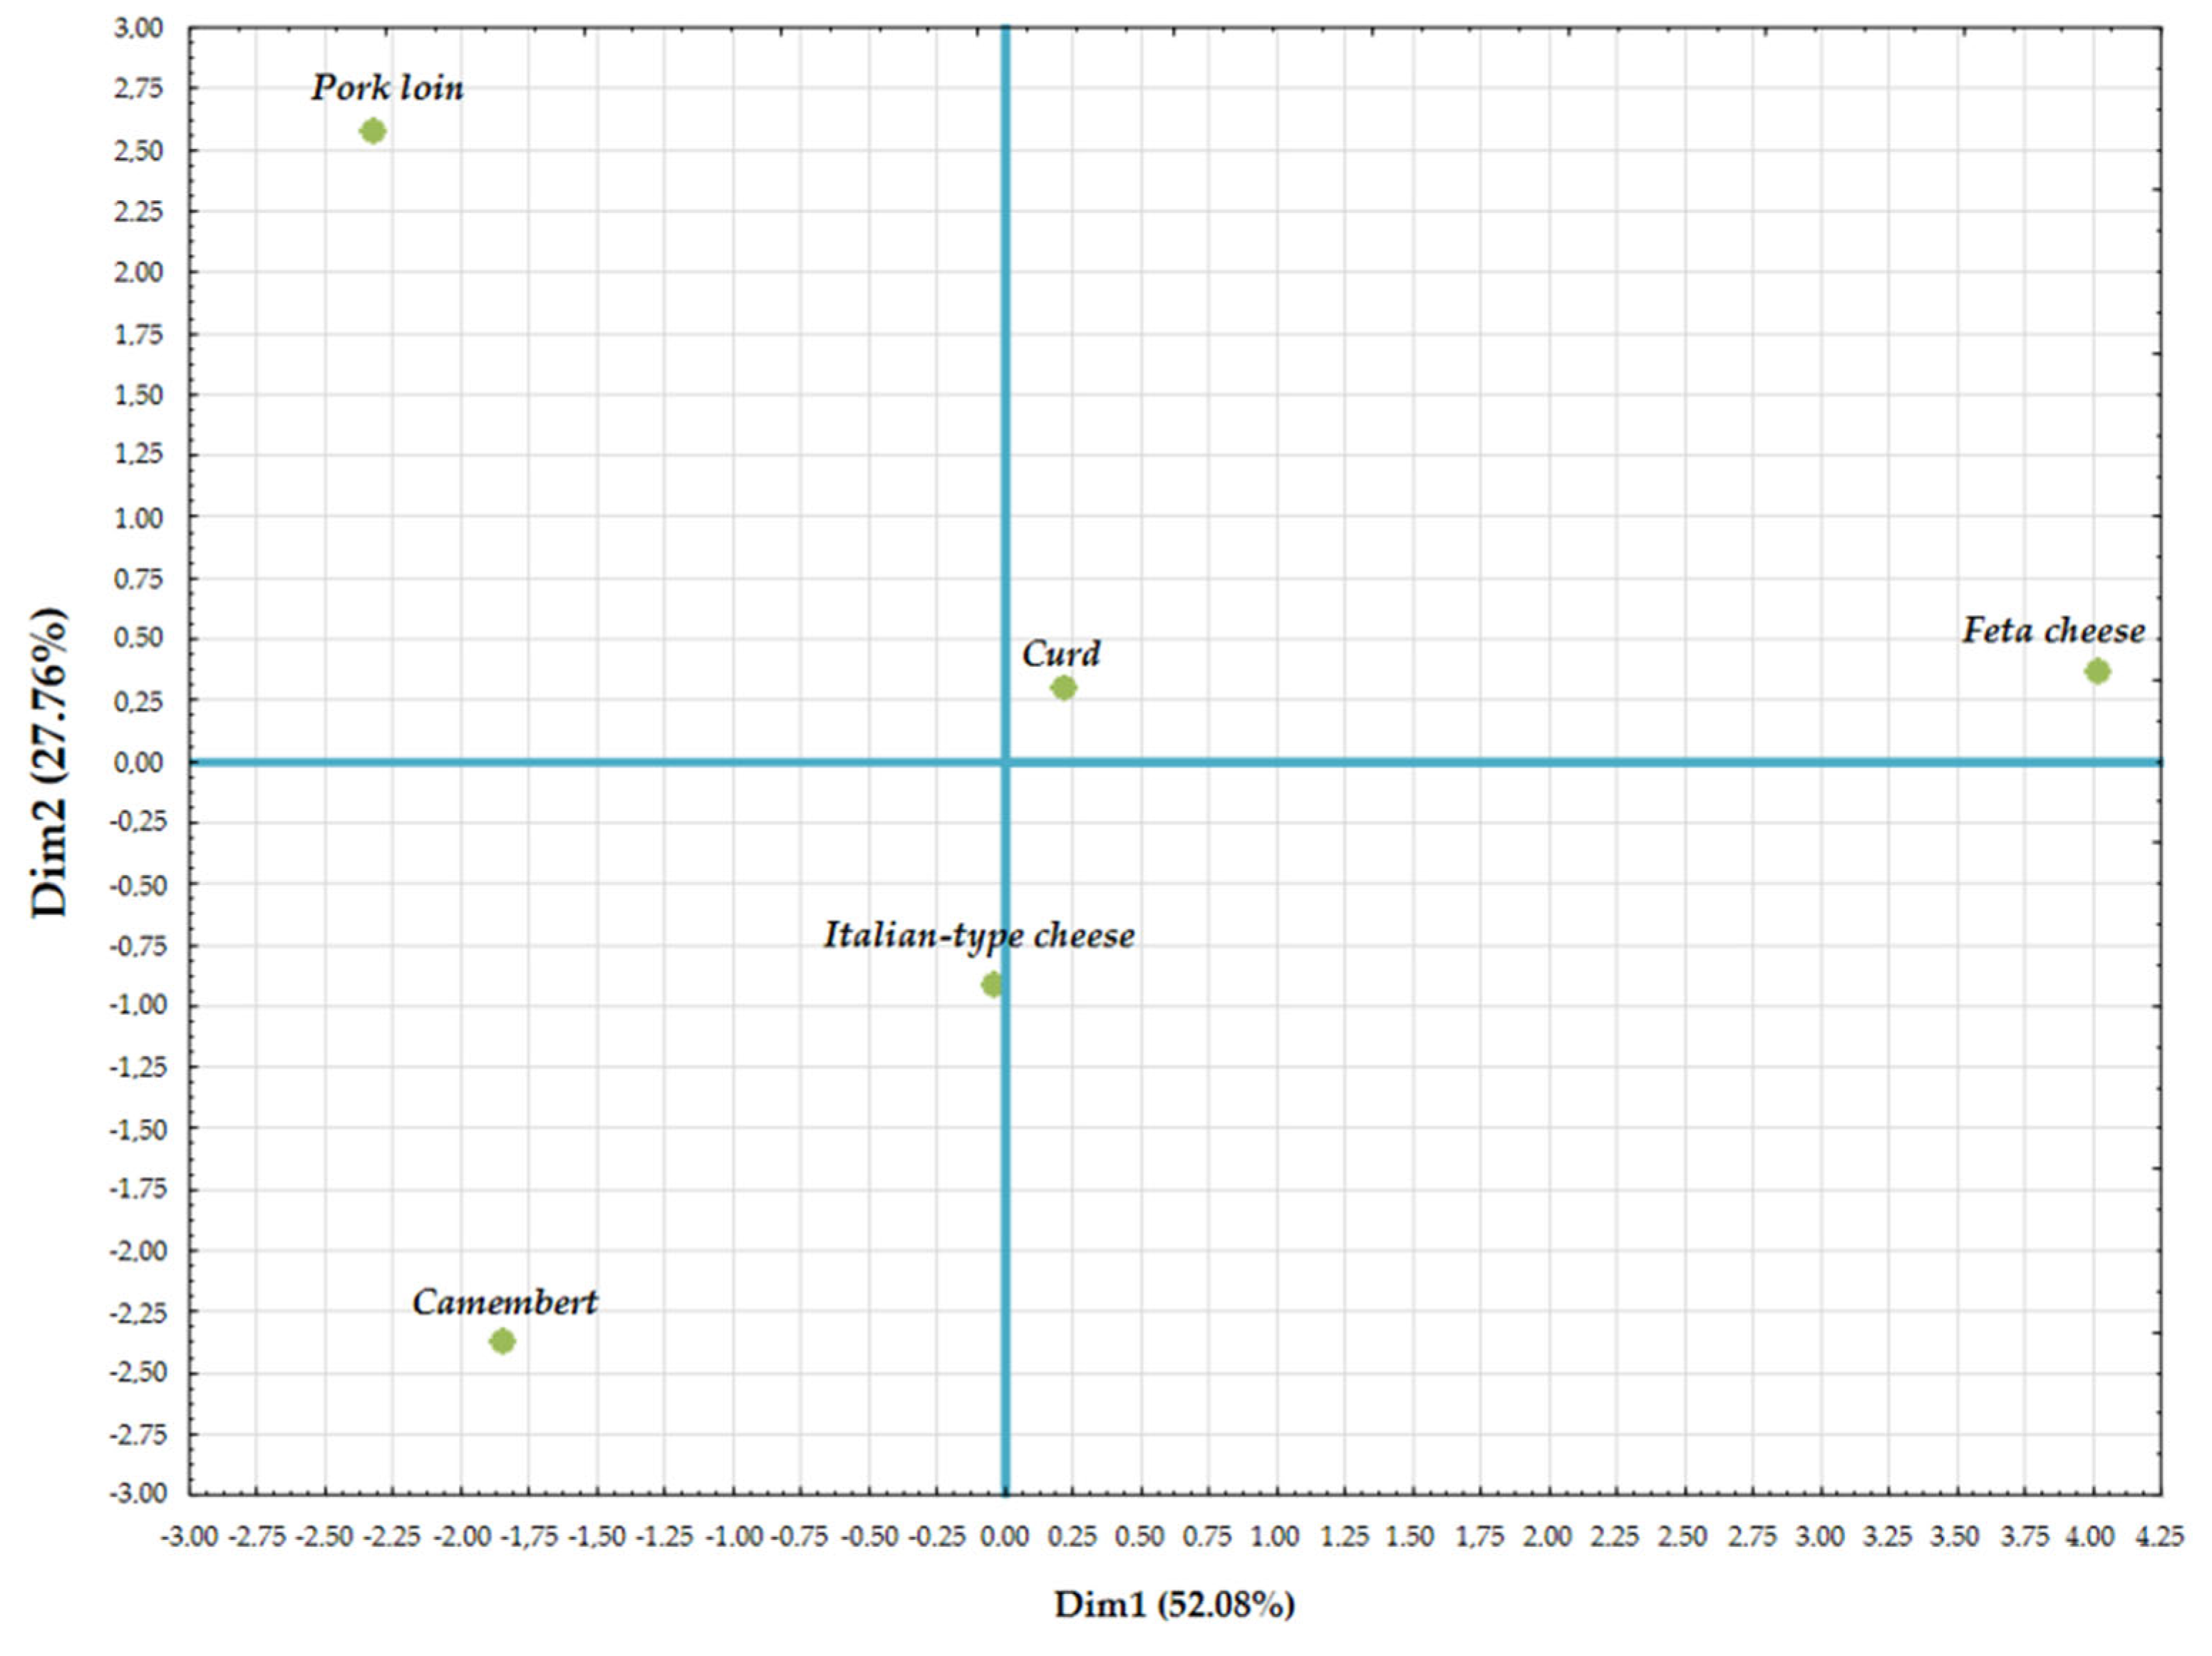
To check whether the smoking process had a comparable effect on the parameters of smoked products, a PCA analysis was prepared for selected product parameters, which is presented in Figure 12 and Figure 13:
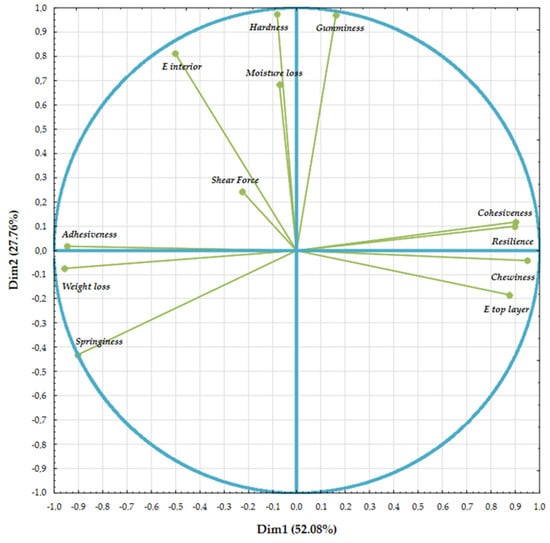
Figure 12.
The practical influence of the smoking process on changes in physical product parameters.
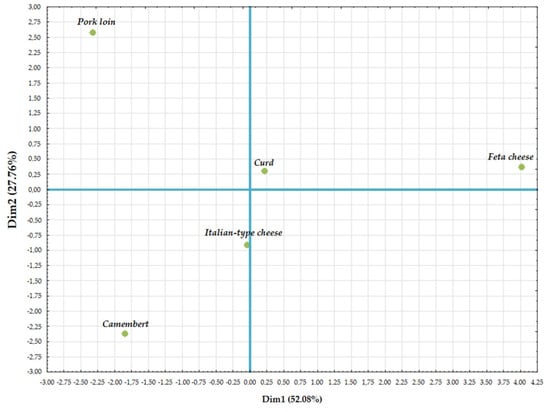
Figure 13.
Distribution of the practical changes in physical product parameters.
The principal component analysis showed that smoking has different effects on different products. The exceptions are the curd and Italian-type cheese, which show similar physical properties after smoking. This is most likely due to their granular and heterogeneous structure, which results in a similar penetration of smoke throughout the products. Both cheeses initially had a similar texture, so they smoked similarly. After smoking, they were still crumbly but no longer sticky. The pork loin, Camembert, and feta cheese show statistically significantly different physical properties after smoking. While, for the meat products, the differences result solely from the incomparable structure of the products to cheeses, for the cheeses, it may result from a higher fat content. This should be verified in further studies based on a description of the mechanisms of parameter changes during smoking, which have not been found in the scientific literature. The placement of the feta cheese was most influenced by cohesiveness, resilience, and chewiness, which confirms that the cheese became semi-hard and crusty. For the Camembert, springiness had the most potent effect, which directly increased its malleability. Another important observation is that pork loin becomes brighter inside while smoking, unlike cheese, so the ΔE interior parameter significantly impacted its placement.
4. Conclusions
The applied modifications of the smoking chamber allow for its stable operation in low-temperature conditions (below 25 °C) and smoking with smoke reheating (warm smoke at 60 °C). The presented research results are the first stage of constructing the experimental station. The design and control system built into the smoking chamber allows for the precise control of the temperature of food products subjected to the smoking process. The main limitation in the conducted research is that we were unable to control the pyrolysis temperature of the smoke-producing raw material. Based on the experiment performed, it was proven that the absolute difference in core temperature did not exceed 2.5% with varying process parameters between twelve meat and cheese samples. A long-term smoking process experiment guarantees stable process parameters and an adequate level of chamber smoke. The proper selection of the smoke duct allows for the supply of cool smoke. In addition, the condensate that formed in large quantities in the smoke duct proves the reduction of tar parts from the smoke while preserving its aroma. The applied modification of the smoke chamber allowed the low-temperature smoking process to be carried out continuously and controlled. The most important thing for smoke chambers is to regulate both the distribution of heat inside the device and the level of smoke during the process. The temperature at which the process is conducted must not be lower than the ambient temperature, as this causes the smoke to back up into the smoke chamber. For this reason, one of the recommendations is to conduct a low-temperature smoking process in winter and a high-temperature smoking process in summer. Smoke control also has an economic dimension since the smoke billowing inside the chamber not only causes a more thorough penetration of the products but also reduces the amount of woodchips used for smoking, thus lowering the power consumption needed for their pyrolysis. The analysis found that smoking causes the dehydration of products, which increases their hardness (except for Camembert) and degree of color change, especially surface color. Cheese products are more susceptible to color changes than meat. Texturally, pork becomes much more compact and firmer after smoking, which can affect its sensory acceptability. Smoking feta and Camembert cheese causes the top layer to harden, the water comes out more from the outside than the inside, and the inside becomes crumbly, creamy, or stringy. The publication verified the feasibility of conducting the smoking process on a specially designed test bench. The verification of changes in the physical parameters of the products will allow for the selection of process parameters that optimize the sensory properties of smoked products. The conducted research was a prelude to a publication series based on the influence of smoke components on the physicochemical properties of products and an attempt to optimize the content of smoke-derived substances in food.
Author Contributions
Conceptualization, E.N. and W.G.; methodology, D.B., E.N. and J.H.; software, D.B.; validation, K.C., E.N. and K.Ś.; formal analysis, K.C., W.G., E.N. and J.H.; investigation, K.Ś. and E.N.; resources, K.C. and E.N.; data curation, K.C. and E.N.; writing—original draft preparation, D.B., K.C. and E.N.; writing—review and editing, W.G., J.H. and E.N.; visualization, D.B., K.C. and W.G.; supervision, D.B. and W.G.; project administration, E.N. and W.G.; funding acquisition, W.G. and J.H. All authors have read and agreed to the published version of the manuscript.
Funding
This research received no external funding.
Institutional Review Board Statement
Not applicable.
Informed Consent Statement
Not applicable.
Data Availability Statement
Data are contained within the article.
Conflicts of Interest
The authors declare no conflicts of interest.
References
- Nizio, E.; Czwartkowski, K.; Niedbała, G. Impact of Smoking Technology on the Quality of Food Products: Absorption of Polycyclic Aromatic Hydrocarbons (PAHs) by Food Products during Smoking. Sustainability 2023, 15, 16890. [Google Scholar] [CrossRef]
- Sikorski, Z.E.; Sinkiewicz, I. Smoking: Traditional. In Encyclopedia of Meat Sciences, 2nd ed.; Dikeman, M., Devine, C., Eds.; Academic Press: Cambridge, MA, USA, 2014; pp. 321–327. [Google Scholar] [CrossRef]
- Kafouris, D.; Koukkidou, A.; Christou, E.; Hadjigeorgiou, M.; Yiannopoulos, S. Determination of Polycyclic Aromatic Hydrocarbons in Traditionally Smoked Meat Products and Charcoal Grilled Meat in Cyprus. Meat Sci. 2020, 164, 108088. [Google Scholar] [CrossRef]
- Ahmad, S.; Anzar, A.; Srivastava, A.K.; Srivastava, P.K. Effect of Curing, Antioxidant Treatment, and Smoking of Buffalo Meat on Ph, Total Plate Count, Sensory Characteristics, and Shelf Life during Refrigerated Storage. Int. J. Food Prop. 2005, 8, 139–150. [Google Scholar] [CrossRef]
- Yang, K.M.; Chiang, P.Y. Effects of Smoking Process on the Aroma Characteristics and Sensory Qualities of Dried Longan. Food Chem. 2019, 287, 133–138. [Google Scholar] [CrossRef]
- Arvanitoyannis, I.S.; Kotsanopoulos, K.V. Smoking of fish and seafood: History, methods and effects on physical, nutritional and microbiological properties. Food Bioprocess. Technol. 2012, 5, 831–853. [Google Scholar] [CrossRef]
- Cardinal, M.; Knockaert, C.; Torrissen, O.; Sigurgisladottir, S.; Mørkøre, T.; Thomassen, M.; Vallet, J.L. Relation of smoking parameters to the yield, colour and sensory quality of smoked Atlantic salmon (Salmo salar). Food Res. Int. 2001, 34, 537–550. [Google Scholar] [CrossRef]
- Birkeland, S.; Rørå, A.M.B.; Skåra, T.; Bjerkeng, B. Effects of Cold Smoking Procedures and Raw Material Characteristics on Product Yield and Quality Parameters of Cold Smoked Atlantic salmon (Salmo salar L.) Fillets. Food Res. Int. 2004, 37, 273–286. [Google Scholar] [CrossRef]
- Gómez-Estaca, J.; Gómez-Guillén, M.C.; Montero, P.; Sopelana, P.; Guillén, M.D. Oxidative stability, volatile components and polycyclic aromatic hydrocarbons of cold–smoked sardine (Sardina pilchardus) and dolphinfish (Coryphaena hippurus). LWT Food Sci. Technol. 2011, 44, 1517–1524. [Google Scholar] [CrossRef]
- Plaza-Bolaños, P.; Frenich, A.G.; Vidal, J.L.M. Polycyclic Aromatic Hydrocarbons in Food and Beverages. Analytical Methods and Trends. J. Chromatogr. A 2010, 1217, 6303–6326. [Google Scholar] [CrossRef]
- Sharma, C.; Swaney-Stueve, M.; Severns, B.; Talavera, M. Using Correspondence Analysis to Evaluate Consumer Terminology and Understand the Effects of Smoking Method and Type of Wood on the Sensory Perception of Smoked Meat. J. Sens. Stud. 2019, 34, e12535. [Google Scholar] [CrossRef]
- Stumpe-Viksna, I.; Bartkevičs, V.; Kukare, A.; Morozovs, A. Polycyclic Aromatic Hydrocarbons in Meat Smoked with Different Types of Wood. Food Chem. 2008, 110, 794–797. [Google Scholar] [CrossRef]
- Hitzel, A.; Pöhlmann, M.; Schwägele, F.; Speer, K.; Jira, W. Polycyclic Aromatic Hydrocarbons (PAH) and Phenolic Substances in Meat Products Smoked with Different Types of Wood and Smoking Spices. Food Chem. 2013, 139, 955–962. [Google Scholar] [CrossRef]
- Yahya, H.; Linforth, R.S.T.; Cook, D.J. Flavour generation during commercial barley and malt roasting operations: A time coure study. Food Chem. 2014, 145, 378–387. [Google Scholar] [CrossRef]
- Ledesma, E.; Rendueles, M.; Díaz, M. Contamination of Meat Products during Smoking by Polycyclic Aromatic Hydrocarbons: Processes and Prevention. Food Control. 2016, 60, 64–87. [Google Scholar] [CrossRef]
- Flores, M.; Mora, L.; Reig, M.; Toldrá, F. Risk Assessment of Chemical Substances of Safety Concern Generated in Processed Meats. Food Sci. Hum. Wellness 2019, 8, 244–251. [Google Scholar] [CrossRef]
- Chen, S.; Kao, T.H.; Chen, C.J.; Huang, C.W.; Chen, B.H. Reduction of Carcinogenic Polycyclic Aromatic Hydrocarbons in Meat by Sugar-Smoking and Dietary Exposure Assessment in Taiwan. J. Agric. Food Chem. 2013, 61, 7645–7653. [Google Scholar] [CrossRef]
- Zhu, Y.; Peng, Z.; Wang, M.; Wang, R.; Rui, L. Optimization of Extraction Procedure for Formaldehyde Assay in Smoked Meat Products. J. Food Compos. Anal. 2012, 28, 1–7. [Google Scholar] [CrossRef]
- Du, H.; Liu, Q.; Chen, Q.; Xia, X.; Xu, M.; Kong, B. Effect of Woodchip Types on Heterocyclic Aromatic Amine Formation and Quality Characteristics of Smoked Bacon. Food Biosci. 2022, 47, 101709. [Google Scholar] [CrossRef]
- Nkhata, S.G. Total Color Change (ΔE∗) Is a Poor Estimator of Total Carotenoids Lost during Post-Harvest Storage of Biofortified Maize Grains. Heliyon 2020, 6, e05173. [Google Scholar] [CrossRef]
- Bhat, Z.F.; Morton, J.D.; Bekhit, A.E.; Kumar, S.; Bhat, H.F. Thermal processing implications on the digestibility of meat, fish and seafood proteins. Compr. Rev. Food Sci. Food Saf. 2021, 20, 4511–4548. [Google Scholar] [CrossRef]
- Ledesma, E.; Laca, A.; Rendueles, M.; Díaz, M. Texture, colour and optical characteristics of a meat product depending on smoking time and casing type. LWT Food Sci. Technol. 2016, 65, 164–172. [Google Scholar] [CrossRef]
- Racovita, R.C.; Secuianu, C.; Ciuca, M.D.; Israel-Roming, F. Effects of smoking temperature, smoking time, and type of wood sawdust on polycyclic aromatic hydrocarbon accumulation levels in directly smoked pork sausages. J. Agric. Food Chem. 2020, 68, b9530–b9536. [Google Scholar] [CrossRef]
- Guo, J.; Wang, Q.; Chen, C.; Yu, H.; Xu, B. Effects of different smoking methods on sensory properties, free amino acids and volatile compounds in bacon. J. Sci. Food Agric. 2020, 101, 2984–2993. [Google Scholar] [CrossRef]
- Varlet, V.; Prost, C.; Sérot, T. Volatile aldehydes in smoked fish: Analysis methods, occurrence and mechanisms of formation. Food Chem. 2007, 105, 1536–1556. [Google Scholar] [CrossRef]
- Odoli, C.O.; Odour-Odote, P.; Arason, S. The influence of lipid content and pretreatment methods on protein conformation in fish (capelin, Mallotus villosus) during smoking and drying. Food Sci. Nutr. 2019, 7, 1446–1454. [Google Scholar] [CrossRef]
- Xin, X.; Ghoreishi, K.; An, G.; Zhao, W.; Baroutian, S. The effect of liquid smoke obtained from fast pyrolysis of a hardwood on physical properties and shelf life of cheddar cheese. Eur. Food Res. Technol. 2022, 248, 625–633. [Google Scholar] [CrossRef]
Disclaimer/Publisher’s Note: The statements, opinions and data contained in all publications are solely those of the individual author(s) and contributor(s) and not of MDPI and/or the editor(s). MDPI and/or the editor(s) disclaim responsibility for any injury to people or property resulting from any ideas, methods, instructions or products referred to in the content. |
© 2025 by the authors. Licensee MDPI, Basel, Switzerland. This article is an open access article distributed under the terms and conditions of the Creative Commons Attribution (CC BY) license (https://creativecommons.org/licenses/by/4.0/).

