
Study on the Evolution Process of Snow Cover in Wind-Induced Railway Embankments and the Control Effect of Snow Fences


Abstract
1. Introduction
2. Methodology
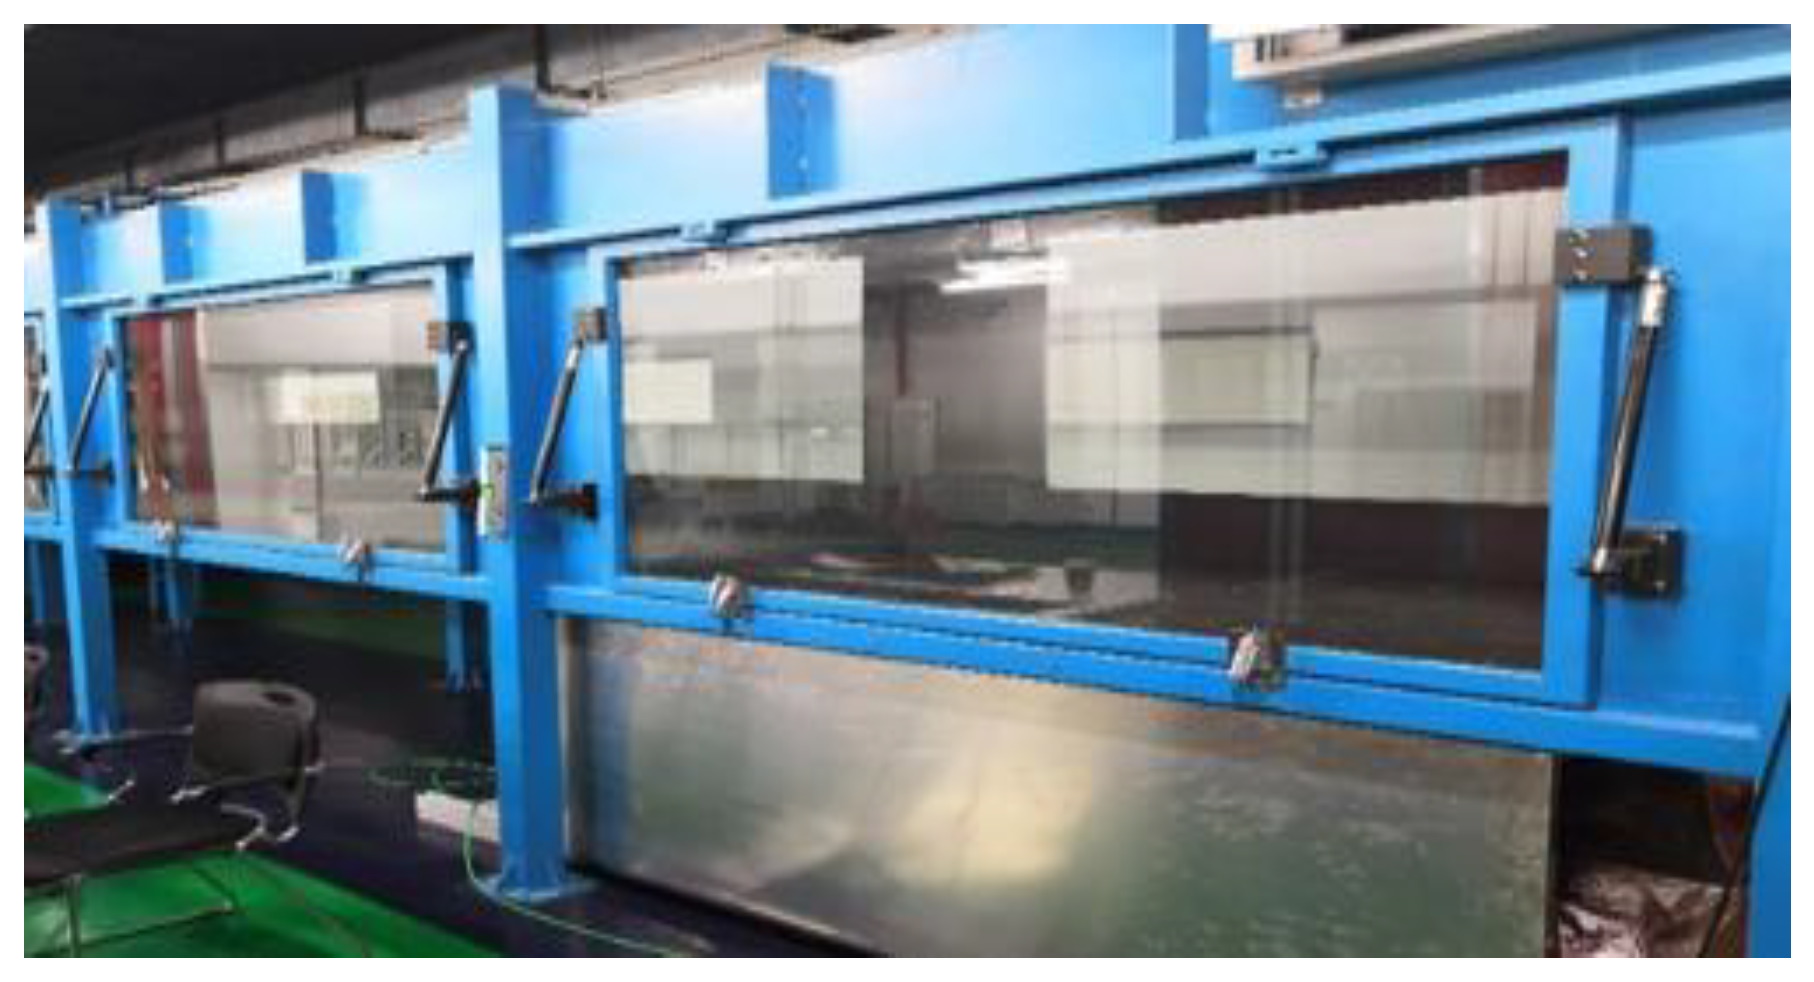
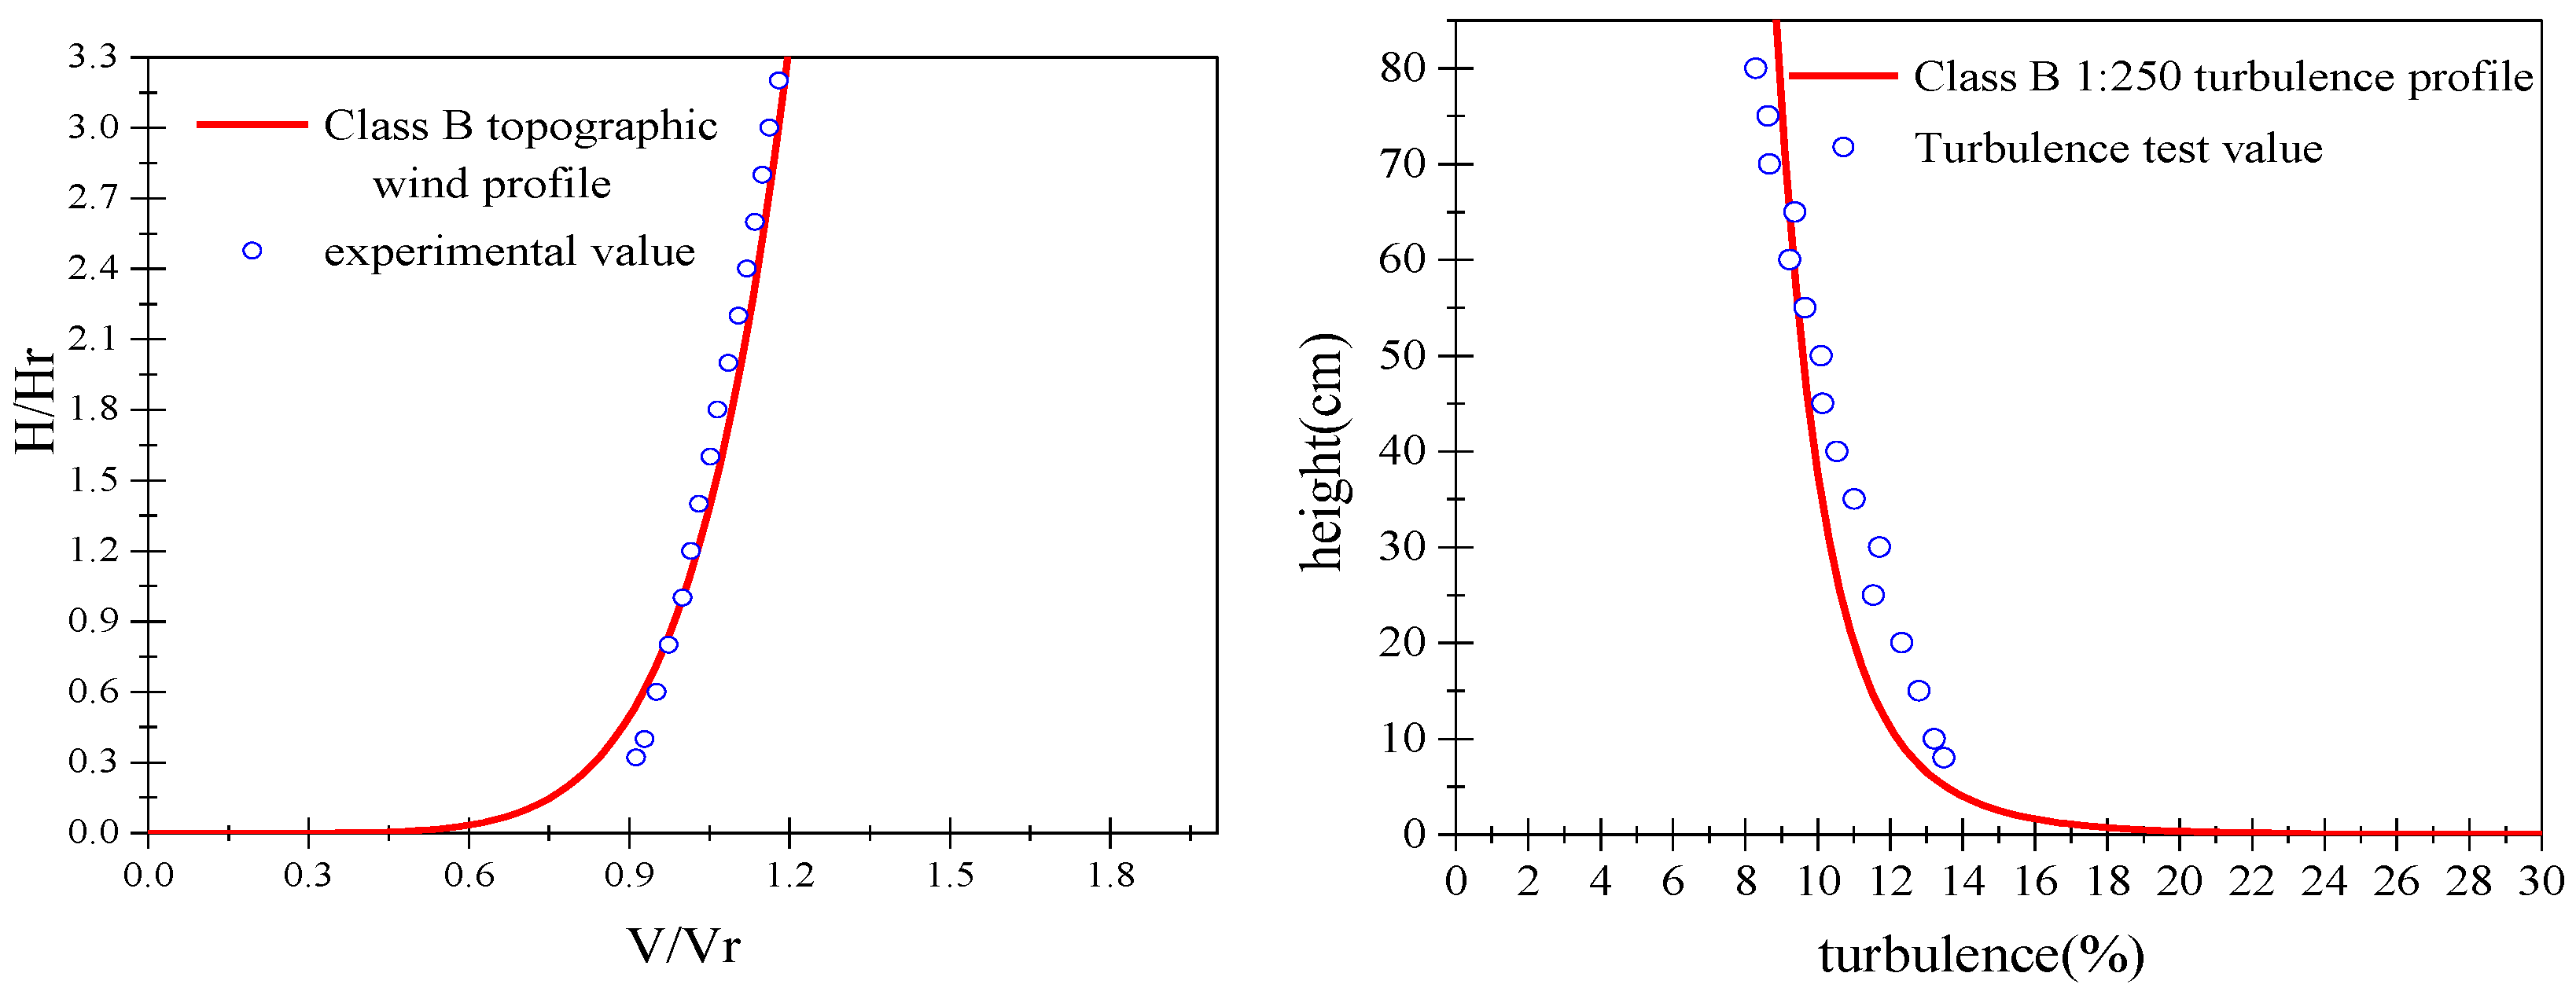
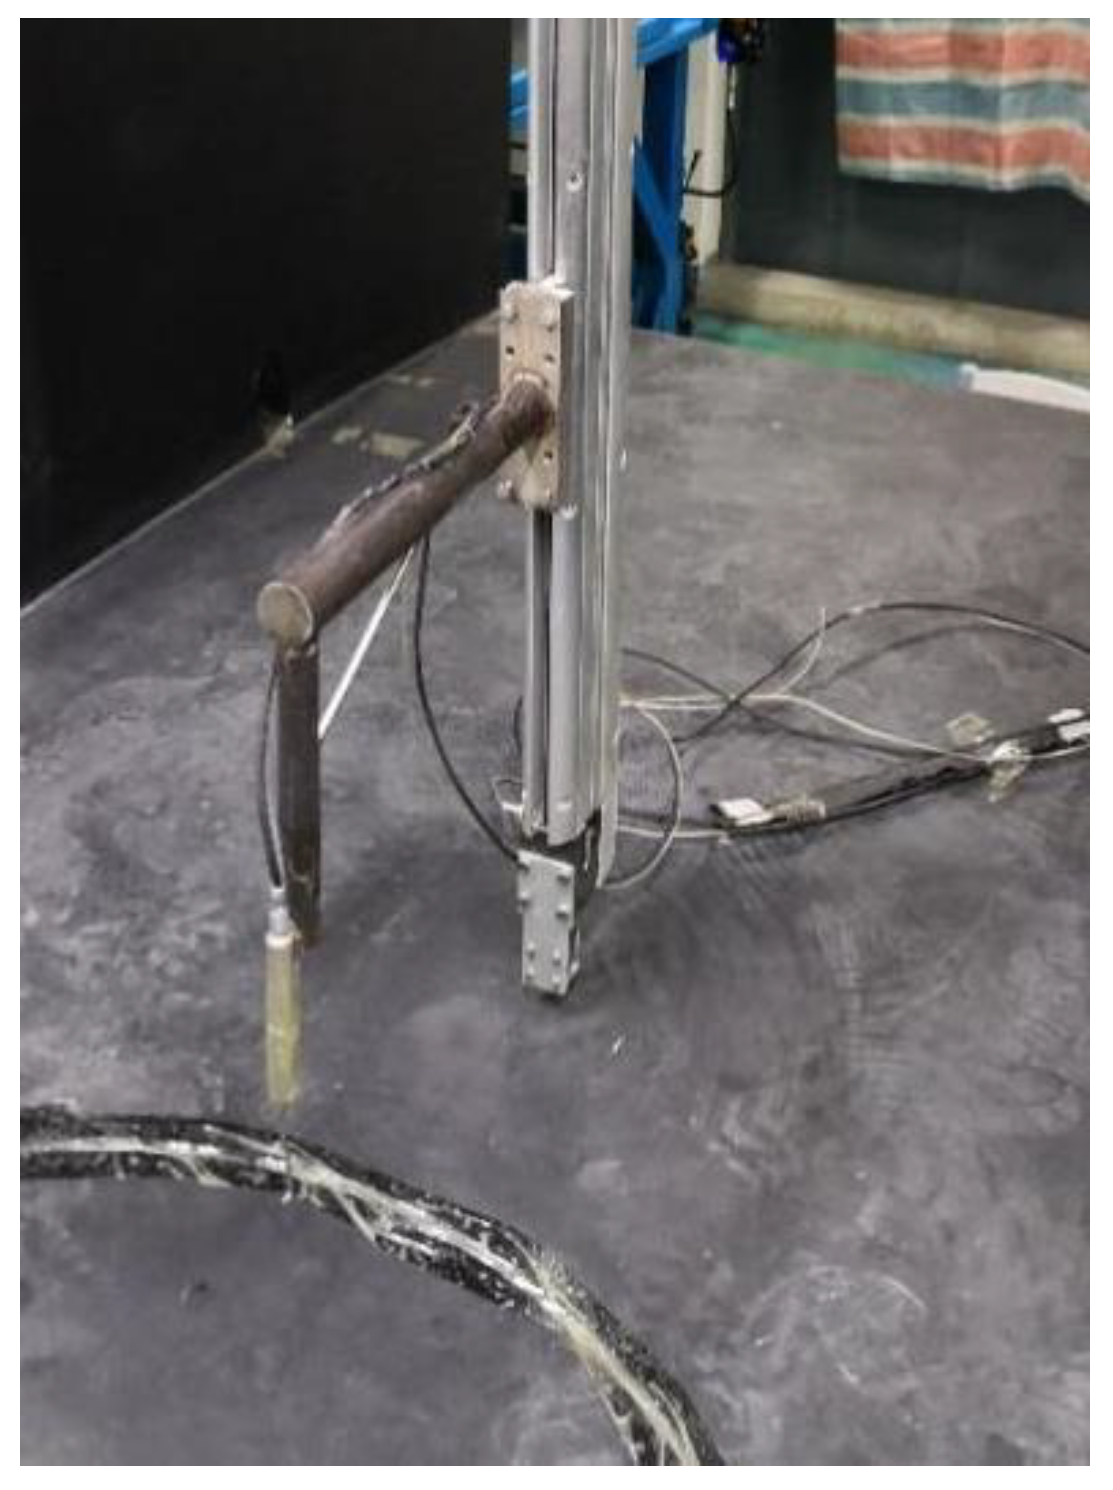
2.1. Wind Tunnel Testing Equipment and Parameter Settings
2.2. Similarity Criteria
2.3. Test Materials
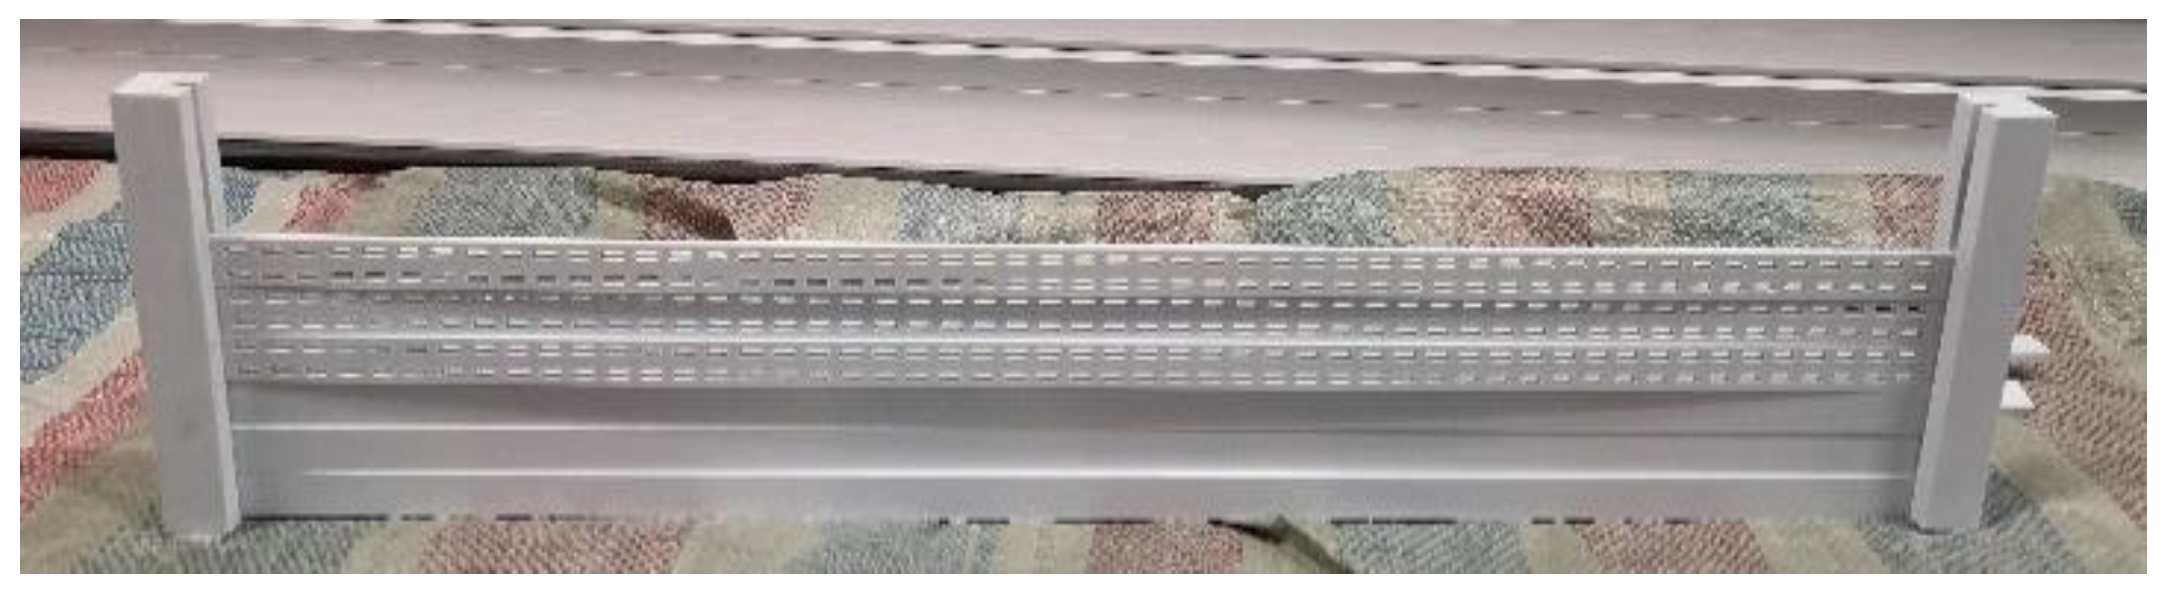
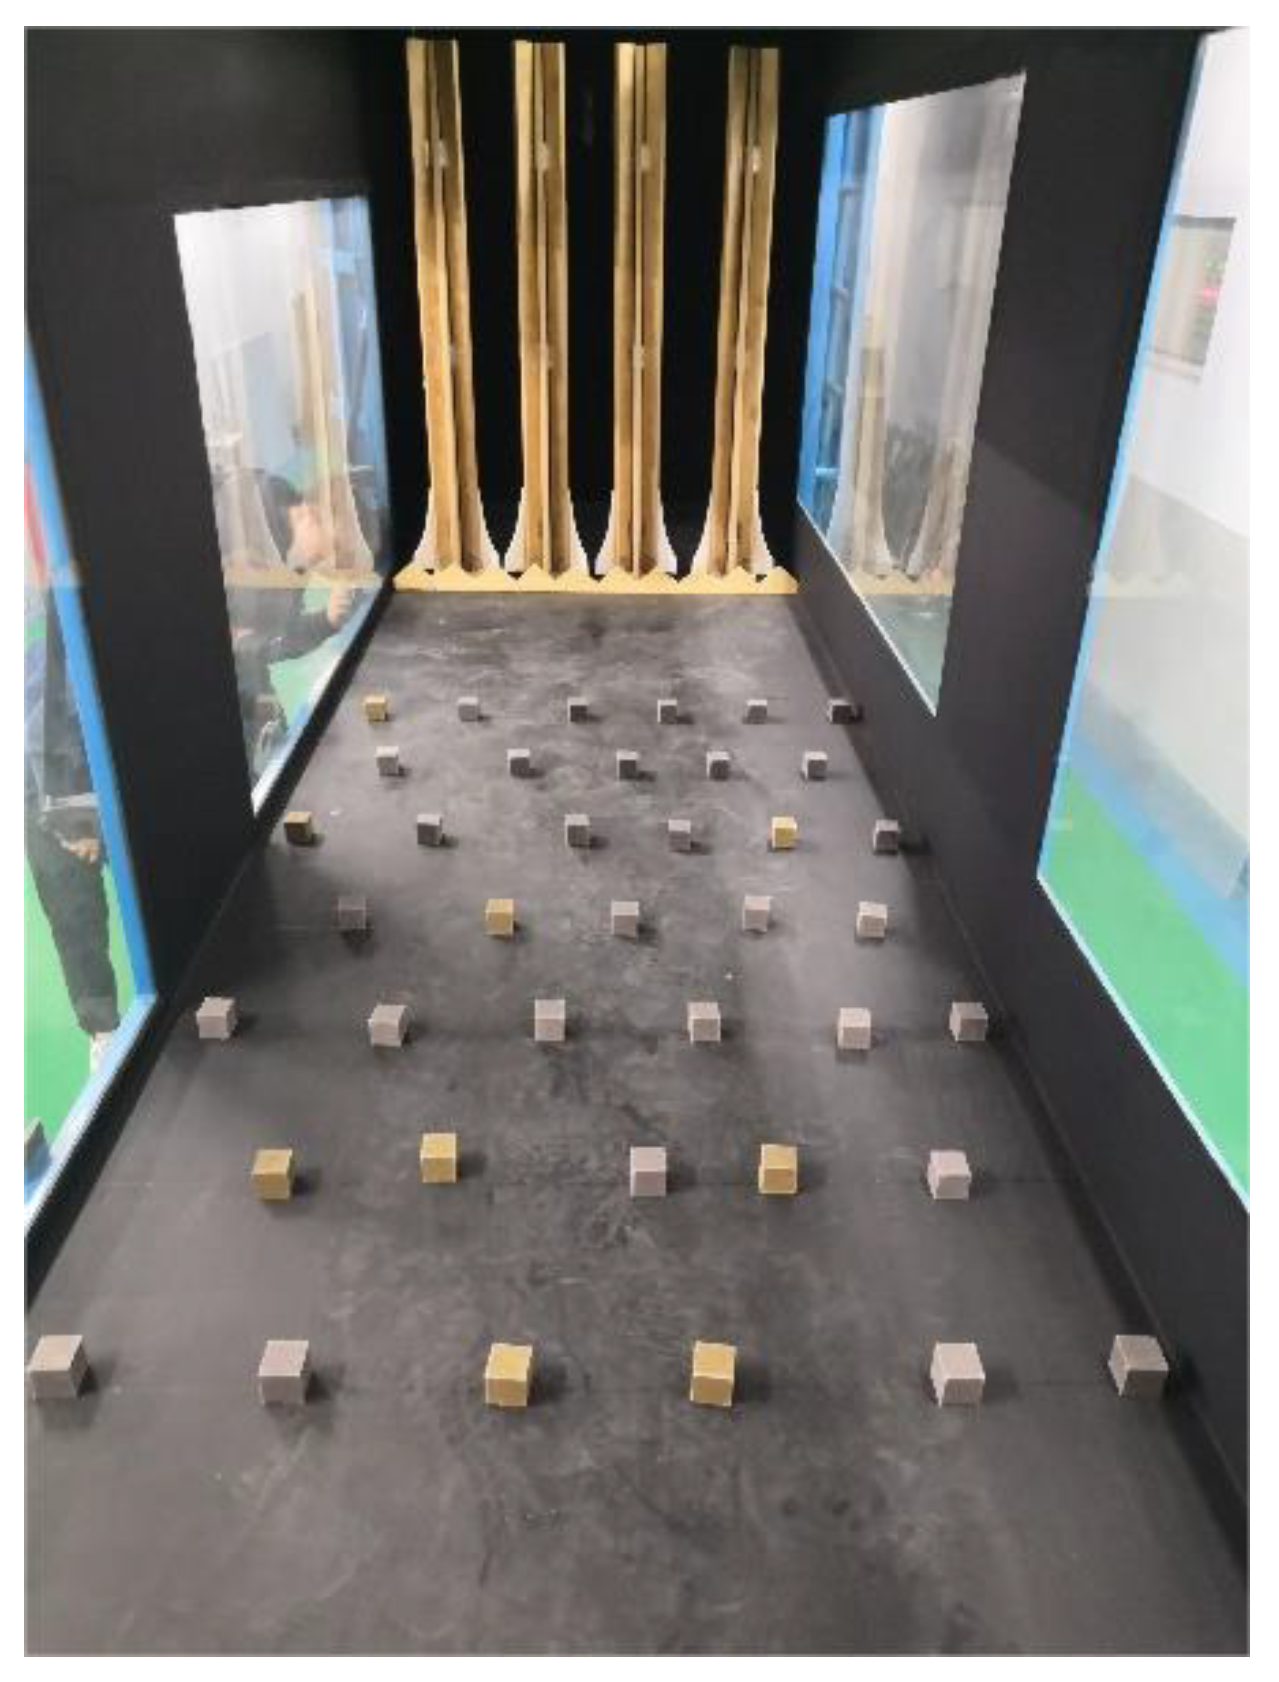
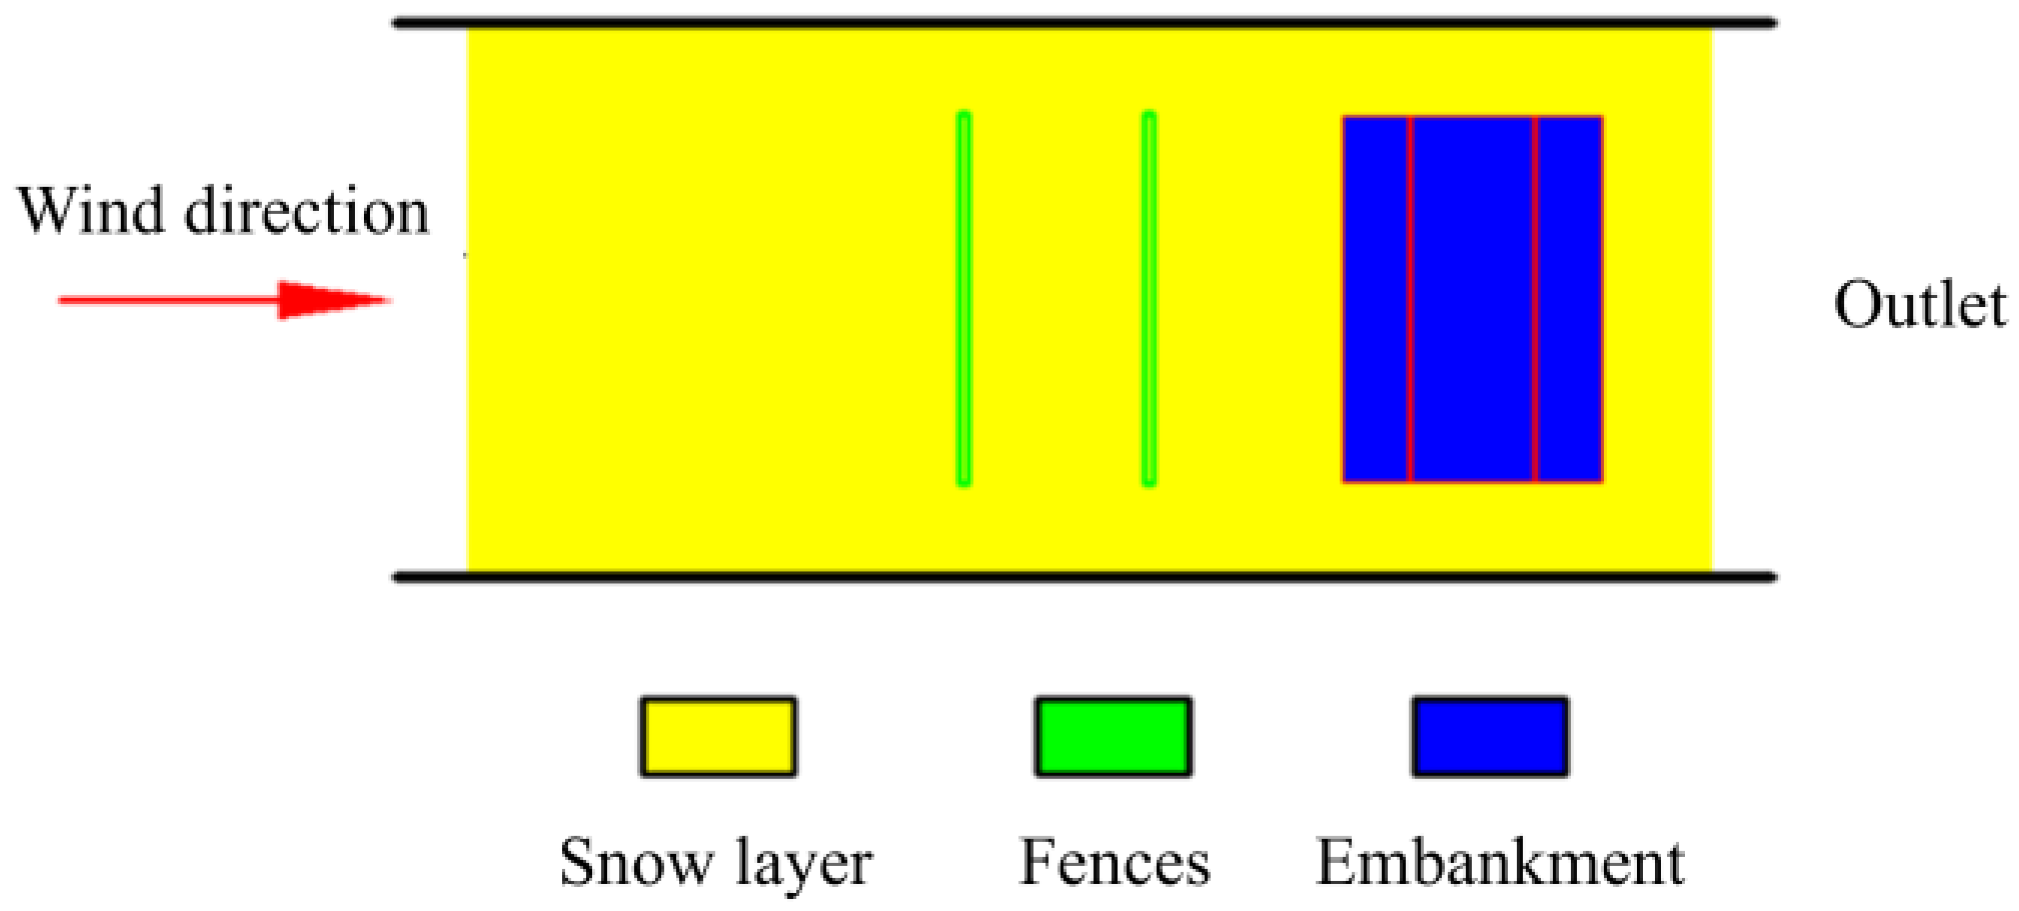
2.3.1. Test Model
2.3.2. Test Particles
2.4. Test Parameters
3. Results and Discuss
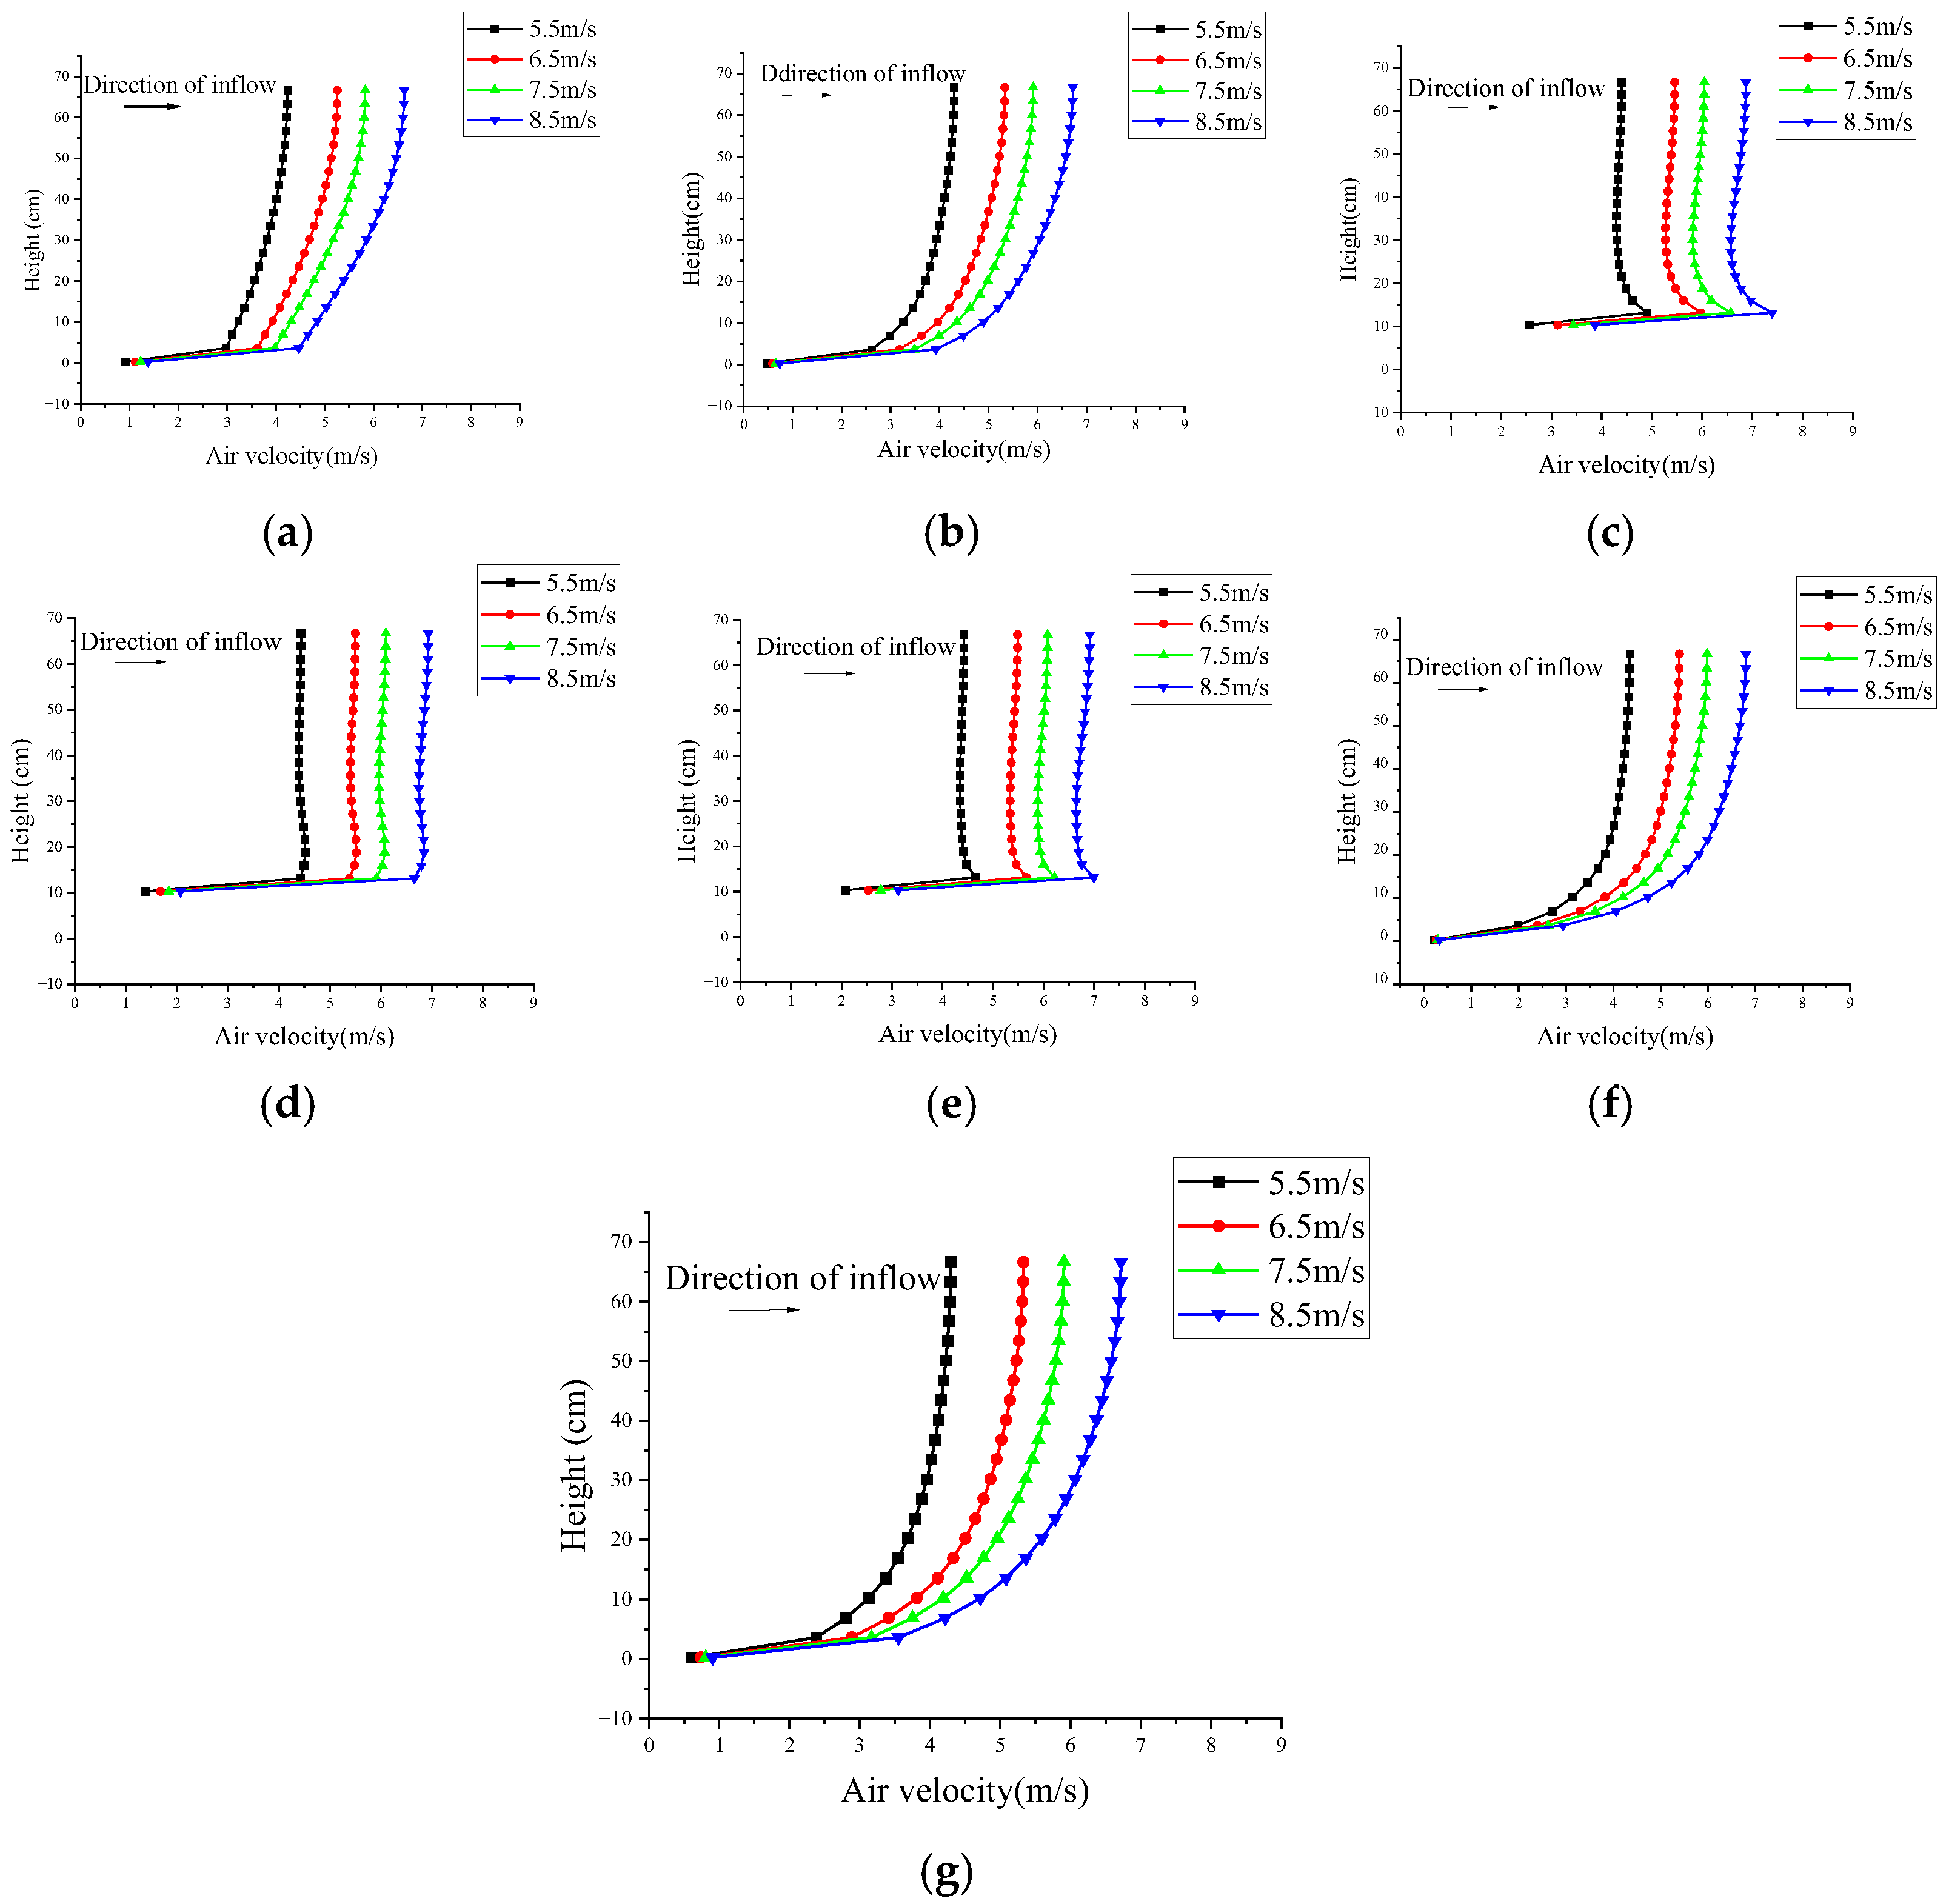
3.1. Wind Field Evolution Law
3.2. Snow Cover Distribution Pattern
3.3. Flow Field Regulation Mechanism of Snow Prevention Fence
3.4. Analysis of Snow Fences and Snow Cover Distribution
4. Conclusions
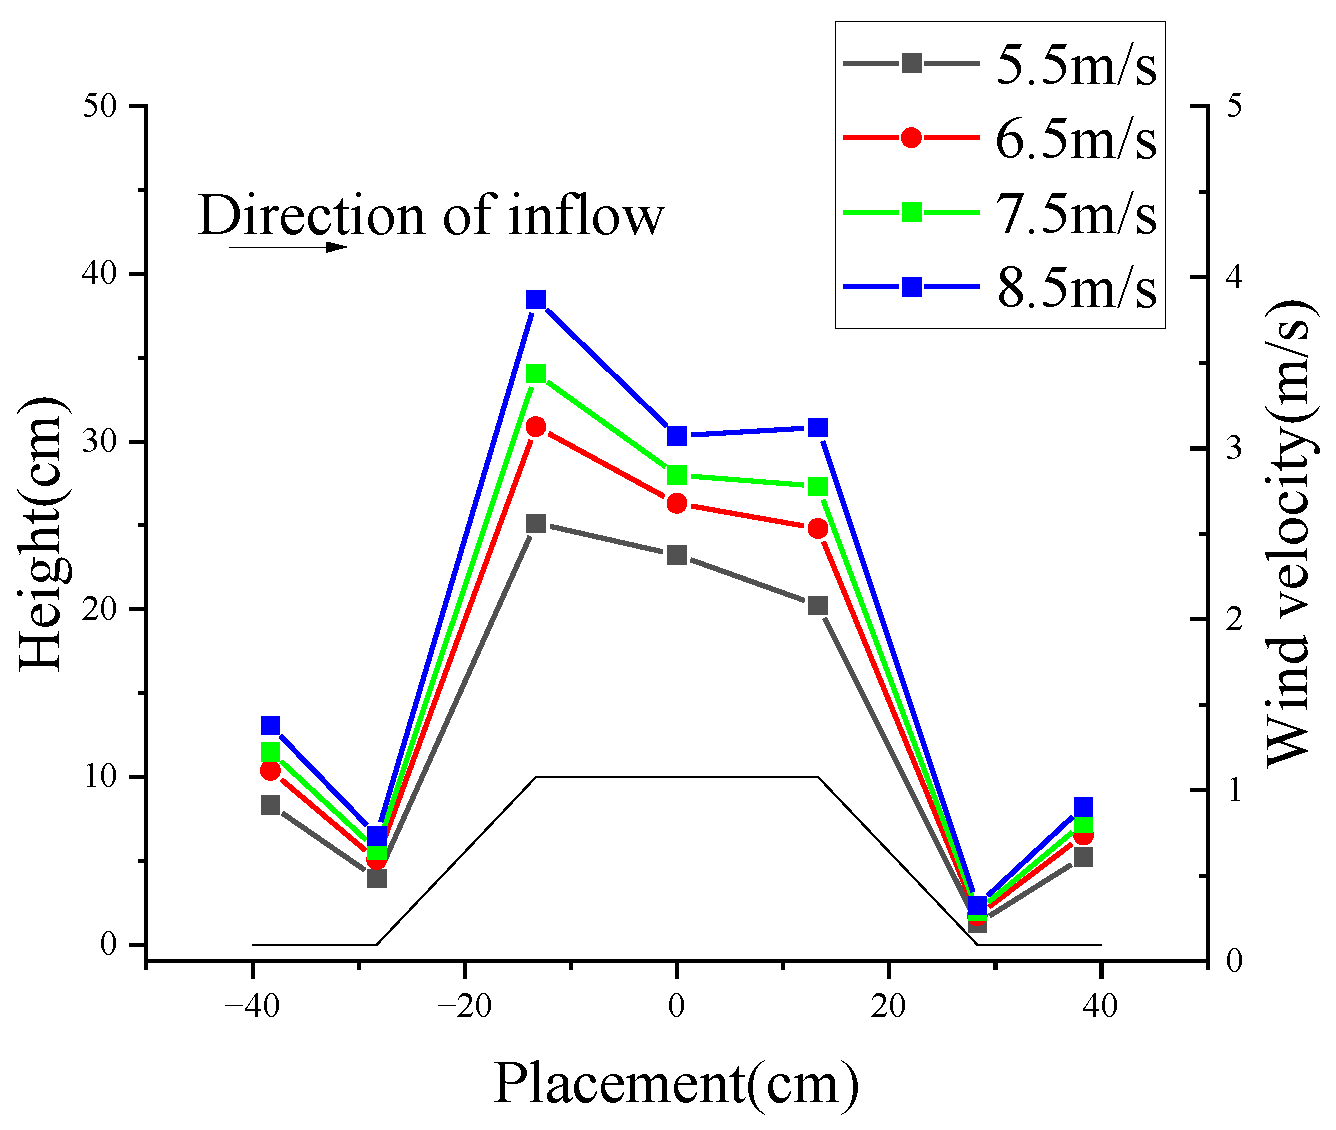
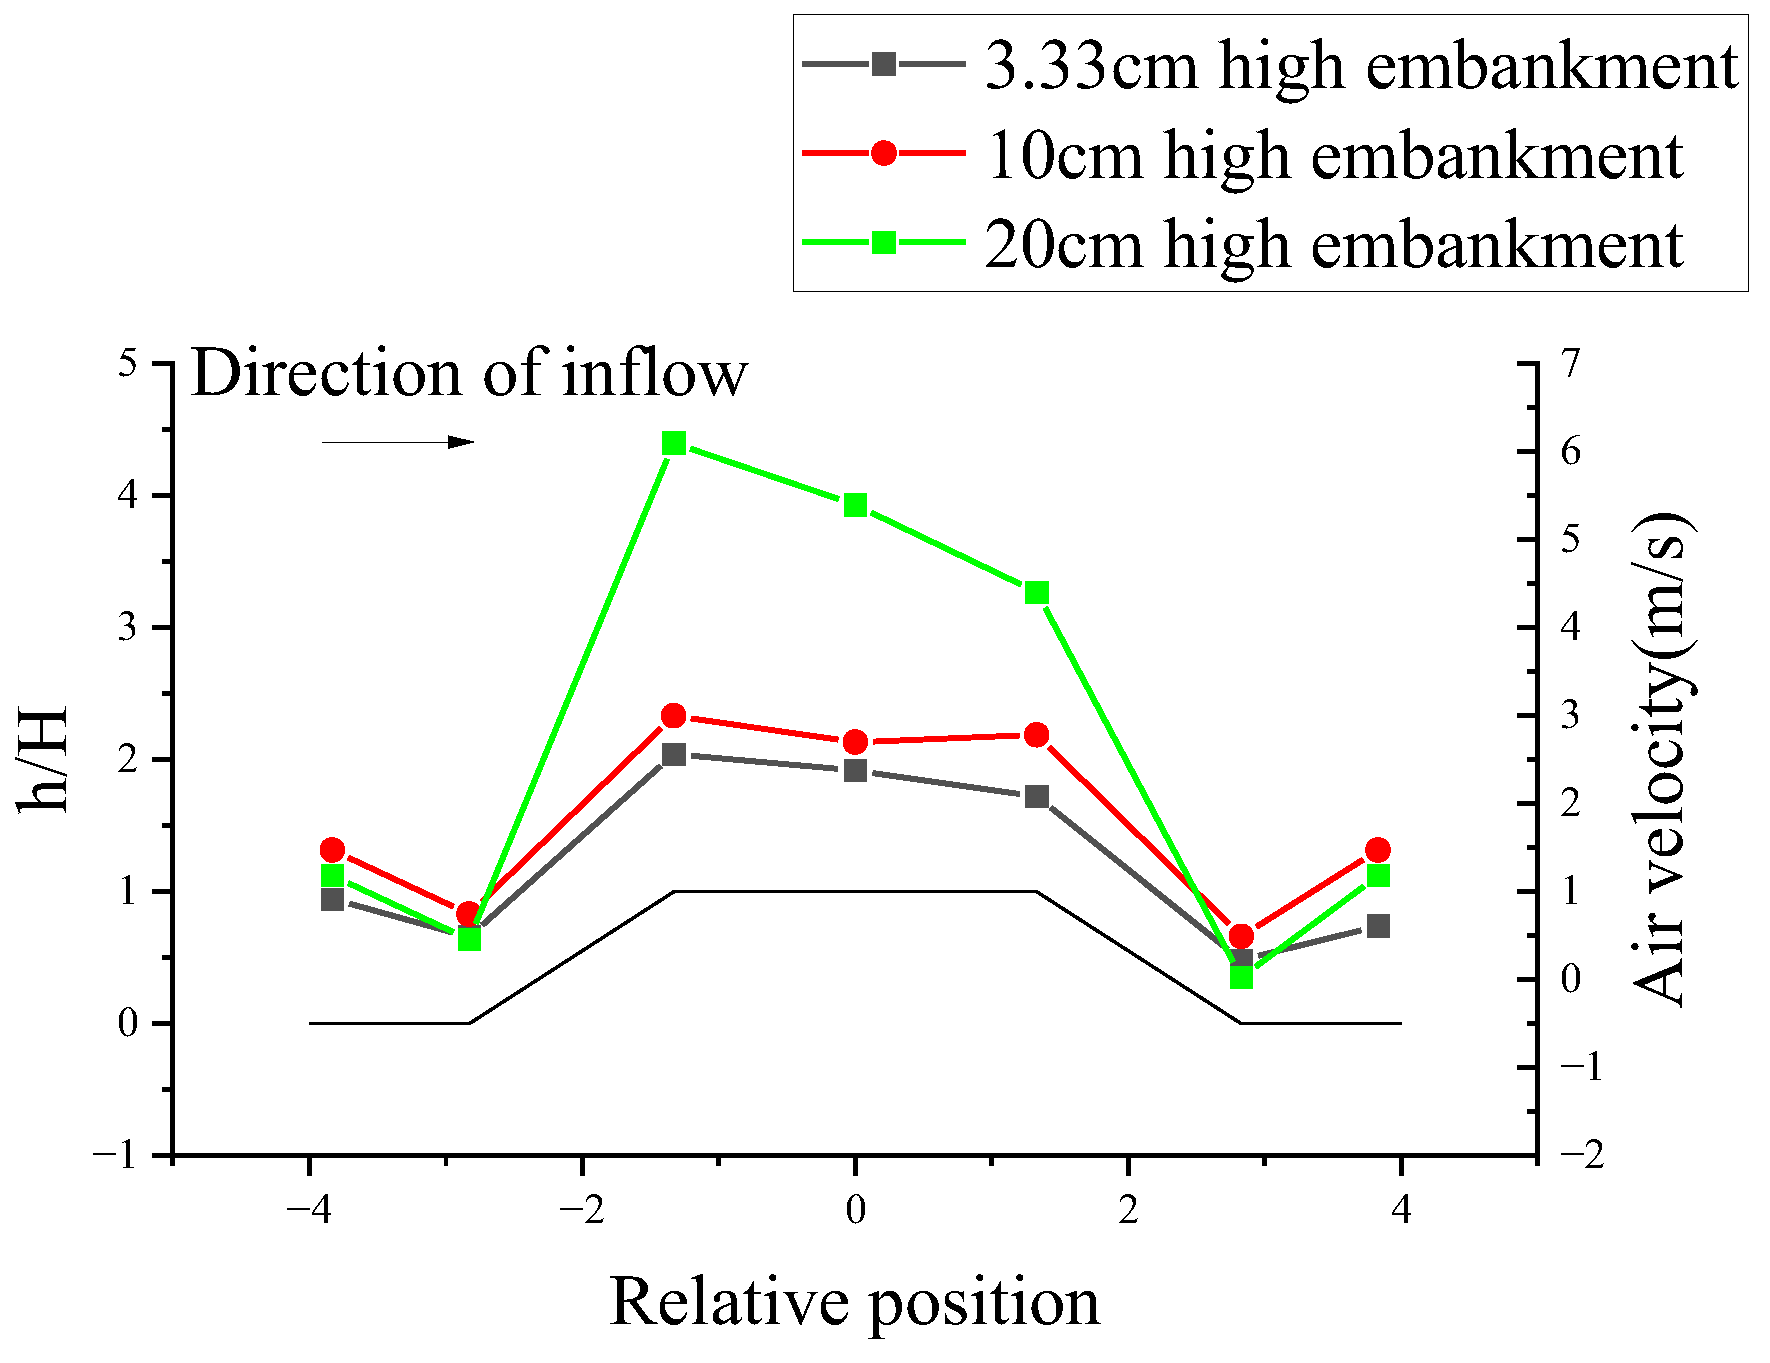
- When the snow flow passes over the embankment, the wind speed on the windward slope is greater than that on the leeward slope. At the same cross-section, wind speed increases with height until it stabilizes. The lowest wind speed is found at the foot of the leeward slope, while the wind speed is relatively high at the surface of the embankment. As the height of the embankment increases, the wind speed at the foot of the leeward slope decreases. The wind speed at the surface of the subgrade increases with the height of the embankment.
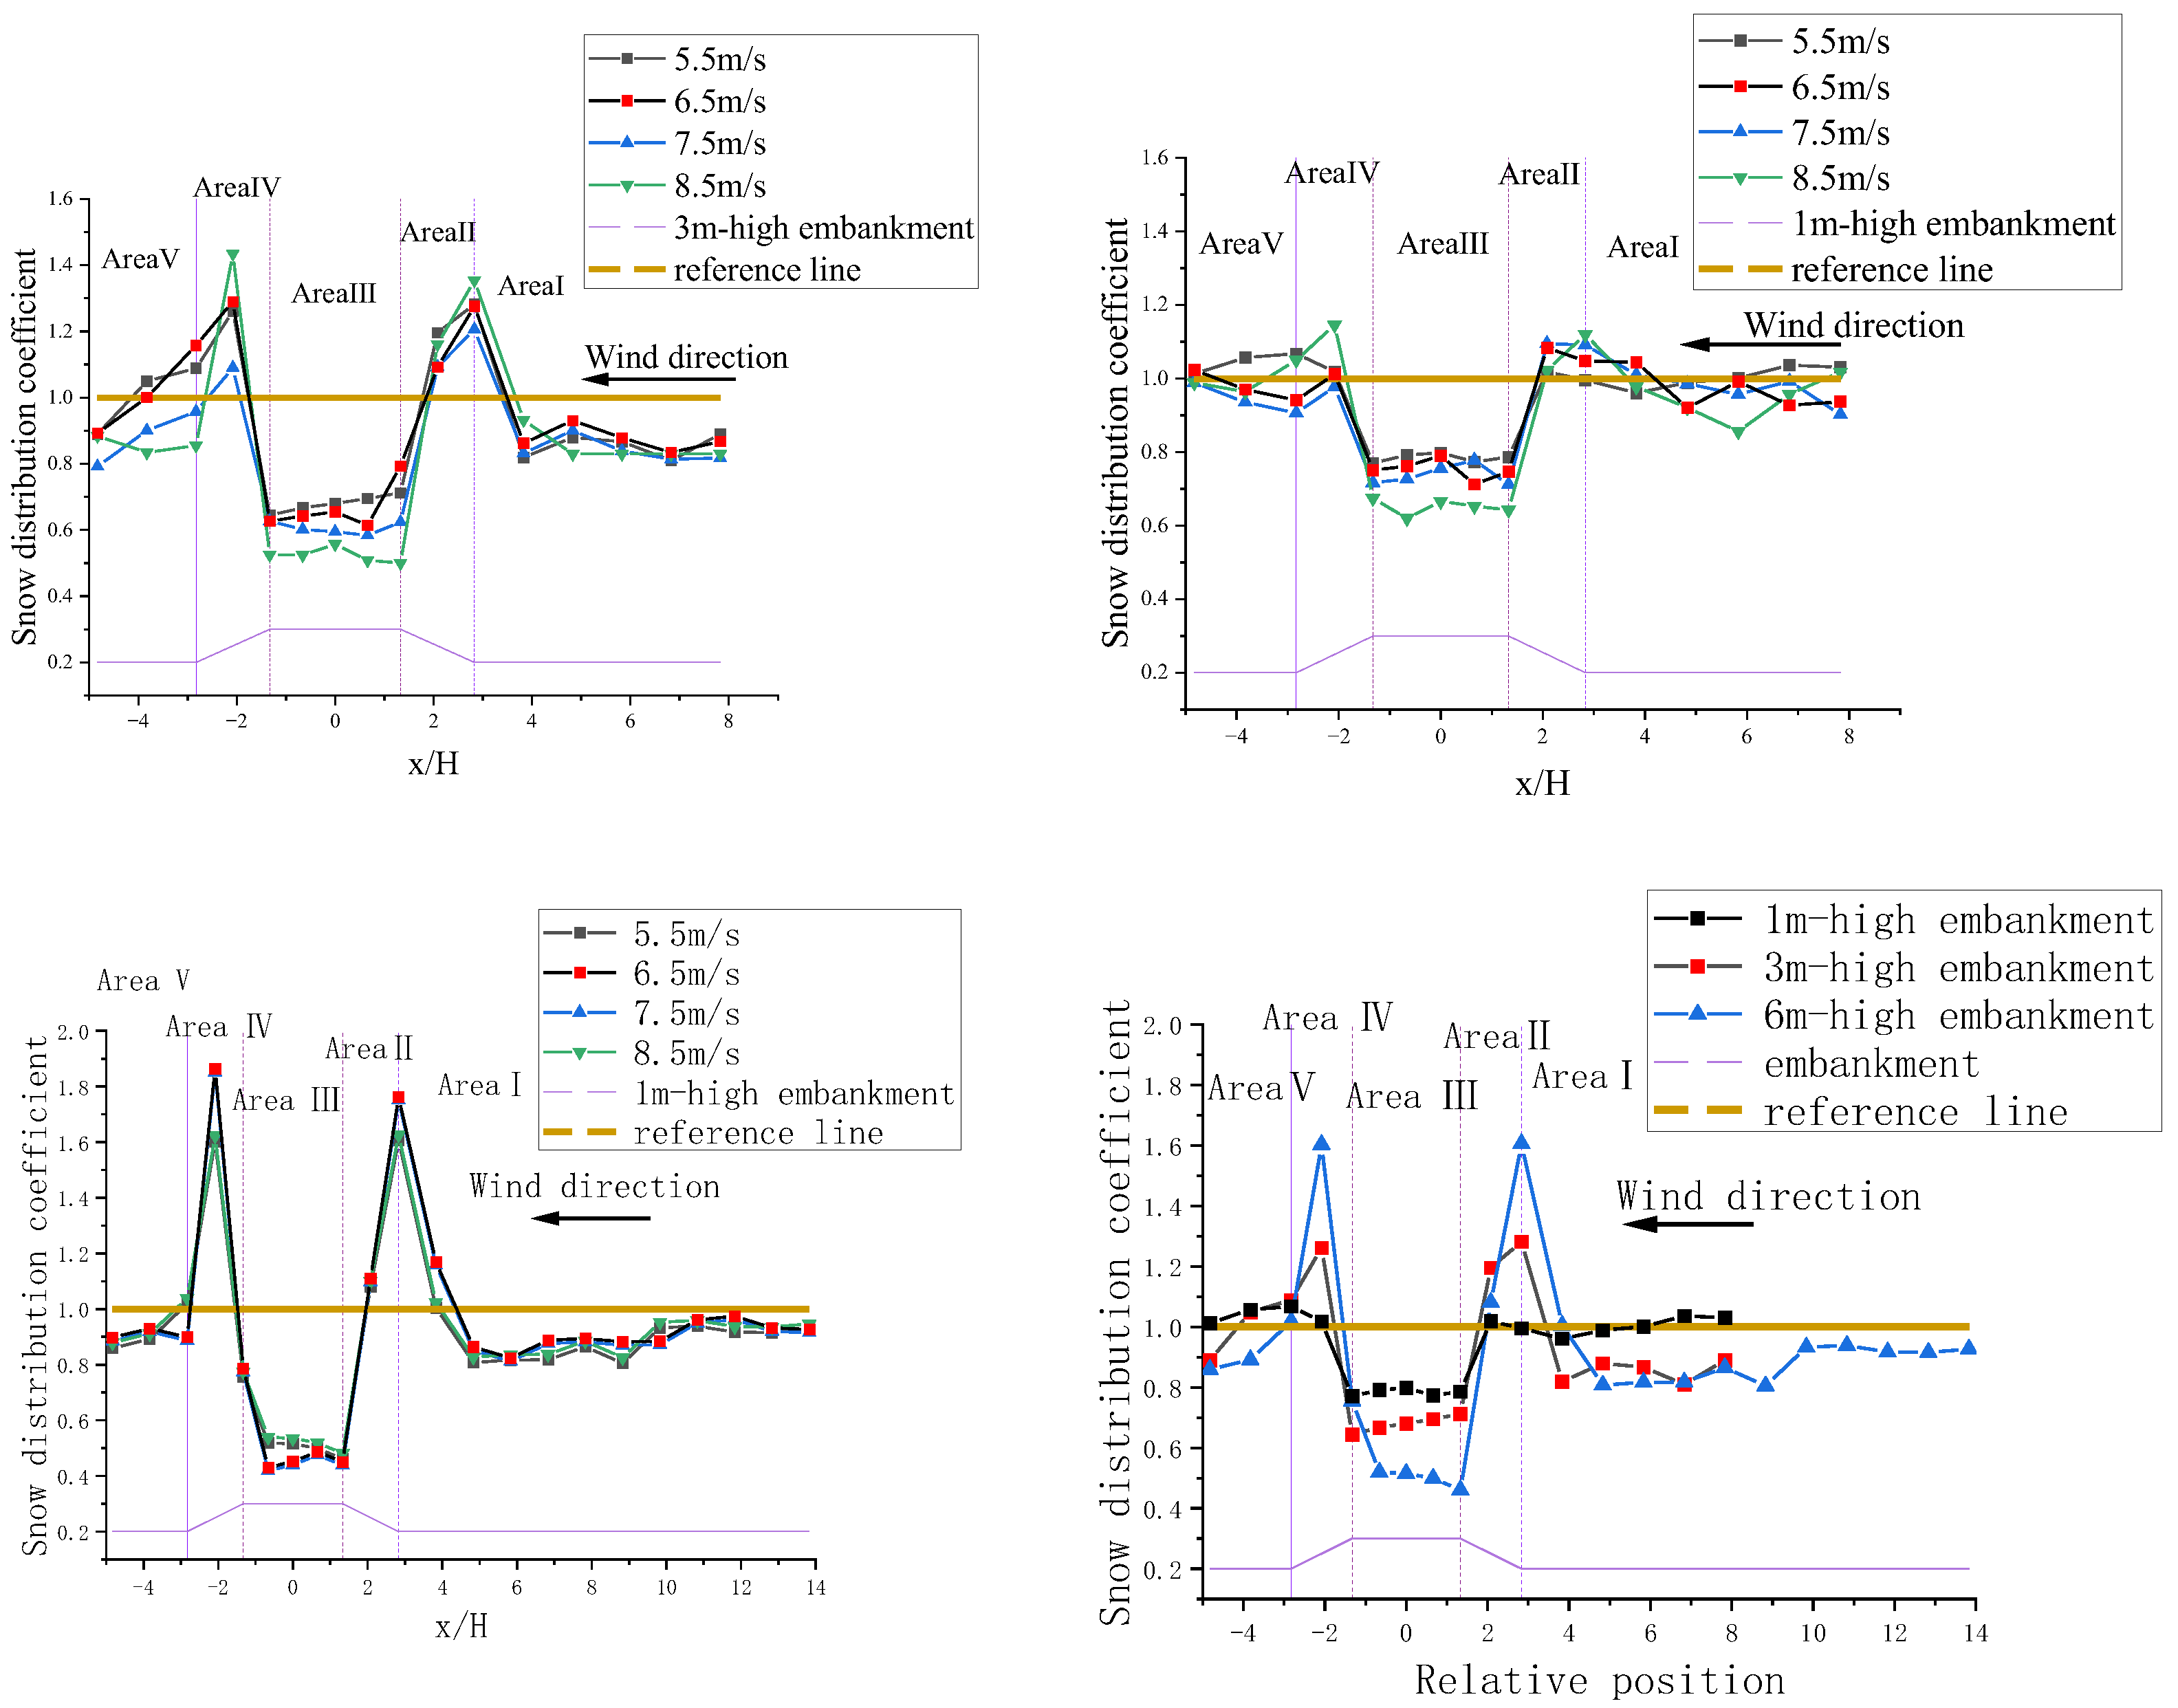
- The overall snow thickness exhibits a “U”-shaped distribution. Regardless of the height of the embankment, the overall snow distribution coefficient is less than 1. The higher the embankment, the smaller the snow distribution coefficient. The greater the wind speed, the thicker the snow accumulation on the subgrade.
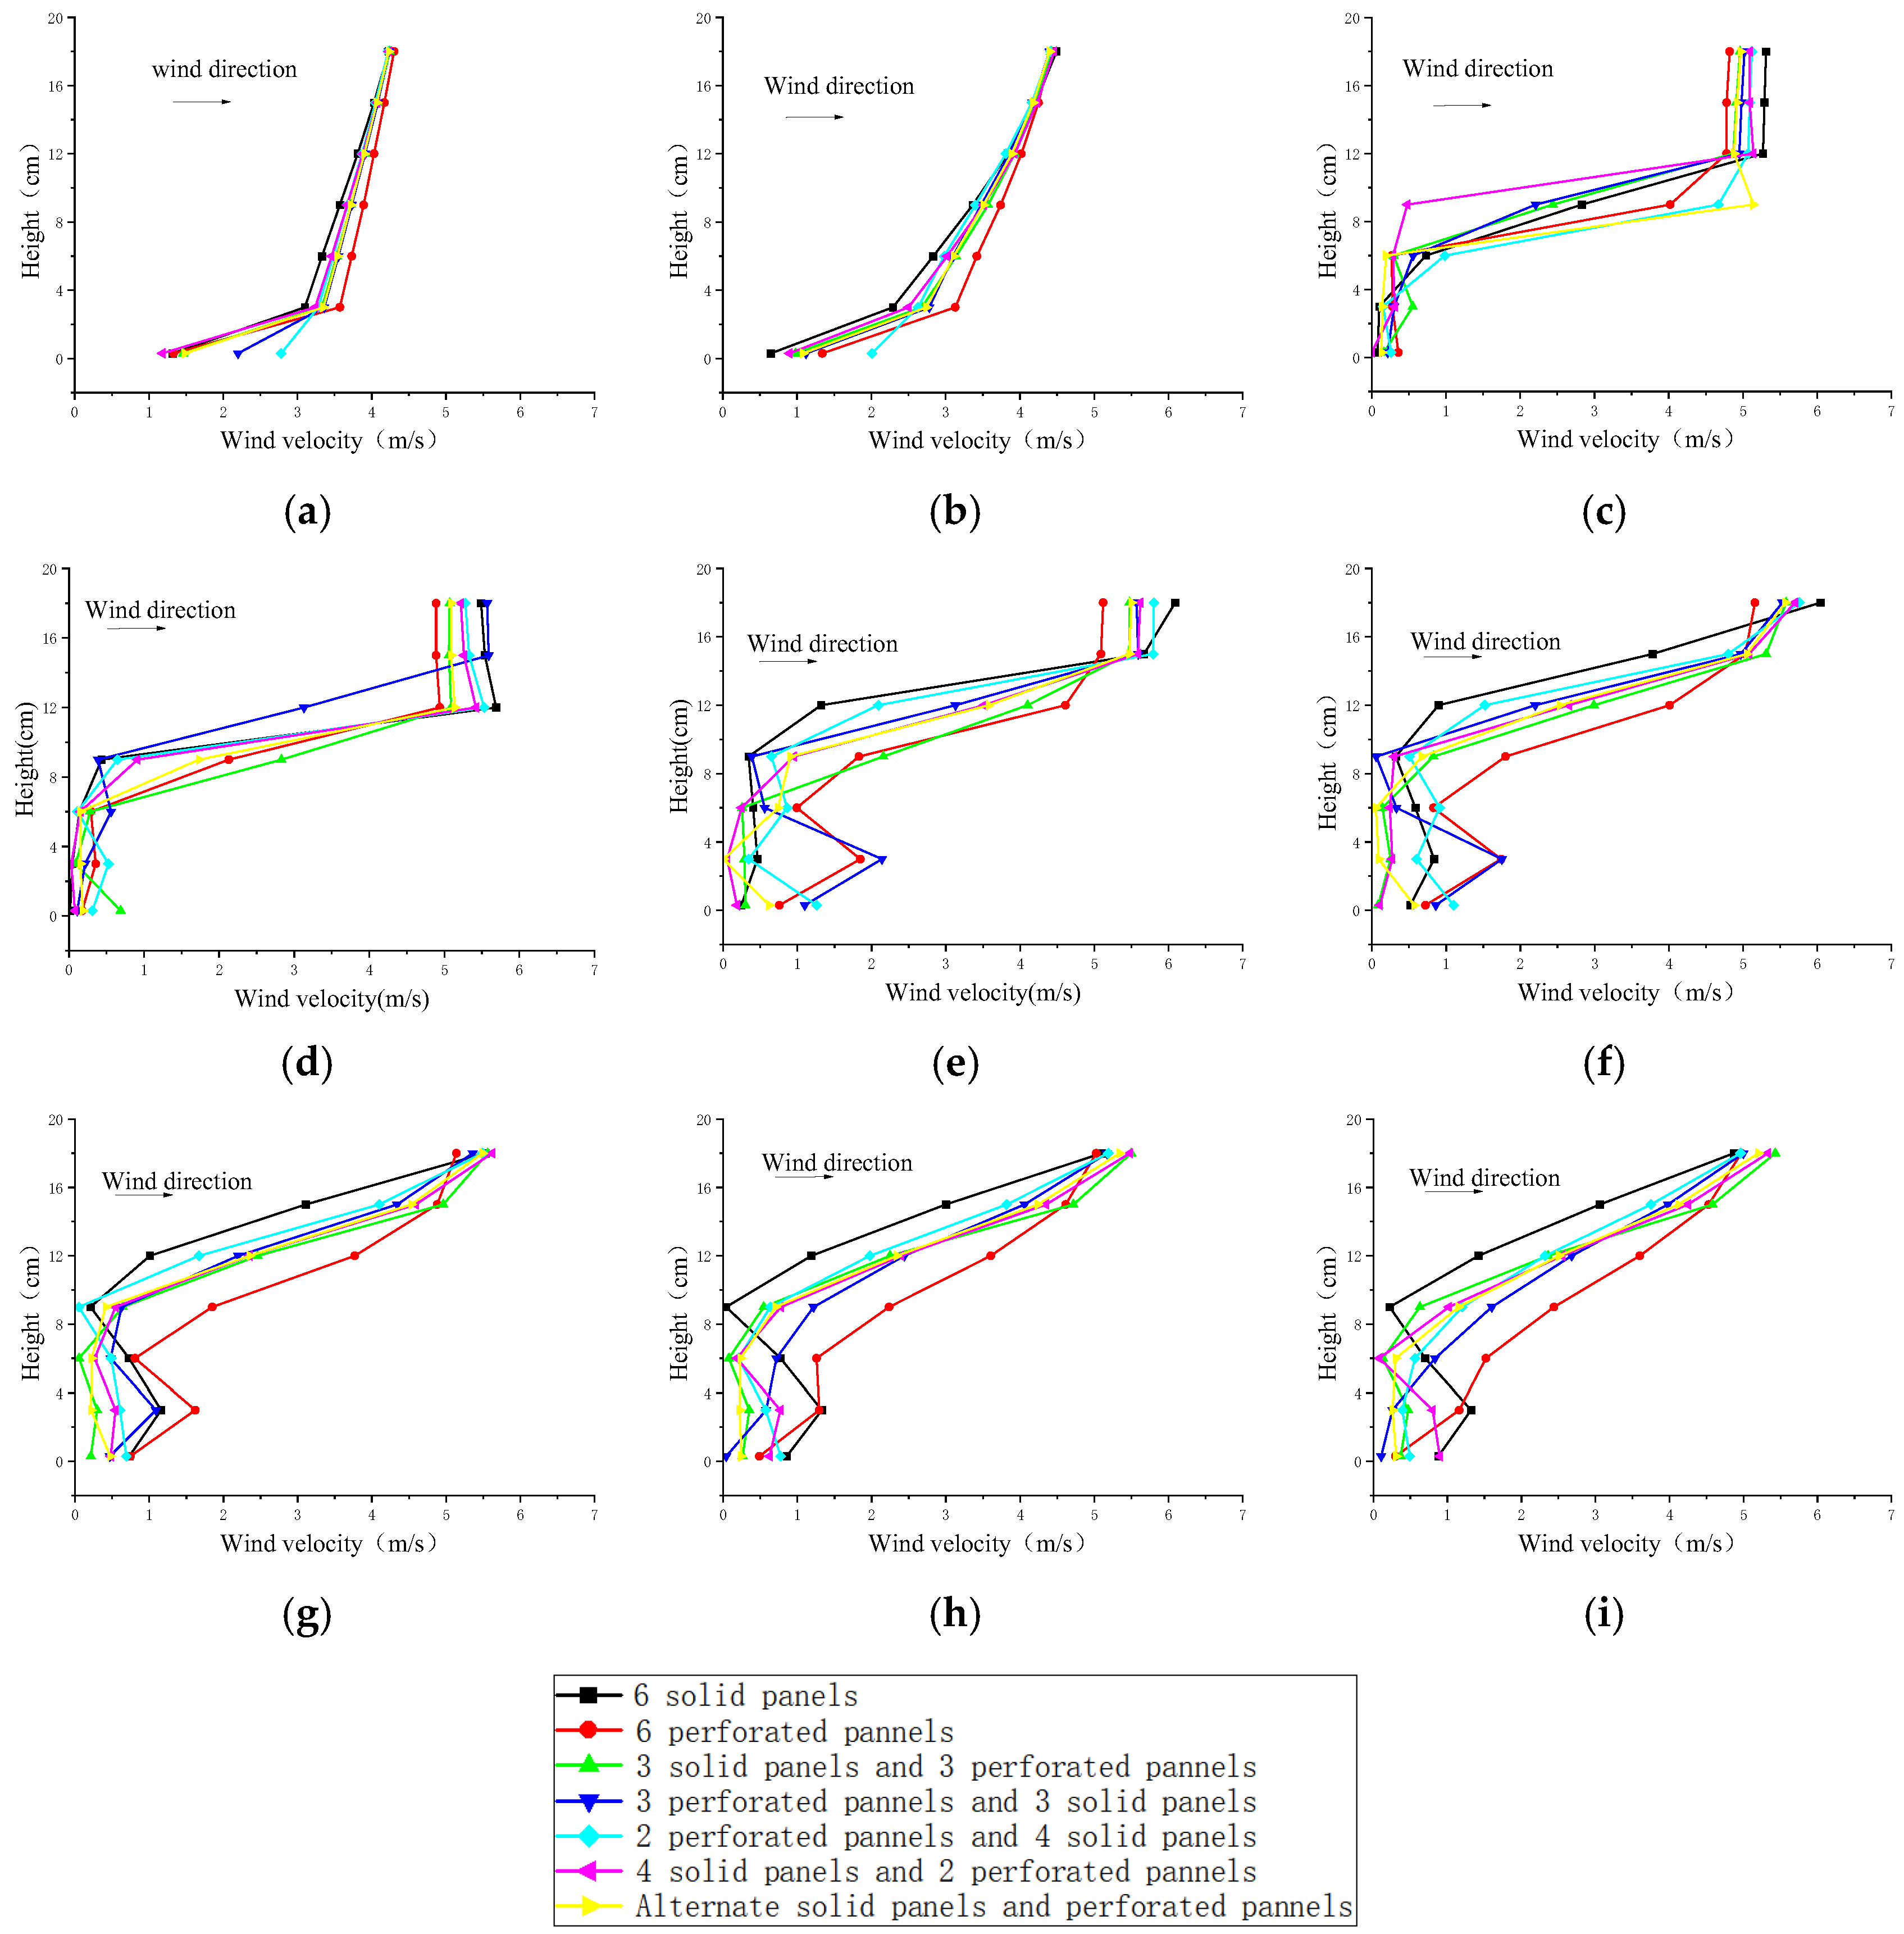
- When the snow flow passes over fences, the wind speed remains relatively consistent within the height range on both sides for different types of fences. The wind speed is at its lowest immediately in front of and behind the fences. Above the height of the fences, the wind speed gradually recovers. The difference is that when the bottom of the snow barrier is of the “perforated” type, the wind speed in the area below the height of the barrier is greater than when the bottom is of the “solid” type.
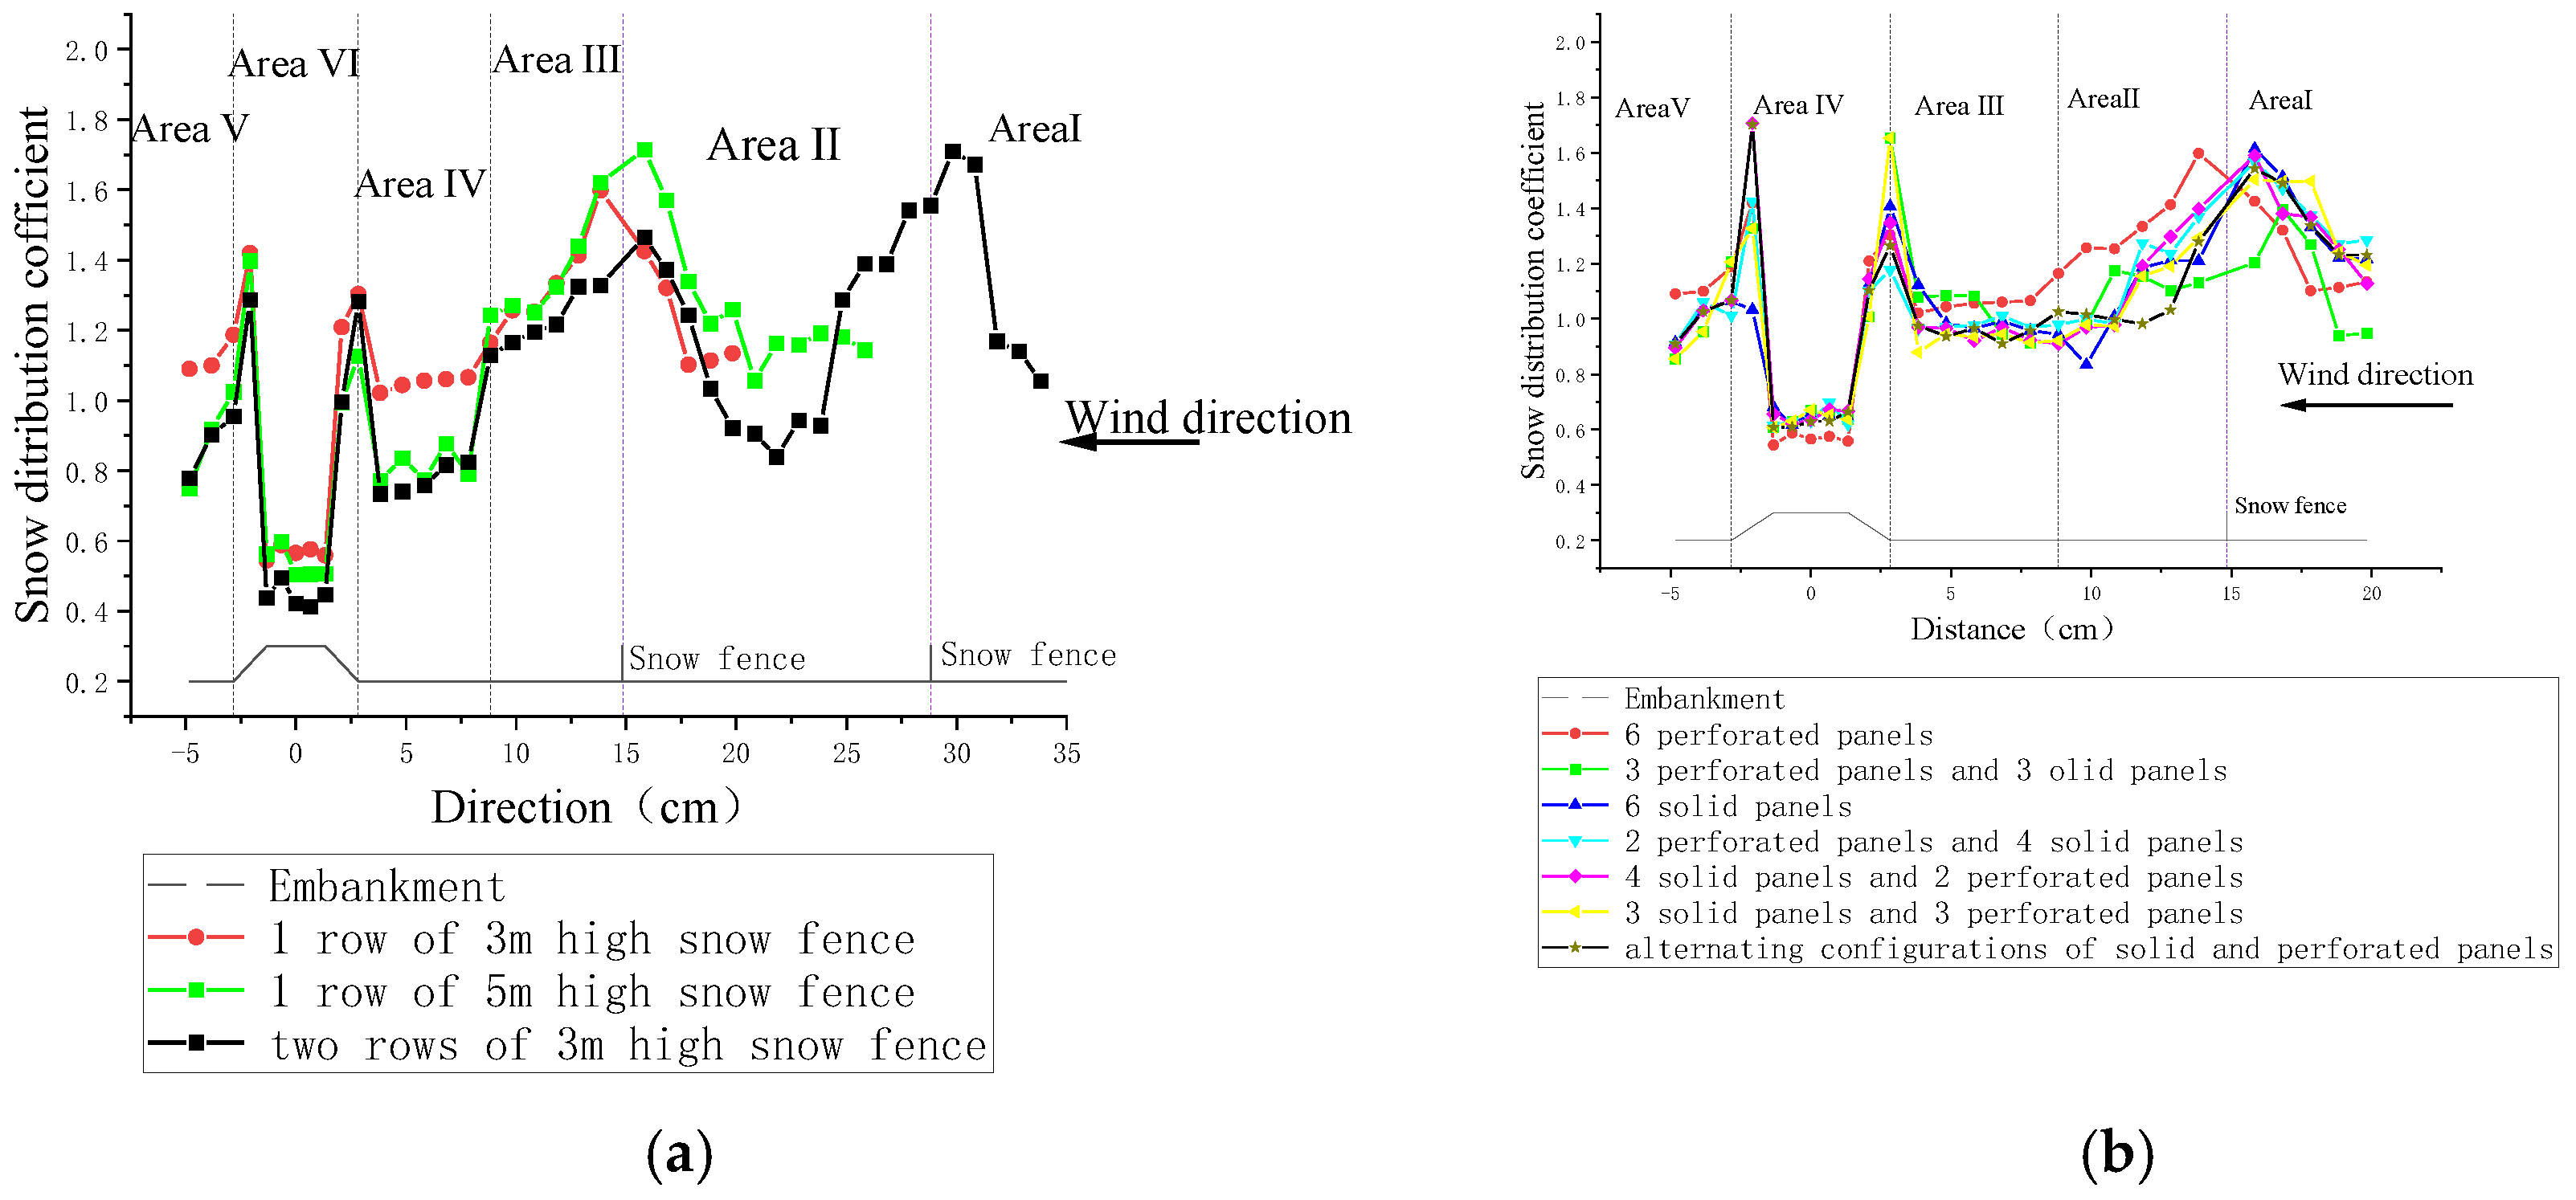
- The influence range of the snow barrier on the embankment results in significant snow accumulation within the range of 4–6 times the height (h) of the barrier, while in areas beyond 6 h, the accumulation of snow particles remains relatively stable. Fences with a higher porosity provide better protection, corresponding to the 10 perforated snow fences on site. The influence range of the snow barrier in the ditch reaches a stable state with respect to the thickness of snow particle accumulation after 9–11 times the height (h) of the barrier. Fences with a higher porosity also provide better protection. In areas severely impacted by wind-blown snow disasters, single-row high snow fences may be prioritized over double-row low snow fences.
- By adopting a high-precision wind tunnel (1:150 scale ratio) and viscous silica sand (density: 0.208 g/cm3), we addressed the limitations of prior setups (1:12 ratio, artificial snow density: 0.5 g/cm3) that overestimated particle inertia [23]. We quantified the efficacy of snow fences (e.g., 50% porosity, 7 H placement) for embankments, a terrain type previously underexplored in favor of cuttings [8]. Our results advocate combining structural adjustments (e.g., snow platforms) with active snow fences, offering a holistic strategy for diverse railway terrains.
5. Limitations and Future Work
- Integrate Particle Image Velocimetry (PIV) in wind tunnel setups to obtain high-resolution velocity fields and enhance flow visualization around fences and embankments.
- Conduct comparative experiments using natural or artificial snow particles to better simulate real-world snow dynamics.
- Develop computational fluid dynamics (CFD) models calibrated by wind tunnel results to explore larger-scale and more varied scenarios.
- Investigate multi-factor coupling effects, such as wind-blown snow under thermal gradients, terrain complexity, and evolving snowpack densification.
Author Contributions
Funding
Institutional Review Board Statement
Informed Consent Statement
Data Availability Statement
Acknowledgments
Conflicts of Interest
References
- Tuoliewubieke, D.; Mao, W.; Yao, J.; Zhang, X.; Li, S.; Chen, P.; Ma, L.; Chen, J. Spring snowmelt flood disasters in Altay, Northwest China: Spatio-temporal distribution and mechanisms. J. Hydrol. Reg. Stud. 2025, 57, 102142. [Google Scholar] [CrossRef]
- Mott, R.; Vionnet, V.; Grünewald, T. The seasonal snow cover dynamics: Review on wind-driven coupling processes. Front. Earth Sci. 2018, 6, 197. [Google Scholar] [CrossRef]
- Qiu, S.; Bai, M.; Lin, D.; Zhang, Y.; Xia, H.; Fan, J.; Zhou, W.; Tang, Z. Research on an Evaluation Method of Snowdrift Hazard for Railway Subgrades. Appl. Sci. 2024, 14, 7247. [Google Scholar] [CrossRef]
- Wu, P. Study on Prevention Measures of Snowdrift Disasters in Xinjiang Highway. West. China Commun. Sci. Technol. 2019, 6, 54–57. [Google Scholar] [CrossRef]
- Liu, D.; Li, Y.; Wang, B. A numerical prediction model for snow accumulation caused by ambient snowdrift. Eng. Mech. 2016, 33, 122–131. [Google Scholar] [CrossRef]
- Bondar, I.; Nugumanov, N.; Suleimenov, M.; Abdurakhmanov, A. Snow protection fences of modular design with adjustable snow retention volume. Int. J. Adv. Logist. Transp. Eng. 2024, 9, 9–21. [Google Scholar] [CrossRef]
- Boardman, E.N.; Fountain, A.G.; Boardman, J.W.; Painter, T.H.; Burgess, E.W.; Wilson, L.; Harpold, A.A. Wind and Topography Underlie Correlation Between Seasonal Snowpack, Mountain Glaciers, and Late-Summer Streamflow. EGUsphere 2025, 2025, 1–54. [Google Scholar] [CrossRef]
- Qiu, S.; Bai, M.; Jiang, H.; Li, P.; Wei, Z.; Li, X. Field measurements and numerical simulation of snowdrift on railway subgrade. J. Test. Eval. 2022, 50, 2988–3000. [Google Scholar] [CrossRef]
- Yang, D.; Liu, F.; Yan, J.; Zhang, Y.; Zhou, Q. A risk assessment of snow disaster along Qinghai-Tibet Railway. Geogr. Res 2021, 40, 1223–1238. [Google Scholar]
- Liu, Q.; He, S.; Jia, Y.; Li, H.; Feng, Y.; Li, F. Numerical Simulation on the Influence of the Distance between Snow Fence and Subgrade on the Snow Distribution on Subgrade. J. Vib. Shock 2021, 40, 227–234+264. [Google Scholar] [CrossRef]
- Walter, B.; Weigel, H.; Wahl, S.; Löwe, H. Wind tunnel experiments to quantify the effect of aeolian snow transport on the surface snow microstructure. Cryosphere 2023, 18, 3633–3652. [Google Scholar] [CrossRef]
- Lü, X.; Huang, N.; Guo, L.; Li, G. Wind tunnel study of vertical profile of drifting snow. Mech. Eng. 2013, 35, 20–25. [Google Scholar] [CrossRef]
- Zhou, X.Y.; Hu, J.H.; Gu, M. Wind Tunnel Test of Snow Loads on a Stepped Flat Roof Using Different Granular Materials. Nat. Hazards 2014, 74, 1629–1648. [Google Scholar] [CrossRef]
- Lü, X.; Huang, N.; Tong, D. Wind tunnel experiments on natural snow drift. Sci. China Technol. Sci. 2012, 55, 927–938. [Google Scholar] [CrossRef]
- Faga, A.; Flaga, Ł. Wind tunnel tests and analysis of snow load distribution on three different large size stadium roofs. Cold Reg. Sci. Technol. 2019, 160, 163–175. [Google Scholar] [CrossRef]
- Yu, Z.; Zhu, F.; Cao, R.; Chen, X.; Zhao, L.; Zhao, S. Wind tunnel tests and CFD simulations for snow redistribution on 3D stepped flat roofs. Wind Struct. 2019, 28, 31–47. [Google Scholar] [CrossRef]
- Ma, W.; Luo, Y.; Li, F.; Sun, Y. The influence of wind deflectors on the snow distribution in road cuttings during snowdrift. Cold Reg. Sci. Technol. 2022, 196, 103505. [Google Scholar] [CrossRef]
- Lotfi, A.; Virk, M.S. Railway operations in icing conditions: A review of issues and mitigation methods. Public Transp. 2023, 15, 747–765. [Google Scholar] [CrossRef]
- Peng, W.; Faming, C.; Jian, L. Research on numerical simulation of snow fence based on Fluent. Technol. Econ. Areas Commun. 2016, 18, 57–60. [Google Scholar] [CrossRef]
- Li, Y.; Zhao, T.; Liu, D.; Liao, H. Aerodynamic ambient flow around railway wind screens and features of drifting snow. Tiedao Xuebao J. China Railw. Soc. 2015, 37, 119–125. [Google Scholar] [CrossRef]
- Gauer, P. Numerical modeling of blowing and drifting snow in Alpine terrain. J. Glaciol. 2001, 47, 97–110. [Google Scholar] [CrossRef]
- Kumar, G. Performance of snow fence at Banihal Top in Himalayan Region. J. Cold Reg. Eng. 2015, 29, 05014001. [Google Scholar] [CrossRef]
- Li, P.; Bai, M.; Ding, L.; Cui, Z.; Zhang, Z. Field measurement and outdoor wind tunnel test of snow-drifting: Snow distribution characteristics of railway subgrade and deposition mechanism. J. Wind. Eng. Ind. Aerodyn. 2022, 230, 105197. [Google Scholar] [CrossRef]
- Dai, X.; Huang, N. Numerical simulation of drifting snow sublimation in the saltation layer. Sci. Rep. 2014, 4, 6611. [Google Scholar] [CrossRef]
- Yan, K.; Cheng, T.; Zhang, Y. A new method in measuring the velocity profile surrounding a fence structure considering snow effects. Measurement 2018, 116, 373–381. [Google Scholar] [CrossRef]
- Zhang, Q.; Liu, M.; Tang, W.; Fan, F. 3D identification and digital photogrammetry of snow depths. J. Harbin Inst. Technol. 2019, 51, 194–200. [Google Scholar] [CrossRef]
- Zhou, X.; Kang, L.; Yuan, X.; Gu, M. Wind tunnel test of snow redistribution on flat roofs. Cold Reg. Sci. Technol. 2016, 127, 49–56. [Google Scholar] [CrossRef]
- GJ/T 338-2014; Wind Tunnel Test Method Standard. China Architecture & Building Press: Beijing, China, 2014.
- GB 50009-2012; Load Code for the Design of Building Structures. China Architecture & Building Press: Beijing, China, 2012.

| Similarity Parameters | Definition | Scale and Relationships | Purpose |
|---|---|---|---|
| Size | The geometric scale ratio of the model is equal to the prototype: | Geometric scale (1:30) | We ensure that the model is consistent with the geometry of the real operating conditions, and the spatial distribution of the flow field after the scale is similar. |
| Kinematics | Equal speed ratio: Particle starting conditions are similar: The settlement velocity is similar: The Fr and Re is equal: Frm = Frp, Rem = Rep | The velocity field is scaled and the particle motion trajectory is aligned with the prototype. | Ensure that the dynamics of the starting suspension and sedimentation process of the model and the prototype are similar. |
| Dynamics | Pneumatic resistance is similar: | The resistance of the particle is in proportion to the inertial force. | Control the force balance of particles in the flow field, reflecting the interaction mechanism of air flow and particles. |
| Accumulation pattern | The rest Angle is equal: | Simulation material (silica sand) and snow The particle resting angle is consistent. | Ensure that the particle accumulation pattern (such as slope and density distribution) is consistent with the actual snow cover. |
| Time scale | Sedimentation time ratio: | The deposition process time is scaled (shortened after scaling). | Ensure that the model agrees with the dynamic timescale of the snow cover evolution process in the prototype. |
| Parameters | Snow | Thin Silicon Sand |
|---|---|---|
| Particle size (mm) | 0.1~0.4 | 0.19 |
| Density (g/cm3) | 0.120~0.222 | 0.208 |
| Reynolds Number | 21.1~247 | 81 |
| Drag-to-Inertia Ratio | 14.37~16.32 | 1.54 |
| Sedimentary Velocity (m/s) | 1.08~1.3 | 1.24 |
| Sedimentary Similarity | >30 | 36 |
| Threshold Velocity (m/s) | 0.12~0.28 | 0.224 |
Disclaimer/Publisher’s Note: The statements, opinions and data contained in all publications are solely those of the individual author(s) and contributor(s) and not of MDPI and/or the editor(s). MDPI and/or the editor(s) disclaim responsibility for any injury to people or property resulting from any ideas, methods, instructions or products referred to in the content. |
© 2025 by the authors. Licensee MDPI, Basel, Switzerland. This article is an open access article distributed under the terms and conditions of the Creative Commons Attribution (CC BY) license (https://creativecommons.org/licenses/by/4.0/).
Share and Cite
Qiu, S.; Bai, M.; Lin, D.; Xia, H.; Tang, Z. Study on the Evolution Process of Snow Cover in Wind-Induced Railway Embankments and the Control Effect of Snow Fences. Appl. Sci. 2025, 15, 6057. https://doi.org/10.3390/app15116057
Qiu S, Bai M, Lin D, Xia H, Tang Z. Study on the Evolution Process of Snow Cover in Wind-Induced Railway Embankments and the Control Effect of Snow Fences. Applied Sciences. 2025; 15(11):6057. https://doi.org/10.3390/app15116057
Chicago/Turabian StyleQiu, Shumao, Mingzhou Bai, Daming Lin, Haoying Xia, and Zhenyu Tang. 2025. "Study on the Evolution Process of Snow Cover in Wind-Induced Railway Embankments and the Control Effect of Snow Fences" Applied Sciences 15, no. 11: 6057. https://doi.org/10.3390/app15116057
APA StyleQiu, S., Bai, M., Lin, D., Xia, H., & Tang, Z. (2025). Study on the Evolution Process of Snow Cover in Wind-Induced Railway Embankments and the Control Effect of Snow Fences. Applied Sciences, 15(11), 6057. https://doi.org/10.3390/app15116057