1. Introduction
In recent years, waste management in manufacturing, especially hazardous waste disposal, has become a critical issue that needs to be addressed with the growing global concern for environmentally friendly, low-carbon, and sustainable development [
1]. The World Health Organization underscores that the safe disposal of hazardous waste is linked to environmental quality and directly impacts public health [
2]. In this context, how to effectively manage hazardous wastes in the manufacturing industry has become an important challenge worldwide.
In the context of manufacturing, particularly in complex projects, various forms of hazardous waste are generated. If not managed effectively, these materials pose significant risks to both environmental integrity and human safety [
3]. As a result, reverse logistics has emerged as a promising waste management strategy, facilitating resource conservation, reducing ecological pollution, and promoting recycling. This approach minimizes disposal costs and enhances overall environmental sustainability [
4,
5,
6]. Furthermore, it can improve corporate reputation, strengthen market competitiveness, and help achieve the dual objectives of economic growth and social development [
7].
On the other hand, in cruise ship construction, the reverse logistics management of hazardous waste is particularly critical due to the scale, complexity, and high-risk nature of the operations. The generation of hazardous waste, such as paint waste and oil residues, is unavoidable and must be managed with strict Health, Safety, and Environment (HSE) management regulations. This complex environment requires a robust reverse logistics strategy that not only addresses waste disposal, but also integrates safety and environmental considerations. Effective management of hazardous waste is vital to ensure both operational efficiency and the long-term sustainability of shipbuilding practices.
The undertaking of cruise construction is a highly intricate, tailored project that follows a regionalized building approach [
8,
9].
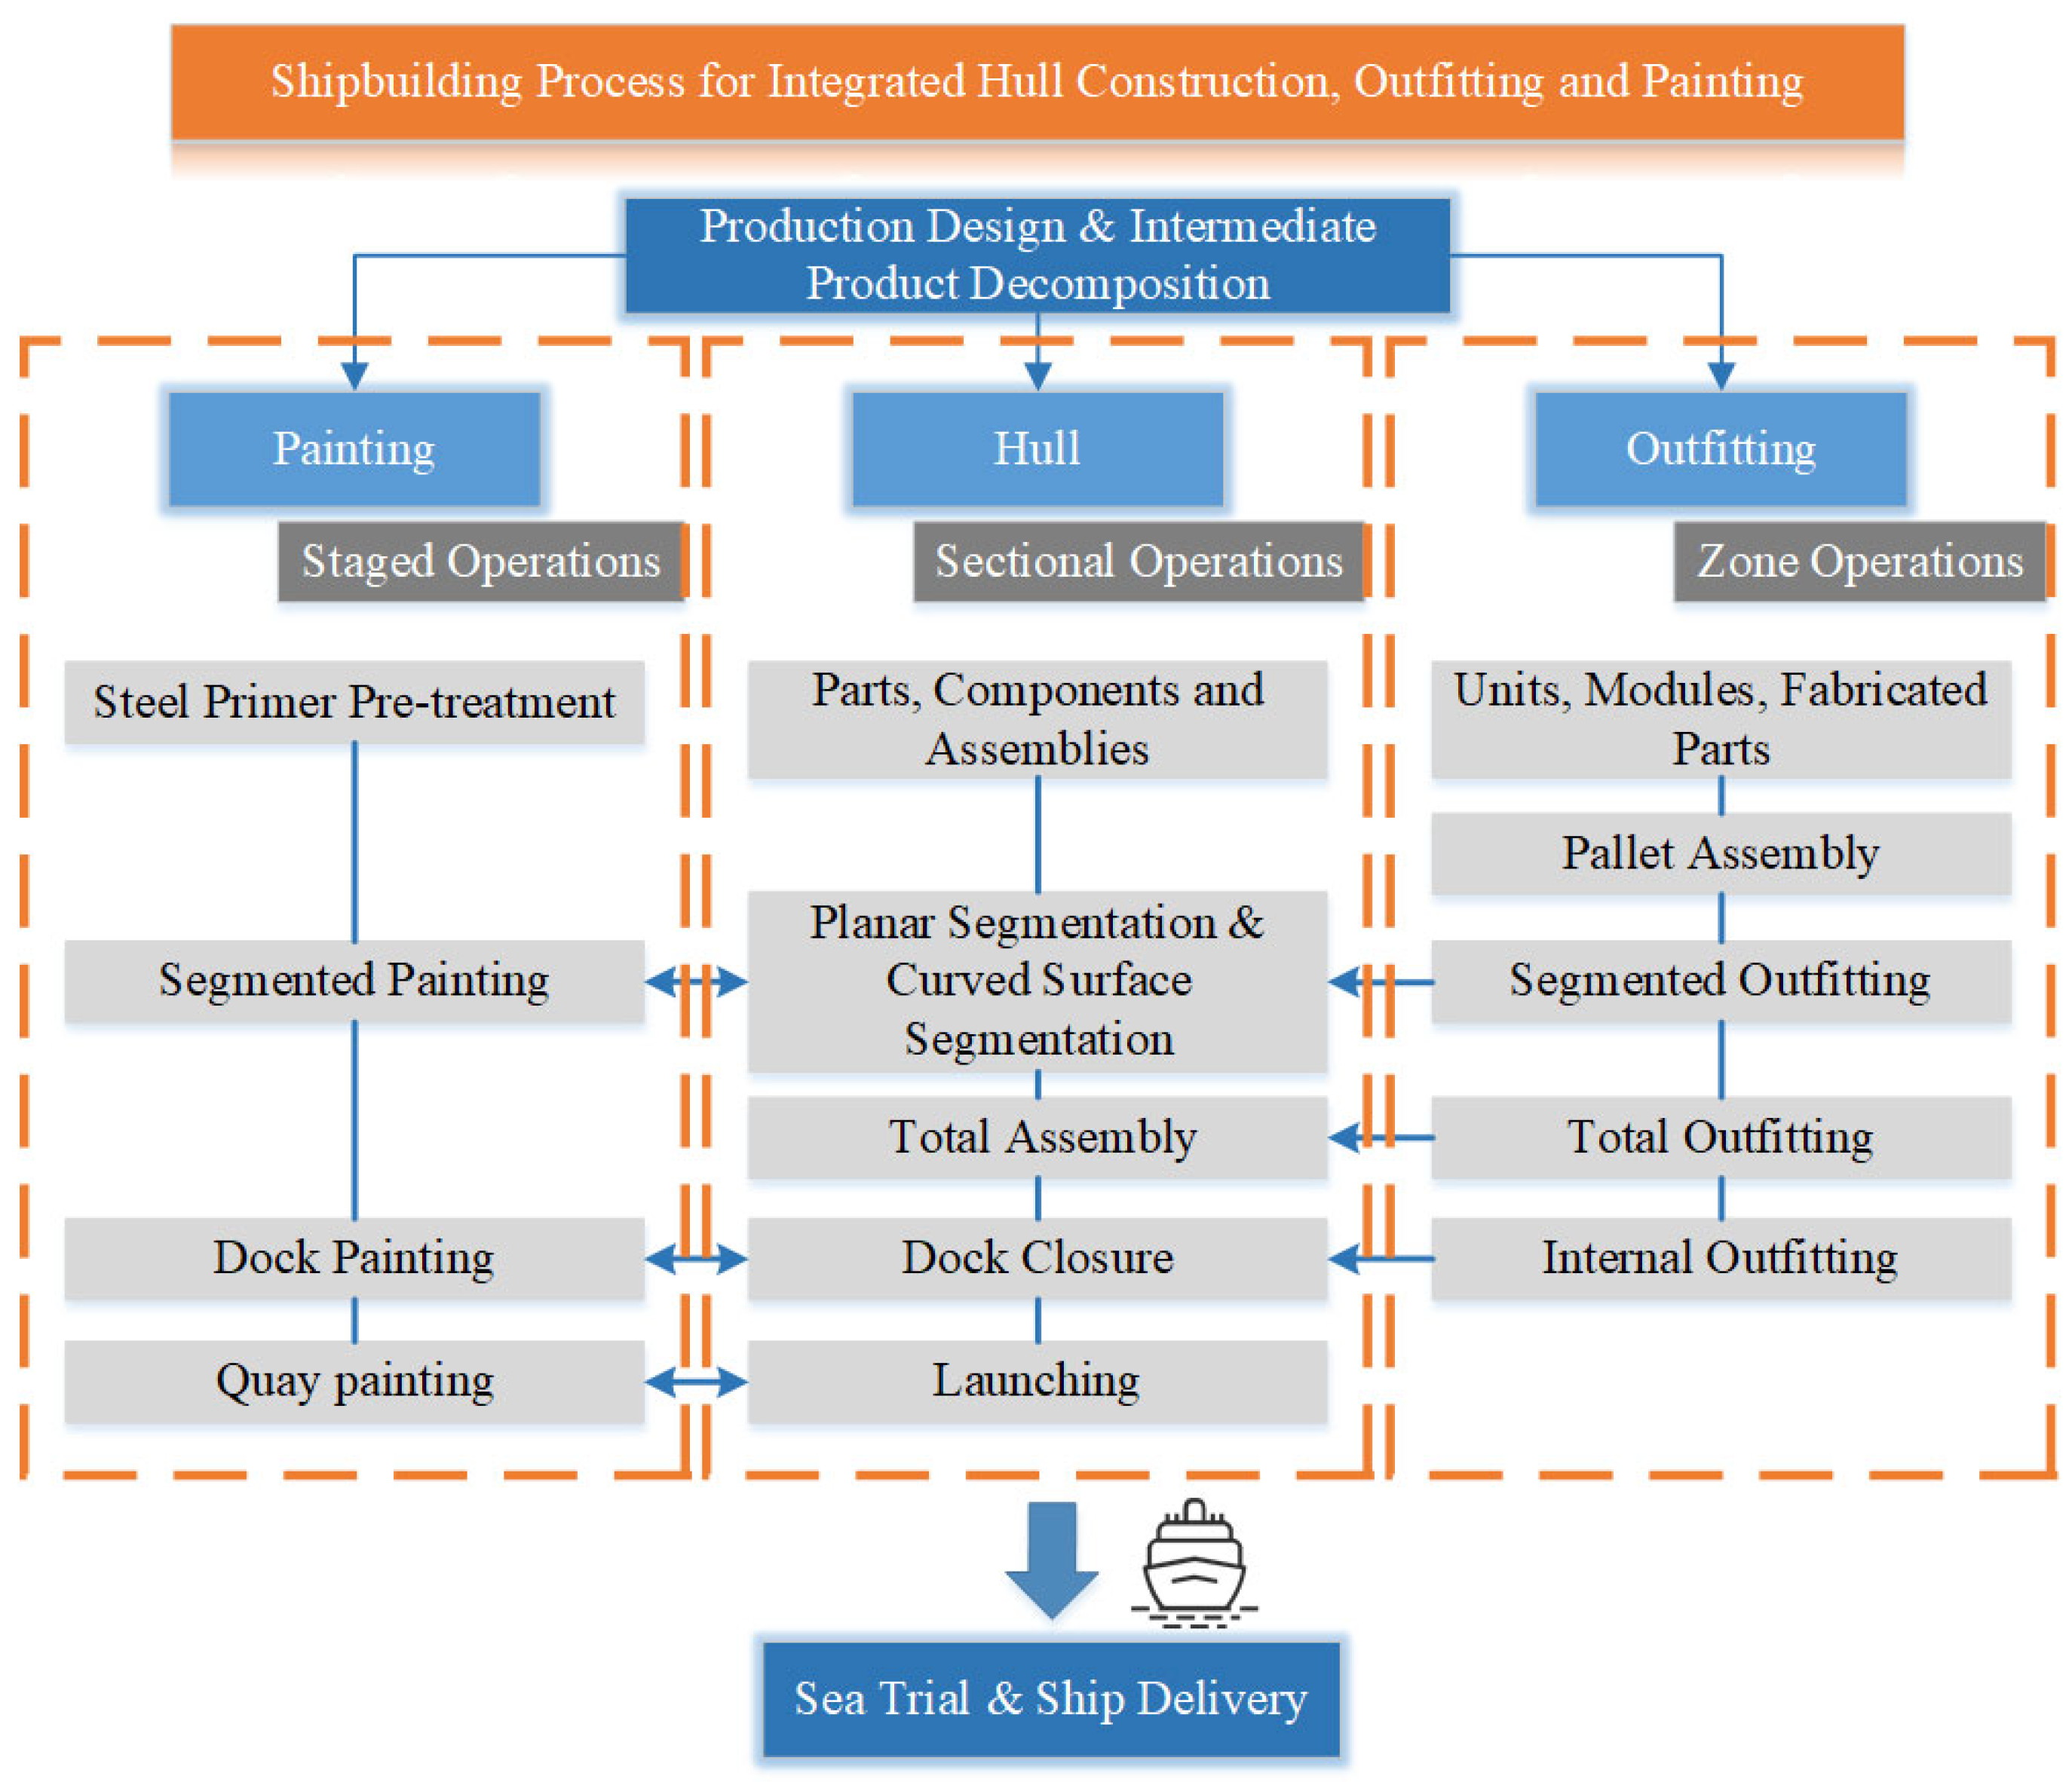
Figure 1 provides an illustration of the integrated shipbuilding process, encompassing hull construction, outfitting, and painting. Due to the extensive volume of parts and components involved, the logistics management requirements are exceedingly exacting [
10]. In this context, shipyards are characterized by complex workflows, heavy machinery, hazardous materials, and a high density of simultaneous operations, which make strict HSE management indispensable. In the process of cruise construction, the production of hazardous waste materials such as waste oil, waste paint ash, waste paint slag, and waste paint barrels cannot be avoided. Among these, waste paint barrels and waste paint slag make up 90% of all hazardous waste. These materials are toxic, flammable, and infectious by nature, and fall under the category of clearly defined hazardous waste [
11]. As such, they must be managed in strict accordance with hazardous waste regulations, and effective treatment measures must be taken to ensure that they are handed over to enterprises with hazardous waste business licenses for centralized, harmless disposal. Failure to do so in a timely manner will, from the perspective of cruise construction, occupy a significant amount of storage space, potentially causing confusion in material management and disrupting the normal production schedule. Moreover, reverse logistics in shipyards often involves the transportation and disposal of hazardous or bulky waste materials such as scrap steel, empty welding spools, and used paint containers. These processes inherently involve safety risks, potential environmental hazards, and occupational health concerns, making HSE considerations integral to reverse logistics planning. Also, HSE management principles also create sustainable development within the factory, as shown in
Figure 2. Lastly, from the vantage point of green development, pollution resulting from the improper disposal of hazardous waste can impede sustainable development efforts [
12]. Therefore, recycling hazardous wastes generated during the construction process and promoting the implementation of lean logistics management can reduce pollution and occupational safety hazards, create a favorable production environment, improve the efficiency of cruise ship construction, and ultimately achieve green safety benefits.
Although several studies have explored the application of reverse logistics in hazardous waste management and have been applied to some extent in practical engineering management, studies for the specific field of cruise ship construction are still rare, especially considering the safety of personnel and environmental sustainability in high-risk environments. Most of the existing studies focus on areas such as e-waste [
13,
14,
15,
16], medical waste [
17,
18,
19], waste oil [
20,
21,
22], and are primarily focused on economic analyses [
23,
24,
25,
26,
27], ignoring the integrated issues of safety risk management, environmental sustainability and waste treatment, which limits their practical application in complex shipyard environments. Therefore, despite its great practical significance, there are few studies on the reverse logistics management of hazardous waste generated during cruise ship construction. In order to fill the gap in the academic literature, and address the safe and effective disposal of hazardous waste during cruise ship construction, this paper proposes a hazardous waste reverse logistics network optimization model specifically for the cruise ship construction process, which takes into account the cost, efficiency and safety risks, and aims to ensure efficient and environmentally friendly cruise ship construction.
This study analyzes the cost structure associated with different transport routes and modes to identify the most economically efficient transportation solutions, ultimately reducing overall operating costs. By optimizing transport scheduling and vehicle allocation, the efficiency of material recovery and transport was improved to ensure that hazardous waste can be transferred to designated treatment facilities quickly and safely. Fuzzy logic was used to assess operator safety satisfaction to ensure that potential safety risks can be effectively identified and mitigated during the transport process. To achieve the above objectives, we designed a discrete crow search algorithm, which has strong global search capability and adaptability, and is able to find the optimal solution in a complex logistics network. Through simulations of operational scenarios, we optimized hazardous waste transport scheduling to maintain the safety and health of operators, while achieving economic benefits. This comprehensive approach not only advances the management of hazardous waste in cruise ship construction, but also contributes to sustainable practices in manufacturing.
The key contributions of this study include the following:
Integrated Model Innovation: A reverse logistics network optimization model that integrates safety, cost and efficiency is proposed, focusing on hazardous waste management during cruise ship construction and quantifying the safety service level of different solutions.
Vehicle Allocation and Safety Management: Various vehicle types are introduced to test the impact of different forklift combinations on cost and safety service levels, while safety risk management for field operators is enhanced through time window settings.
Optimized Dispatch and Efficiency Improvement: Developing a centralized vehicle dispatch methodology to significantly improve the efficiency of managing the recycling and transportation of hazardous waste materials, ensuring fast and safe transfer to designated treatment facilities.
Algorithm Application and Sustainable Development Contribution: A discrete crow search algorithm is designed with powerful global search capability to drive the efficiency of hazardous waste management and promote sustainable practices and green development in manufacturing industry.
The remainder of this paper is organized as follows.
Section 2 provides a literature review, highlighting the innovative contributions of this study.
Section 3 presents the problem statement, along with the assumptions and notations used in the modeling.
Section 4 describes the methodology and processes employed.
Section 5 applies the outlined methods to case study of reverse logistics operation scheduling optimization for hazardous waste materials in shipyards, and also compares the proposed method.
Section 6 forms the discussion from the perspectives of the findings, contributions, and limitations. Finally,
Section 7 concludes the study, offering insights into future research directions.
2. Literature Review
This section reviews key areas of reverse logistics research objects, HSE management in hazardous waste handling, and optimization model issues.
The rise of waste with the growth of industrial activities has raised concerns about waste management and the generation of hazardous waste poses a major challenge to policy makers and stakeholders [
28,
29]. Under this background, scholars have conducted reverse logistics research on different types of hazardous wastes to address the issues of cost, environmental risk and social responsibility in waste management. Kumar Singh et al. [
14] developed a model for managing the reverse logistics of end-of-life electronic products, focusing on cost minimization and waste reduction through various recovery processes. Koshta et al. [
16] found that consumers’ willingness to pay for e-waste recycling is influenced by perceived control, awareness, and recycling intention, highlighting the need for shared responsibility in e-waste management. Govindan et al. [
17] created a bi-objective MILP model for designing a green reverse logistics network for medical waste management, incorporating uncertainty and queuing theory to minimize costs and population risk. Chauhan et al. [
19] examined the integration of circular economy principles with Industry 4.0 technologies for smart healthcare waste disposal systems, identifying key drivers like digital connectivity and public feedback mechanisms. Zhao and Verter [
20] developed a bi-objective location routing model for used oil collection networks to minimize environmental risk and total cost, integrating risk assessment into decision-making. Xu and Yang [
6] investigated municipal hazardous waste management using IoT-integrated reverse logistics, demonstrating that smart sensors optimize collection routes and enhance sustainability. Xin et al. [
30] conducted a systematic review of municipal hazardous waste reverse logistics over three decades, identifying research trends and deficiencies while proposing future directions to optimize reverse logistics systems.
This paragraph provides a literature review on the consideration of environmental, safety and health aspects in the reverse logistics of hazardous waste, focusing on how these factors are integrated into optimization models during the recycling process. Xu et al. [
31] proposed a multi-objective optimization model for a sustainable hazardous waste reverse logistics network that incorporates co-processing in cement kilns to reduce waste volume and emissions while promoting resource recovery. De Oliveira et al. [
32] analyzed risk management in the reverse logistics of solid waste in the steel industry, identifying improper waste segregation and contamination as key risks, and highlighting how structured RM processes can enhance safety and efficiency in waste management. Balci et al. [
33] developed a multi-purpose reverse logistics network for medical waste management in Istanbul, integrating economic, environmental, and social objectives to address COVID-19 challenges and support sustainable development goals. Liao et al. [
34] created a collaborative reverse logistics network design model for waste electric vehicle batteries, incorporating multiple participants and fuzzy optimization to manage carbon emissions and recovery options amid uncertainties. Hashemi [
35] developed a fuzzy multi-objective optimization model for a sustainable municipal waste reverse logistics network. Cao et al. [
36] designed a two-echelon reverse logistics network model for recyclable collection with a heterogeneous electric vehicle fleet, focusing on minimizing costs, reducing carbon emissions, and improving efficiency, utilizing a hybrid genetic algorithm with large-scale neighborhood search. Mu et al. [
37] created a six-level sustainable dynamic reverse logistics network model for recycling retired new energy electric vehicle batteries, integrating economic, environmental, and social objectives, while evaluating environmental impacts through a non-life-cycle assessment and considering social factors like employee safety and community disturbances. Wang et al. [
38] applied the Best–Worst Method (BWM) to assess and control risk in the reverse logistics of medical waste, identifying key risk factors across five dimensions: logistics operations, emergency capacity, equipment, personnel, and management.
Reverse logistics network research primarily concentrates on network design, node optimization, and uncertainty factors. Compared with forward logistics, reverse logistics comprises greater uncertainty, and complexity.
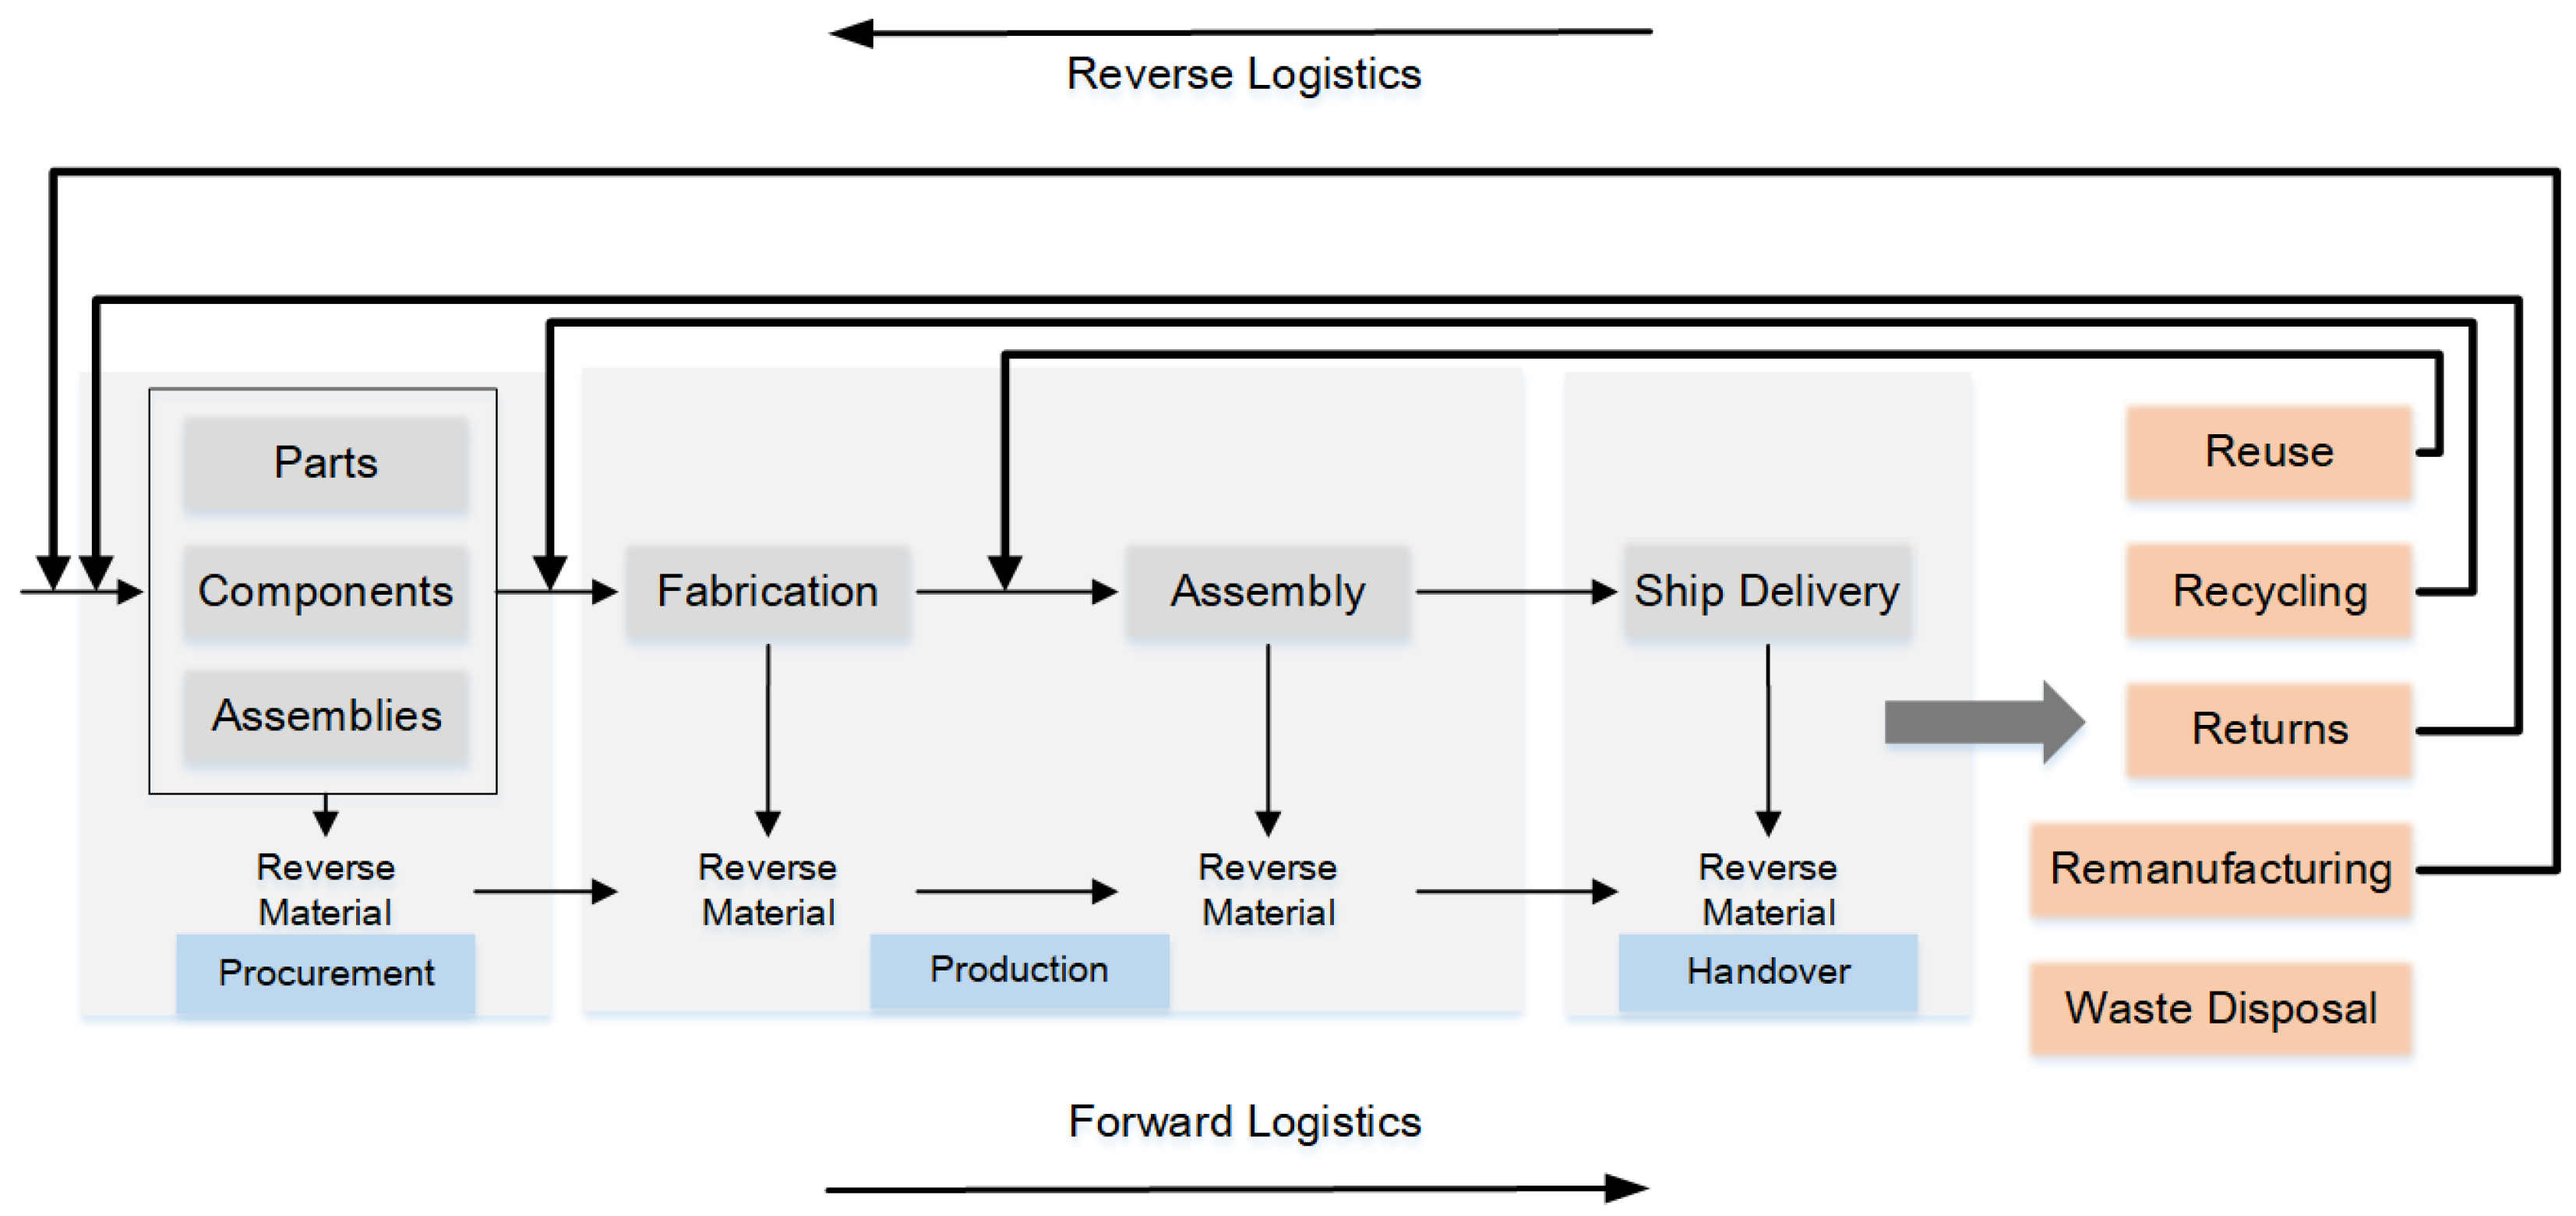
Figure 3 illustrates how forward and reverse logistics work together. Forward logistics delivers parts and materials through procurement, fabrication, and assembly. At the same time, reverse logistics deals with returns such as damaged parts, leftover materials, or rework, sending them for reuse, recycling, repair, or disposal. As such, some scholars have studied uncertainty factors in the recycling process, with a focus on optimizing the economy of recycling costs, the timeliness of transport, and resource conservation [
39].
Trochu et al. [
40] developed a mixed-integer linear programming model (MILP) to minimize the total cost of wood recycling, accounting for uncertain factors such as the location of supply sources, the available quantity of recycled wood at collection sites, and the various quality grades of the collected wood. Li et al. [
41] formulated a location inventory routing problem model without quality defect returns, proposing an effective hybrid genetic simulated annealing algorithm (HGSAA). Roudbari et al. [
42] presented a two-stage stochastic mixed-integer programming model that accounted for uncertainties in product quality and quantity, product variety, and bill of materials. With regards to the research of reverse supply chain networks, apart from focusing on cost minimization and uncertainty, the importance of environmental and social issues has been gradually emphasized. In recent years, many scholars have turned their attention to carbon emissions. Reddy et al. [
43] proposed a mixed-integer linear programming (MILP) model to solve a multi-tier, multi-period green RL network, integrating facility locations, vehicle type selection, and emissions produced during transportation and operations at various processing centers. Taknezhad and Vahedi [
44] established a location routing inventory model for a green reverse supply chain network, which minimized the total costs of the chain and lost demands simultaneously, utilizing a fuzzy multi-objective solution approach. Santos et al. [
44] investigated the Vehicle Routing Problem with Divisible Deliveries and Pickups (VRPDDP) in reverse logistics, focusing on economic and environmental impacts and how vehicle capacity and customer visit splitting influence performance.
Table 1 summarizes the representative studies and their key areas, and highlights the research gaps.
In summary, scholars are currently focusing on reverse logistics networks from a perspective of timing and economics, with attention to hazardous wastes mainly concentrated on electronic components, medical wastes, chemicals, and municipal hazardous waste, with a focus on the cost of recycling and the treatment process. Furthermore, some studies concentrate on recycling modes [
55,
56,
57] and reverse supply chain evaluation [
58,
59], among other topics [
60,
61]. However, during the actual recycling process, certain hazardous waste materials pose environmental, health, and safety risks, and existing research rarely takes into account a comprehensive consideration of cost, efficiency, safety risks, green aspects, and other factors from the perspective of HSE management.
This study endeavors to address the issues of inventory occupation, production impact, and potential occupational safety risks that may arise during the construction of reverse materials for cruise ships. To this end, we have developed a novel shipyard reverse logistics network operation scheduling optimization model that prioritizes safe production, efficient and green, incorporating health, safety and environmental sustainability objectives and associated constraints in an innovative manner.
3. Mathematical Model
3.1. Problem Description
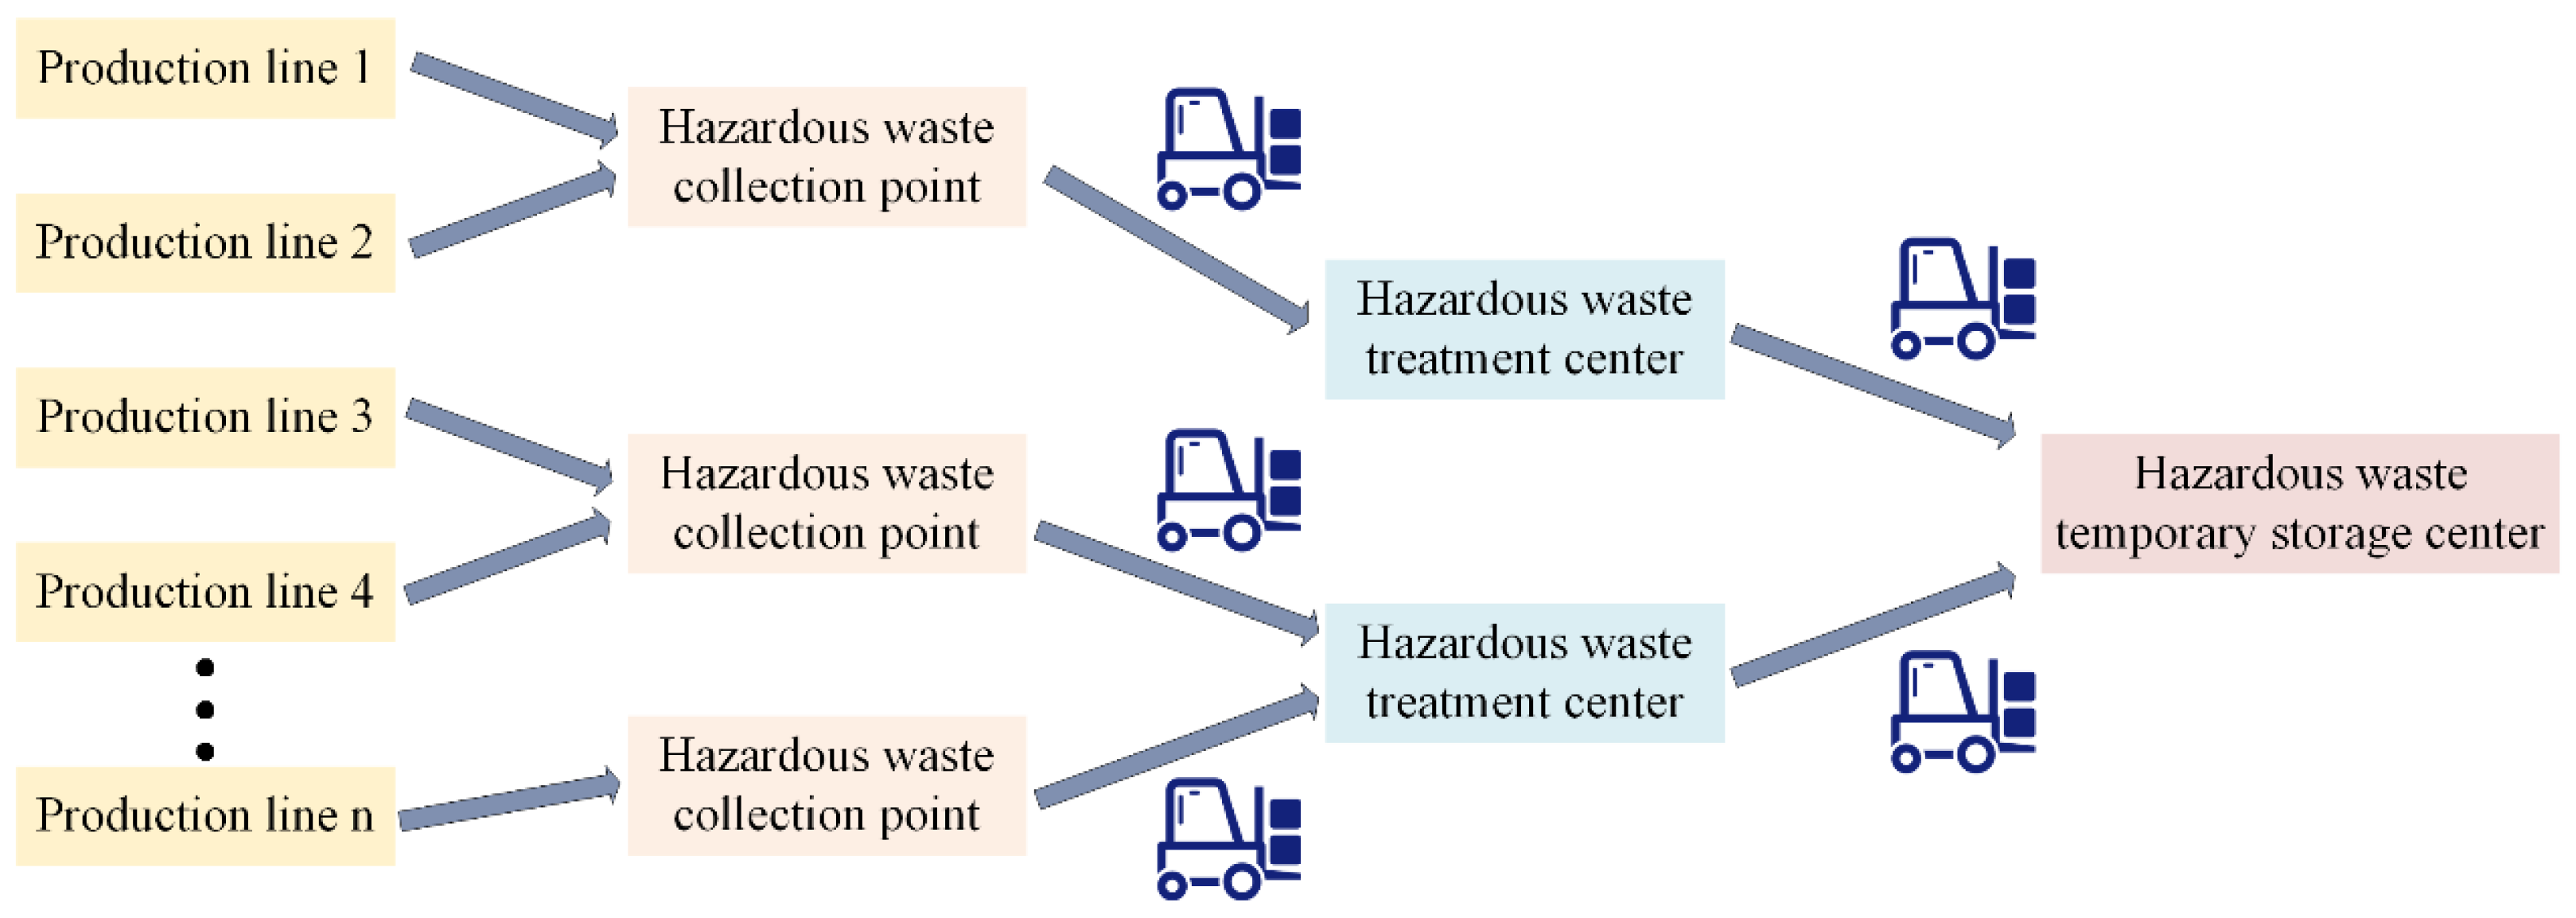
The hazardous waste recycling network within shipyards comprises a four-level network structure, encompassing production line edges, hazardous waste collection points, hazardous waste treatment centers, and hazardous waste temporary storage centers, as illustrated in
Figure 4. Reverse materials, including hazardous waste and incompletely used production materials, are generated by the production line. The collection point, built in proximity to the production line, serves as a recycling facility with a specific storage capacity. The reverse materials produced by the production line are initially gathered at the collection point, resulting in a small-scale and multi-batch in-plant transportation. The reprocessing center is responsible for processing hazardous waste, including classification, redox, and compression, among other processes. The hazardous waste temporary storage center, on the other hand, is intended for storing hazardous waste during processing. Once hazardous waste materials have been treated, such as waste paint ash, waste paint sludge, and waste paint drums, they are placed in the hazardous waste temporary storage center. Once the upper limit of storage capacity is reached, a professional treatment company is invited to the plant to transport the hazardous waste to a specific environmentally friendly treatment enterprise for further processing.
In the conventional recycling process, each production department employs its own departmental vehicles to transport hazardous waste from the collection point to the treatment point. However, such multiple round-trip transport poses a greater risk of exposure, increases the burden on the plant’s green management, scheduling of carrier tools, and places more pressure on the treatment center to carry out multiple reception processes, among other issues. Overall, this approach fails to facilitate cost savings, green transport, and safe HSE management. Consequently, we propose to manage the recycling and transport of hazardous waste through centralized vehicle scheduling. Adhering to the principles of economic efficiency, ecological coordination, health, and safety, our vehicle scheduling model for hazardous waste materials in the plant seeks to identify the most cost-efficient, safety-conscious, and environmentally friendly recycling path. The main factors considered in the model include the following:
Effective cost management is crucial in the reverse flow of hazardous waste, as it not only impacts financial expenditures but also directly influences the overall efficiency and sustainability of hazardous waste management practices. Centralized vehicle scheduling solutions can lead to significant reductions in transportation costs by minimizing redundant routes and optimizing transport pathways. This centralized approach not only decreases the necessity for multiple round trips, but also effectively lowers the vehicle empty rate, thereby enhancing the efficient use of resources.
For this purpose, selecting the most appropriate hazardous waste transport vehicle is essential for balancing operating costs with safety and environmental considerations. Different types of transport vehicles exhibit significant variations in load capacity, fuel efficiency, and maintenance expenses. By strategically deploying and selecting suitable vehicles, organizations can reduce unit transport costs while ensuring compliance with safety regulations and environmental standards during transit.
- 2.
HSE Management
During the hazardous waste recycling process, there exists a certain level of risk to the operators’ health and safety of the working environment. The number of operators exposed to hazardous waste at the collection point, the surrounding area, the duration of hazardous waste exposure, the area of the stockpile, the quantity of hazardous waste, and other indicators determine the level of risk at the hazardous waste collection point. Hence, it is crucial to assign a risk weight to different collection points based on their actual situation and identify the focus areas of HSE management accordingly.
- 3.
Green Management
Costs incurred during storage, carrier, and transport impact the overall green management of hazardous waste recycling. Collection points necessitate the temporary storage of recycled materials that require specialized personnel management. Different carriers have varying carrying capacities, operating costs, and environmental impacts due to generated emissions. Hence, it is necessary to select the appropriate vehicle for recycling hazardous waste materials, ensuring green recycling management with reasonable operating costs.
- 4.
Efficiency Management
The impact of hazardous waste materials on operating personnel and the environment varies depending on the materials, and the time taken to deal with them. Failure to recover materials in a timely manner may lead to recycling material backlog, affecting subsequent production processes. The transport time, processing time, and arrival time vary depending on the transport route, making it necessary to establish optimal time limits for efficiently recycling and processing hazardous waste materials.
3.2. Problem Assumptions
Assuming that workers along the production line have placed hazardous waste materials at the nearest collection point, we consider only the recovery path from the hazardous waste collection point to the hazardous waste treatment center in a static model. We assume that the total amount of recovered materials remains constant throughout transportation.
Each hazardous waste collection point must recycle its materials, and due to the health impacts of hazardous waste materials on the human body, we stipulate that each hazardous waste collection point can be served by only one vehicle.
The transport vehicle departs from the logistics center at a uniform time, and after completing the transport of hazardous waste materials from the collection point to the treatment center, it will not return to the logistics center. Instead, it will directly accept the next work arrangement.
The loading capacity of the vehicle during the recycling process does not exceed its maximum load capacity.
The total amount of recycled materials transported is less than or equal to the total amount carried by the vehicle, meaning that all hazardous waste must be transported to the hazardous waste treatment center.
The total cost is positively correlated with the distribution time.
We have access to information such as the amount of hazardous waste to be recycled at each collection point, the number of operators, and the required operating hours.
3.3. Description of Symbols
The symbol descriptions contained in this article are shown in
Table 2.
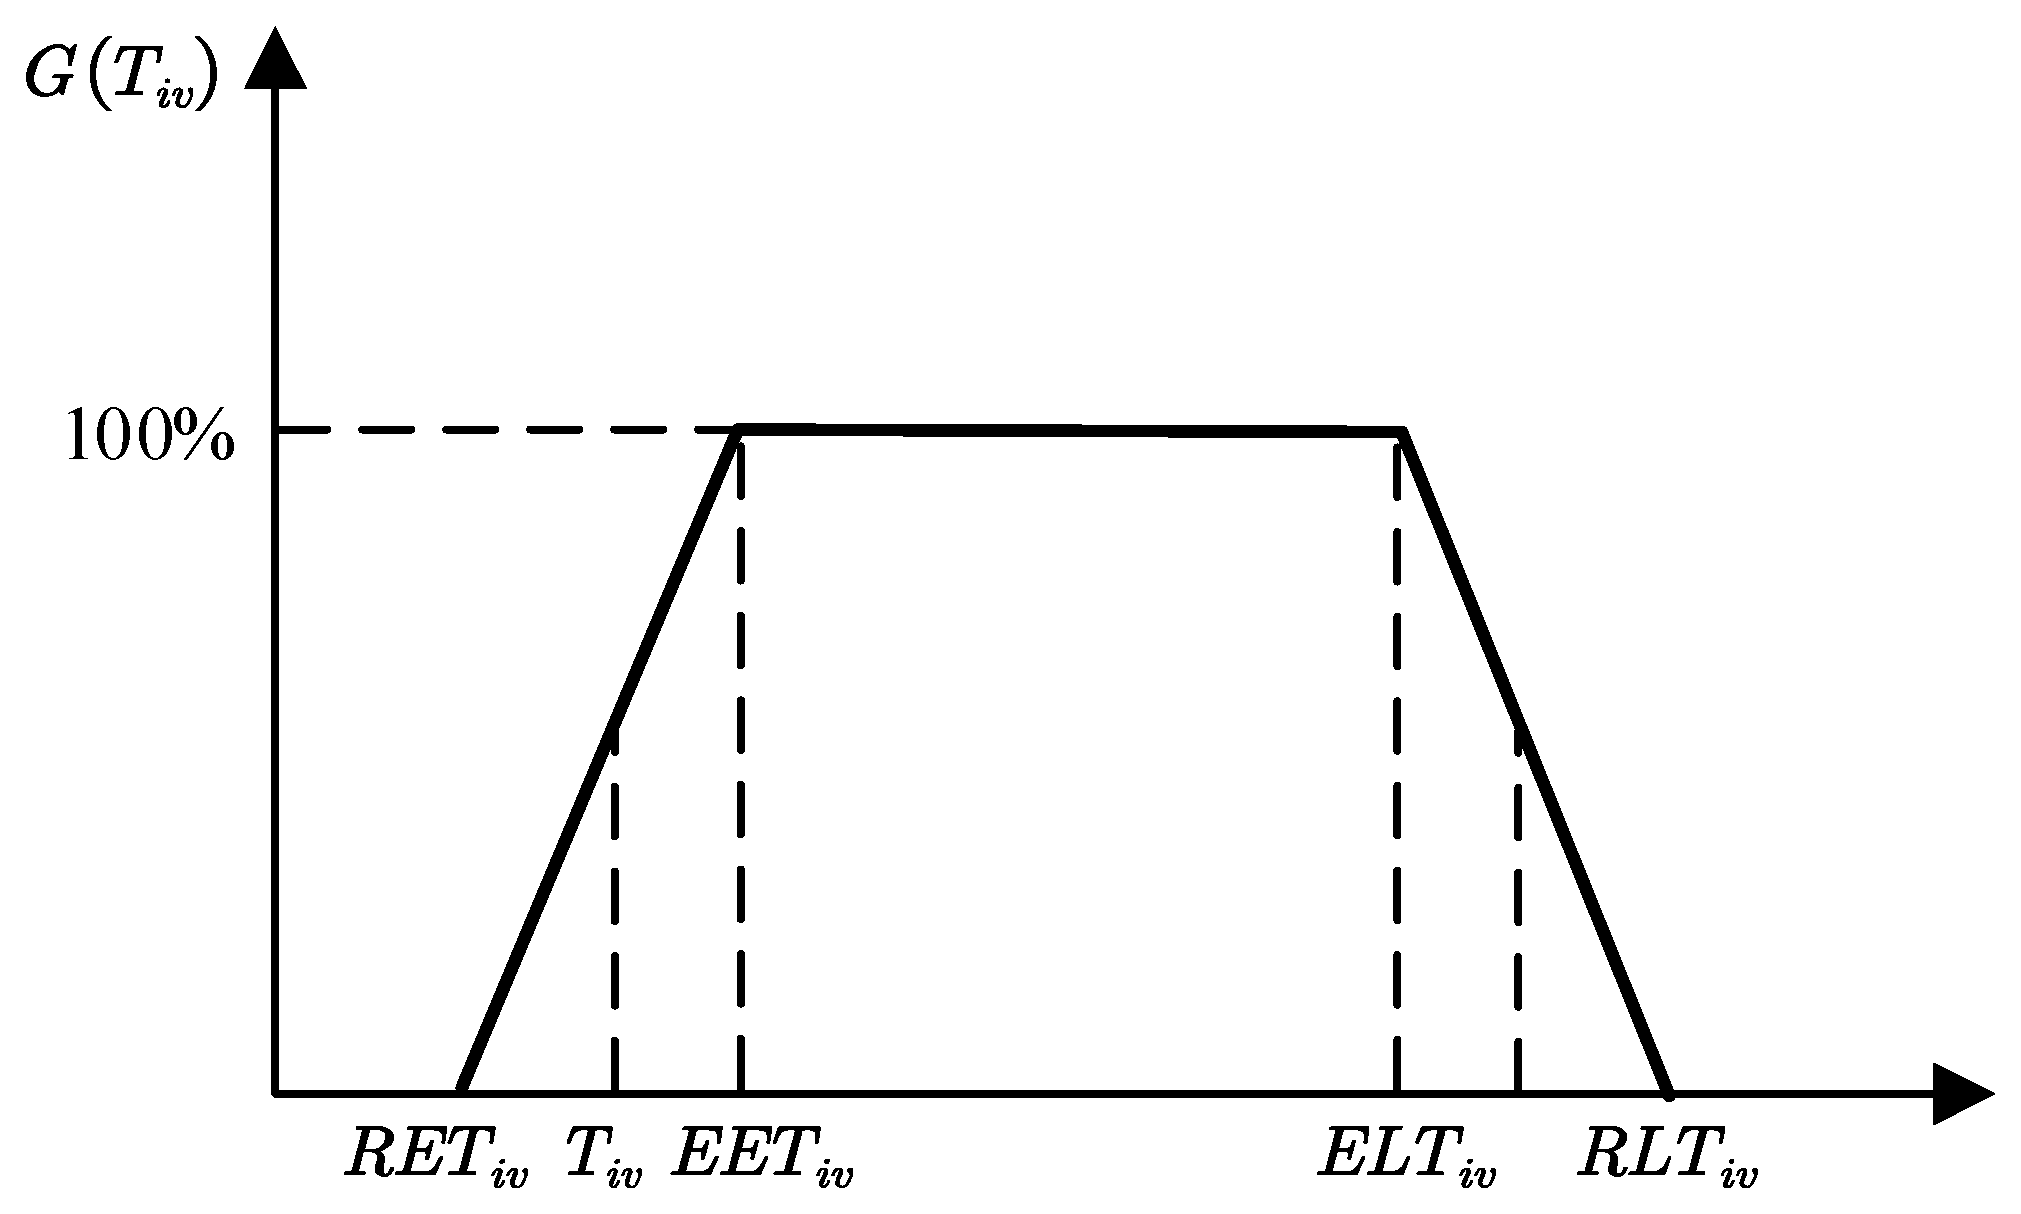
Considering that the longer the time of contact with hazardous waste materials, the higher the risk to the workers, it is stipulated that the workers should especially deal with the recovery of hazardous waste materials in a certain period of time, and give priority to the treatment of hazardous waste materials in a certain period of time. Work can also be carried out after the specified time is exceeded, but due to the increase in working hours, the time period exceeded may generate additional operational risks, and safety satisfaction will be discounted. Therefore, a fuzzy time window is proposed to reflect such a real situation, and the risk of the operator is described by the fuzzy processing method of the service time window. A safety satisfaction function is proposed, and then the risk weight is combined to describe the overall risk of the hazardous waste recycling network. The safety satisfaction function is represented by Equation (1):
In
Figure 5, we present the fuzzy time window, which depicts the safety satisfaction of collection point operators based on the vehicle’s arrival time within the dedicated time
for hazardous waste disposal. If the vehicle arrives within the expected time frame, the safety satisfaction of the collection point operators at its highest level is 100%. However, if the vehicle arrives earlier or later than the expected time, it will lead to a reduction in safety satisfaction, gradually decreasing as the gap between the vehicle arrival time and the expected time increases. The arrival time window constraint
represents the tolerable range for the collection point in terms of vehicle arrival time. If the arrival time falls outside the expected range and beyond the tolerable range, the safety satisfaction is reduced to 0.
3.4. Model Construction
The mathematical model constructed in this paper is as follows:
Objective function Equation (2) seeks to optimize cost efficiency, incorporating vehicle driving cost, loss cost, and storage cost while aiming for optimal cost from the perspectives of work efficiency and environmental sustainability. Objective function Equation (3) addresses the security service level, describing the overall risk of the network using the security satisfaction function combined with the risk weight.
Equation (4) ensures that the total amount of recovered materials does not exceed the total load capacity of all vehicles in the plant. Equation (5) guarantees that the recovery amount of each vehicle does not exceed its load capacity. Equation (6) specifies that only one vehicle can serve each collection point. Equation (7) ensures that the amount of recycled materials received by the processing center in the plant is equal to the amount generated by each collection point. Equation (8) sets the minimum level of safety service to 0. Equation (9) corresponds to the decision variable, with a value of 1 indicating that vehicle serves collection point , and 0 indicating that it does not.
4. Solution Methodology
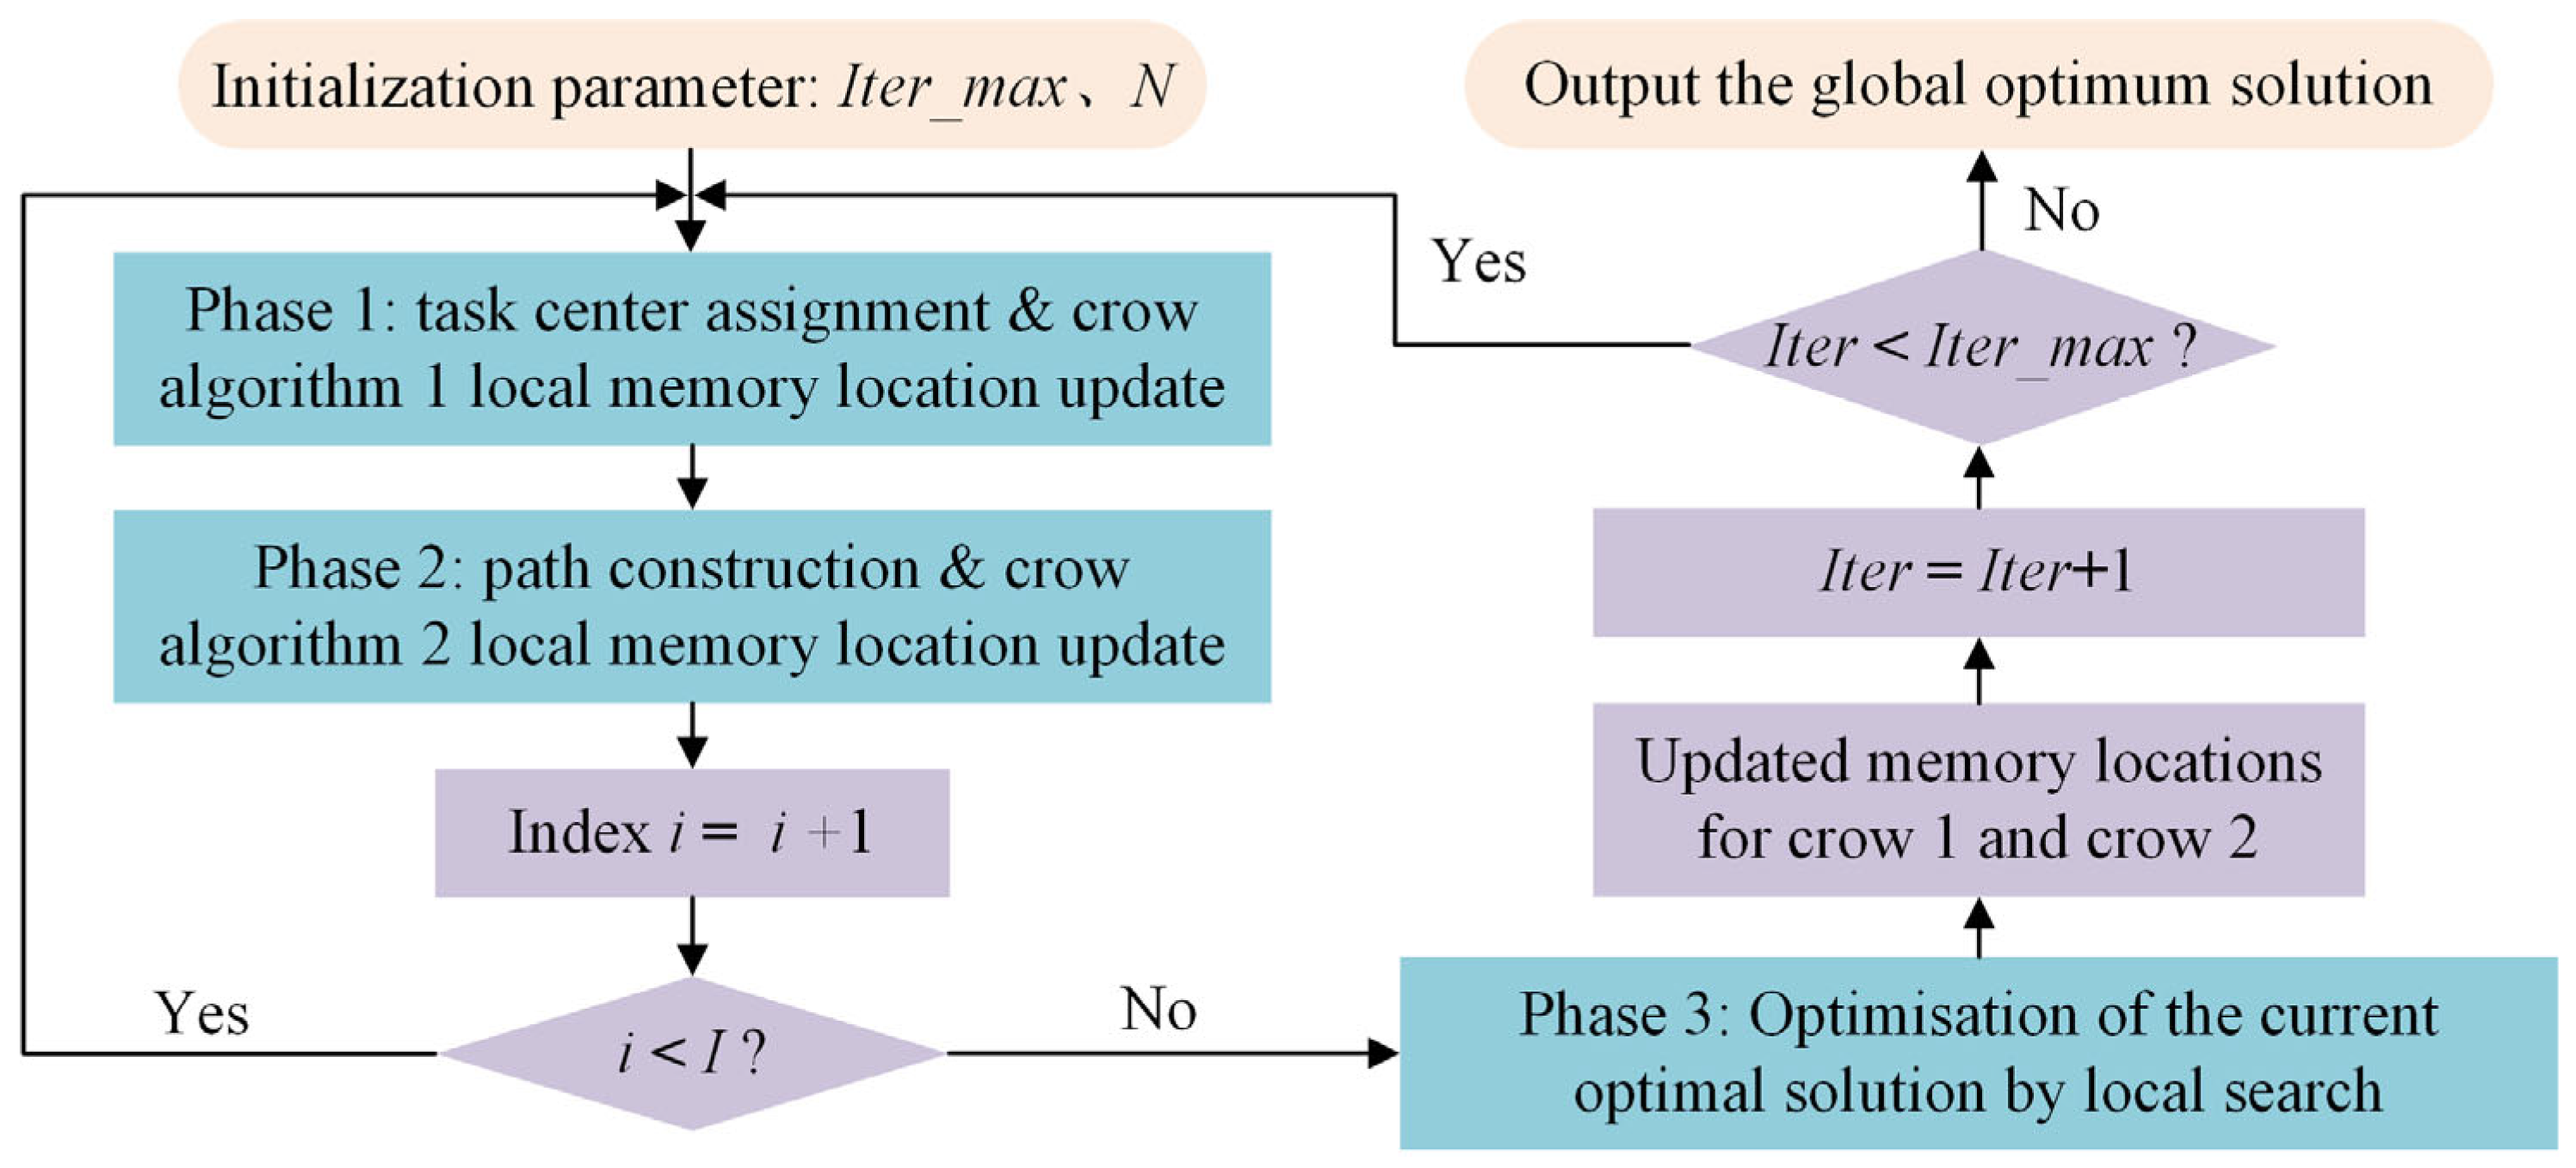
When confronted with the challenge of safely recovering hazardous materials from multi-task centers, we proposed a discrete crow search algorithm (DCSA) based on Levy mutation to solve this problem. A sophisticated analytical disassembly process was employed which divides the solution into three distinct phases. Initially, the transport vehicles are assigned to their respective task centers in the first phase. The second phase is focused on path planning for each vehicle, along with the calculation of cost efficiency for each path. Finally, the third phase involves the integration of risk satisfaction metrics to provide a comprehensive evaluation of the optimal solution among all current paths. These latter two phases are completed using different raven algorithms, each utilizing separate sets of memory location update rules.
However, updating the position in the absence of a high-quality solution, as a leader in the original crow search algorithm, can result in a limited ability to find the optimal solution. In light of this, the Levy flight search strategy has been introduced as a replacement for the random search process. The Levy flight is a process of random wandering that encompasses a large number of short step-length close wanderings, accompanied by long-distance wandering with large step lengths. The Levy distributed random numbers generated based on normal distribution.
In this case, the position update formula for the crow search algorithm is
The formula for Levy flight is as follows:
where
α is a random number and
β is a constant (set to 1). The formula for the calculation is as follows:
The final formula for the crow update position is
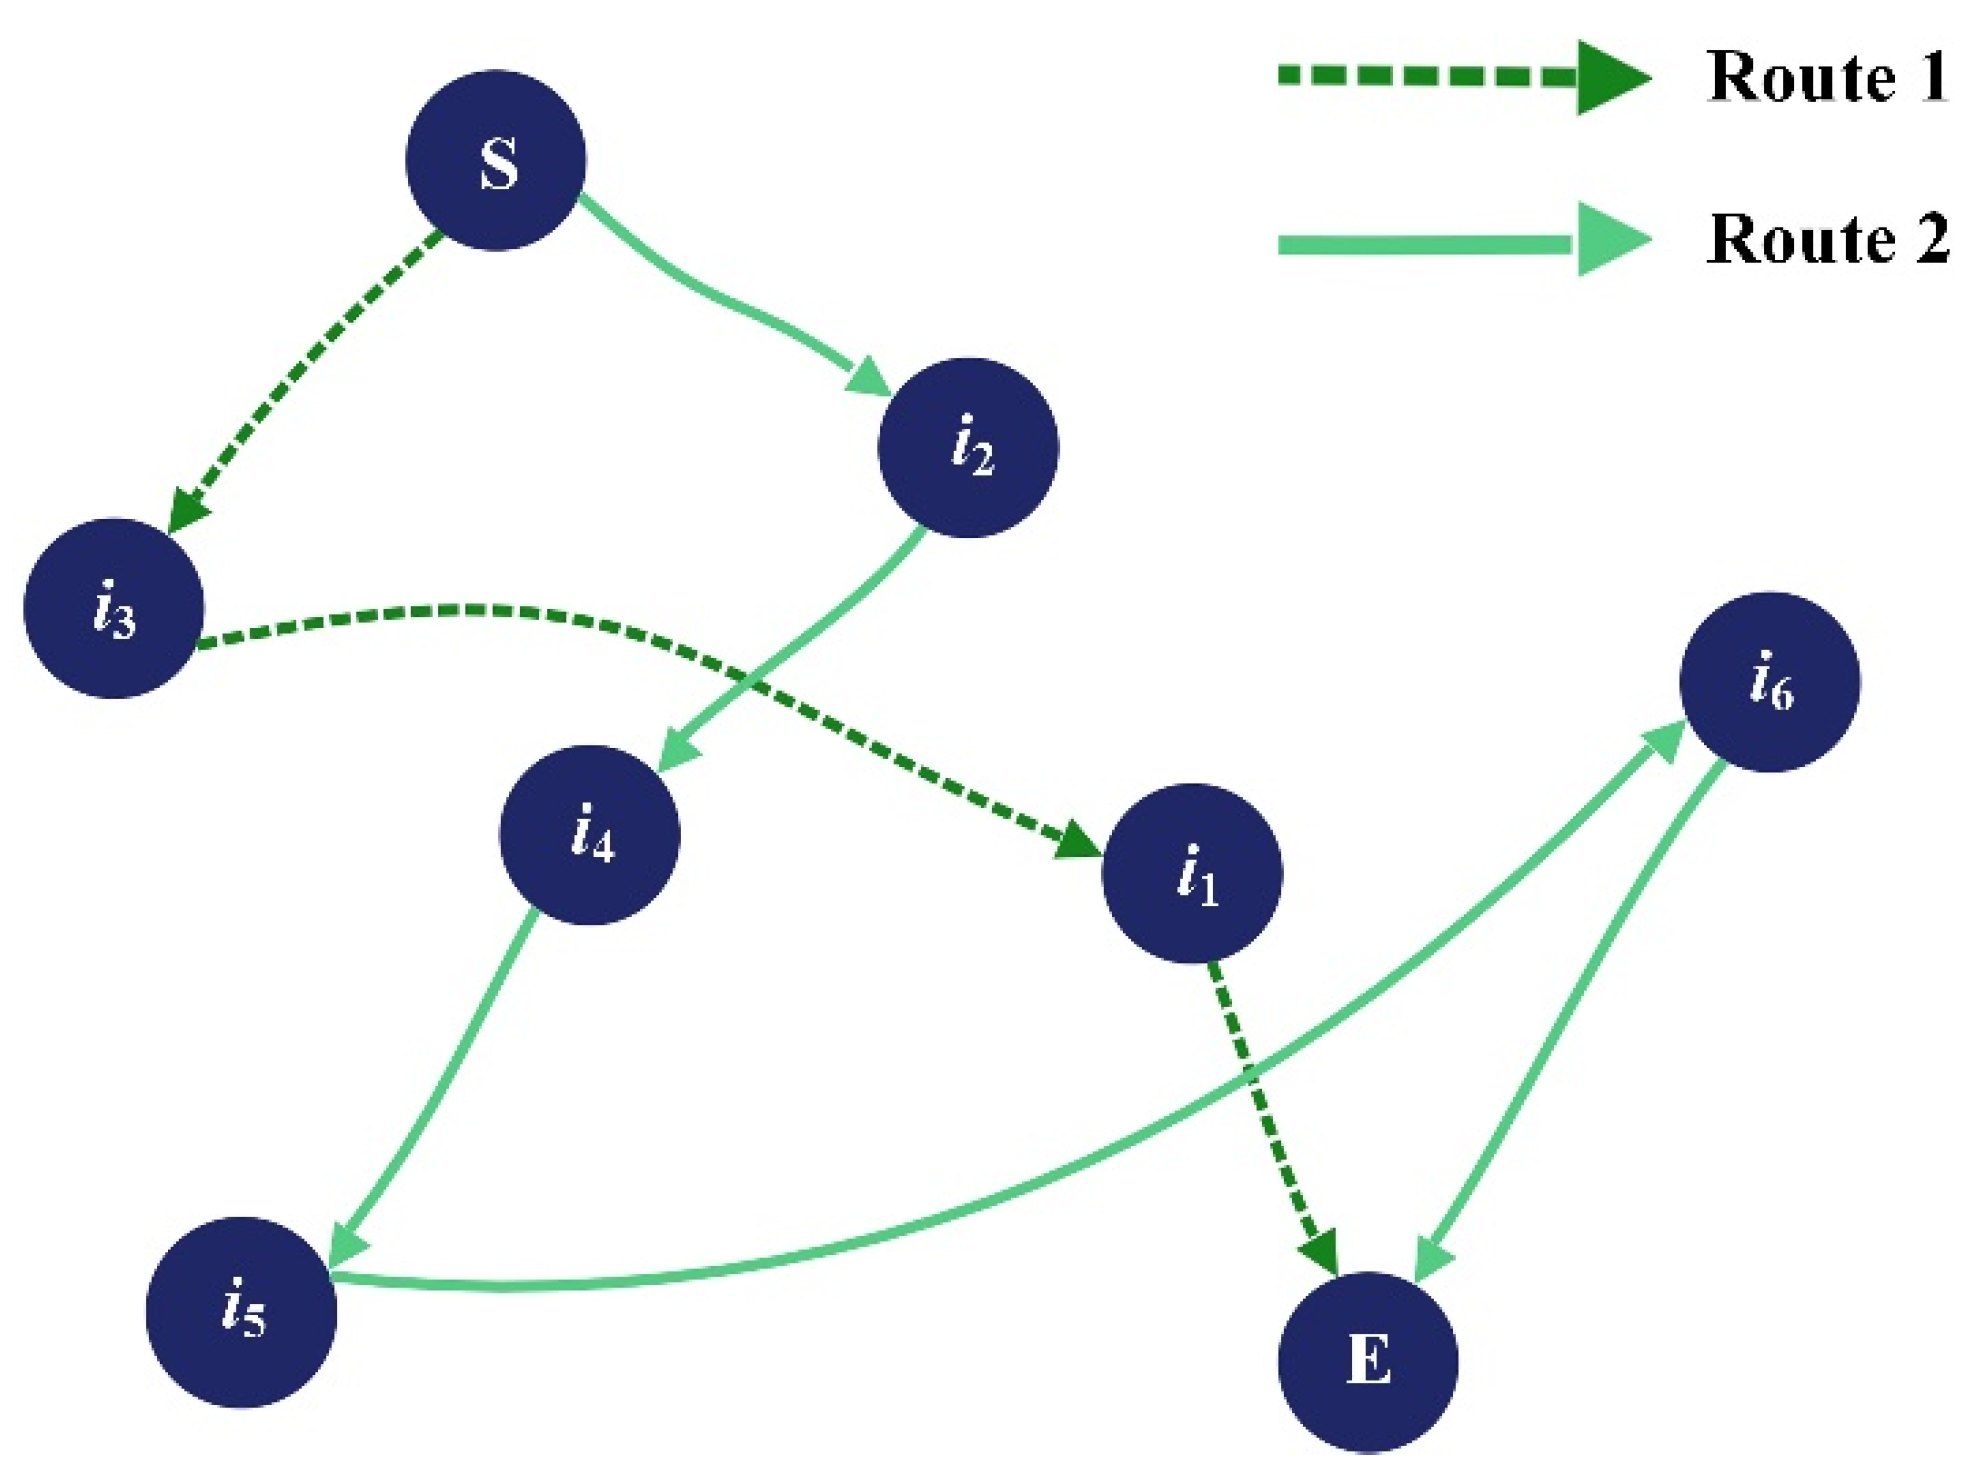
As an illustration of the aforementioned three phases, consider a scenario where there exist six hazardous waste collection points, numbered 1–6, and only two transport vehicles are available to cater to these points. In the first phase, crow search algorithm 1 is employed to allocate each task center to a specific transport vehicle. This is carried out by sequentially dividing the task centers among the vehicles, determining the transport service range of each vehicle. For instance, transport vehicle 1 is assigned to collect hazardous waste from collection points 1, 4, and 6, while transport vehicle 2 is responsible for collection points 2, 3, and 5.
Moving on to the second phase, paths are constructed for each transport vehicle based on their respective service ranges. These paths are computed using the colony of 2, with the transport path of vehicle 1 being logistics center-1-6-4-hazardous waste treatment center, and the transport path of vehicle 2 being logistics center-5-2-3-hazardous waste treatment center.
In the third and final phase, the risk satisfaction index is taken into account, and the current optimal solution is further optimized through local search to obtain an even better solution. This involves considering the risk satisfaction metrics and fine-tuning the current optimal solution through local search to arrive at the most optimal outcome. The optimal solutions obtained are logistics center-6-1-4-hazardous waste treatment center and logistics center-5-3-2-hazardous waste treatment center. The entire double-crow search algorithm is depicted in
Figure 6, showcasing the complete flow of the process.
5. Case Study
This section may be divided by subheadings. It should provide a concise and precise description of the experimental results, their interpretation, as well as the experimental conclusions that can be drawn.
5.1. Description
The issues explored in this study arose from an in-depth study of a large shipyard in China. During the fieldwork, we identified coordination needs related to reverse logistics and on-site HSE management, which led to the development of this study.
In S Shipyard, the primary sources of hazardous waste, specifically waste paint barrels and waste paint slag, are generated during the coating process. This process can be divided into four distinct stages: steel pretreatment, segmented coating, dock coating, and wharf completion coating. The entire ship construction process is monitored, and each operational stage occurs in different areas, such as the steel plate yard, the cruise ship painting platform, and the dock area. This necessitates the recycling of hazardous waste from each area to a designated treatment center for professional disposal. To enhance operational efficiency, the logistics center is tasked with vehicle allocation, ensuring that vehicles are dispatched uniformly from a central location to each collection point for hazardous waste transport. In actual shipyard practice, safety equipment and vehicles need to be regularly inspected and maintained as part of strict on-site safety management protocols. Thus, situations such as vehicle breakdowns or safety equipment failures during transport, which could lead to the disruption of operations, were not considered in this study. After completing a task, vehicles proceed directly to the next assignment without returning to the logistics center.
Figure 7 illustrates the process of hazardous waste management and recycling in shipyards.
Due to restrictions on confidentiality during the construction of China’s first domestically constructed large cruise ship, the case study in this paper is based on some of the real data from the cruise shipyard, adjusted to take into account the operating conditions common to large shipyards. That is, the data used in this study come from field research and existing records in shipyards, supplemented by industry common sense to ensure representation. The approach balances the requirement for confidentiality with the need to maintain reproducibility and relevance. There are six hazardous waste collection points in the factory. One logistics center is represented by S, and one hazardous waste treatment center, denoted as E. Operators are assigned to recycle hazardous waste materials within specified time frames, maintaining optimal satisfaction levels throughout operations. Details regarding node information and vehicle-related parameters are provided in
Table 3,
Table 4 and
Table 5 and illustrated in
Figure 8.
The risk weight coefficient of safety importance was derived from on-site investigations and field studies conducted at shipyards. Factors such as different production processes, the nature of materials involved (e.g., toxic gases, flammable substances), and the varying coverage areas of work zones were considered. Based on these practical observations and expert judgments, the coefficients were assigned to reflect the relative safety risks in different areas. This approach ensures that the weighting captures real-world conditions specific to shipyard environments.
5.2. Results and Comparative Analysis
The optimal solutions were obtained using the methodology outlined in
Section 4, with findings presented in
Table 6. The optimal resolution involves the deployment of two vehicles: a 1-ton capacity forklift and a 3-ton capacity forklift. Specifically, a forklift with a 1-ton load capacity follows the route from the logistics center to 3 to 1 and then to the processing center, while the 3-ton forklift travels from the logistics center to collection points 2, 4, 5, and 6 before reaching the processing center. The path planning diagram is illustrated in
Figure 9.
To evaluate the effectiveness of the proposed model concerning safety objectives, we compared the optimal solutions derived from the safety–efficiency scheduling model with those obtained from a cost-focused approach. For this analysis, we selected the top nine solutions based on their cost effectiveness to serve as benchmarks, allowing for a comprehensive assessment of potential safety risks that may be overlooked in cost-driven scenarios.
Table 7 presents Solution 1 as the optimal configuration that balances safety, cost, efficiency, and environmental considerations. This option prioritizes safety and minimizes potential safety risks while maintaining good cost effectiveness. The relatively high level of safety services under option 1 demonstrates that the option is able to ensure the safety of the hazardous waste transport process while still keeping costs under control. Although the target value for cost-effectiveness is slightly lower than some cost-driven options, it is a superior overall performer and is effective in avoiding the long-term risks associated with neglecting safety. In contrast, Solutions 2 to 10, which are based solely on cost objectives, lack safety considerations, leading to a less comprehensive evaluation.
Further analysis involved inputting the results of Solutions 2 to 10 into Equation (3) to derive the health and safety service level values for each solution, quantifying their performance in terms of Health, Safety, and Environment management. In terms of the data, these options have better cost-effectiveness target values, meaning that they perform well in cost control and are able to minimize transport costs, storage costs and other management costs. However, these cost-focused optimized options have relatively low security service levels. This suggests that while these solutions may optimize costs in the short term, they may have higher security risks due to a lack of security considerations. Specifically, options with lower safety service levels may have neglected to invest in safety (e.g., delayed arrivals, insufficient risk management, etc.) during the transport of hazardous wastes, resulting in lower safety satisfaction.
A comparison of the scenarios shows a rather clear contrast between cost optimization, and safety and security. While prioritizing cost and efficiency may seem beneficial, it somewhat compromises the level of security. Such a strategy may increase risk and pose a long-term threat to operator security and overall organizational integrity. That is, the more focused on cost reduction, the more security may be neglected, leading to an increase in overall security risk. Cost-driven optimization can lead to a conflict between ‘short-term benefits’ and ‘long-term risks’. Although this strategy reduces costs initially, it may lead to unexpected safety accidents, environmental pollution or employee health problems in the long run, ultimately increasing the hidden costs of the organization. At the same time, safety-first optimization does not mean ignoring cost effectiveness. On the contrary, through reasonable planning and management, safety and cost effectiveness can be well-balanced, avoiding the high extra costs caused by safety problems.
By incorporating weights for risks and operational conditions into the model, we optimized vehicle allocation tailored to the specific needs of each collection point. This results in enhanced transport routes and solutions that achieve a balance between safety service satisfaction, efficiency, and cost effectiveness. Ultimately, these findings validate the effectiveness of our proposed model and methodology, underscoring the importance of integrating safety, efficiency, and cost considerations in hazardous waste management. This integrated approach not only improves transport efficiency and reduces costs, but also ensures operator safety, supporting the sustainable development of reverse hazardous waste management, particularly within the context of cruise ship construction.
5.3. Computational Results and Method Comparison
To validate the effectiveness of the proposed solution approach, two well-established algorithms, NSGA-II [
62] and DGWO [
63], were selected as benchmark comparators. A series of numerical experiments are conducted to assess and compare the performance of the three algorithms in solving multi-objective optimization problems. The evaluation metrics employed included run time, feasible solution ratio (FSR), constraint violation intensity (CVI), and hypervolume (HV). To mitigate the influence of randomness, each experiment was independently executed 50 times, and the average results are reported. All experiments were performed on a Windows-based computer equipped with an Intel(R) Core (TM) i7-9570H CPU running at 2.60 GHz.
Specifically, the FSR reflects the proportion of feasible solutions—those that satisfy all imposed constraints—among the total number of solutions generated, thereby indicating that the capability of algorithm in constraint handling. The CVI quantifies the severity of constraint violations in infeasible solutions, providing a nuanced evaluation of the performance under both mild and severe infeasibility scenarios. The HV metric, calculated over the set of feasible solutions, measures both the convergence and diversity of the obtained Pareto front in the objective space. A higher HV value signifies superior quality of the solution set in terms of coverage and optimality.
As shown in
Table 8, DGWO achieved the shortest average runtime (3.3 s), indicating a certain advantage in computational efficiency. DCSA required 3.6 s on average, slightly outperforming NSGA-II, which recorded a runtime of 4.9 s. However, in terms of the three key indicators for solution quality and diversity—feasible solution ratio (FSR), constraint violation intensity (CVI), and hypervolume (HV)—DGWO performed poorly. Its FSR was only 84%, CVI reached as high as 10.1%, and HV was the lowest among the three algorithms, at 0.77. These results suggest that despite its computational speed, DGWO suffers from significant deficiencies in solution stability and distribution uniformity. NSGA-II, on the other hand, demonstrated superior solution quality, with the highest FSR of 91% and the highest HV of 0.93, indicating excellent global search capability in multi-objective optimization. Nevertheless, it also exhibits the longest runtime and slightly inferior convergence performance, as reflected by a CVI of 5.2%. In contrast, DCSA exhibited a well-balanced performance across all evaluation metrics. It achieved the best convergence with the lowest CVI of 4.7%, while maintaining a competitive computational time. Furthermore, its FSR (90%) and HV (0.90) were close to those of NSGA-II, reflecting strong overall effectiveness in both solution quality and stability.
In summary, DCSA offers a favorable trade-off between computational efficiency, convergence stability, and solution diversity, making it a robust and practical optimization strategy for multi-objective problems.
6. Discussion
6.1. Synthesis of Key Findings
This study developed a multi-objective reverse logistics optimization model for large cruise ship construction.
Model proposal: This study proposes a hazardous waste reverse logistics optimization model with an integrated consideration of HSE management, providing a solution that balances cost, efficiency, safety and environment, which can effectively optimize the hazardous waste recycling solution in shipyards, improve the overall operational efficiency, and reduce potential safety risks and environmental pollution.
Objective trade-off: By comparing the cost-driven solution, the importance of integrated optimization in practical applications is clarified, especially how to balance the relationship between cost and safety in high-risk environments, and to avoid long-term safety hazards brought about by short-term cost savings.
Method comparison: the DCSA method proposed in this paper demonstrated superiority in solving, especially good performance in computational efficiency, convergence stability and diversity of solutions. Compared with the existing NSGA-II and DGWO methods, DCSA demonstrated higher solution capability.
6.2. Theoretical Contributions
The contribution of this study is the combination of HSE management with reverse logistics optimization models, highlighting the multi-objective optimization of HSE integration, that is, optimizing transport routes and recycling options while ensuring safety and environmental protection during waste transport. A new theoretical framework is proposed for industries involving hazardous materials and complex logistics networks, such as shipbuilding. Many traditional studies may have neglected safety issues in optimization, and the optimized solutions obtained, although reducing costs in the short term, are likely to pose greater safety risks in the future. By integrating sustainability into the reverse logistics recycling process and promoting a safety-first culture, shipyards can create a resilient, cost-effective reverse logistics system that minimizes risk and supports long-term operational excellence.
6.3. Limitations of the Work
There are still some limitations to this study. Firstly, the model assumes that the demand at all collection points and transport routes is known and certain, whereas in reality there can be uncertainty in the amount of waste generated. For example, if the production schedule of a shipyard changes, the amount of waste generated and the collection time will change. Therefore, future research could consider introducing uncertainty modeling to address the uncertainty in these variables. Secondly, although the safety satisfaction function in the model can better assess safety based on time efficiency, the function is based on the setting of time and risk weights, which may not be fully applicable to different regions, management backgrounds or policy environments, and its applicability has certain limitations. Therefore, future research needs to consider the adaptation of the model in different environments. In addition, in scenarios involving a large number of vehicles and collection points, the model has a high computational complexity when dealing with large-scale data, and may face limitations in computational resources and time in practical applications. In this regard, future research can try to adopt more efficient algorithms. Finally, the current model is mainly based on the operation of a single shipyard, and the popularization of the shipbuilding industry requires further research and exploration.
7. Conclusions and Future Research
In recent years, cruise ship construction orders have increased significantly, and the amount of hazardous waste generated during the cruise ship construction process has also risen. This study addresses the critical challenges associated with hazardous waste management in the context of cruise ship construction. By developing a novel reverse logistics network operation scheduling optimization model, we integrated considerations of cost, efficiency, safety, and environmental sustainability. The key findings and contributions of this research are summarized as follows.
In the context of hazardous waste recycling during the cruise construction process, this paper proposes a reverse logistics network operation optimization model that embraces a holistic HSE perspective, integrating cost, efficiency, and risk considerations. The model employed fuzzy operation time windows to reflect safety satisfaction and leverages the DCSA method based on Levy mutation to derive a green, efficient, and safe scheduling scheme. The objective of the model was to optimize the allocation of transport vehicles, path planning, and risk assessment to improve operational efficiency and safety. To enhance the realistic nature of the model, this paper considered factors such as vehicle load, transport cost, loading time, and risk weights, ultimately achieving better transport efficiency and safety.
To address the problem, this paper designs a three-phase approach: firstly, the allocation of transport vehicles to various task centers; secondly, route planning; and finally, the integration of risk satisfaction indicators for a comprehensive assessment. By comparing with the cost-only scenario, the results show that although cost-oriented scenarios may provide economic benefits in the short term, they often ignore risks that could lead to long-term consequences. The results of the comprehensive assessment indicate that the proposed model offers a more sustainable approach to hazardous waste management, emphasizing the importance of incorporating safety considerations into operational planning.
The model presented in this paper still has some limitations, focusing mainly on the scheduling of transport vehicles for a single hazardous waste pickup and not exploring the equity of risk for multiple hazardous waste types. Given the diverse safety and health impacts of different materials, future research could explore the risk equity of transporting multiple hazardous waste types within the same network to further enhance the applicability and comprehensiveness of the model. Based on the HSE management requirements of shipyards, future research could be extended to investigate a wide range of factors that affect logistics and HSE performance. These factors include the cost of training workers to handle hazardous waste and the availability and reliability of safety equipment. In addition, vehicle breakdowns or damage resulting in transport interruptions are worthy of further study. These factors can significantly affect cost volatility, transport accessibility and timeliness. Exploring these aspects will contribute to a deeper understanding of safety risk management and operational efficiency in shipbuilding environments.


