
Spectral Raman Database of Modern Acrylic Paints at 532 nm and 633 nm Laser Excitation Wavelengths

 , , , ,
  and
and 
Abstract
1. Introduction
2. Experimental
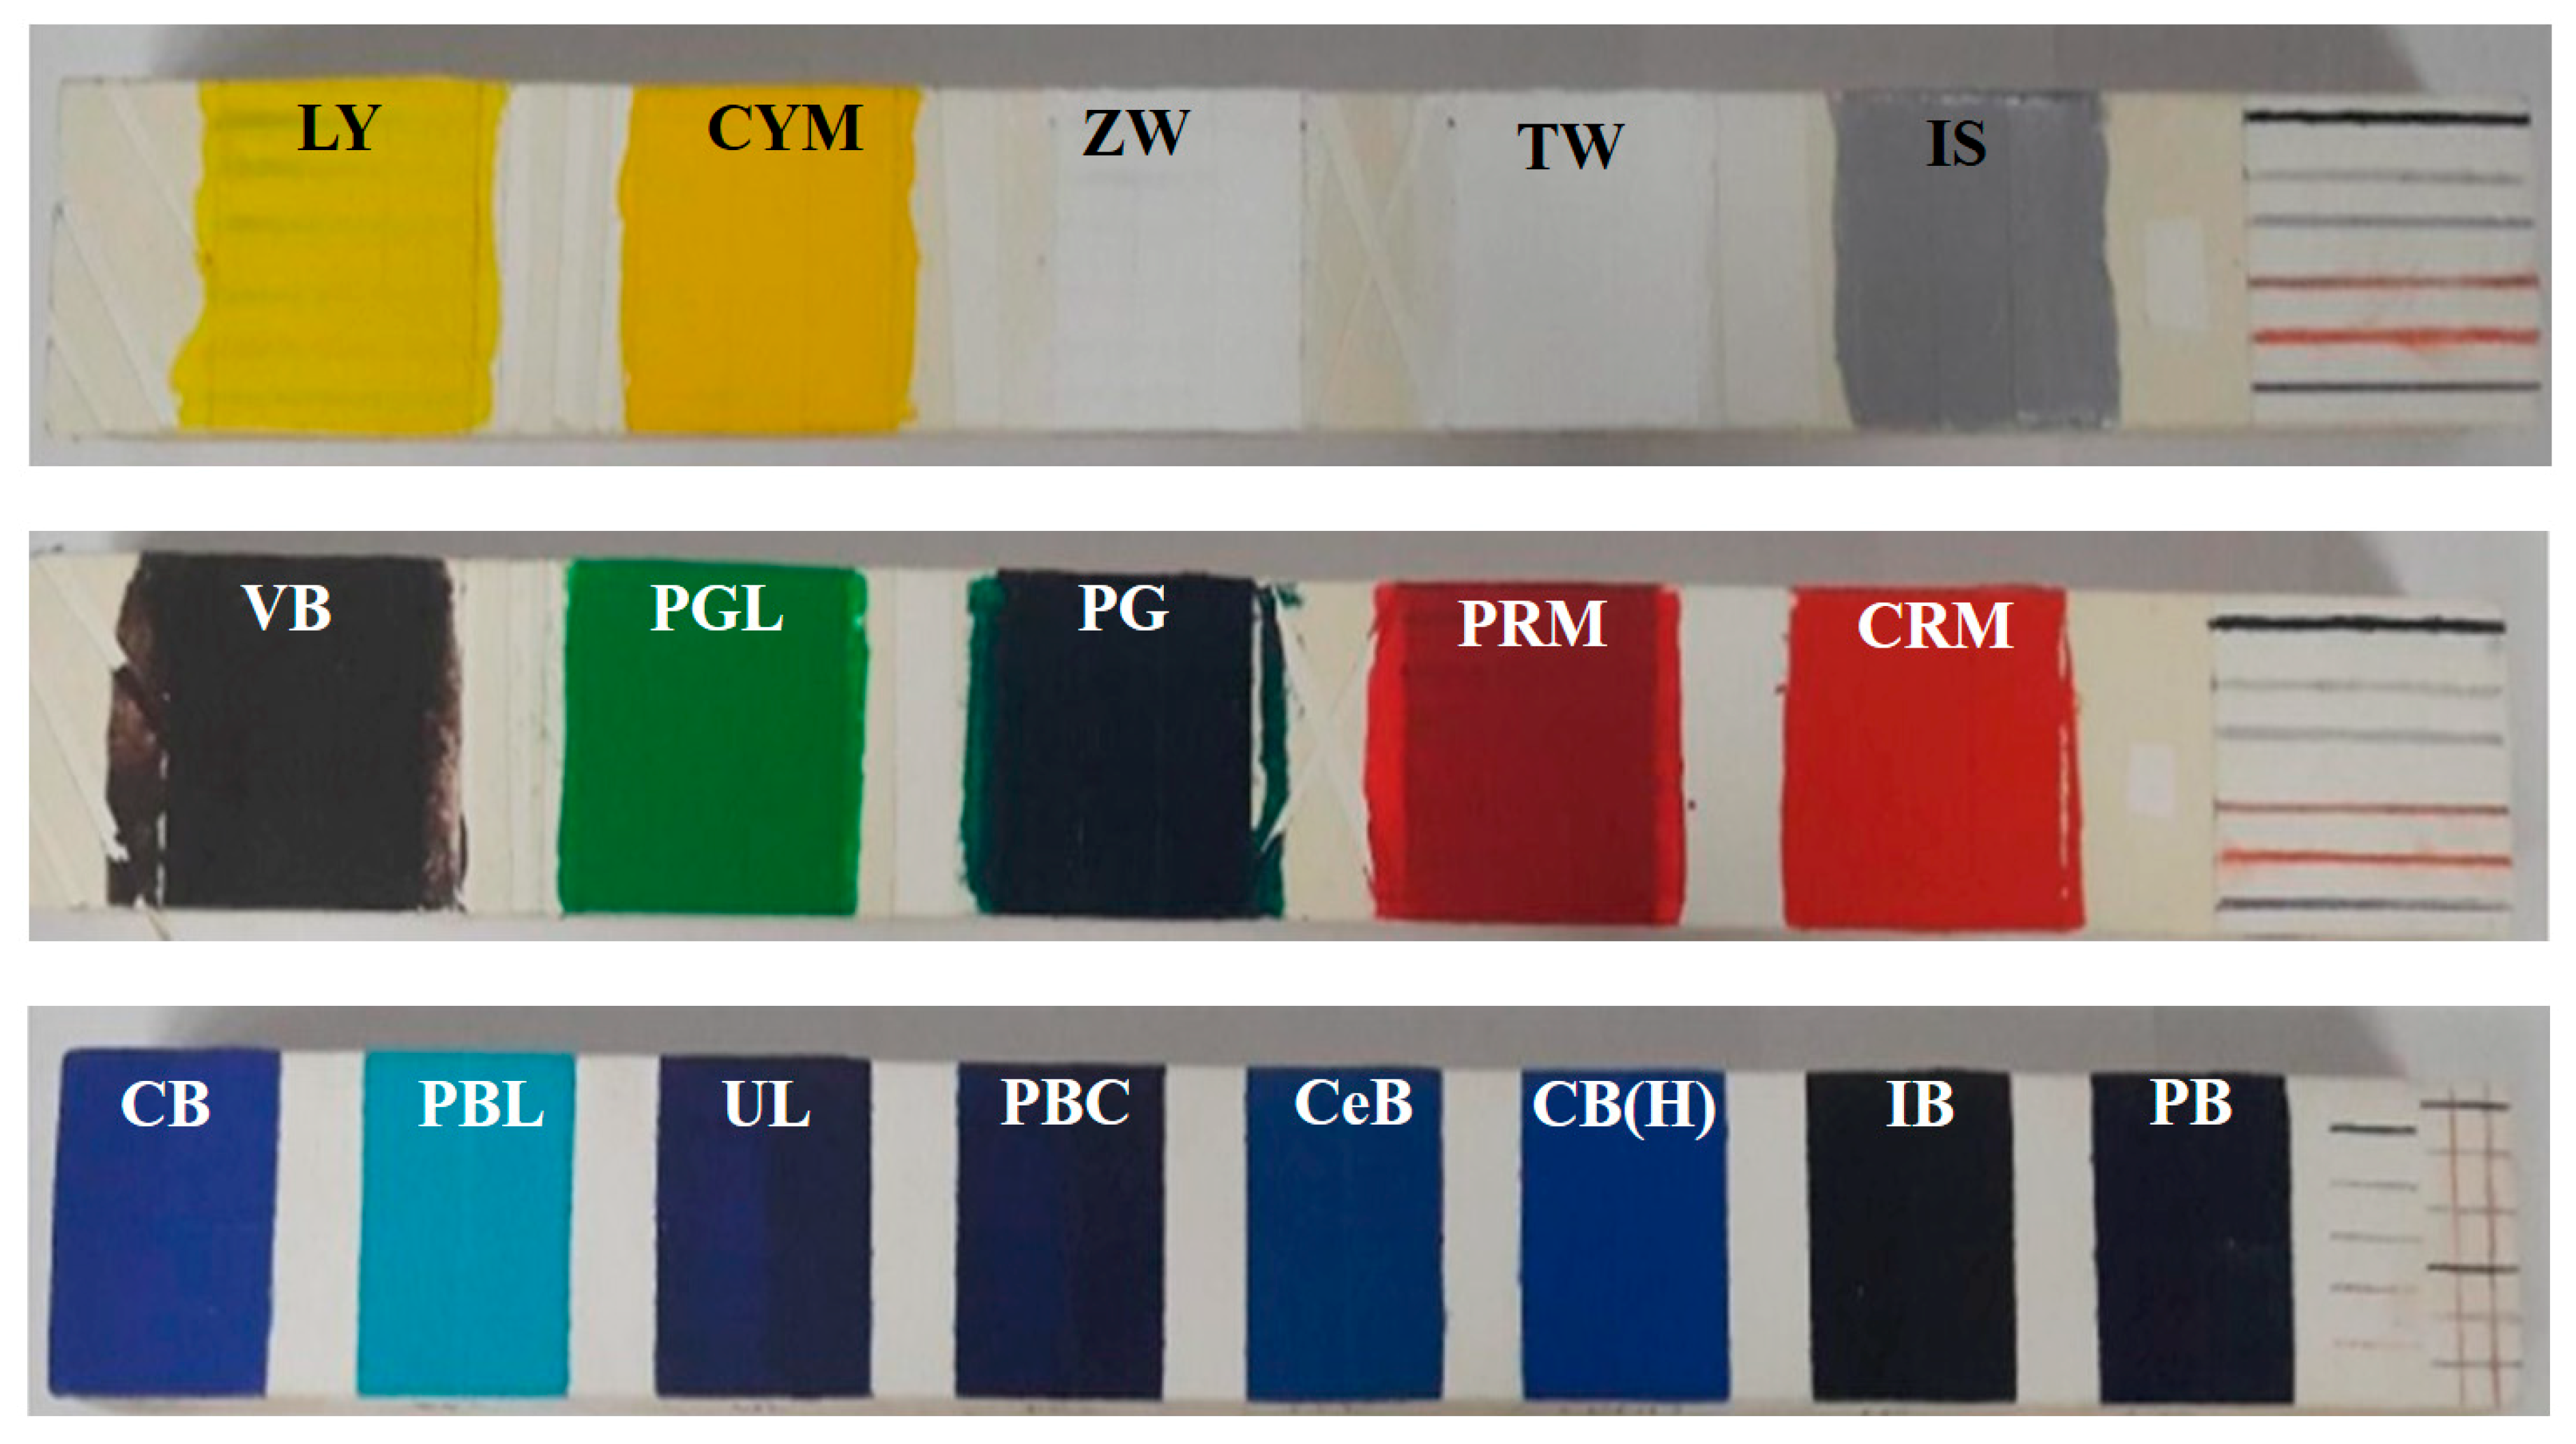
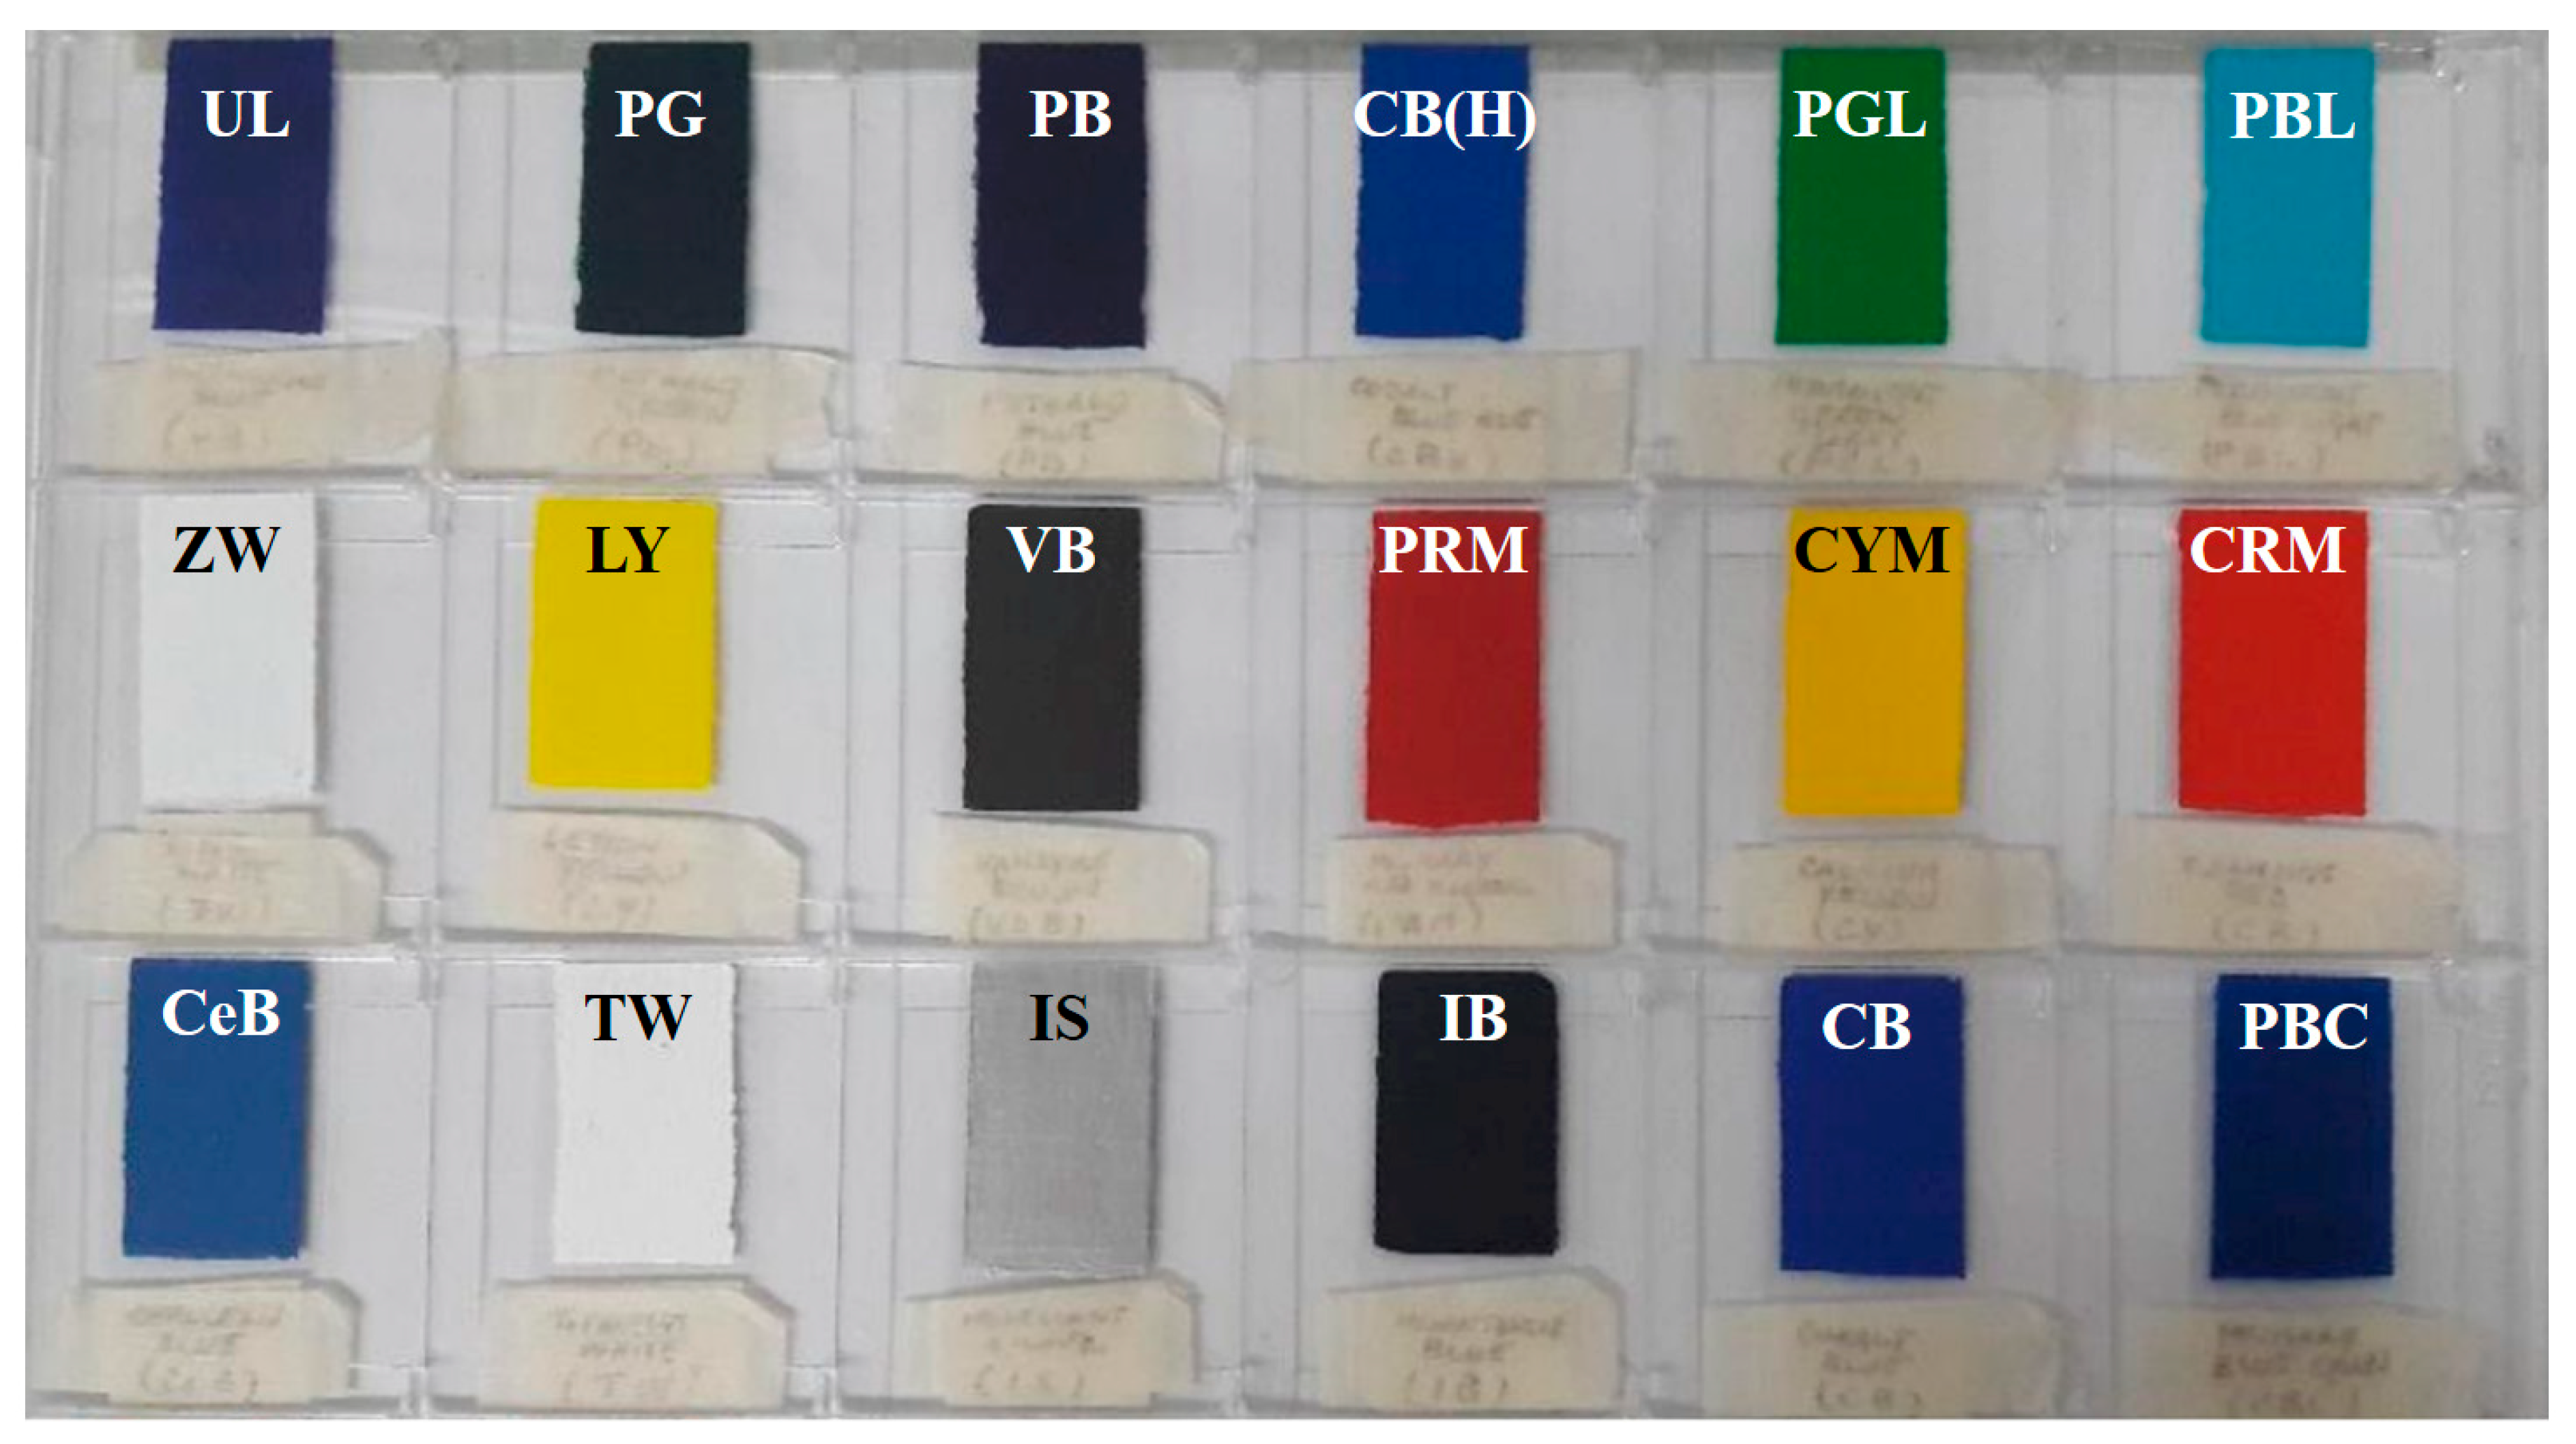
2.1. Materials
2.2. Experimental Instrument
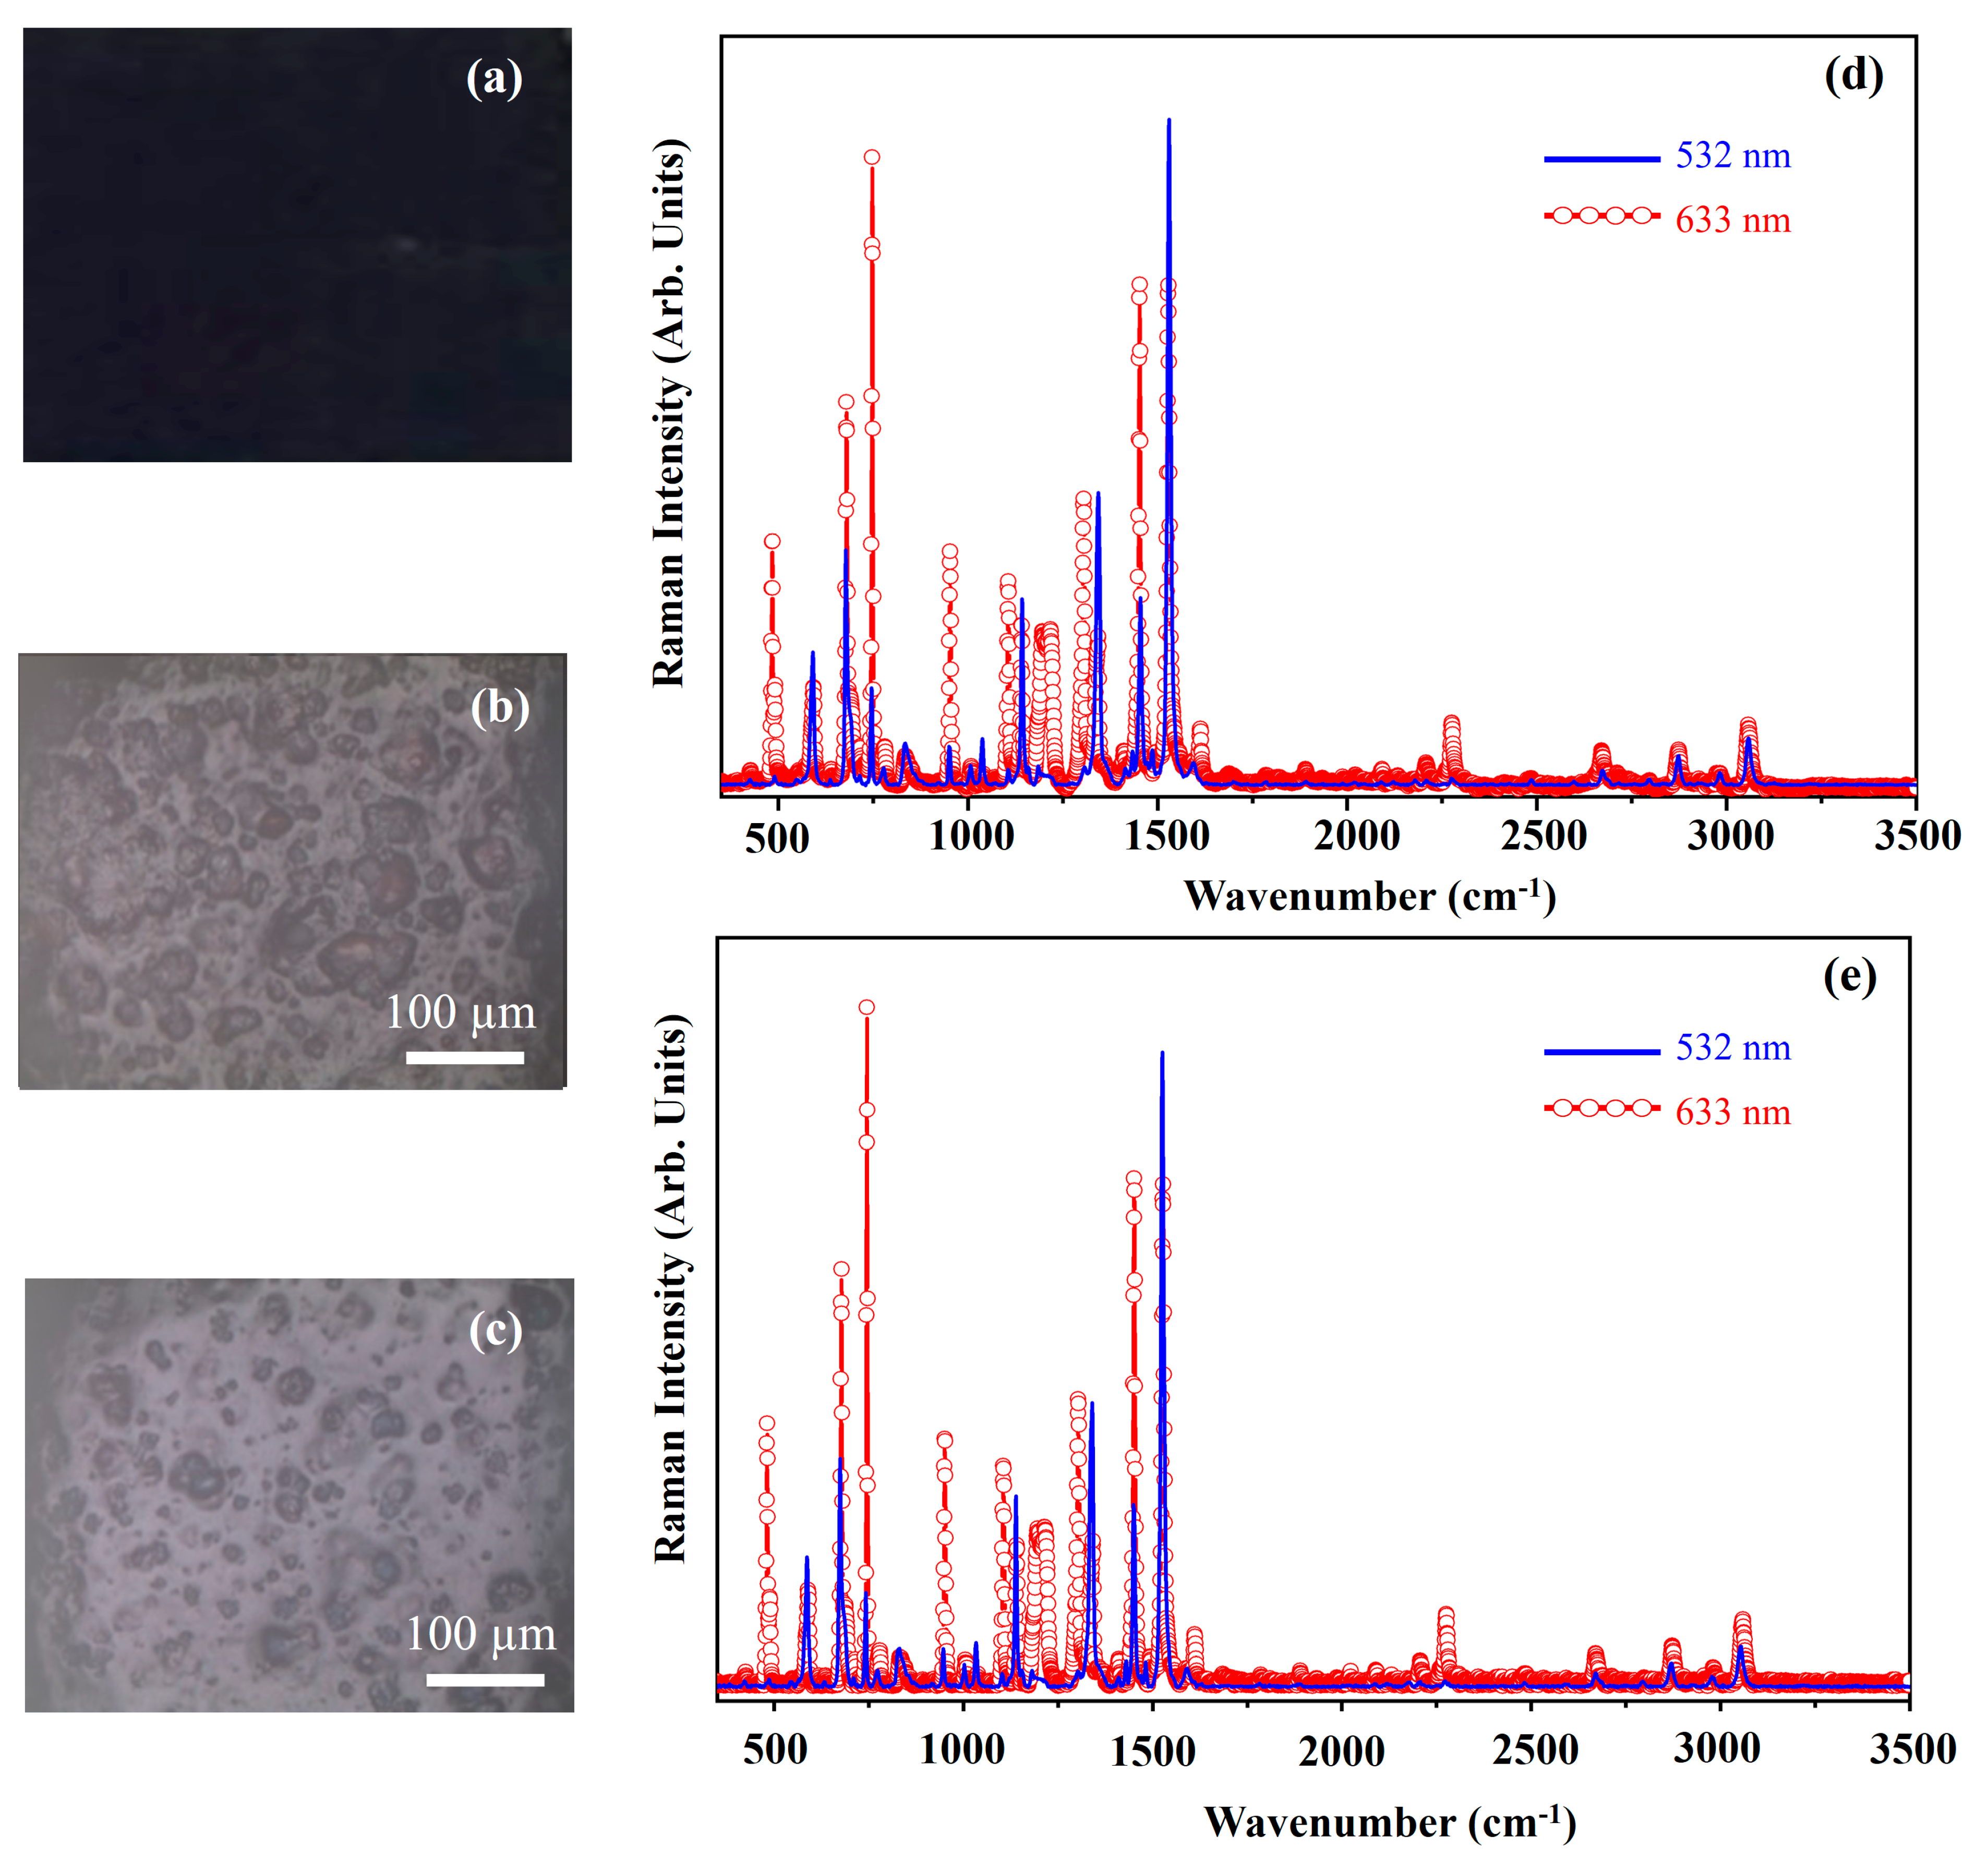
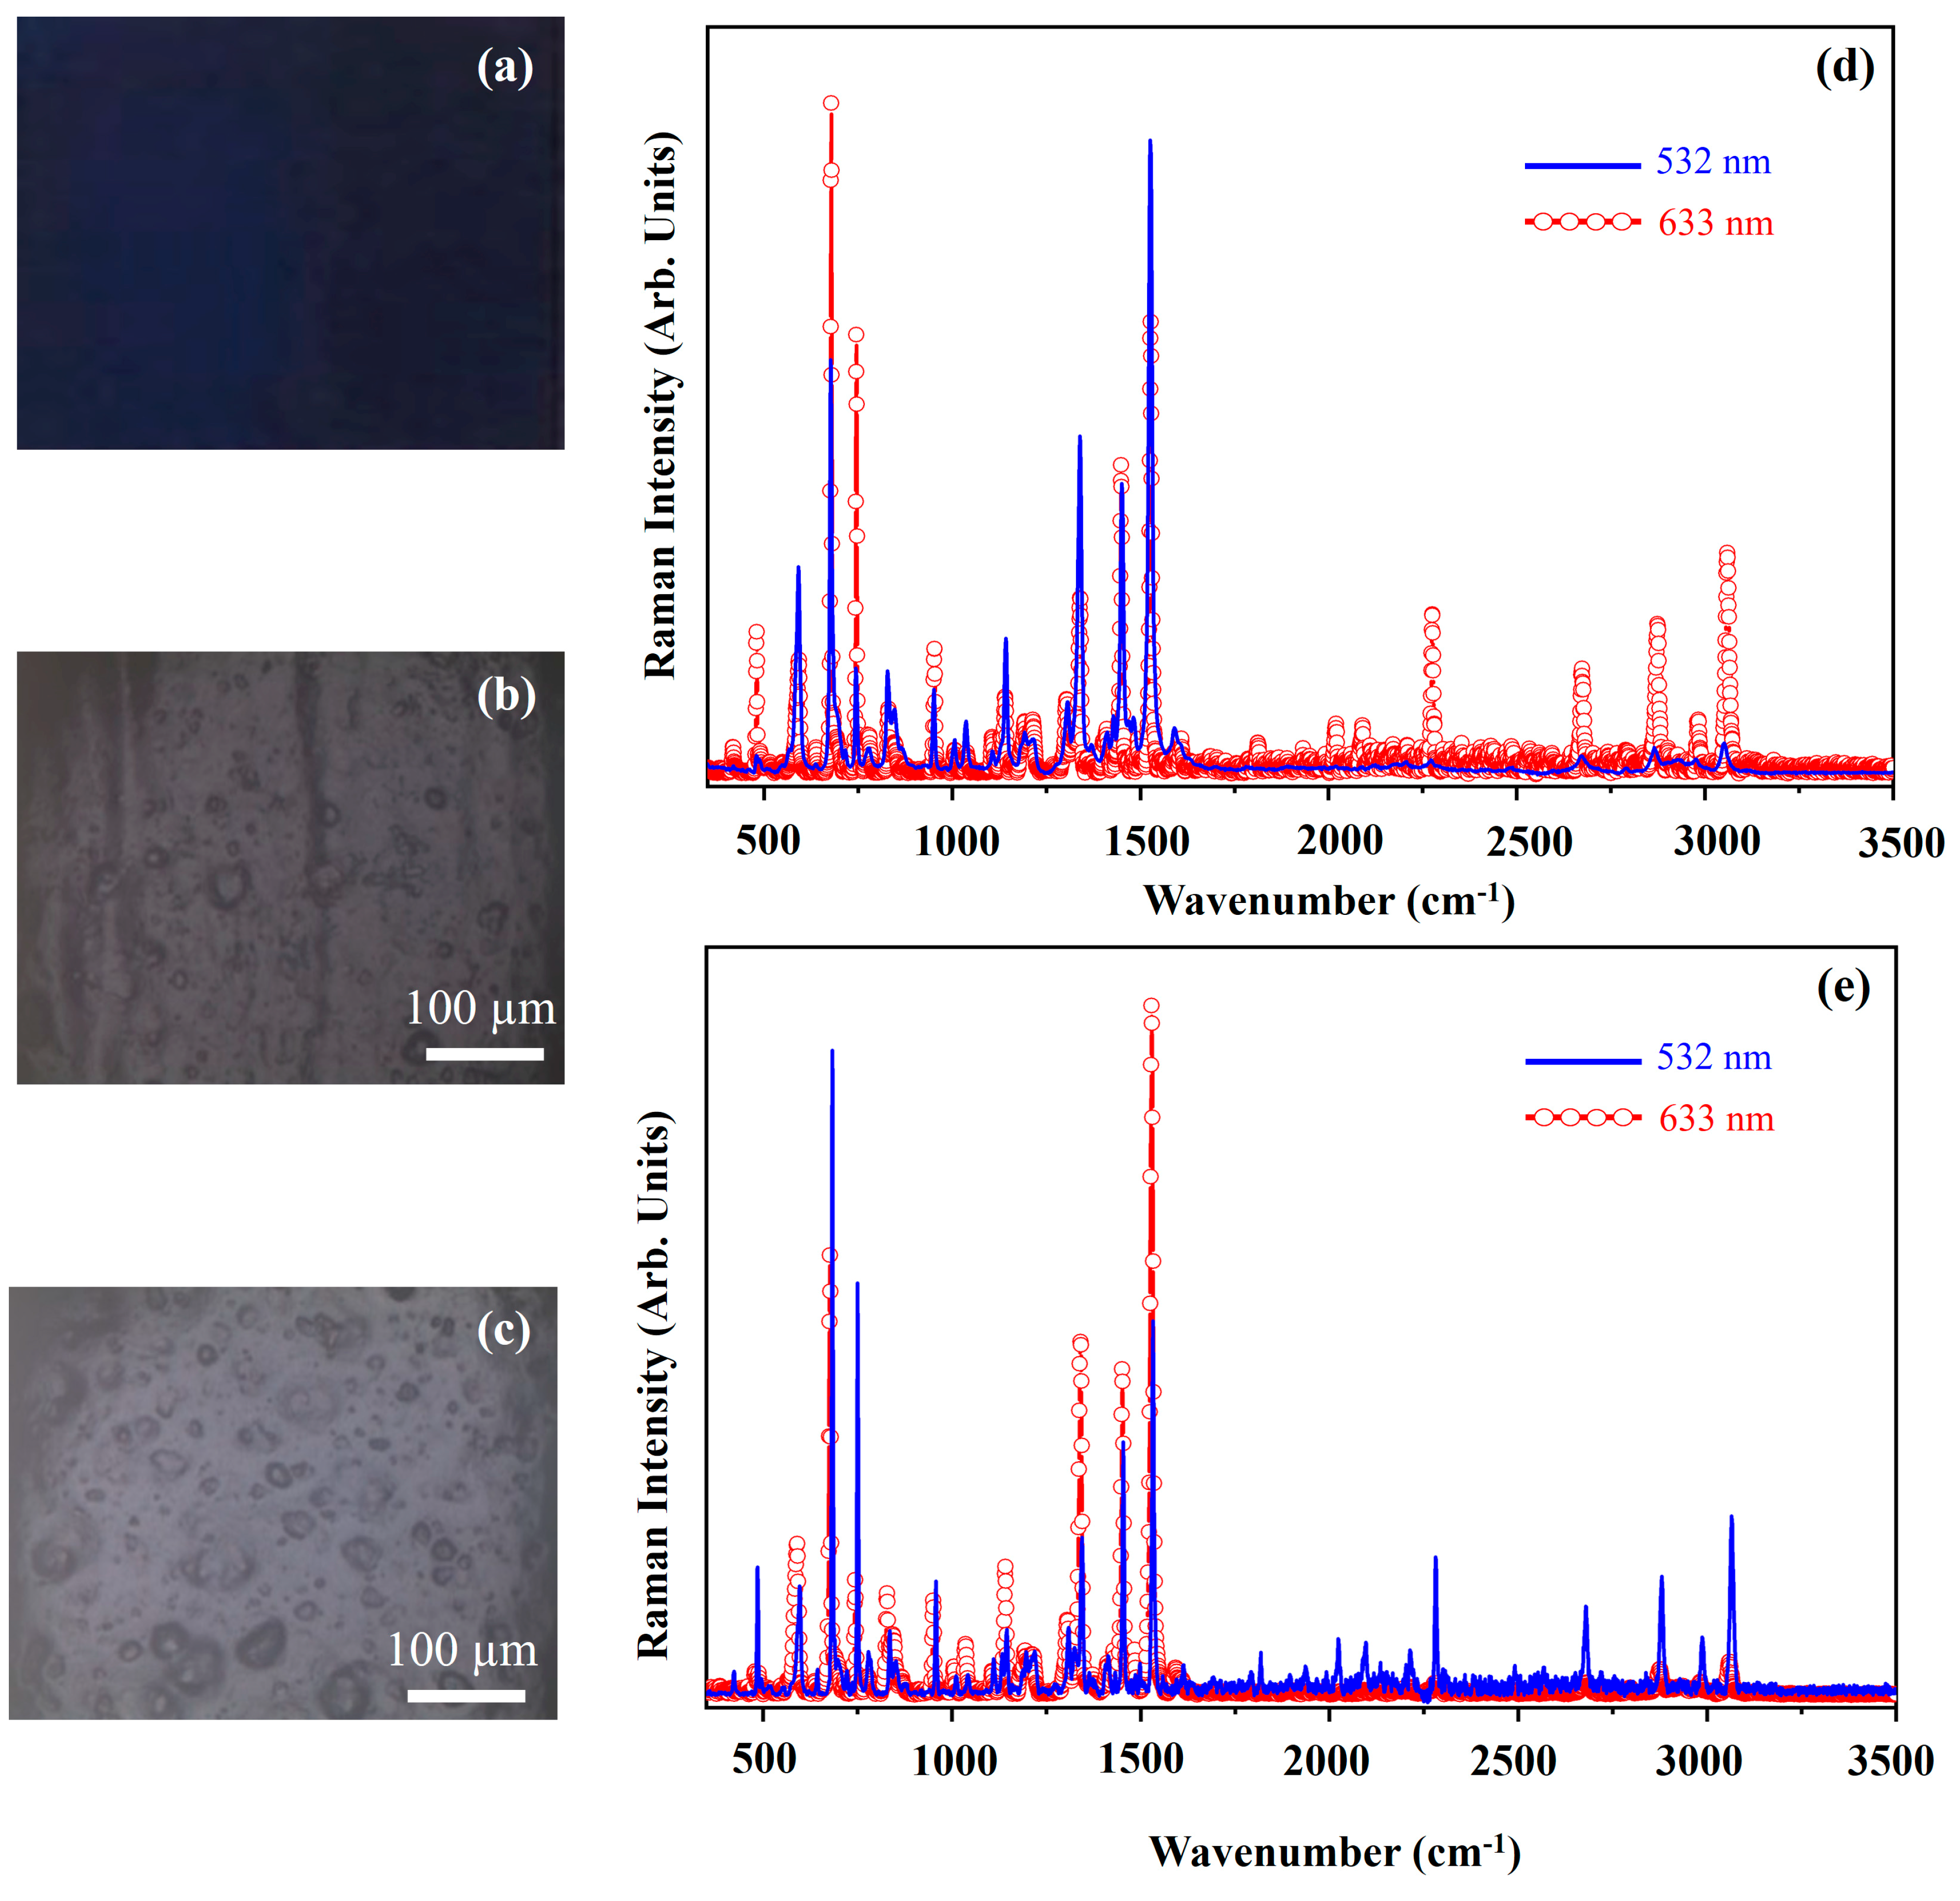
3. Results and Discussion
4. Conclusions
Author Contributions
Funding
Institutional Review Board Statement
Informed Consent Statement
Data Availability Statement
Acknowledgments
Conflicts of Interest
References
- Jablonski, E.; Learner, T.; Hayes, J.; Golden, M. Conservation Concerns for Acrylic Emulsion Paints. Stud. Conserv. 2003, 48, 3–12. [Google Scholar] [CrossRef]
- De Antonio, E.; Tuchman, M. Painters Painting: A Candid History of the Modern Art Scene, 1940–1970; 1. Aufl.; Abbeville Pr: New York, NY, USA, 1984; ISBN 978-0-89659-418-0. [Google Scholar]
- Pugliese, M. Tecnica Mista: Materiali e Procedimenti Nell’arte del XX Secolo; Pearson Italia S.p.a.: Milan, Italy, 2006; ISBN 978-88-424-9239-9. [Google Scholar]
- Chiantore, O.; Scalarone, D.; Learner, T. Characterization of Artists’ Acrylic Emulsion Paints. Int. J. Polym. Anal. Charact. 2003, 8, 67–82. [Google Scholar] [CrossRef]
- Politano, G.G.; Cazzanelli, E.; Versace, C.; Castriota, M.; Desiderio, G.; Davoli, M.; Vena, C.; Bartolino, R. Micro-Raman Investigation of Ag/Graphene Oxide/Au Sandwich Structure. Mater. Res. Express 2019, 6, 075605. [Google Scholar] [CrossRef]
- Rizzuto, C.; Teeters, D.C.; Barberi, R.C.; Castriota, M. Plasticizers and Salt Concentrations Effects on Polymer Gel Electrolytes Based on Poly (Methyl Methacrylate) for Electrochemical Applications. Gels 2022, 8, 363. [Google Scholar] [CrossRef]
- Álvarez-García, J.; Izquierdo-Roca, V.; Pistor, P.; Schmid, T.; Pérez-Rodríguez, A. Raman Spectroscopy on Thin Films for Solar Cells. In Advanced Characterization Techniques for Thin Film Solar Cells; Abou-Ras, D., Kirchartz, T., Rau, U., Eds.; Wiley: Hoboken, NJ, USA, 2016; pp. 469–499. ISBN 978-3-527-33992-1. [Google Scholar]
- Politano, G.G.; Castriota, M.; De Santo, M.P.; Pipita, M.M.; Desiderio, G.; Vena, C.; Versace, C. Variable Angle Spectroscopic Ellipsometry Characterization of Spin-Coated MoS2 Films. Vacuum 2021, 189, 110232. [Google Scholar] [CrossRef]
- Pezzotti, G. Raman Spectroscopy in Cell Biology and Microbiology. J. Raman Spectrosc. 2021, 52, 2348–2443. [Google Scholar] [CrossRef]
- Khonina, S.N.; Kazanskiy, N.L. Trends and Advances in Wearable Plasmonic Sensors Utilizing Surface-Enhanced Raman Spectroscopy (SERS): A Comprehensive Review. Sensors 2025, 25, 1367. [Google Scholar] [CrossRef]
- Lauridsen, C.B.; Sanyova, J.; Simonsen, K.P. Raman Analysis of Complex Pigment Mixtures in 20th Century Metal Knight Shields of the Order of the Elephant. Spectrochim. Acta Part A Mol. Biomol. Spectrosc. 2015, 150, 54–62. [Google Scholar] [CrossRef]
- Cazzanelli, E.; Platania, E.; De Santo, G.; Fasanella, A.; Castriota, M. Micro-Spectroscopic Raman Investigation on the Canvas Oil Painting “Rebecca at the Well” of Neapolitan Anonymous. J. Raman Spectrosc. 2012, 43, 1694–1698. [Google Scholar] [CrossRef]
- Ropret, P.; Centeno, S.A.; Bukovec, P. Raman Identification of Yellow Synthetic Organic Pigments in Modern and Contemporary Paintings: Reference Spectra and Case Studies. Spectrochim. Acta Part A Mol. Biomol. Spectrosc. 2008, 69, 486–497. [Google Scholar] [CrossRef]
- Pingitore, G.; Cerchiara, T.; Chidichimo, G.; Castriota, M.; Gattuso, C.; Marino, D. Structural Characterization of Corrosion Product Layers on Archaeological Iron Artifacts from Vigna Nuova, Crotone (Italy). J. Cult. Herit. 2015, 16, 372–376. [Google Scholar] [CrossRef]
- Scherrer, N.C.; Stefan, Z.; Francoise, D.; Annette, F.; Renate, K. Synthetic Organic Pigments of the 20th and 21st Century Relevant to Artist’s Paints: Raman Spectra Reference Collection. Spectrochim. Acta Part A Mol. Biomol. Spectrosc. 2009, 73, 505–524. [Google Scholar] [CrossRef]
- Correia, A.M.; Clark, R.J.H.; Ribeiro, M.I.M.; Duarte, M.L.T.S. Pigment Study by Raman Microscopy of 23 Paintings by the Portuguese Artist Henrique Pousão (1859–1884). J. Raman Spectrosc. 2007, 38, 1390–1405. [Google Scholar] [CrossRef]
- Yogurtcu, B.; Cebi, N.; Koçer, A.T.; Erarslan, A. A Review of Non-Destructive Raman Spectroscopy and Chemometric Techniques in the Analysis of Cultural Heritage. Molecules 2024, 29, 5324. [Google Scholar] [CrossRef]
- Saggio, F.; Rizzuto, C.; Teeters, D.; Didik, J.; Barberi, R.C.; Castriota, M. Raman Investigations on the Frame of the Painting “White Man’s Buffalo” by the Artist Charles, M. Russell. Appl. Sci. 2023, 13, 3654. [Google Scholar] [CrossRef]
- Caggiani, M.C.; Colomban, P. Raman Microspectroscopy for Cultural Heritage Studies. Phys. Sci. Rev. 2018, 3, 20180007. [Google Scholar] [CrossRef]
- Caggiani, M.C.; Cosentino, A.; Mangone, A. Pigments Checker Version 3.0, a Handy Set for Conservation Scientists: A Free Online Raman Spectra Database. Microchem. J. 2016, 129, 123–132. [Google Scholar] [CrossRef]
- Schulte, F.; Brzezinka, K.; Lutzenberger, K.; Stege, H.; Panne, U. Raman Spectroscopy of Synthetic Organic Pigments Used in 20th Century Works of Art. J. Raman Spectrosc. 2008, 39, 1455–1463. [Google Scholar] [CrossRef]
- Vandenabeele, P.; Moens, L.; Edwards, H.G.M.; Dams, R. Raman Spectroscopic Database of Azo Pigments and Application to Modern Art Studies. J. Raman Spectrosc. 2000, 31, 509–517. [Google Scholar] [CrossRef]
- Barba Castagnaro, I.; Nucera, A.; Barberi, R.C.; Castriota, M. Study and Micro-Raman Characterization of Pigments Present on Majolicas of Historical and Artistic Interest from Gerace, Italy. Herit. Sci. 2023, 11, 24. [Google Scholar] [CrossRef]
- Ropret, P.; Madariaga, J.M. Applications of Raman Spectroscopy in Art and Archaeology. J. Raman Spectrosc. 2014, 45, 985–992. [Google Scholar] [CrossRef]
- Striova, J.; Dal Fovo, A.; Fontani, V.; Barucci, M.; Pampaloni, E.; Raffaelli, M.; Fontana, R. Modern Acrylic Paints Probed by Optical Coherence Tomography and Infrared Reflectography. Microchem. J. 2018, 138, 65–71. [Google Scholar] [CrossRef]
- Tackley, D.R.; Dent, G.; Smith, W.E. Phthalocyanines: Structure and Vibrations. Phys. Chem. Chem. Phys. 2001, 3, 1419–1426. [Google Scholar] [CrossRef]
- Bovill, A.J.; McConnell, A.A.; Nimmo, J.A.; Smith, W.E. Resonance Raman Spectra of .Alpha.-Copper Phthalocyanine. J. Phys. Chem. 1986, 90, 569–575. [Google Scholar] [CrossRef]
- Anghelone, M.; Jembrih-Simbürger, D.; Schreiner, M. Identification of Copper Phthalocyanine Blue Polymorphs in Unaged and Aged Paint Systems by Means of Micro-Raman Spectroscopy and Random Forest. Spectrochim. Acta Part A Mol. Biomol. Spectrosc. 2015, 149, 419–425. [Google Scholar] [CrossRef]
- Anghelone, M.; Jembrih-Simbürger, D.; Pintus, V.; Schreiner, M. Photostability and Influence of Phthalocyanine Pigments on the Photodegradation of Acrylic Paints under Accelerated Solar Radiation. Polym. Degrad. Stab. 2017, 146, 13–23. [Google Scholar] [CrossRef]
- Jennings, C.; Aroca, R.; Hor, A.; Loutfy, R.O. Raman Spectra of Solid Films 3—Mg, Cu and Zn Phthalocyanine Complexes. J. Raman Spectrosc. 1984, 15, 34–37. [Google Scholar] [CrossRef]
- Basova, T.V.; Kiselev, V.G.; Schuster, B.; Peisert, H.; Chassé, T. Experimental and Theoretical Investigation of Vibrational Spectra of Copper Phthalocyanine: Polarized Single-crystal Raman Spectra, Isotope Effect and DFT Calculations. J. Raman Spectrosc. 2009, 40, 2080–2087. [Google Scholar] [CrossRef]
- Chang, J.; Cañamares, M.V.; Aydin, M.; Vetter, W.; Schreiner, M.; Xu, W.; Lombardi, J.R. Surface-Enhanced Raman Spectroscopy of Indanthrone and Flavanthrone. J. Raman Spectrosc. 2009, 40, 1557–1563. [Google Scholar] [CrossRef]
- Sukhikh, A.; Bonegardt, D.; Klyamer, D.; Krasnov, P.; Basova, T. Chlorosubstituted Copper Phthalocyanines: Spectral Study and Structure of Thin Films. Molecules 2020, 25, 1620. [Google Scholar] [CrossRef]
- Del Puerto, E.; Domingo, C.; Garcia Ramos, J.V.; Sanchez-Cortes, S. Adsorption Study and Detection of the High Performance Organic Pigments Quinacridone and 2,9-Dimethylquinacridone on Ag Nanoparticles By Surface-Enhanced Optical Spectroscopy. Langmuir 2014, 30, 753–761. [Google Scholar] [CrossRef]
- Rodrígueza, R.; Jiménez, S.; Vargas, S.; Pacheco, S.; Castaño, V.M. Micro-Raman Characterization of Anisotropic Dimethyl Terephthalate Crystallites. Int. J. Polym. Mater. 2001, 49, 1–13. [Google Scholar] [CrossRef]
- Benali, B.; El Assyry, A.; Boucetta, A.; Lazar, Z.; Lakhrissi, B. Thermal, Structural, and Conformational Study of the Benzimidazolone Molecule. Res. Chem. Intermed. 2015, 41, 821–830. [Google Scholar] [CrossRef]
- Bouchard, M.; Gambardella, A. Raman Microscopy Study of Synthetic Cobalt Blue Spinels Used in the Field of Art. J. Raman Spectrosc. 2010, 41, 1477–1485. [Google Scholar] [CrossRef]
- Bell, I.M.; Clark, R.J.H.; Gibbs, P.J. Raman Spectroscopic Library of Natural and Synthetic Pigments (Pre- ≈ 1850 AD). Spectrochim. Acta Part A Mol. Biomol. Spectrosc. 1997, 53, 2159–2179. [Google Scholar] [CrossRef]
- Burgio, L.; Clark, R.J.H. Library of FT-Raman Spectra of Pigments, Minerals, Pigment Media and Varnishes, and Supplement to Existing Library of Raman Spectra of Pigments with Visible Excitation. Spectrochim. Acta Part A Mol. Biomol. Spectrosc. 2001, 57, 1491–1521. [Google Scholar] [CrossRef]
- Artesani, A.; Ghirardello, M.; Mosca, S.; Nevin, A.; Valentini, G.; Comelli, D. Combined Photoluminescence and Raman Microscopy for the Identification of Modern Pigments: Explanatory Examples on Cross-Sections from Russian Avant-Garde Paintings. Herit. Sci. 2019, 7, 17. [Google Scholar] [CrossRef]
- Yakes, B.J.; Michael, T.J.; Perez-Gonzalez, M.; Harp, B.P. Investigation of Tattoo Pigments by Raman Spectroscopy. J. Raman Spectrosc. 2017, 48, 736–743. [Google Scholar] [CrossRef]
- Schenk, F.; Parker, A. Iridescent Color: From Nature to the Painter’s Palette. Leonardo 2011, 44, 108–115. [Google Scholar] [CrossRef]
- Database of Raman Spectroscopy, X-Ray Diffraction and Chemistry of Minerals. Available online: https://rruff.info/ (accessed on 5 February 2024).
- Aguayo, T.; Clavijo, E.; Villagrán, A.; Espinosa, F.; Sagüés, F.E.; Campos-Vallette, M. Raman vibrational study of pigments with patrimonial interest for the chilean cultural heritage. J. Chil. Chem. Soc. 2010, 55, 347–351. [Google Scholar] [CrossRef]
- Coccato, A.; Jehlicka, J.; Moens, L.; Vandenabeele, P. Raman Spectroscopy for the Investigation of Carbon-based Black Pigments. J. Raman Spectrosc. 2015, 46, 1003–1015. [Google Scholar] [CrossRef]


| Nature | Commercial Name | Pigment | Colour Index (CI) | Composition |
|---|---|---|---|---|
| Organic | Phthalo Blue (PB) | PB15:1 | 74,160:1 | Phthalocyanine α (C32H16CuN8) |
| Primary—Cyan Blue (PBC) | PB15:3 | 74,160:3 | Phthalocyanine β (C32H16CuN8) | |
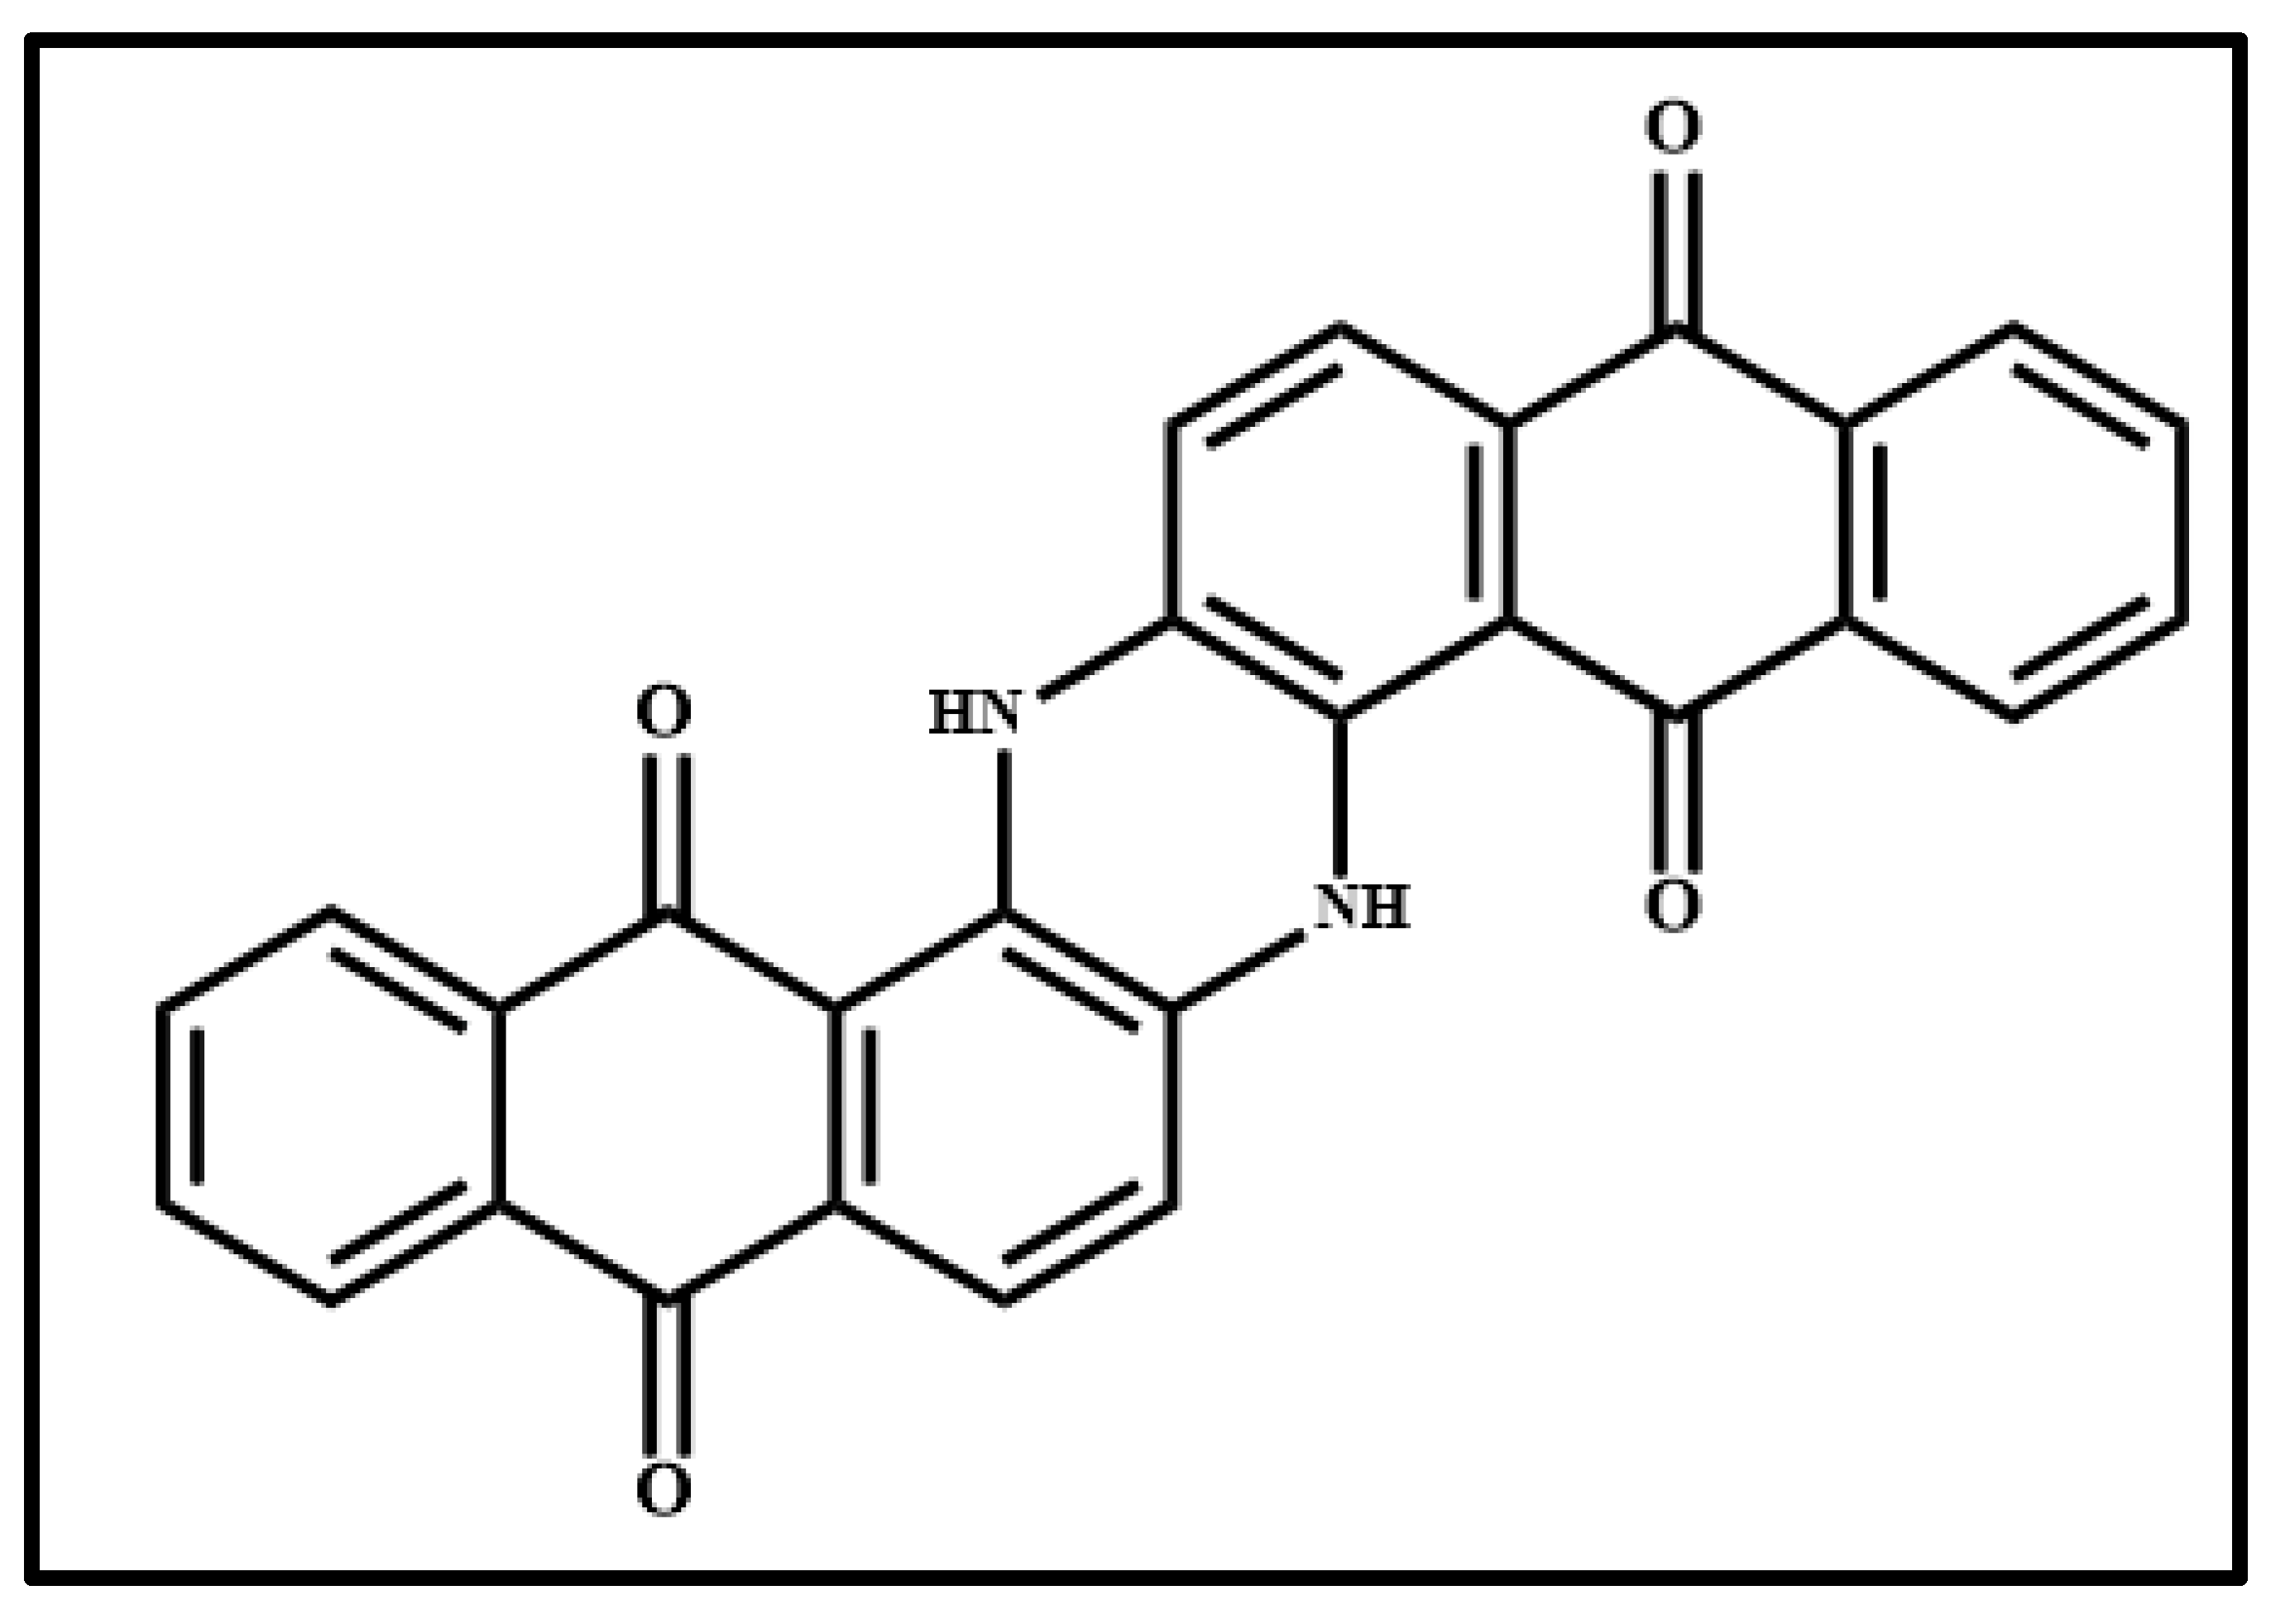
| Indanthrone Blue (IB) | PB60 | 69,800 | 6,15-Dihydro-5,9,14,18-anthrazinetetrone (C28H14N2O4) | |
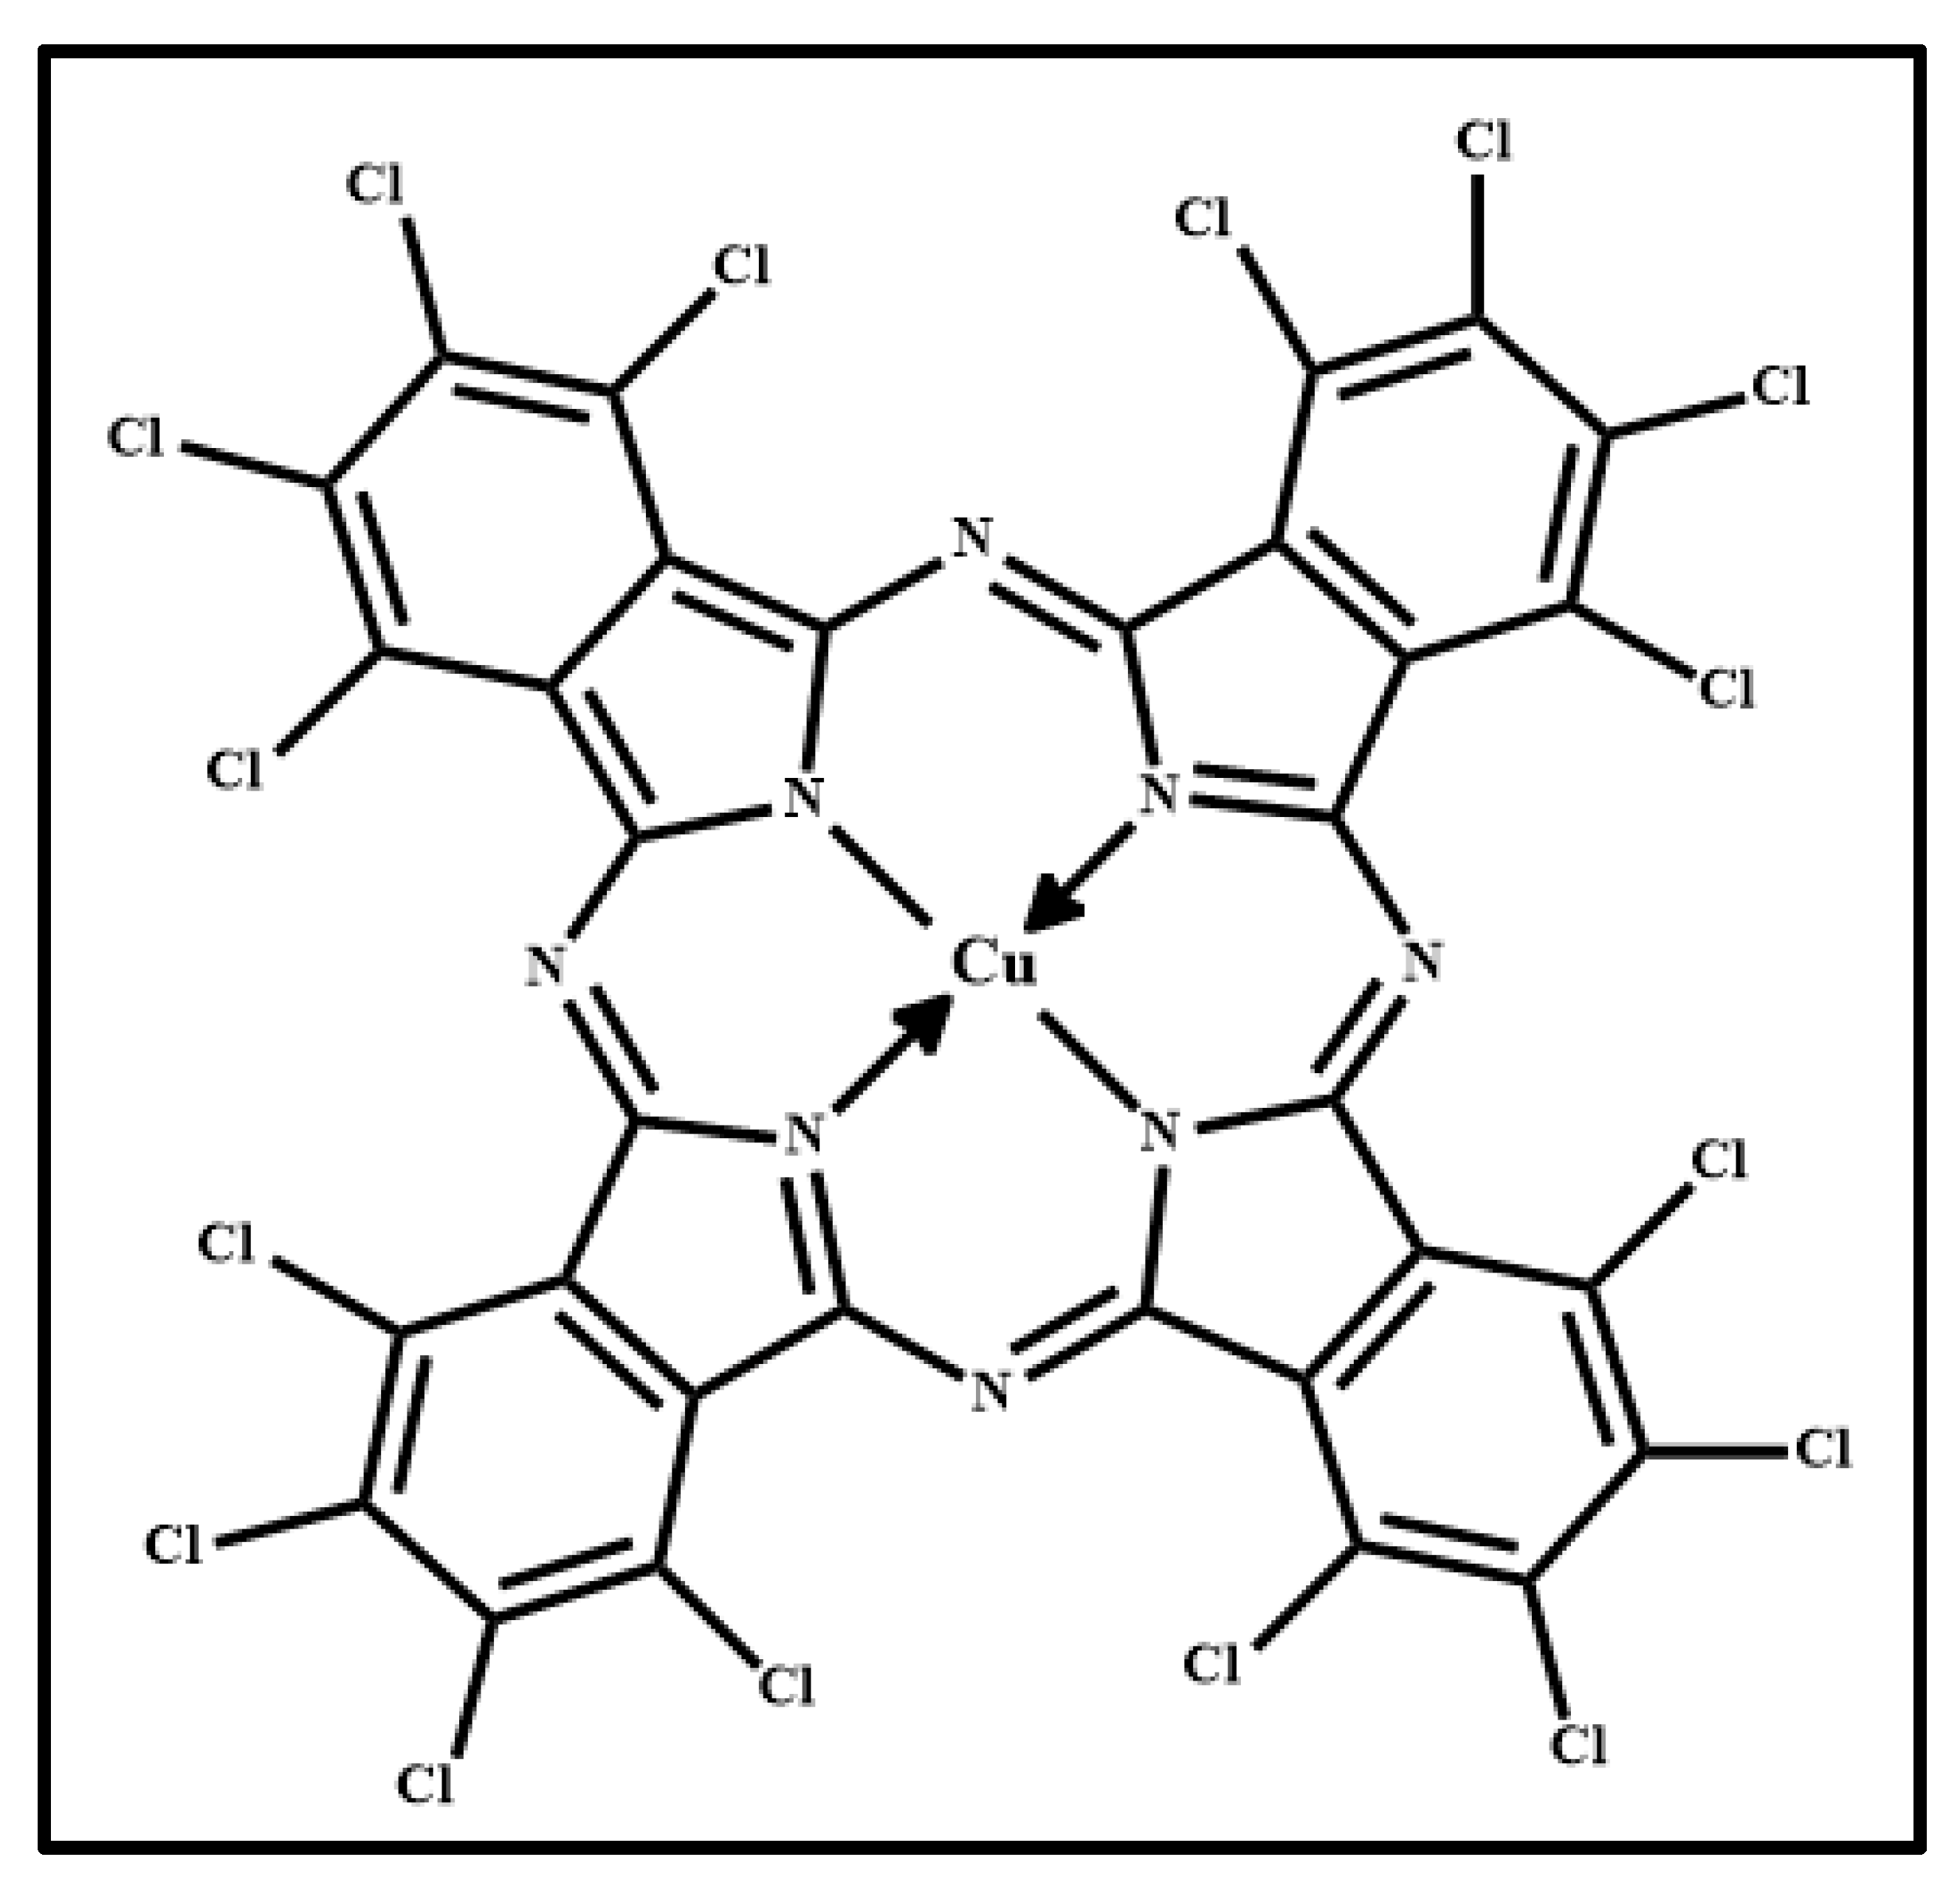
| Phthalo Green (PG) | PG7 | 74,260 | Chlorinated phthalocyanine (C32Cl16CuN8) | |
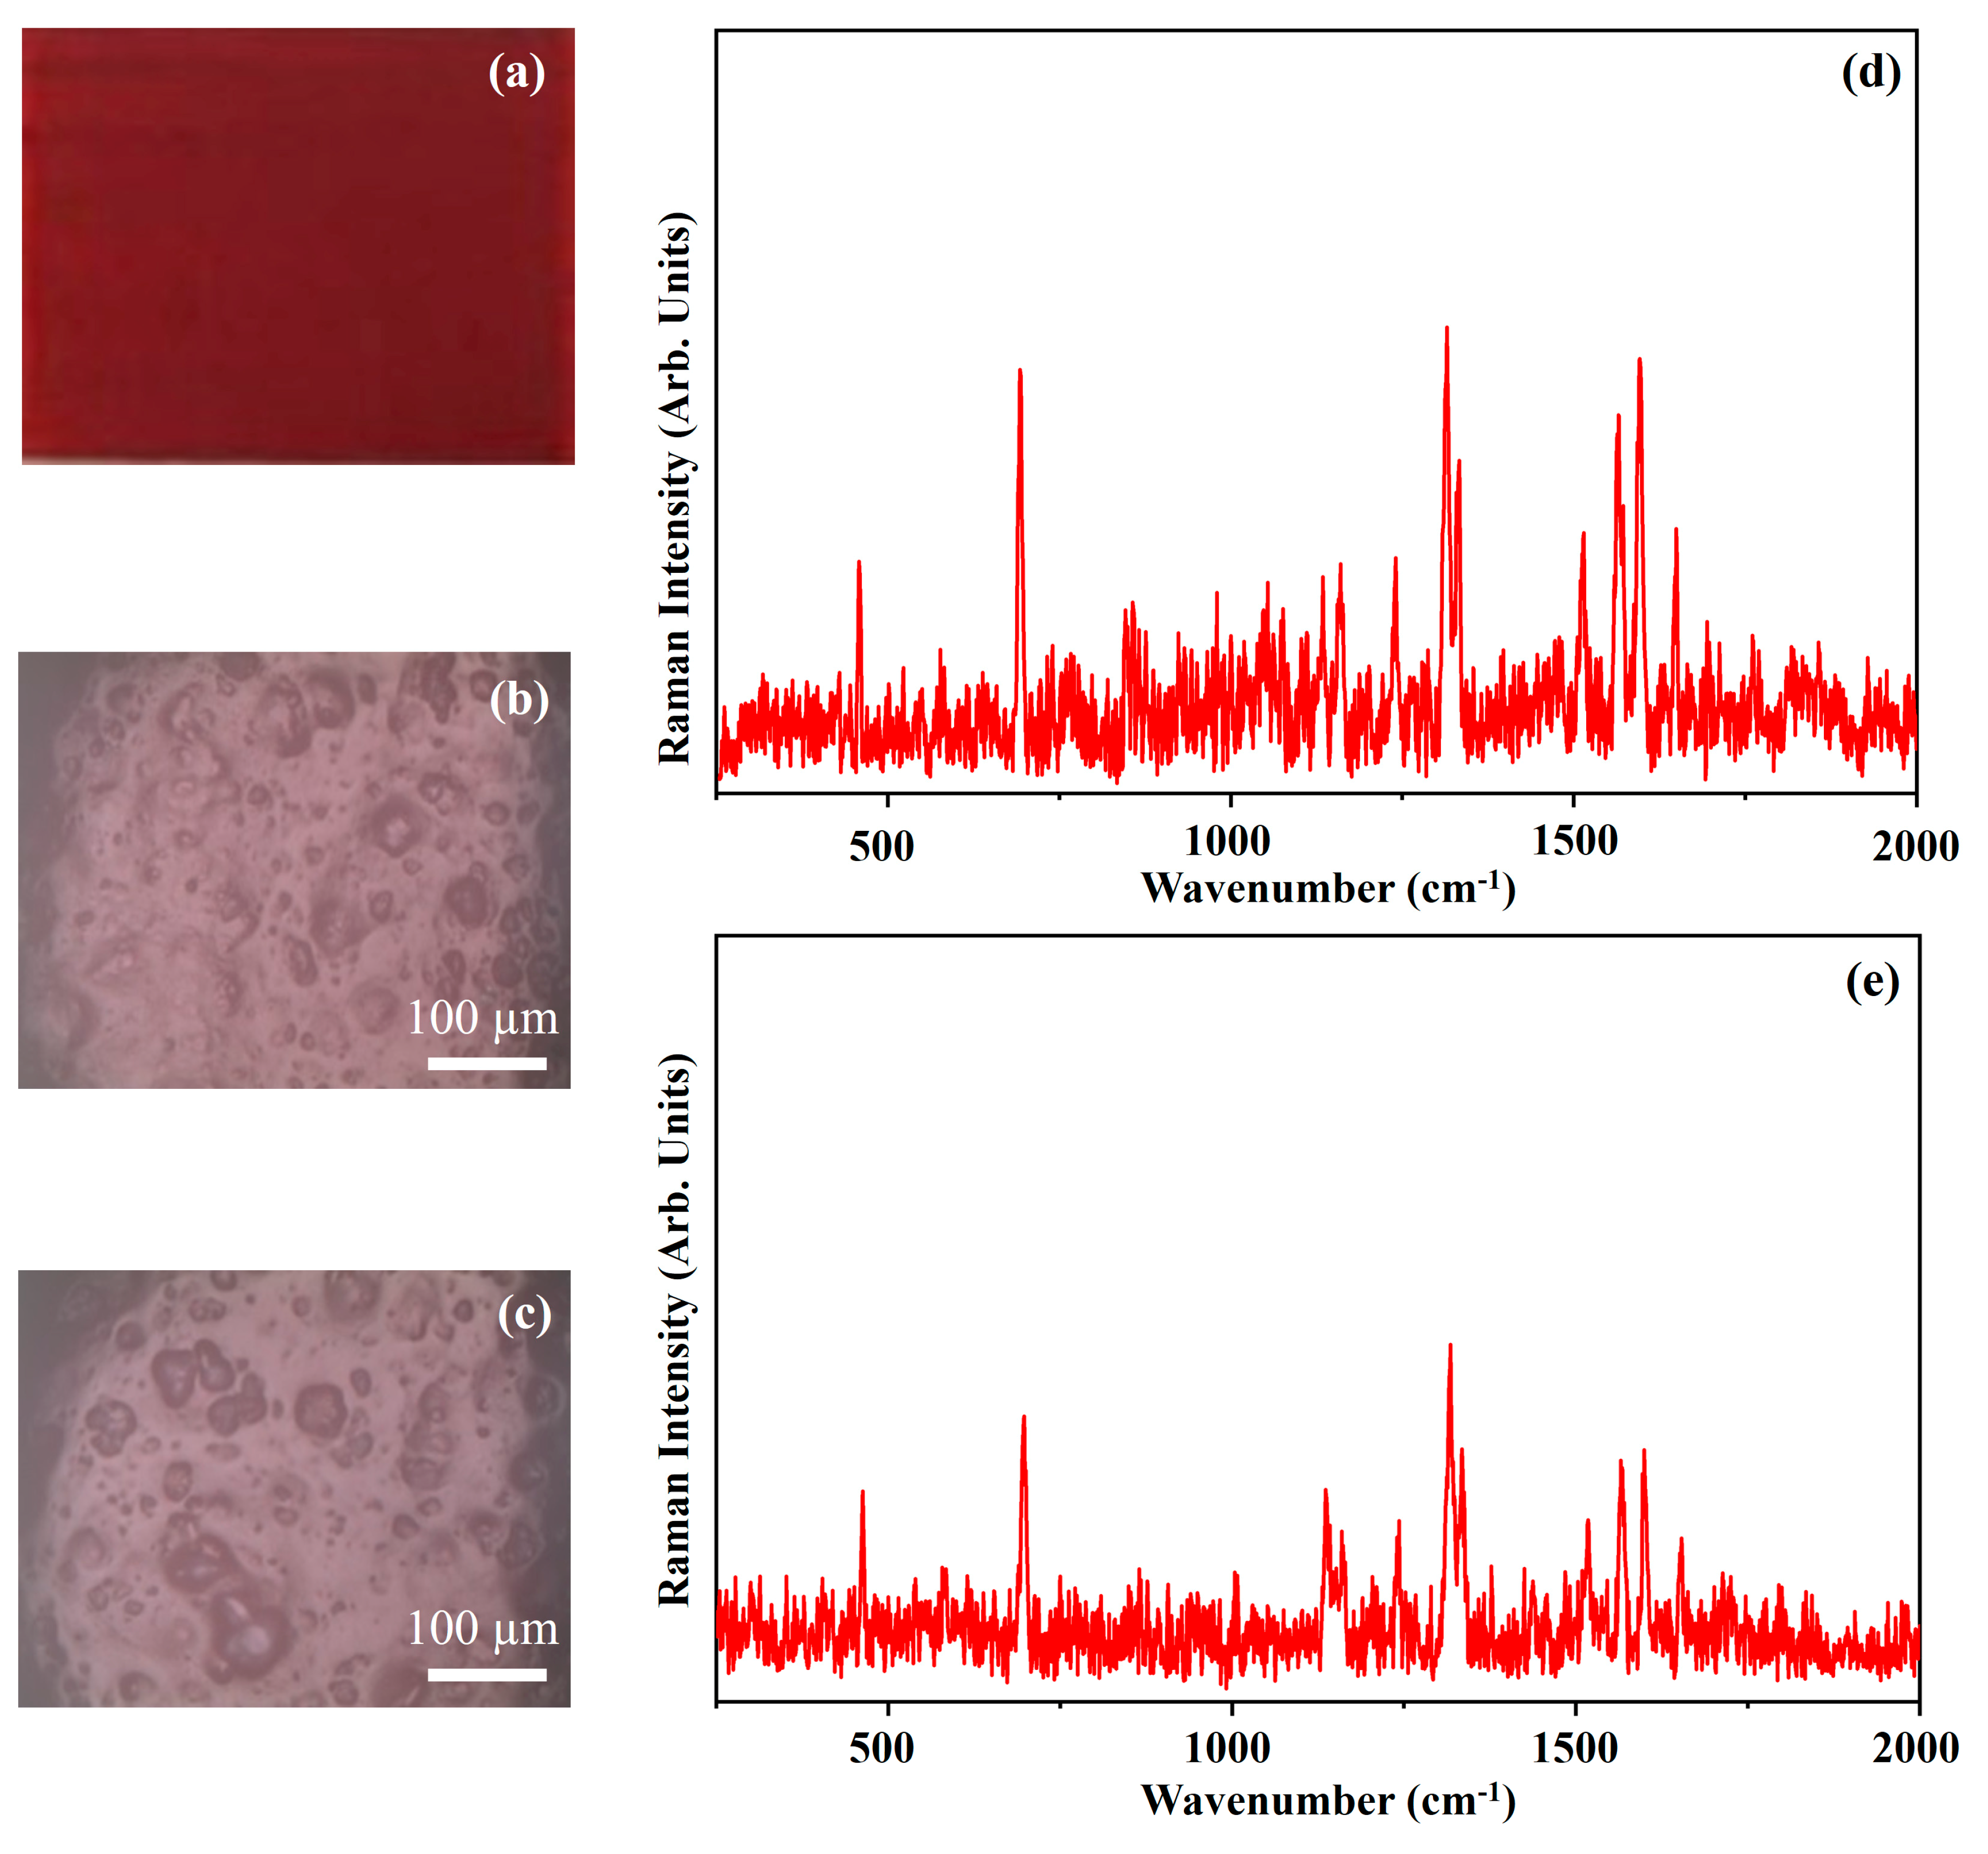
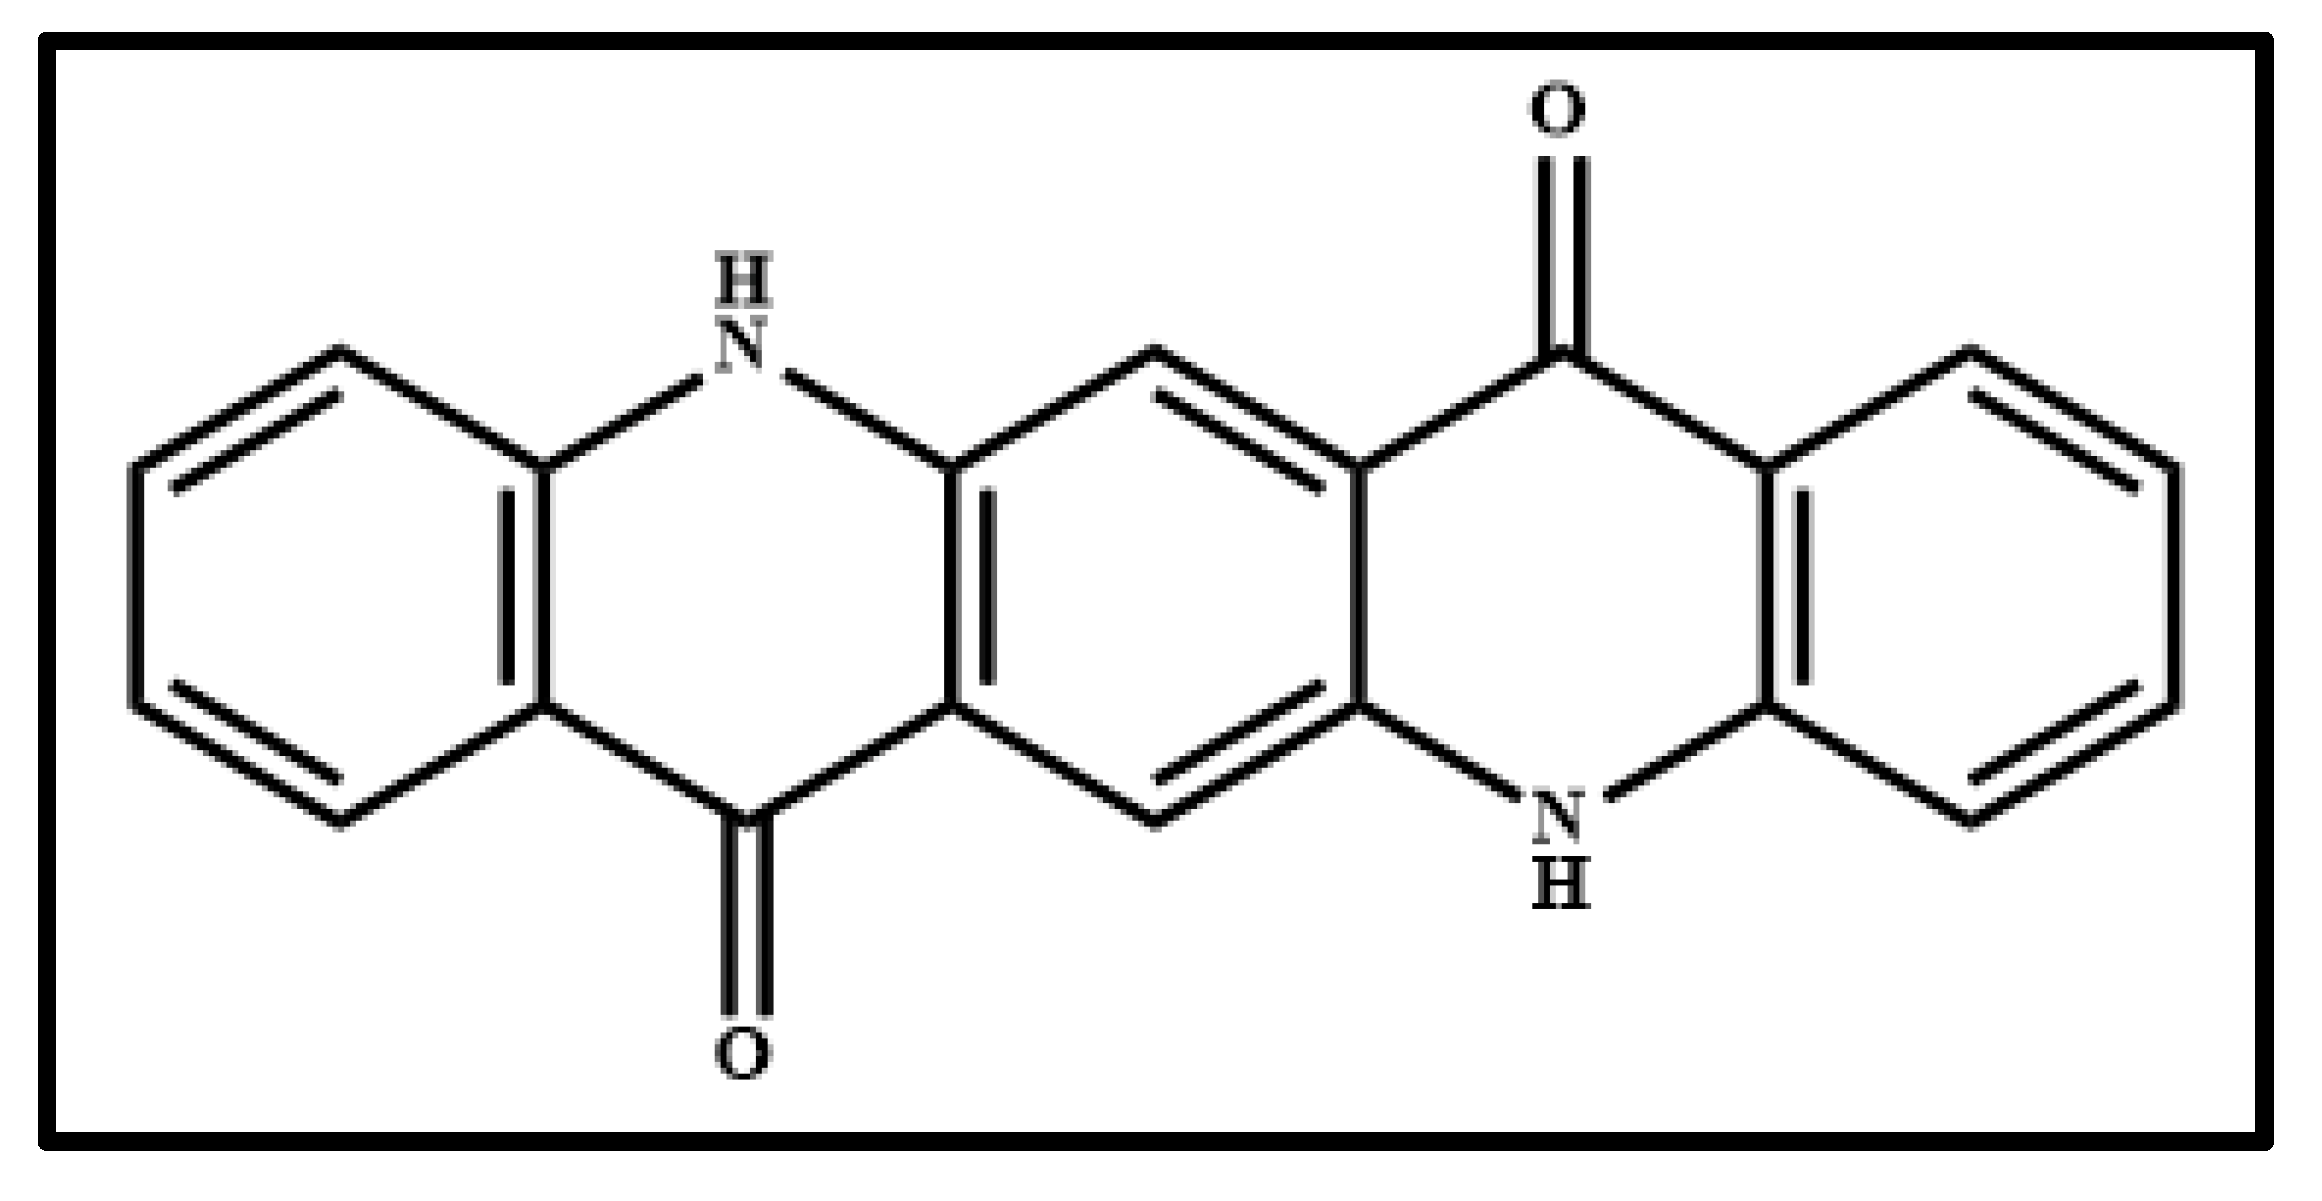
| Primary Red—Magenta (PRM) | PV19 | 73,900 | Quinacridone (C20H12N2O2) | |
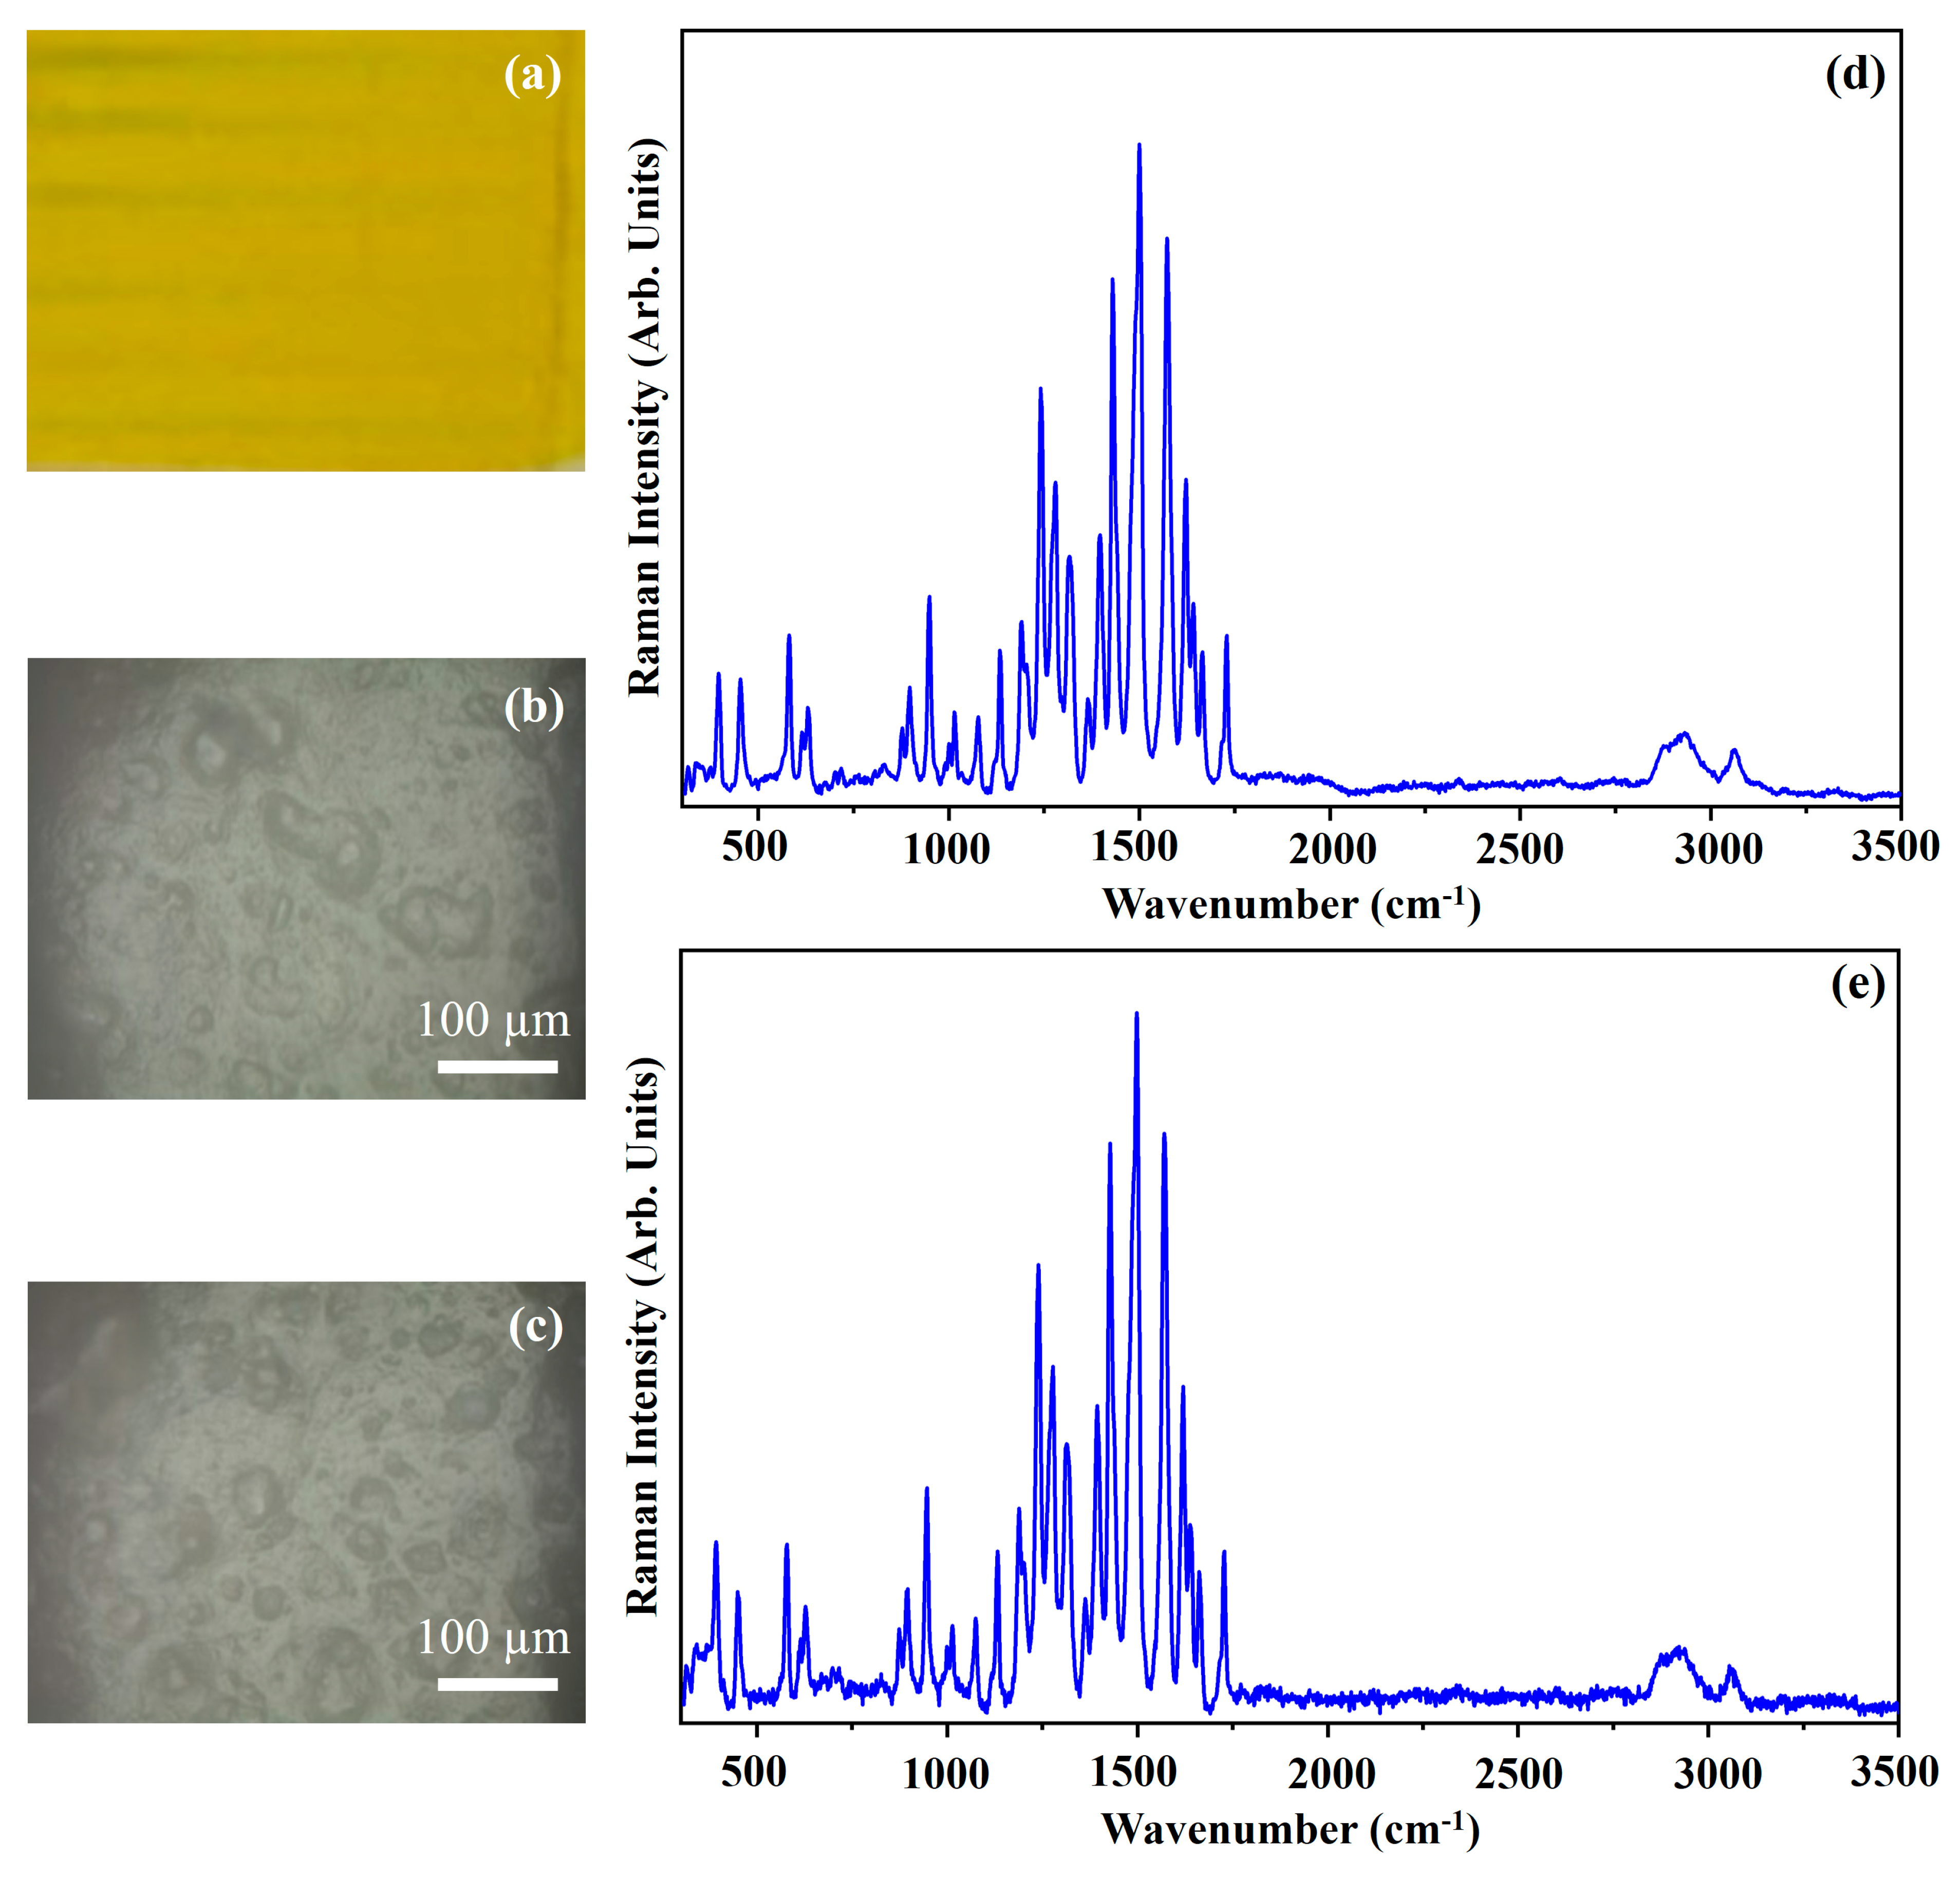
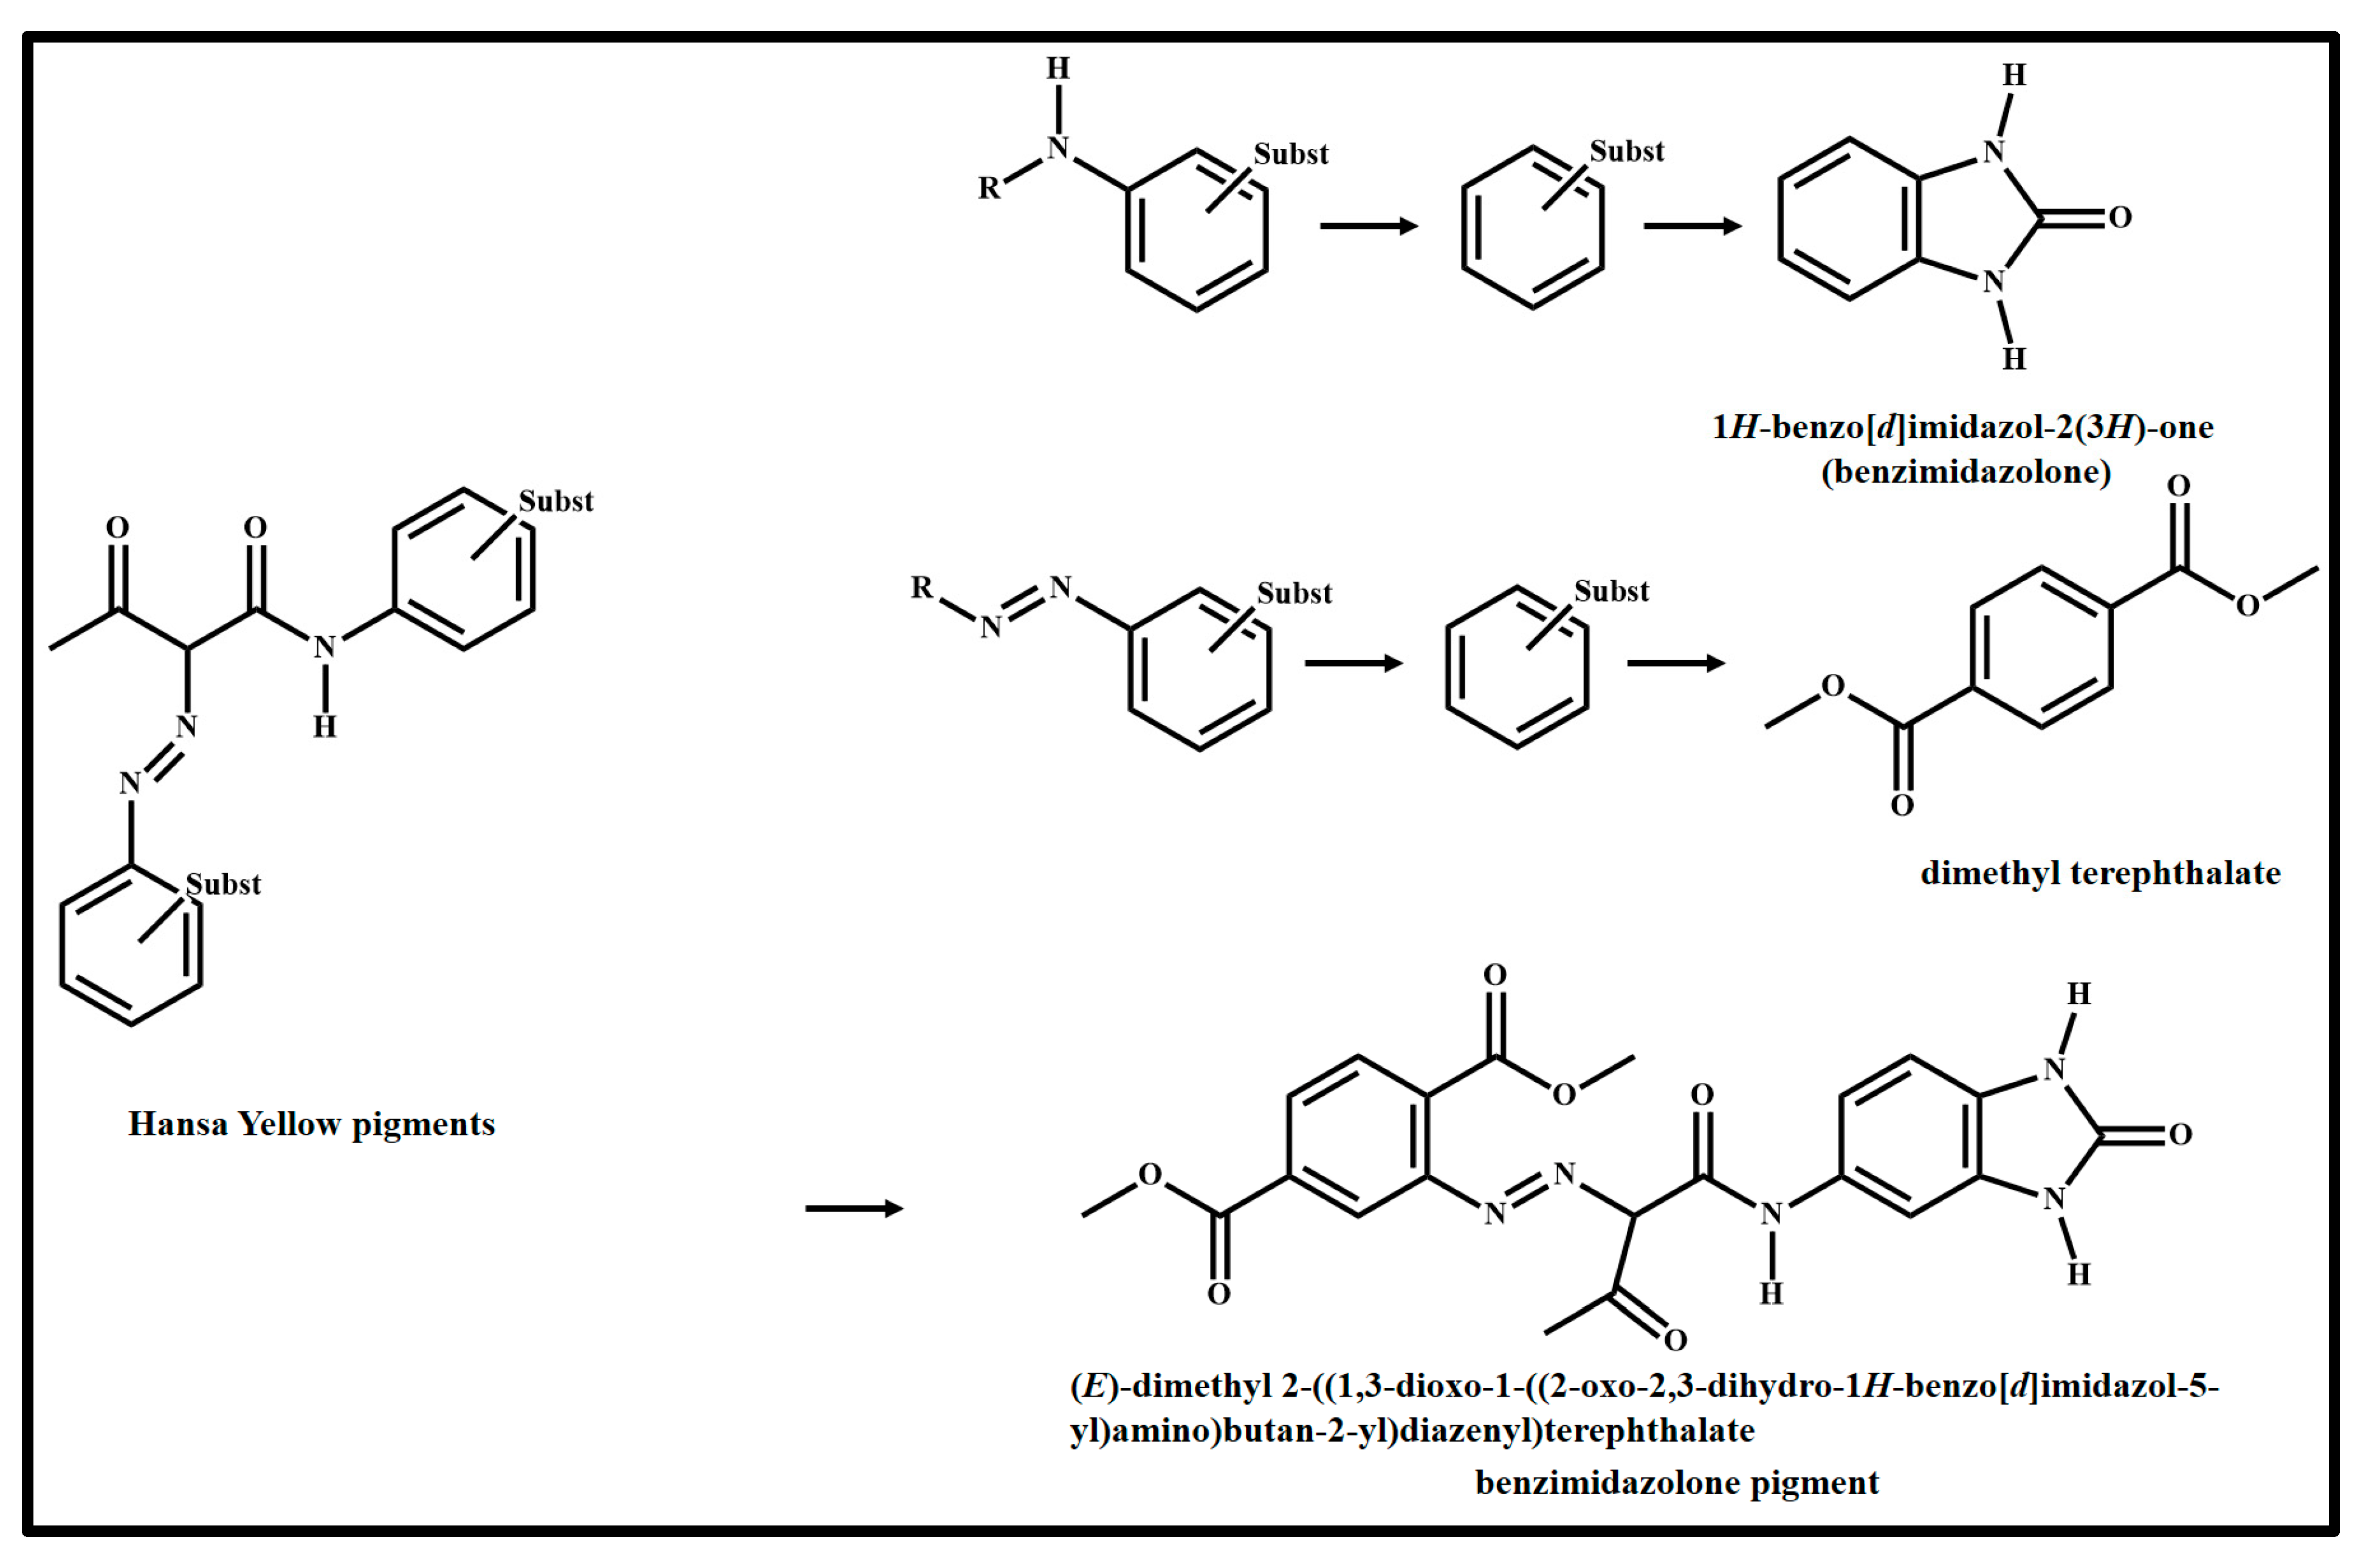
| Lemon Yellow (LY) | PY175 | 11,784 | Benzimidazolone (C21H18N5O7) | |
| Inorganic | Cobalt Blue (CB) | PB28 | 77,346 | Cobalt aluminium oxides (CoAl2O4) |
| Ultramarine (UL) | PB29 | 77,007 | Sodium polysulphide—aluminosilicate (AlNaO6Si2) | |
| Cerulean Blue (CeB) | PB36 | 77,343 | Cobalt aluminium-chromium oxides (Co(Al,Cr)2O4) | |
| Cadmium Red Medium (CRM) | PR108 | 77,202 | Cadmium sulfoselenide (CdSeH2SH2) | |
| Zinc White (ZW) | PW4 | 77,947 | Zinc oxide (ZnO) | |
| Titanium White (TW) | PW6 | 77,891 | Titanium dioxide (TiO2) | |
| Iridescent Silver (IS) | PW20 | 77,019 | Mica + Synthetic Titanium oxide (TiO2) | |
| Cadmium Yellow Medium (CYM) | PY35 | 77,205 | Cadmium zinc sulphide (CdZnS2) | |
| Mixture | Cobalt Blue (Hue) (CB(H)) | PB15:3 | 741,60:3 | Phthalocyanine β (C32H16CuN8) |
| PB29 | 77,007 | Sodium polysulphide–aluminosilicate (AlNaO6Si2) | ||
| PW6 | 77,891 | Titanium dioxide (TiO2) | ||
| Permanent Blue Light (PBL) | PB15:3 | 74,160:3 | Phthalocyanine β (C32H16CuN8) | |
| PG7 | 74,260 | Chlorinated phthalocyanine (C32Cl16CuN8) | ||
| PW6 | 77,891 | Titanium dioxide (TiO2) | ||
| Van Dyke Brown (VB) | PBk7 | 77,266 | Carbon black (C) | |
| PBr7 | 77,492 | Brown iron oxide (Fe2O3) | ||
| PV19 | 73,900 | Quinacridone (C20H12N2O2) | ||
| Permanent Green Light (PGL) | PG7 | 74,260 | Chlorinated phthalocyanine (C32Cl16CuN8) | |
| PW6 | 77,891 | Titanium dioxide (TiO2) | ||
| PY97 | 11,767 | Arylide yellow (C16H11Cl2N4O4) |
| Pigment | N° Figure | Substrate | Laser | Optical Filter | Acquisition Time (s) | Scan |
|---|---|---|---|---|---|---|
| PB | 3 | w | R | D0 | 20 | 10 |
| G | D1 | 10 | 20 | |||
| g | R | D0 | 10 | 10 | ||
| G | D1 | 10 | 10 | |||
| PBC | 5 | w | R | D0 | 20 | 10 |
| G | D0 | 10 | 10 | |||
| g | R | D0 | 15 | 20 | ||
| G | D1 | 10 | 10 | |||
| IB | 6 | w | R | D0 | 20 | 10 |
| g | R | D0 | 20 | 15 | ||
| PG | 8 | w | R | D0 | 20 | 10 |
| G | D0 | 20 | 10 | |||
| g | R | D0 | 10 | 10 | ||
| G | D1 | 10 | 10 | |||
| PRM | 10 | w | R | D0 | 20 | 20 |
| g | R | D0 | 5 | 100 | ||
| LY | 12 | w | G | D06 | 10 | 30 |
| g | G | D1 | 10 | 10 | ||
| CB | 14 | w | G | D03 | 10 | 20 |
| g | G | D03 | 30 | 10 | ||
| UL | 15 | w | G | D0 | 10 | 10 |
| g | G | D1 | 10 | 10 | ||
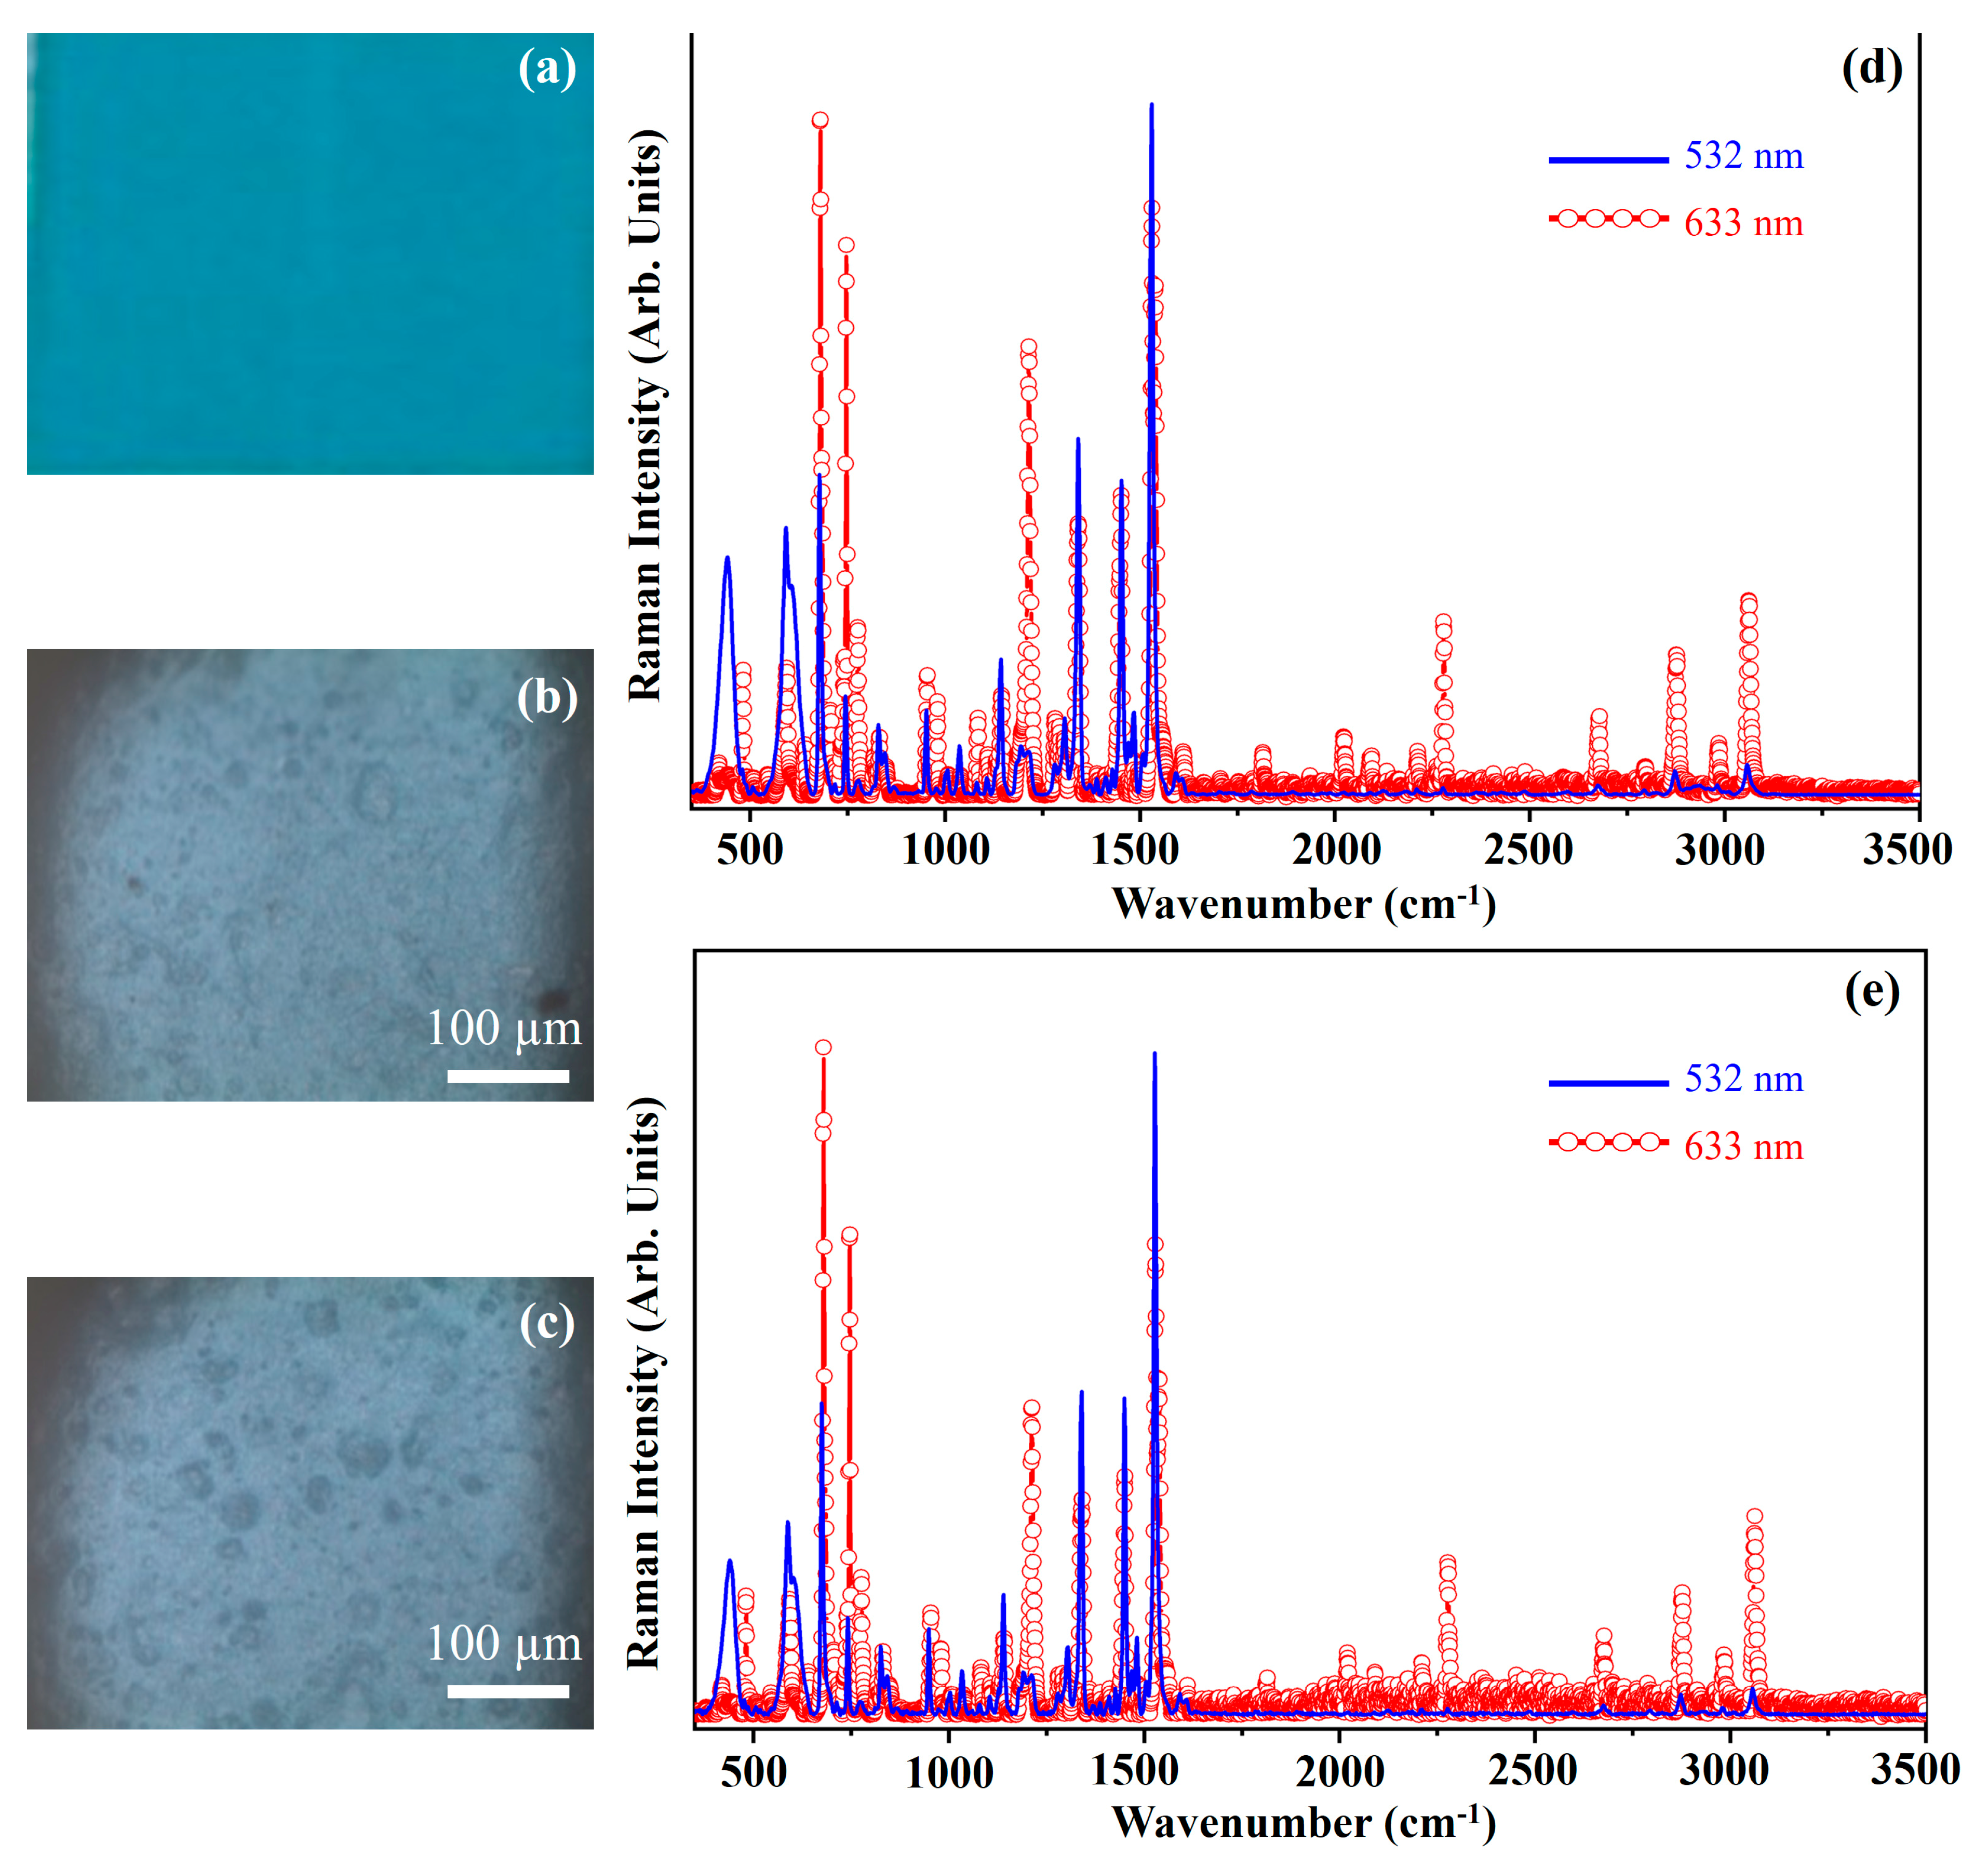
| CeB | 16 | w | G | D0 | 10 | 10 |
| g | G | D0 | 30 | 10 | ||
| CRM | 17 | w | R | D06 | 50 | 20 |
| g | R | D0 | 10 | 10 | ||
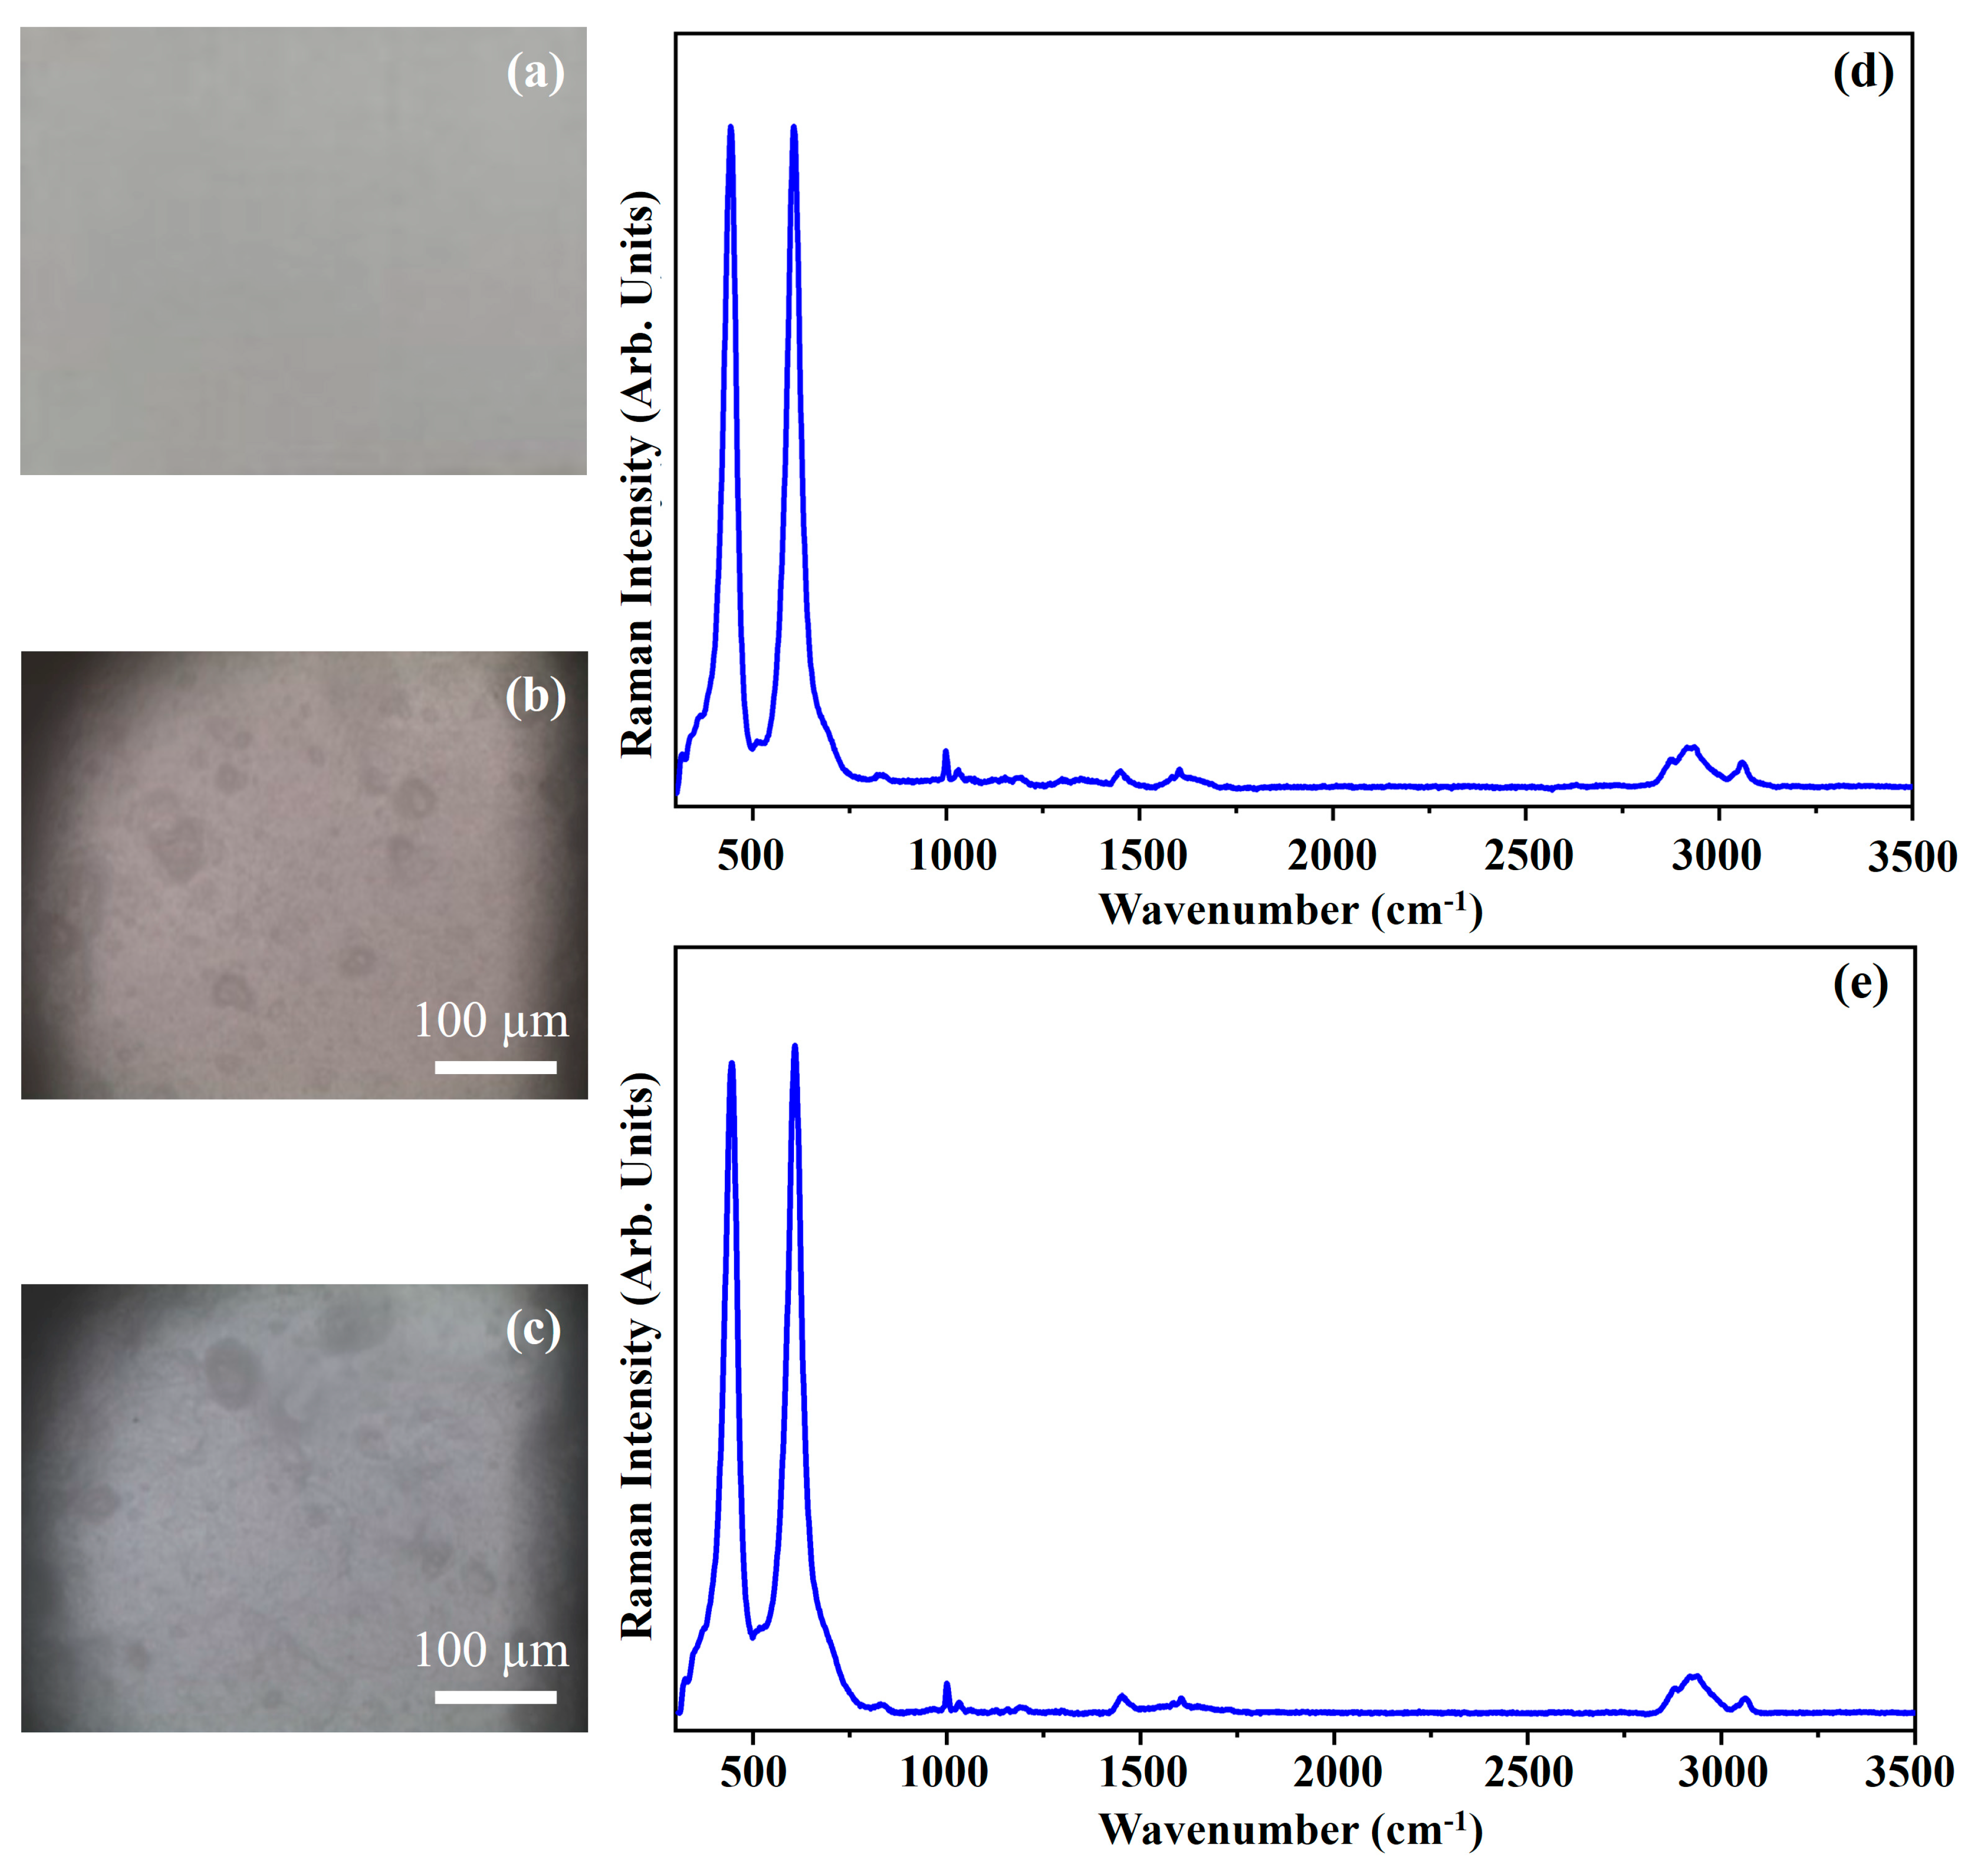
| ZW | 18 | w | R | D0 | 60 | 15 |
| g | R | D0 | 30 | 10 | ||
| TW | 19 | w | G | D06 | 5 | 50 |
| g | G | D03 | 5 | 30 | ||
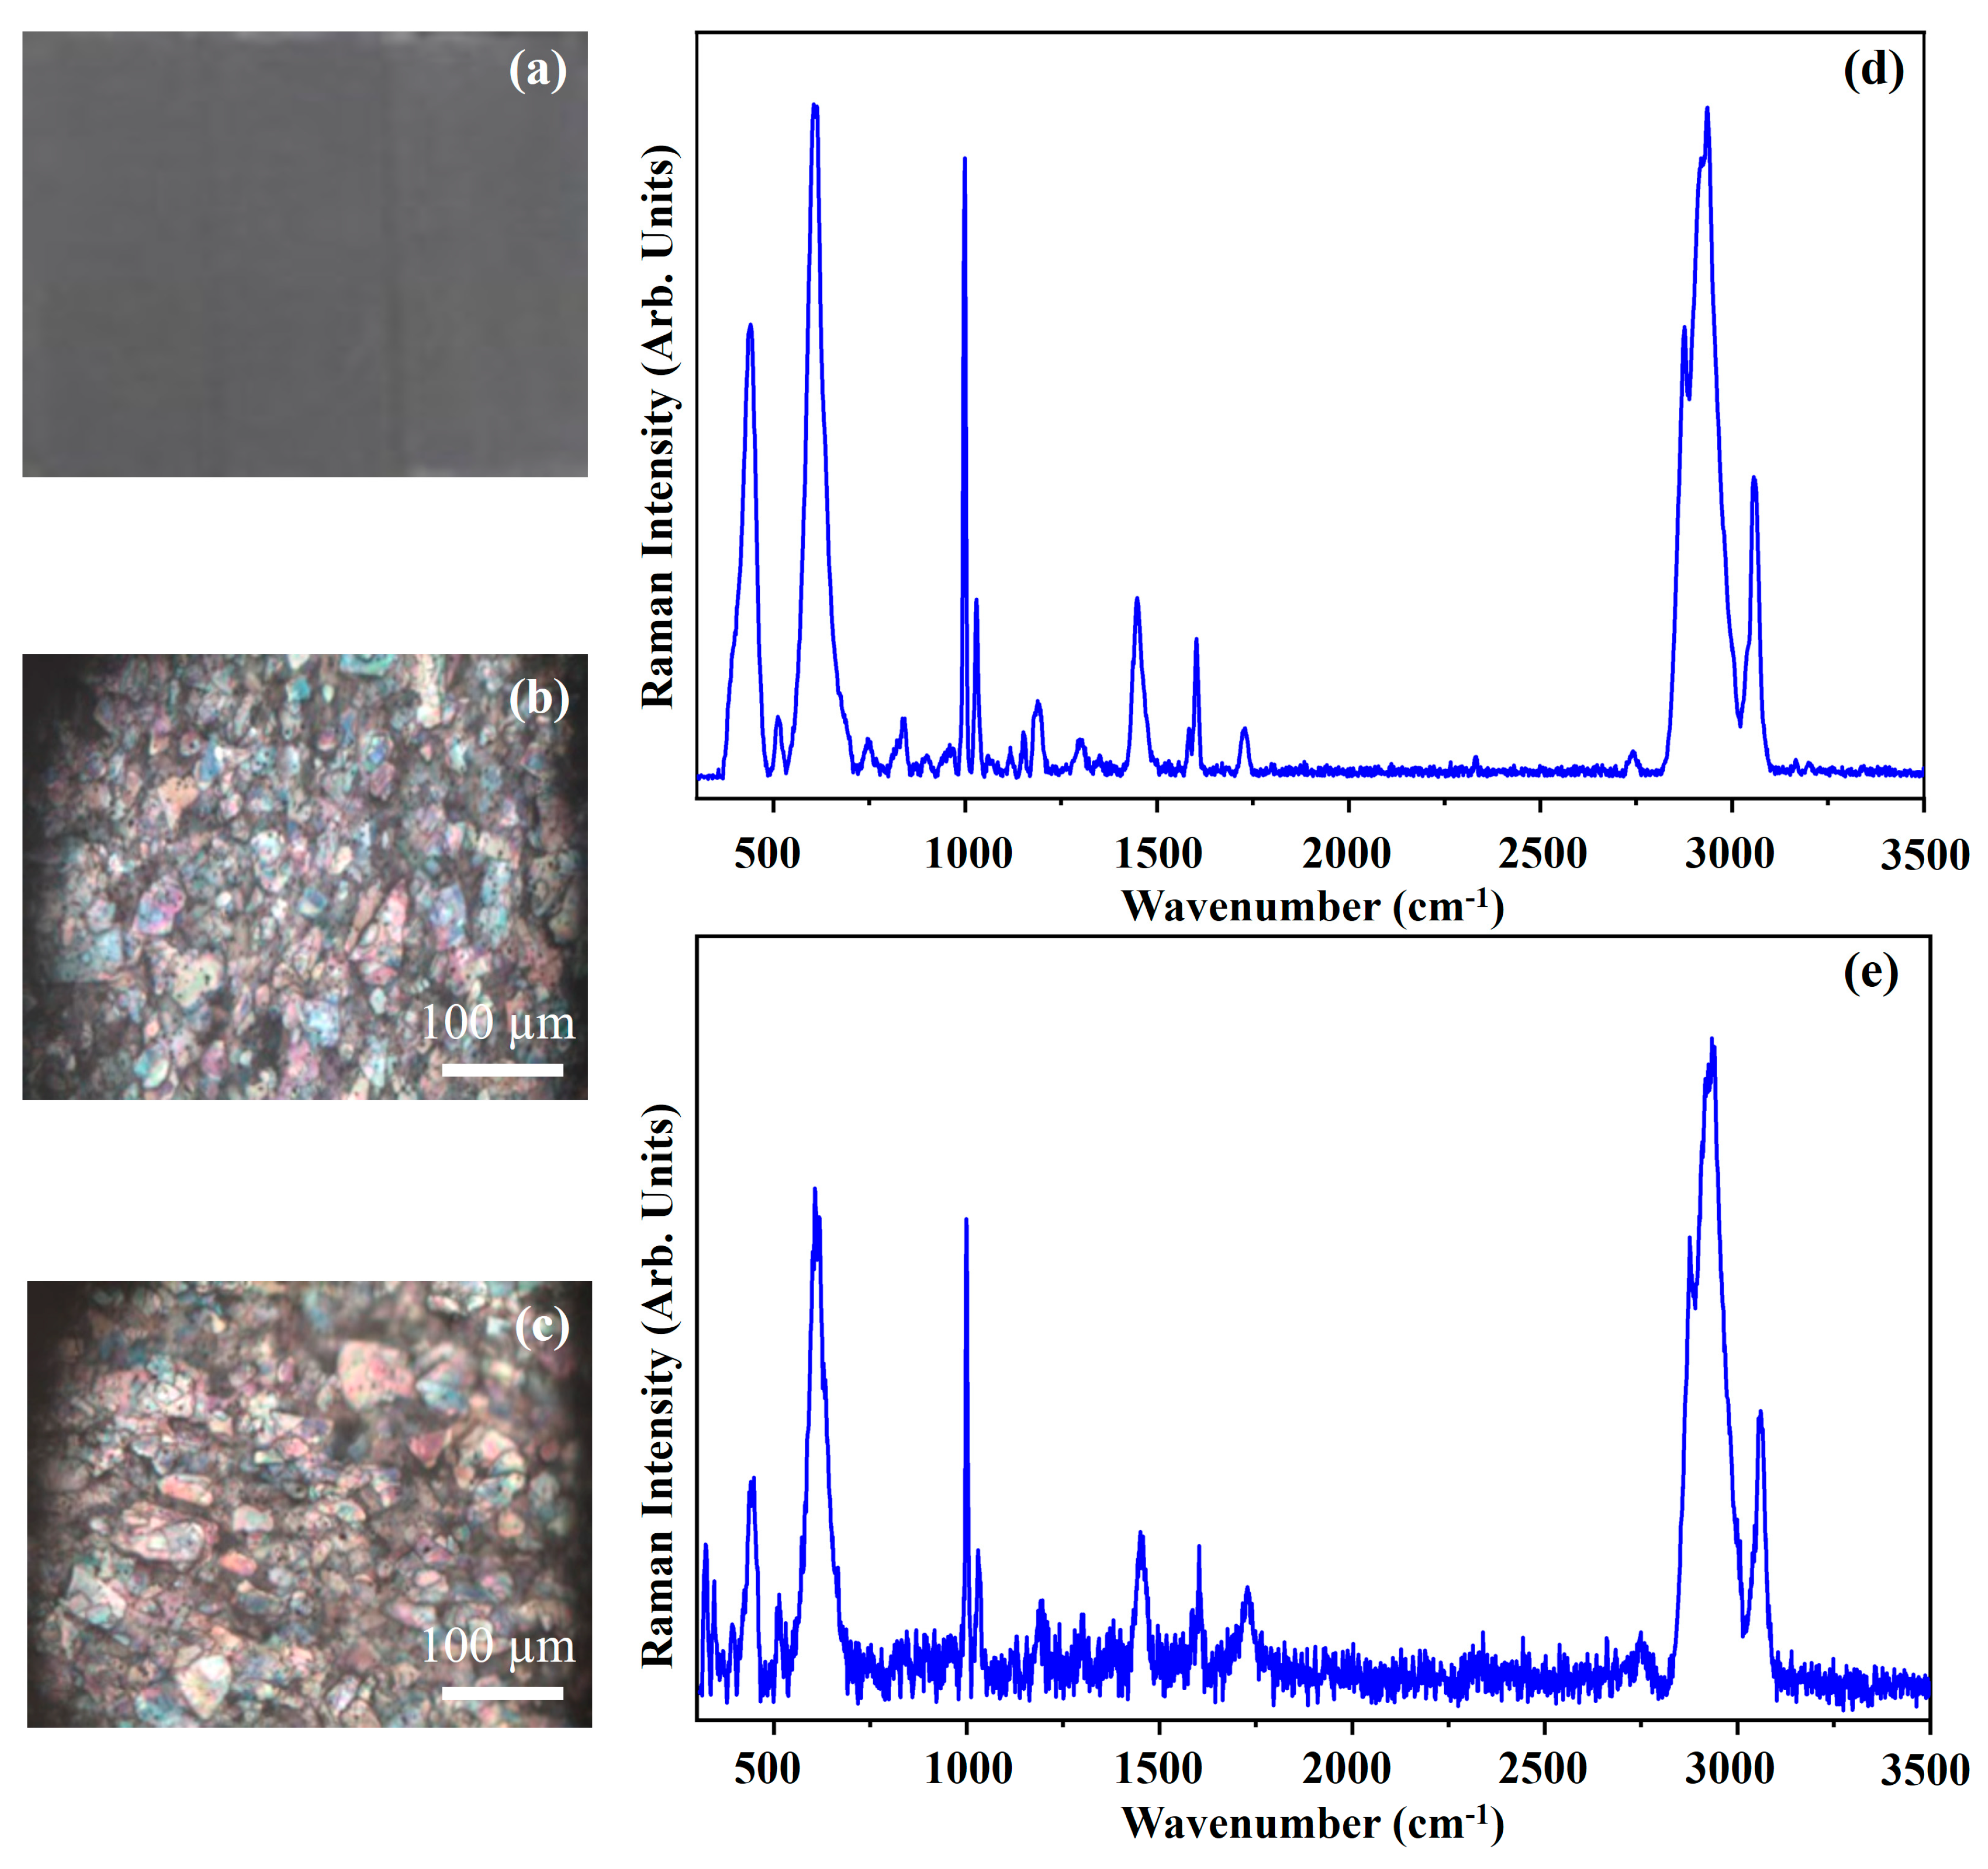
| IS | 20 | w | G | D0 | 15 | 20 |
| g | G | D03 | 10 | 10 | ||
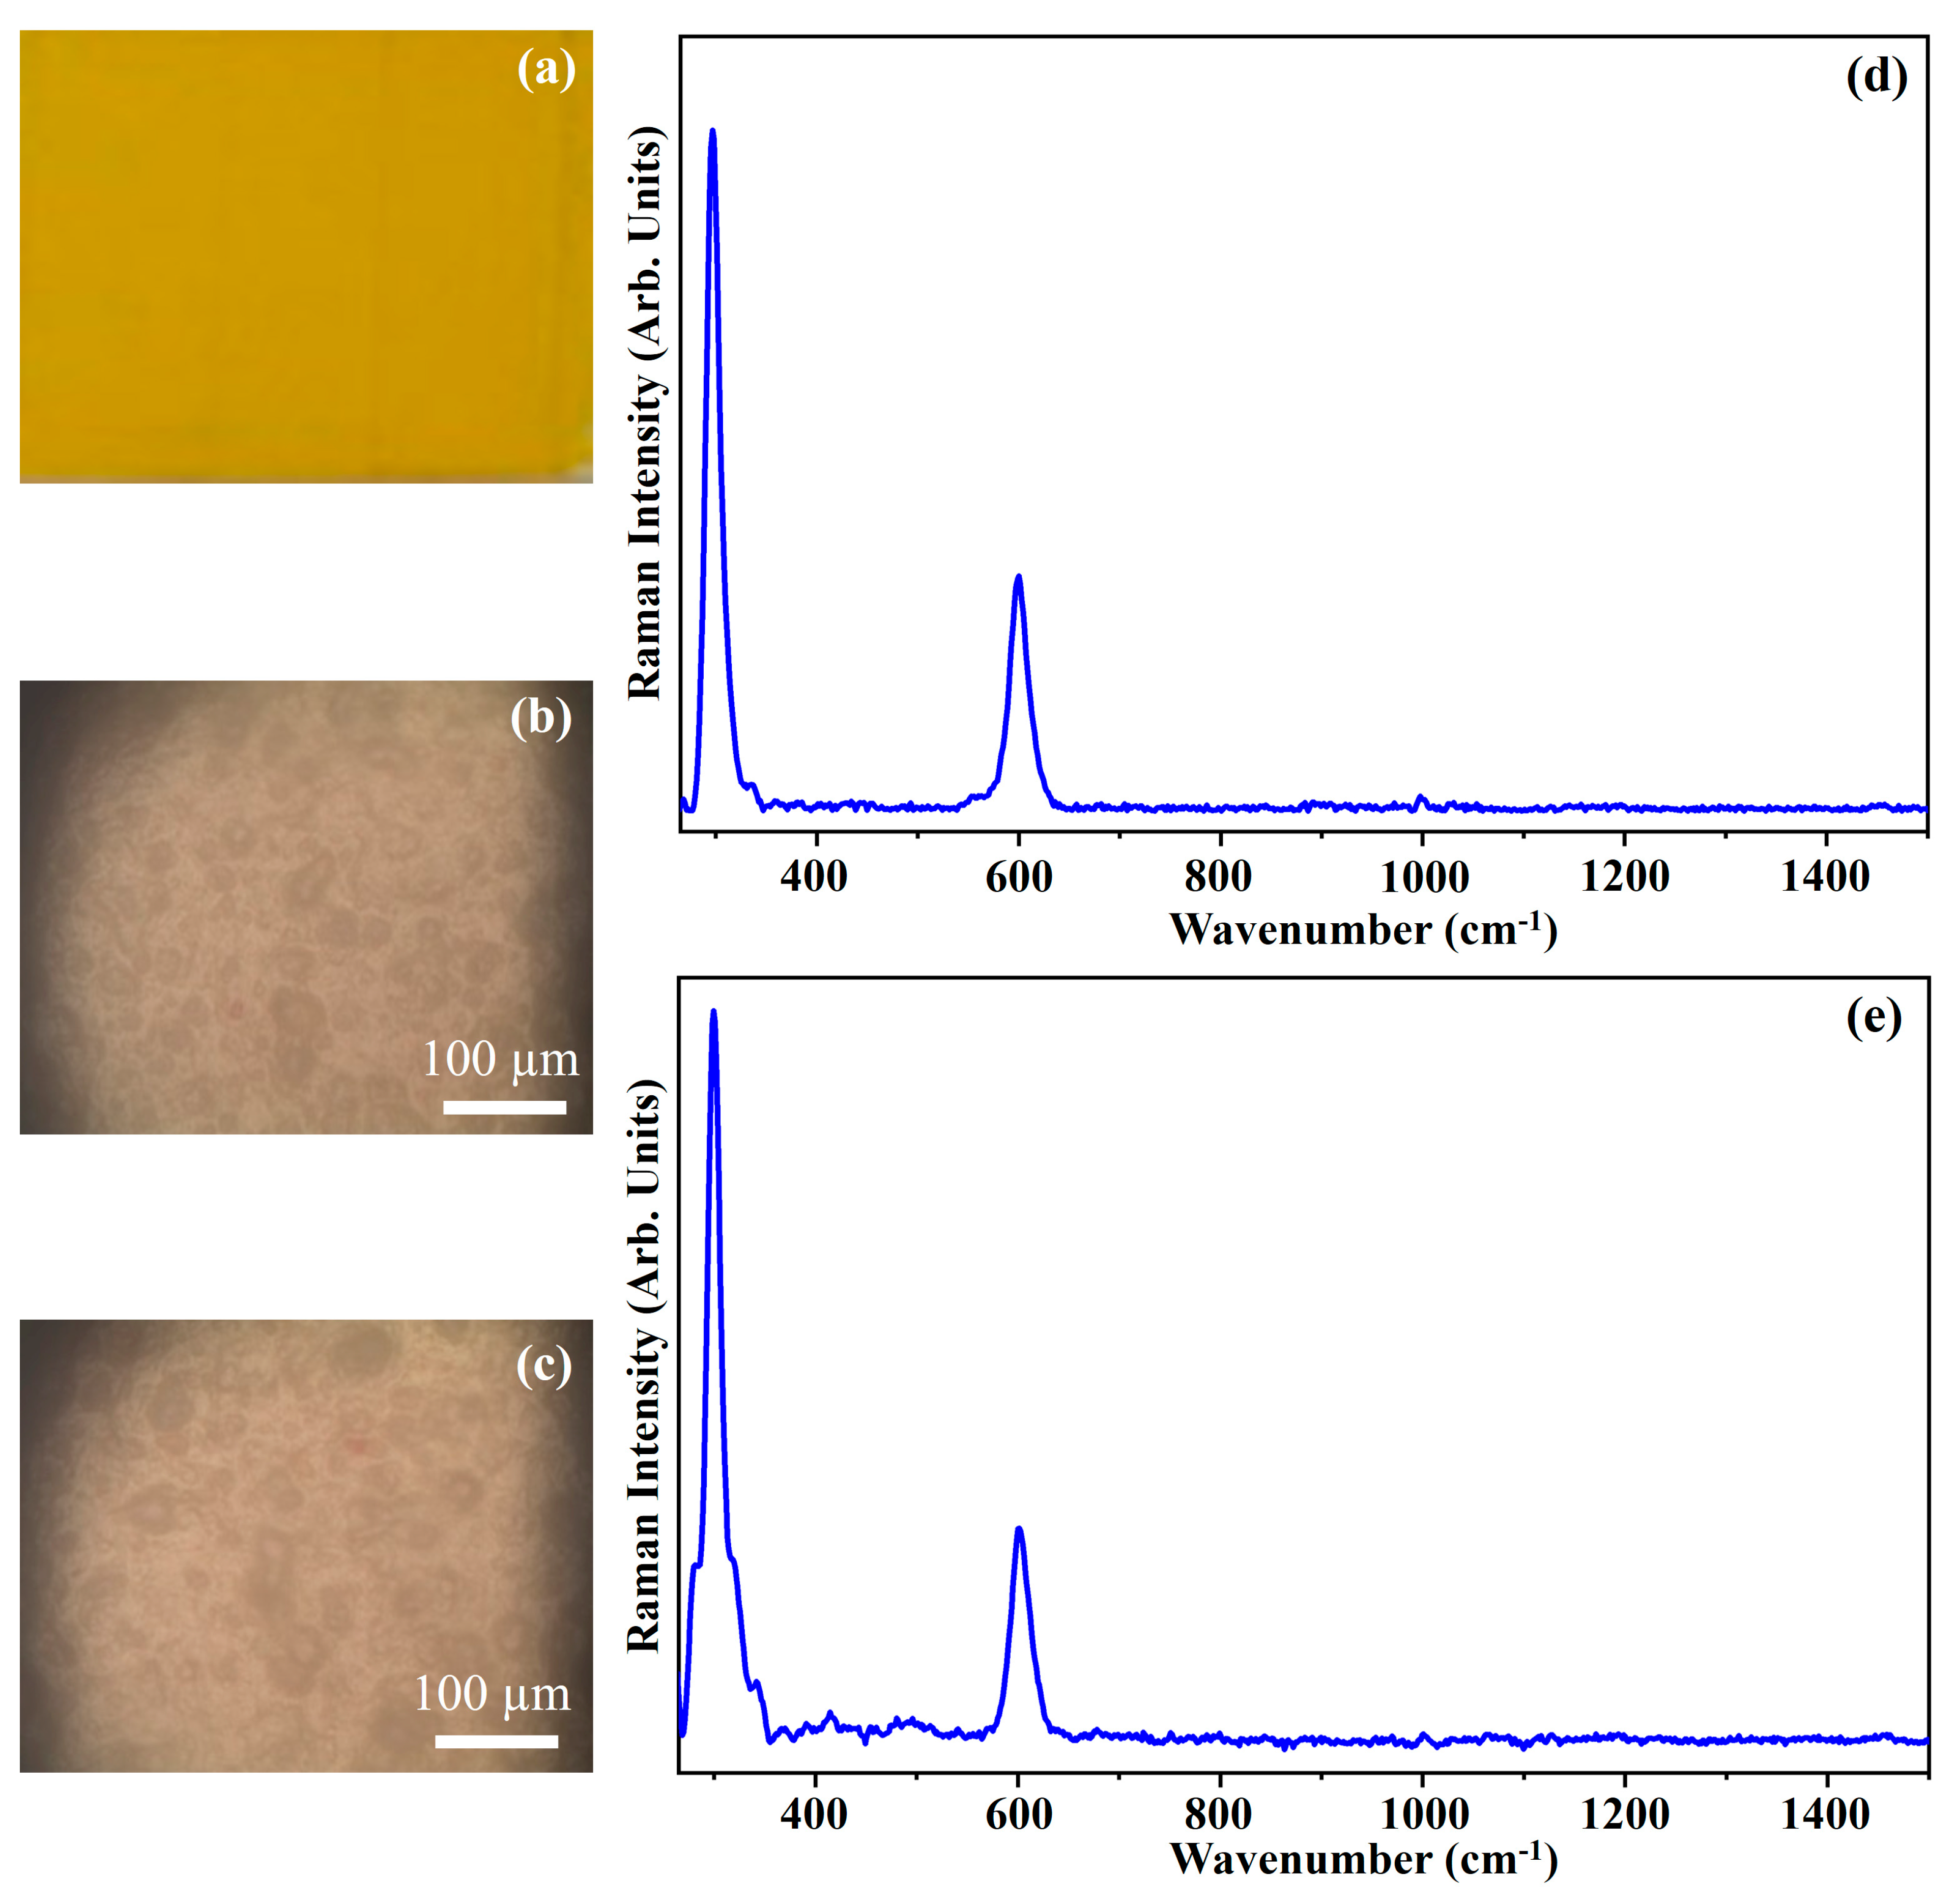
| CYM | 21 | w | G | D2 | 20 | 10 |
| g | G | D1 | 5 | 30 | ||
| CB(H) | 22 | w | R | D0 | 20 | 10 |
| G | D1 | 10 | 10 | |||
| g | R | D0 | 10 | 10 | ||
| G | D1 | 10 | 10 | |||
| PBL | 23 | w | R | D0 | 20 | 20 |
| G | D03 | 10 | 10 | |||
| g | R | D0 | 10 | 10 | ||
| G | D1 | 10 | 10 | |||
| VB | 24 | w | R | D0 | 60 | 10 |
| g | R | D0 | 60 | 15 | ||
| PGL | 25 | w | R | D0 | 20 | 10 |
| G | D0 | 20 | 5 | |||
| g | R | D0 | 10 | 10 | ||
| G | D1 | 10 | 10 |
| Pigment | Substrates | Laser | Observed Raman Bands |
|---|---|---|---|
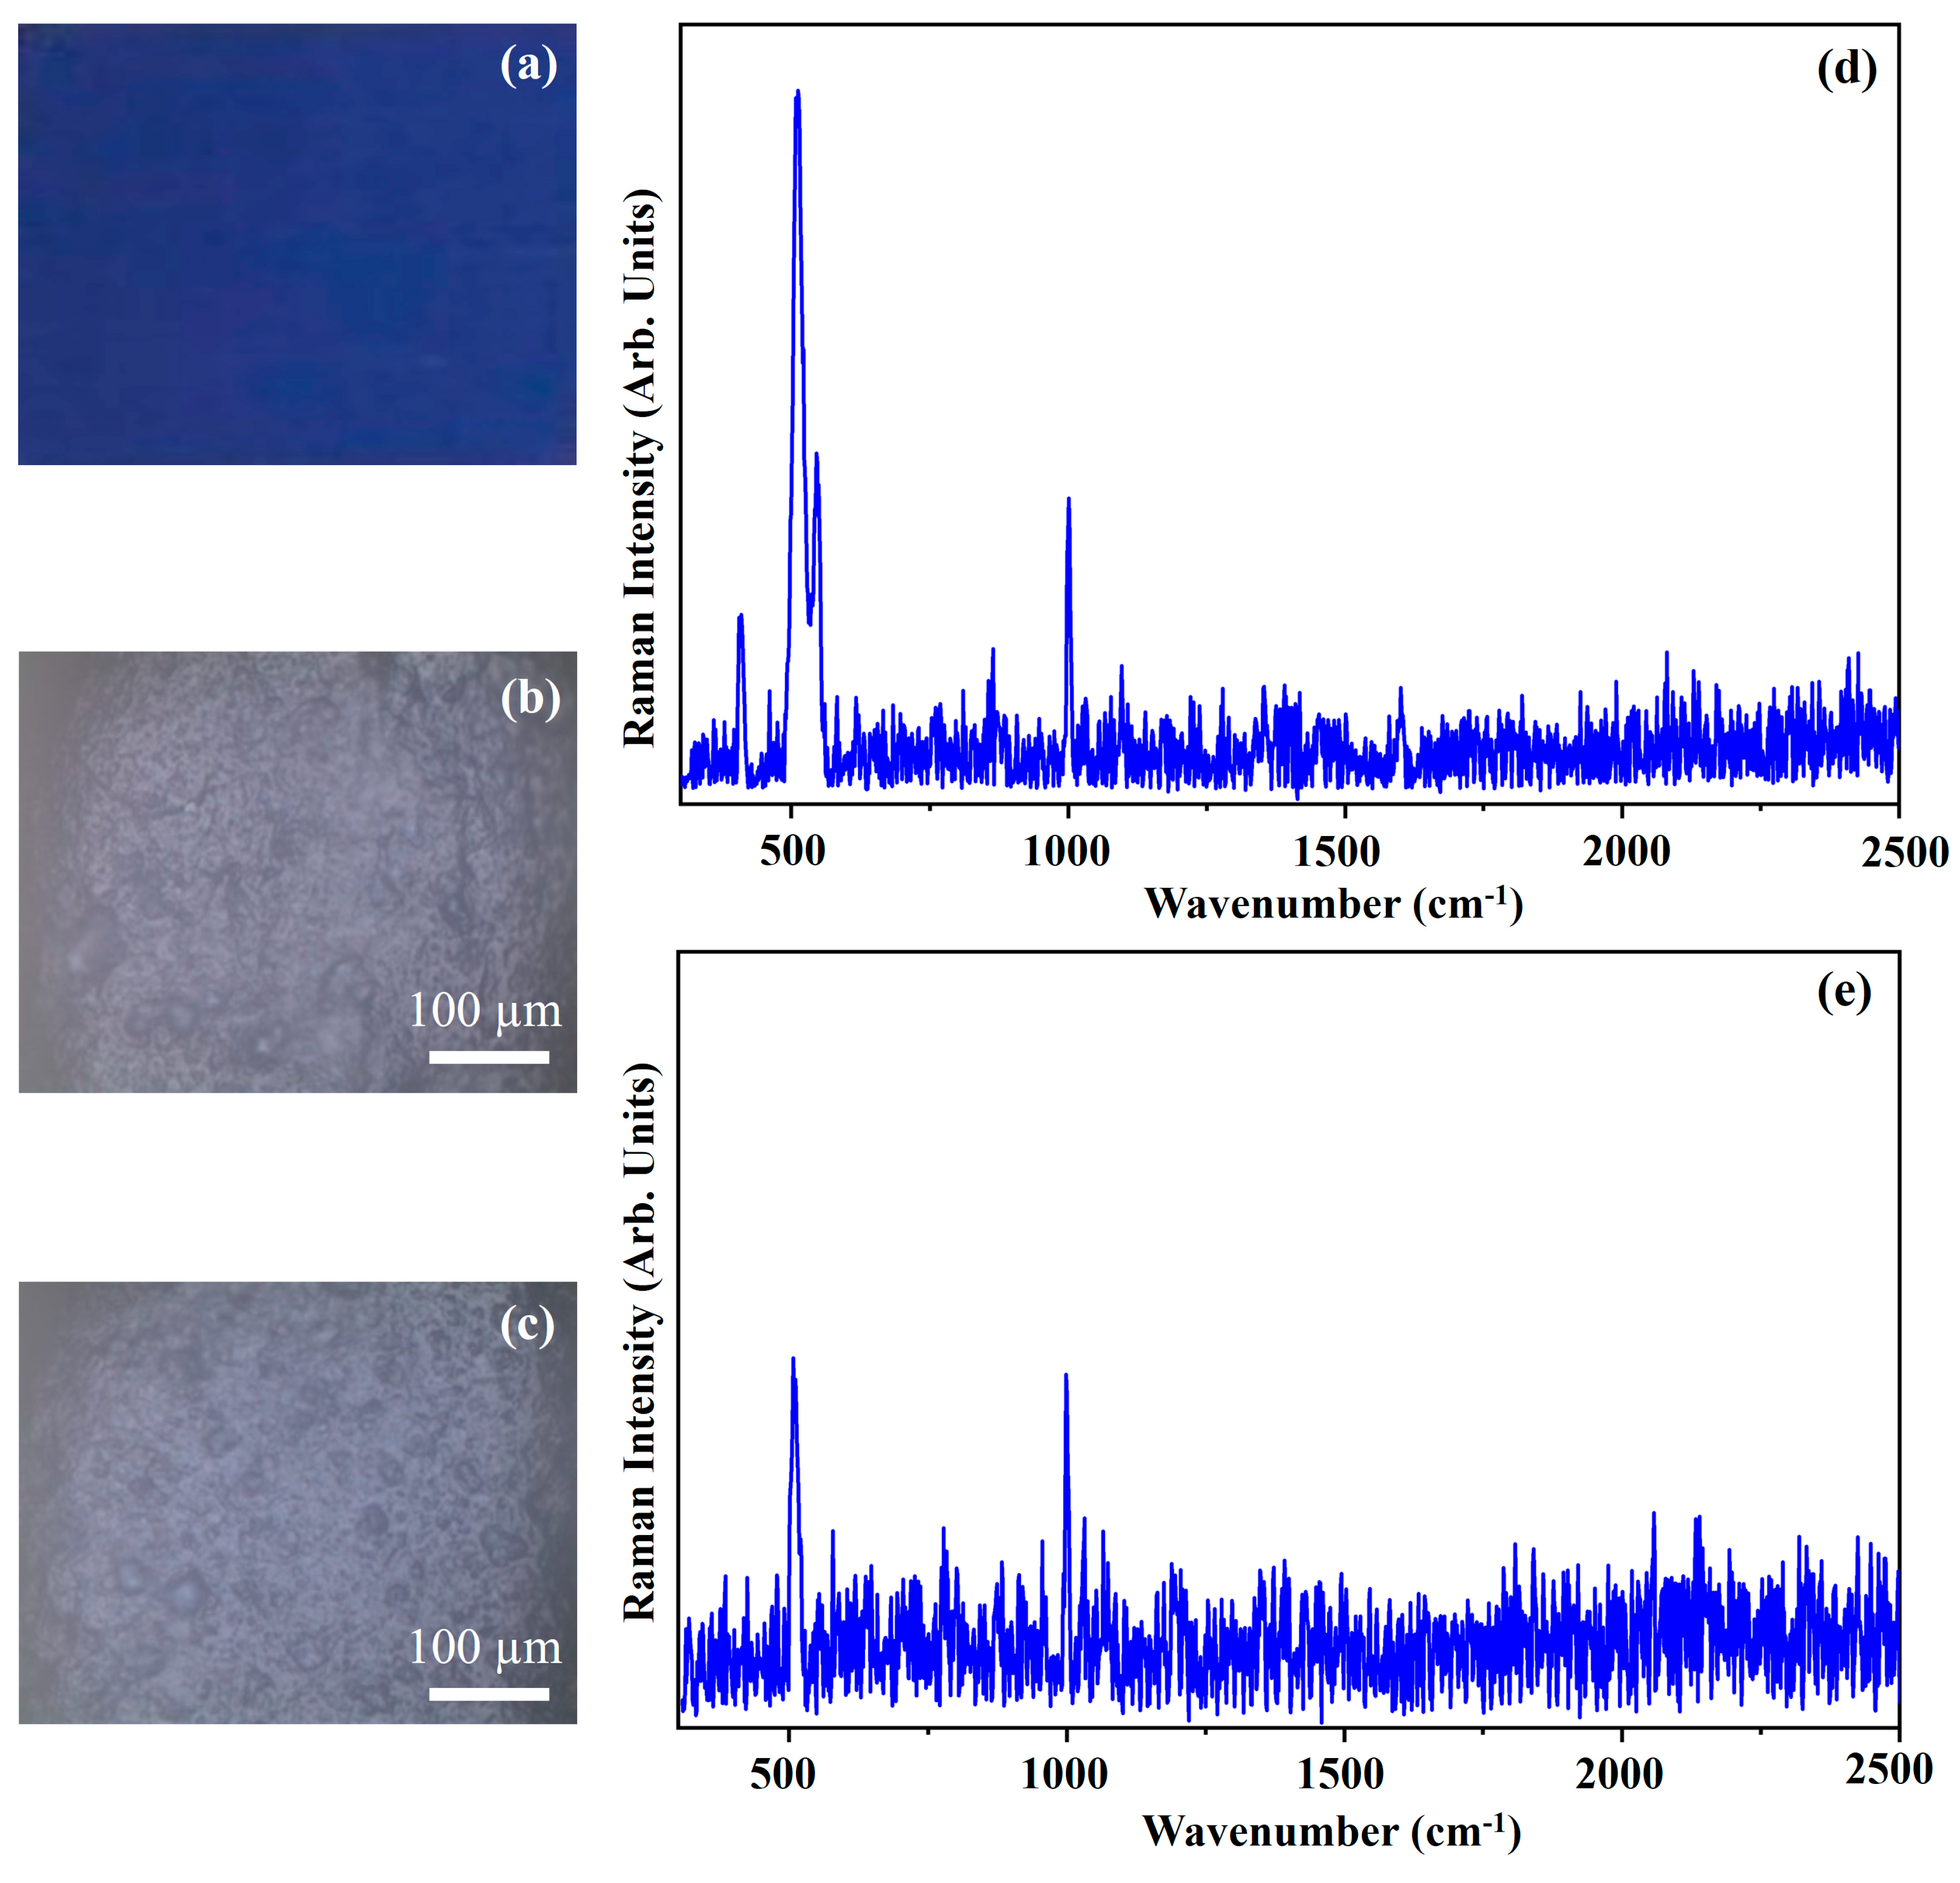
| PB | w | G | 427 vw, 490 vw, 591 m, 637 vw, 678 s, 715 vw, 746 s, 778 w, 835 m, 951 m, 1007 w, 1038 m, 1106 w, 1142 s, 1159 w (sh), 1186 w, 1307 w (sh), 1344 vs, 1415 w, 1434 w (sh), 1455 s, 1485 w (sh), 1531 vs, 1595 w, 1787 vw, 1892 vw, 2017 vw, 2089 vw, 2122 vw, 2180 vw, 2208 vw, 2276 vw, 2485 vw, 2598 vw, 2673 w, 2796 vw, 2873 w, 2983 w, 3058 w |
| R | 172 w, 232 w (sh), 253 w, 427 vw, 484 s, 592 m, 640 vw, 680 s, 716 w (sh), 748 vs, 781 w (sh), 835 w, 954 s, 1009 w, 1041 w, 1107 s, 1141 m (sh), 1197 m, 1218 m (sh), 1305 s, 1344 m (sh), 1412 w (sh), 1453 vs, 1529 vs, 1613 w, 1890 vw, 2092 vw, 2209 w, 2276 m, 2671 w, 2874 w, 2982 vw, 3058 m | ||
| g | G | 423 vw, 487 vw, 587 m, 633 vw, 675 s, 712 vw, 742 m, 773 w, 831 m, 946 m, 1002 w, 1033 m, 1102 w, 1139 s, 1155 w (sh), 1181 w, 1303 w (sh), 1340 vs, 1410 w, 1430 w (sh), 1450 s, 1488 w (sh), 1526 vs, 1592 w, 1783 vw, 1881 vw, 2086 vw, 2122 vw, 2179 vw, 2208 vw, 2273 vw, 2483 vw, 2595 vw, 2670 w, 2794 w, 2871 w, 2978 w, 3055 w | |
| R | 169 w, 230 w (sh),251 w, 284 vw, 425 vw, 482 s, 590 m, 678 s, 746 vs, 779 w, 832 w, 951 s, 1005 w, 1038 vw, 1106 s, 1141 m, 1196 m, 1218 m (sh), 1304 s, 1344 m (sh), 1411 vw, 1451 vs, 1494 vw, 1527 vs, 1612 w, 1890 vw, 2023 vw, 2090 vw, 2207 w, 2276 m, 2671 w, 2874 w 2981 vw, 3059 w | ||
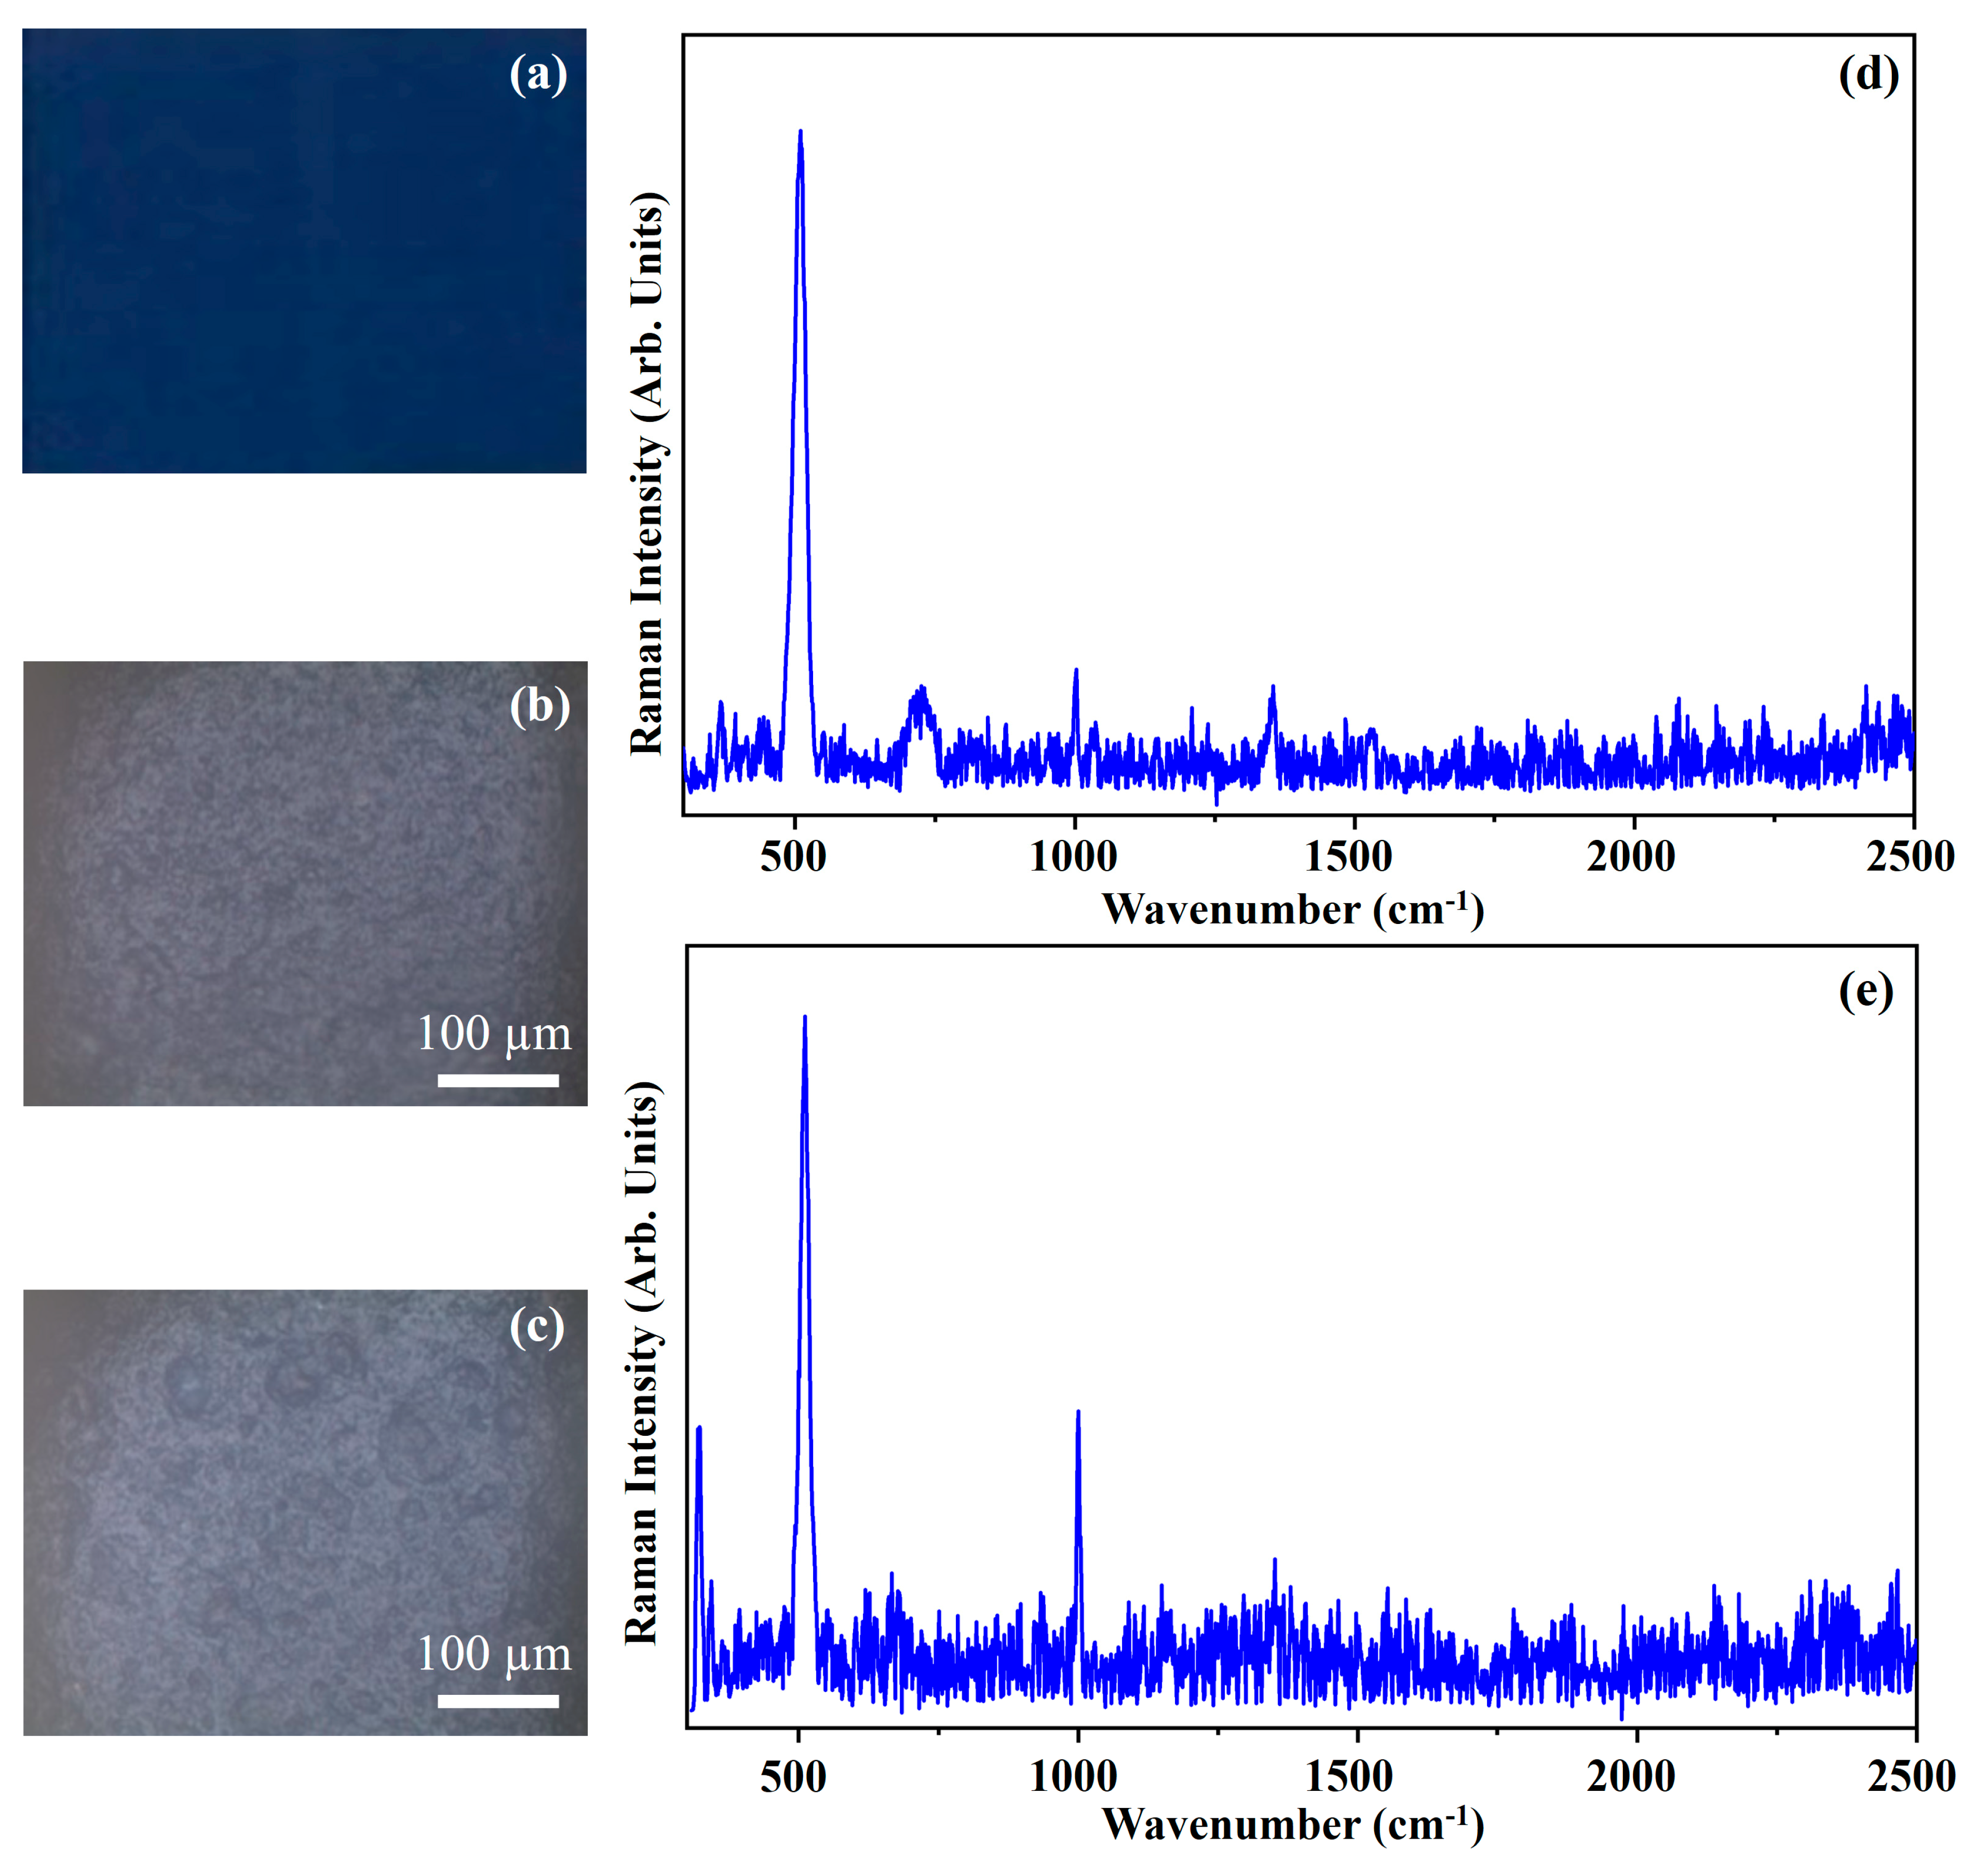
| PBC | w | G | 480 vw, 591 s, 677 vs, 744 m, 779 w, 828 m, 847 m (sh), 951 m, 1007 w, 1037 w, 1106 vw (sh), 1142 s, 1193 w, 1213 w, 1307 m, (sh), 1339 vs, 1370 vw (sh), 1451 s, 1482 vw (sh), 1527 vs, 1591 m, 2674 m, 2866 m, 2978 w, 3051 m |
| R | 418 w, 481 m, 593 m, 639 vw, 679 vs, 717 vw, 746 s, 775 w, 830 w, 847 vw (sh), 954 m, 1007 w, 1039 w, 1108 w, 1130 w (sh), 1141 m, 1193 m, 1214 m, 1305 m, 1321 w (sh), 1340 s, 1411 w, 1449 s, 1494 w, 1528 vs, 1609 w, 1812 w, 2020 w, 2090 w, 2276 m, 2674 m, 2874 m, 2983 w, 3059 m | ||
| g | G | 480 w, 591 s, 677 vs, 744 m, 780 w, 829 m, 844 m (sh), 951 m, 1006 w, 1036 w, 1107 vw, 1130 vw (sh), 1142 m, 1194 w, 1214 w, 1306 m (sh), 1340 vs, 1451 s, 1485 vw, 1529 vs, 1592 w, 2679 vw, 2875 w, 2982 vw, 3060 w | |
| R | 480 vw, 591 m, 637 vw, 677 vs, 692 w (sh), 717 vw, 744 s, 778 w, 829 s, 844 m (sh), 866 vw, 951 s, 1006 w, 1036 m, 1106 w, 1142 s, 1194 m, 1212 m, 1306 m, 1340 vs, 1374 vw (sh), 1412 vw (sh), 1429 w (sh), 1451 vs, 1470 w (sh), 1485 w (sh), 1529 vs, 1592 w, 1609 vw (sh), 2212 vw, 2278 vw, 2679 vw, 2797 vw, 2875 w, 2982 vw, 3059 w | ||
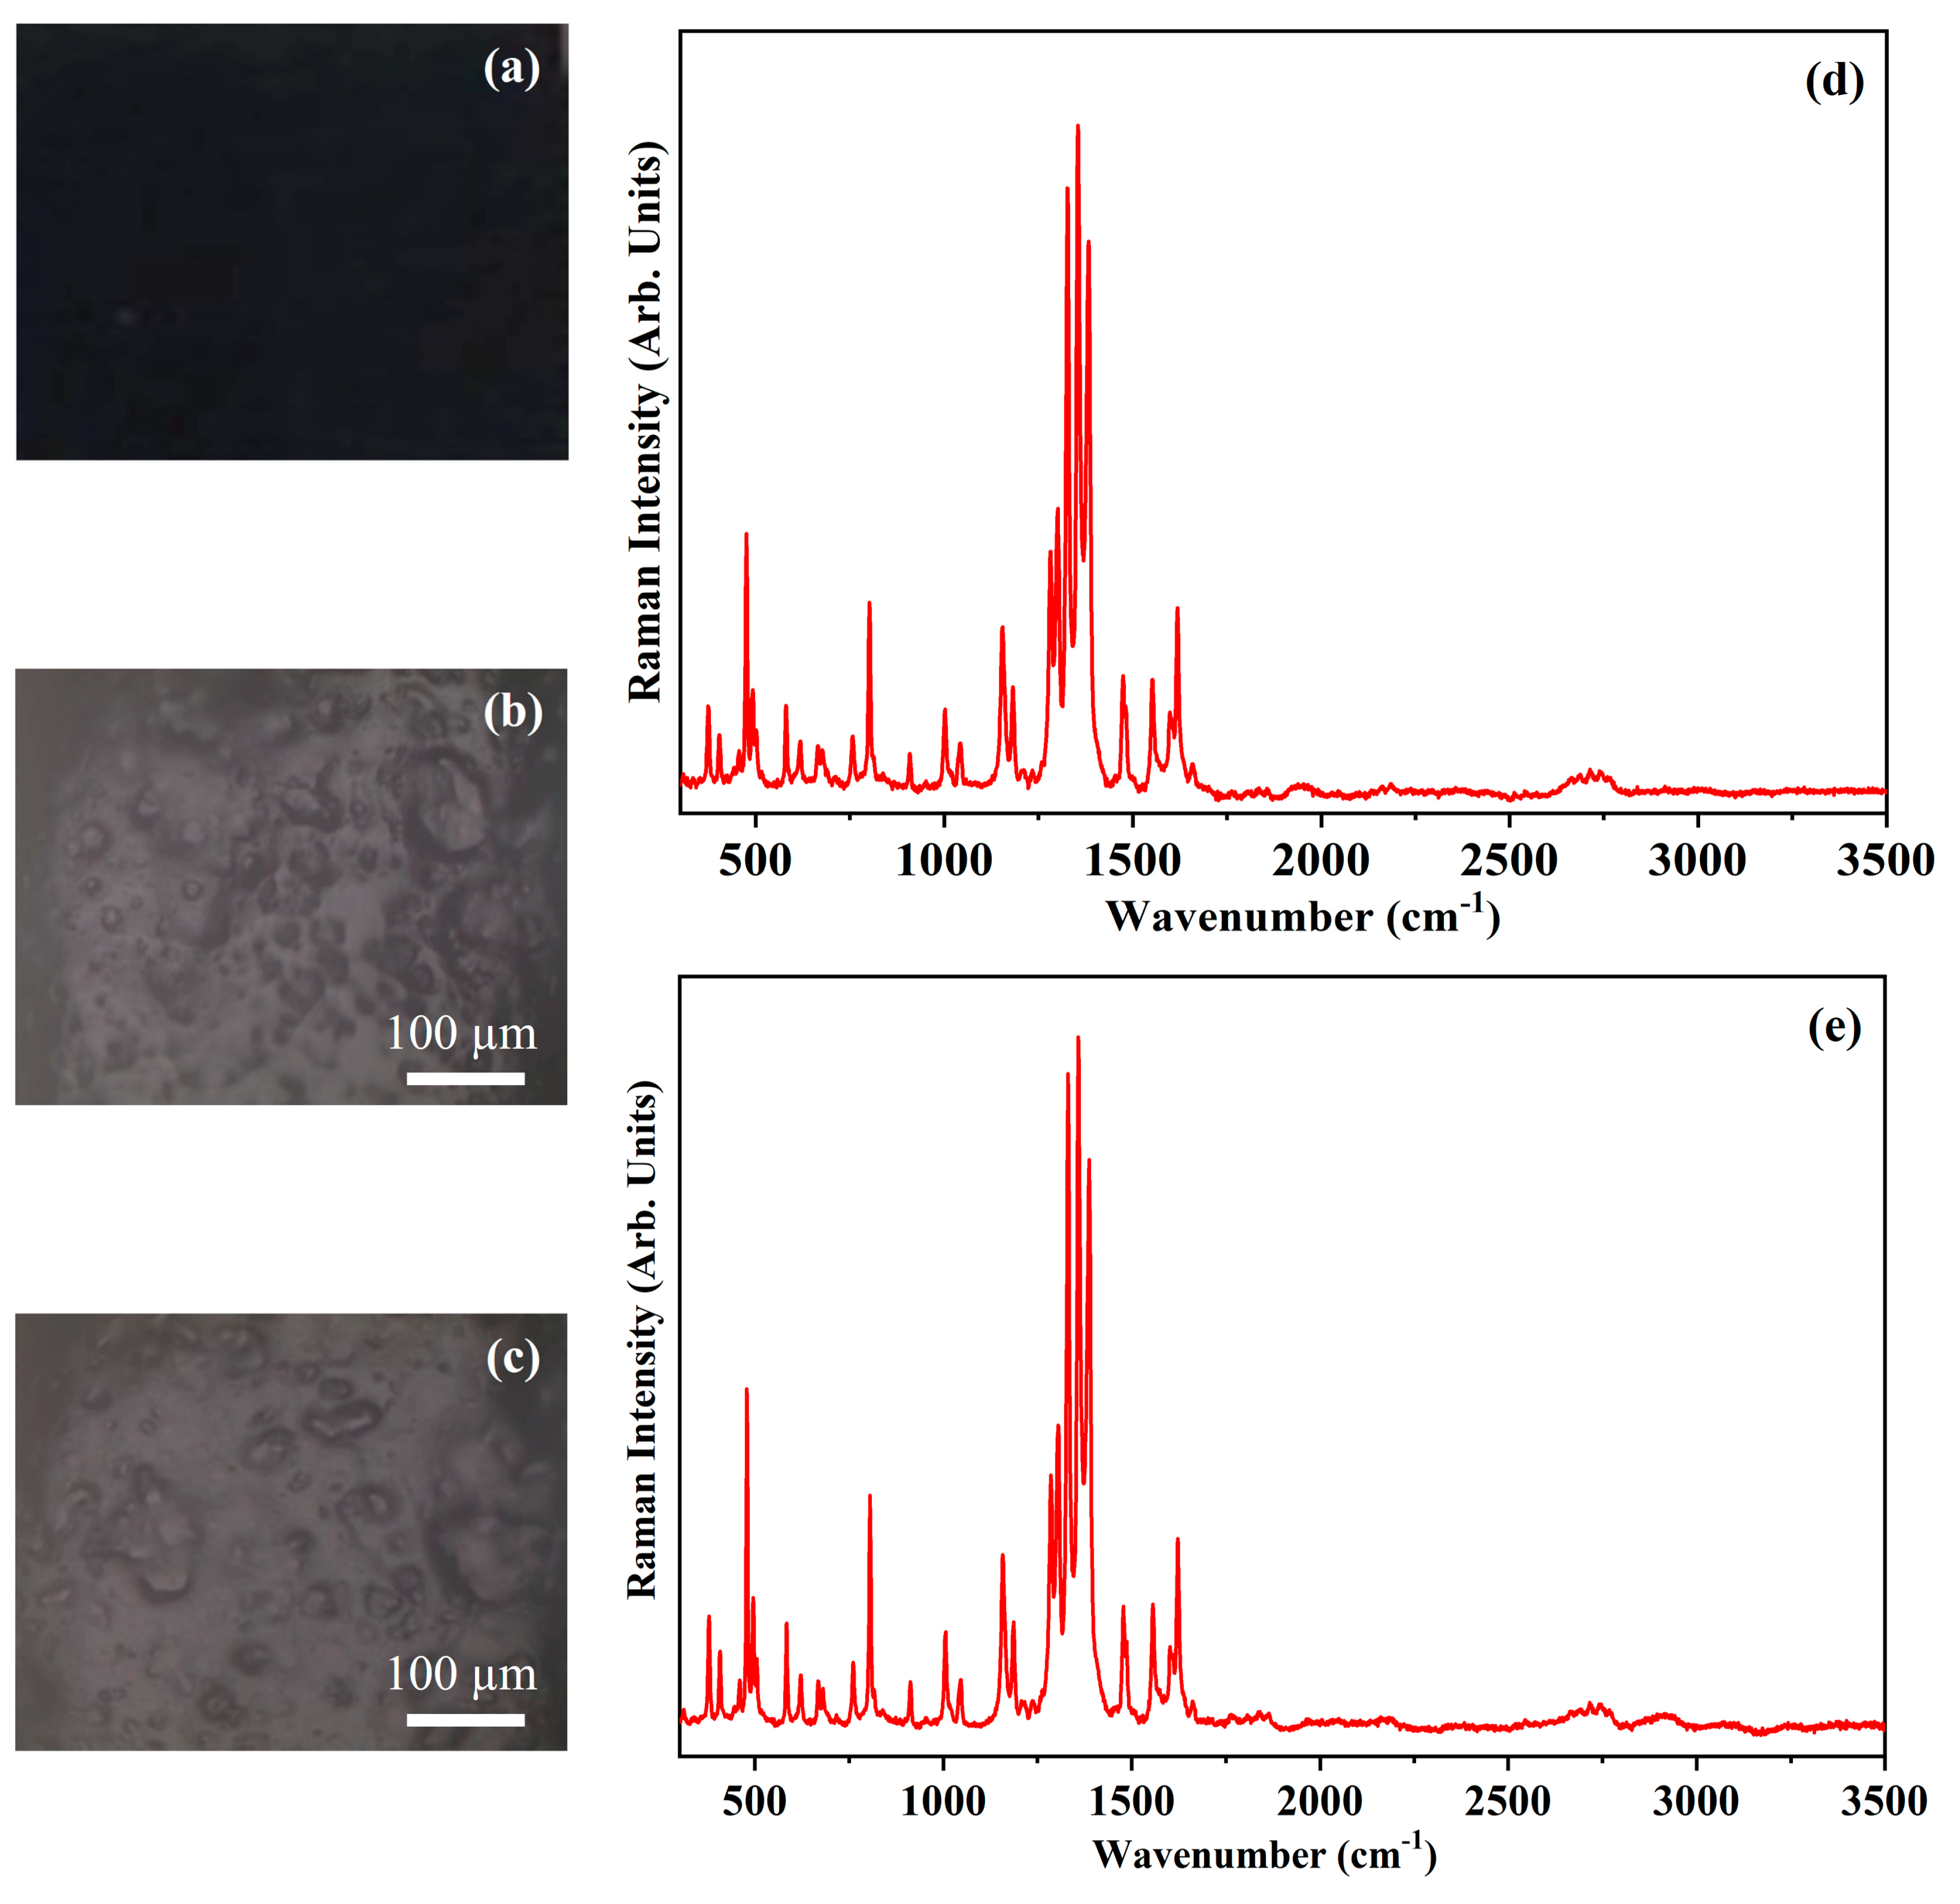
| IB | w | R | 374 m, 404 w, 476 s, 493 m (sh), 502 w (sh), 580 m, 619 w, 665 w, 757 w, 802 s, 909 w, 1002 m, 1043 w, 1154 s, 1182 m (sh), 1281 s (sh), 1301 s (sh), 1327 vs (sh), 1355 vs, 1383 vs, 1474 m, 1552 m, 1599 m (sh), 1619 s, 1658 w (sh), 2714 w, 2738 w |
| g | R | 378 m, 407 w, 478 s, 495 m (sh), 504 w (sh), 584 m, 622 w, 668 w, 761 w, 806 s, 913 w, 1006 m, 1046 w, 1158 m, 1186 m (sh), 1286 s (sh), 1297 s, 1305 s (sh), 1331, vs, 1358 vs, 1387 vs (sh), 1478 m, 1557 m, 1601 w (sh), 1622 s, 1661 vw (sh), 2717 w, 2741 w | |
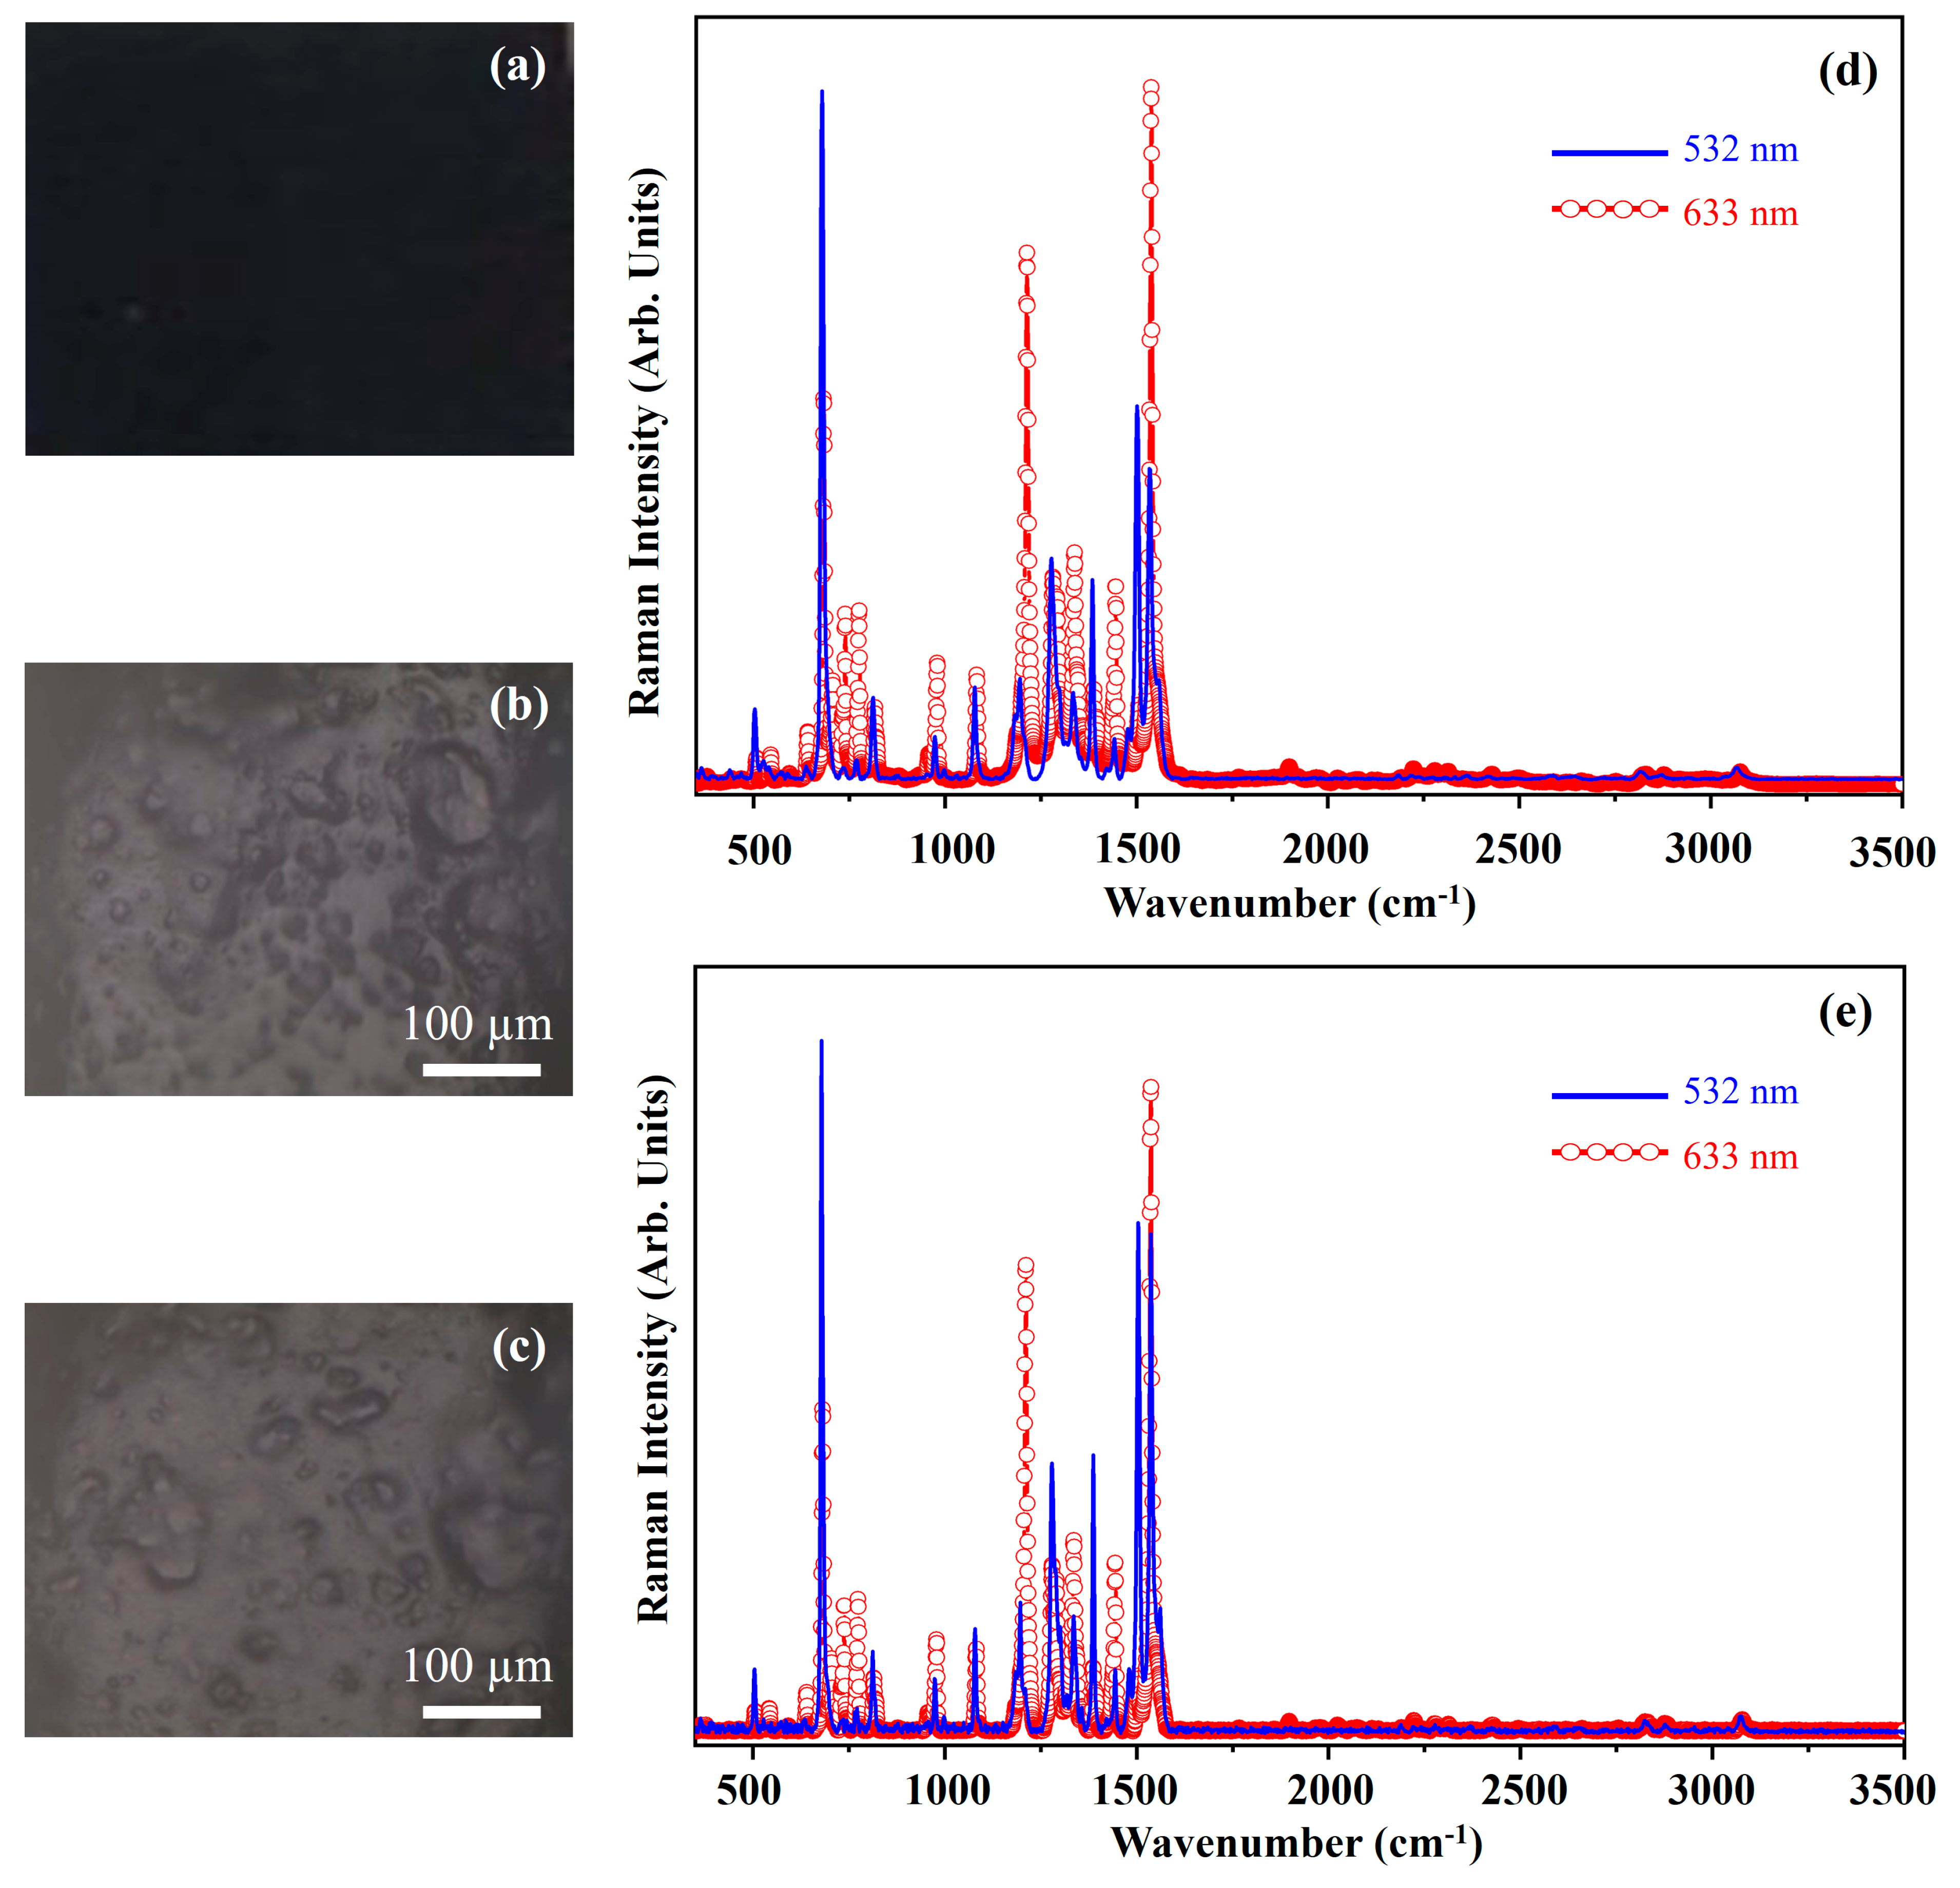
| PG | w | G | 503 m, 527 vw (sh), 637 vw, 679 vs, 734 vw, 770 w, 812 m, 974 m, 998 vw, 1078 m, 1196 m, 1278 s, 1355 m (sh), 1385 s, 1442 w, 1477 vw (sh), 1502 s, 1534 s, 1558 m (sh), 2186 vw, 2218 vw, 2364 vw, 2416 vw, 2588 vw, 2646 vw, 2818 w, 2873 w, 3067 w |
| R | 508 vw, 545 vw, 642 w, 684 vs. 706 m (sh), 740 s, 776 s, 817 m, 958 w (sh), 980 s, 1084 s, 1214 vs, 1282 s, 1292 s (sh), 1318 w, 1339 s, 1361 w, 1396 w, 1446 s, 1507 m (sh), 1538 vs, 1899 vw, 2224 vw, 2280 vw, 2314 vw, 2428 vw, 2828 vw, 2879 vw, 3078 vw | ||
| g | G | 504 m, 679 vs, 772 w, 813 m, 974 m, 999 vw, 1079 m, 1197 s, 1280 s, 1301 w (sh), 1336 m, 1387 s, 1444 m, 1481 w (sh), 1504 vs, 1537 vs, 1562 m (sh), 2189 vw, 2824 w, 2877 vw, 3075 w | |
| R | 507 w, 543 w, 641 w, 682 vs, 705 m (sh), 739 s, 775 s, 815 m, 956 vw (sh), 979 m, 1083 m, 1213 vs, 1281 s, 1292 s (sh), 1316 w, 1336 s, 1387 w, 1445 s, 1504 m (sh), 1537 vs, 1827 vw, 2224 vw, 2278 vw, 2313 vw, 2427 vw, 2827 vw, 2876 vw, 3078 vw | ||
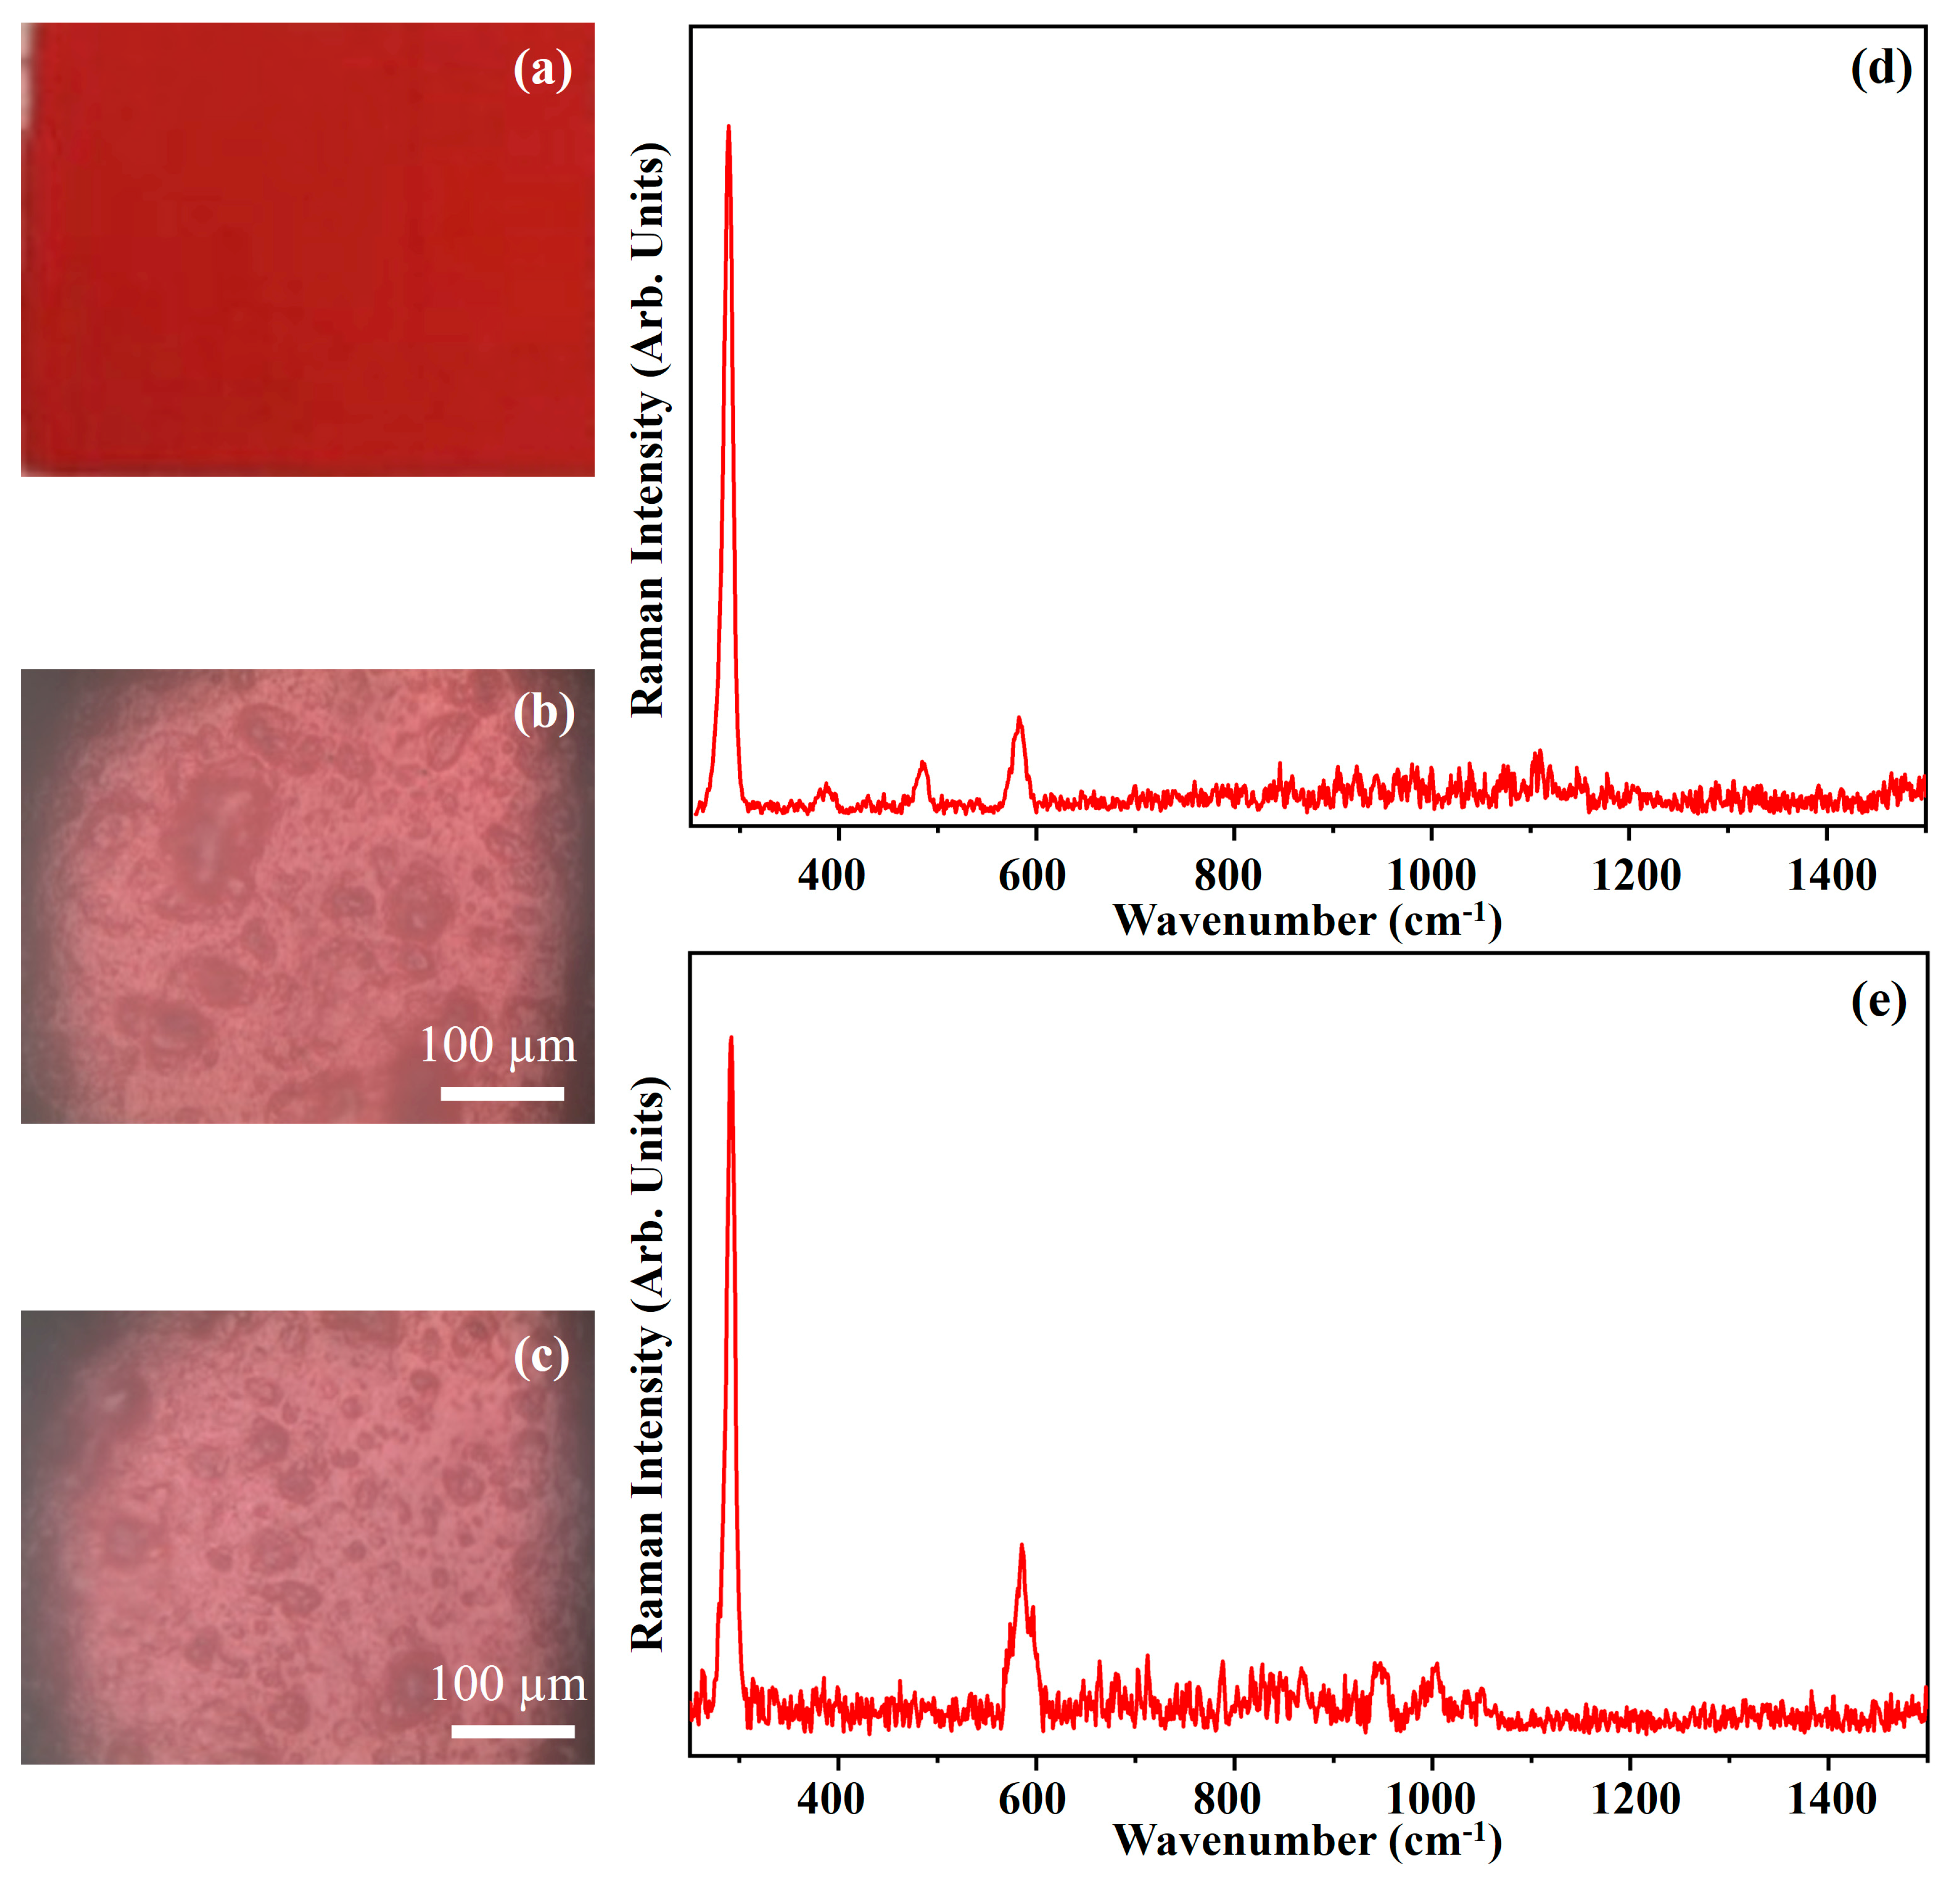
| PRM | w | R | 458 m, 693 s, 1134 w (sh), 1160 m, 1316 s, 1333 s (sh), 1515 m, 1565 s, 1597 s, 1650 m |
| g | R | 463 m, 698 s, 1136 m, 1318 s, 1335 s (sh), 1518 m, 1566 m, 1599 m, 1653 m | |
| LY | w | G | 396 m, 454 m, 581 m, 615 w (sh), 630 m, 878 w (sh), 897 m, 949 m, 1001 w (sh), 1014 m, 1077 m, 1134 m, 1191 m, 1241 vs, 1279 s, 1318 s, 1364 m (sh), 1396 s, 1430 vs, 1500 vs, 1573 vs, 1622 s, 1642 m (sh), 1665 m (sh), 1729 m, 2875 m br (sh), 2932 m br, 3063 m |
| g | G | 396 m, 449 m, 580 m, 615 w (sh), 628 m, 874 w (sh), 896 m, 947 m, 1001 w (sh), 1013 m, 1075 m, 1132 m, 1189 m, 1239 vs, 1277 s, 1314 s, 1362 m (sh), 1394 s, 1428 vs, 1498 vs, 1571 vs, 1620 s, 1638 m (sh), 1662 m (sh), 1728 m (sh), 2876 m br (sh), 2937 m br, 3064 m | |
| CB | w | G | 407 m, 512 vs, 545 m (sh), 1001 m, 1353 w, 1602 m |
| g | G | 507 s, 999 s | |
| UL | w | G | 548 vs, 579 m (sh), 806 w, 1096 s, 1353 w, 1648 m, 2195 m, 2732 m br |
| g | G | 543 vs, 578 m (sh), 801 w, 1091 m, 1354 vw, 1643 m, 2188 w, 2732 m br | |
| CeB | w | G | 510 s, 725 w br, 1002 w, 1354 w |
| g | G | 511 vs, 1000 m | |
| CRM | w | R | 288 vs, 387 w, 484 w, 582 m |
| g | R | 292 vs, 585 m | |
| ZW | w | R | 435 s, 1001 vs, 1033 m, 1448 m, 1603 m, 2877 w (sh), 2920 m br, 3059 w |
| g | R | 435 m, 1002 vs, 1036 m, 1451 m, 1603 m, 2878 m (sh), 2926 m br, 3064 m | |
| TW | w | G | 443 vs, 606 vs, 999 w, 1032 vw, 1451 w, 1603 w 2875 w(sh), 2917 m br, 2937 m br, 3059 w br |
| g | G | 444 vs, 608 vs, 1000 w, 1032 vw, 1543 w, 1605 vw, 2876 w (sh), 2917 m br, 2939 m br, 3061 w br | |
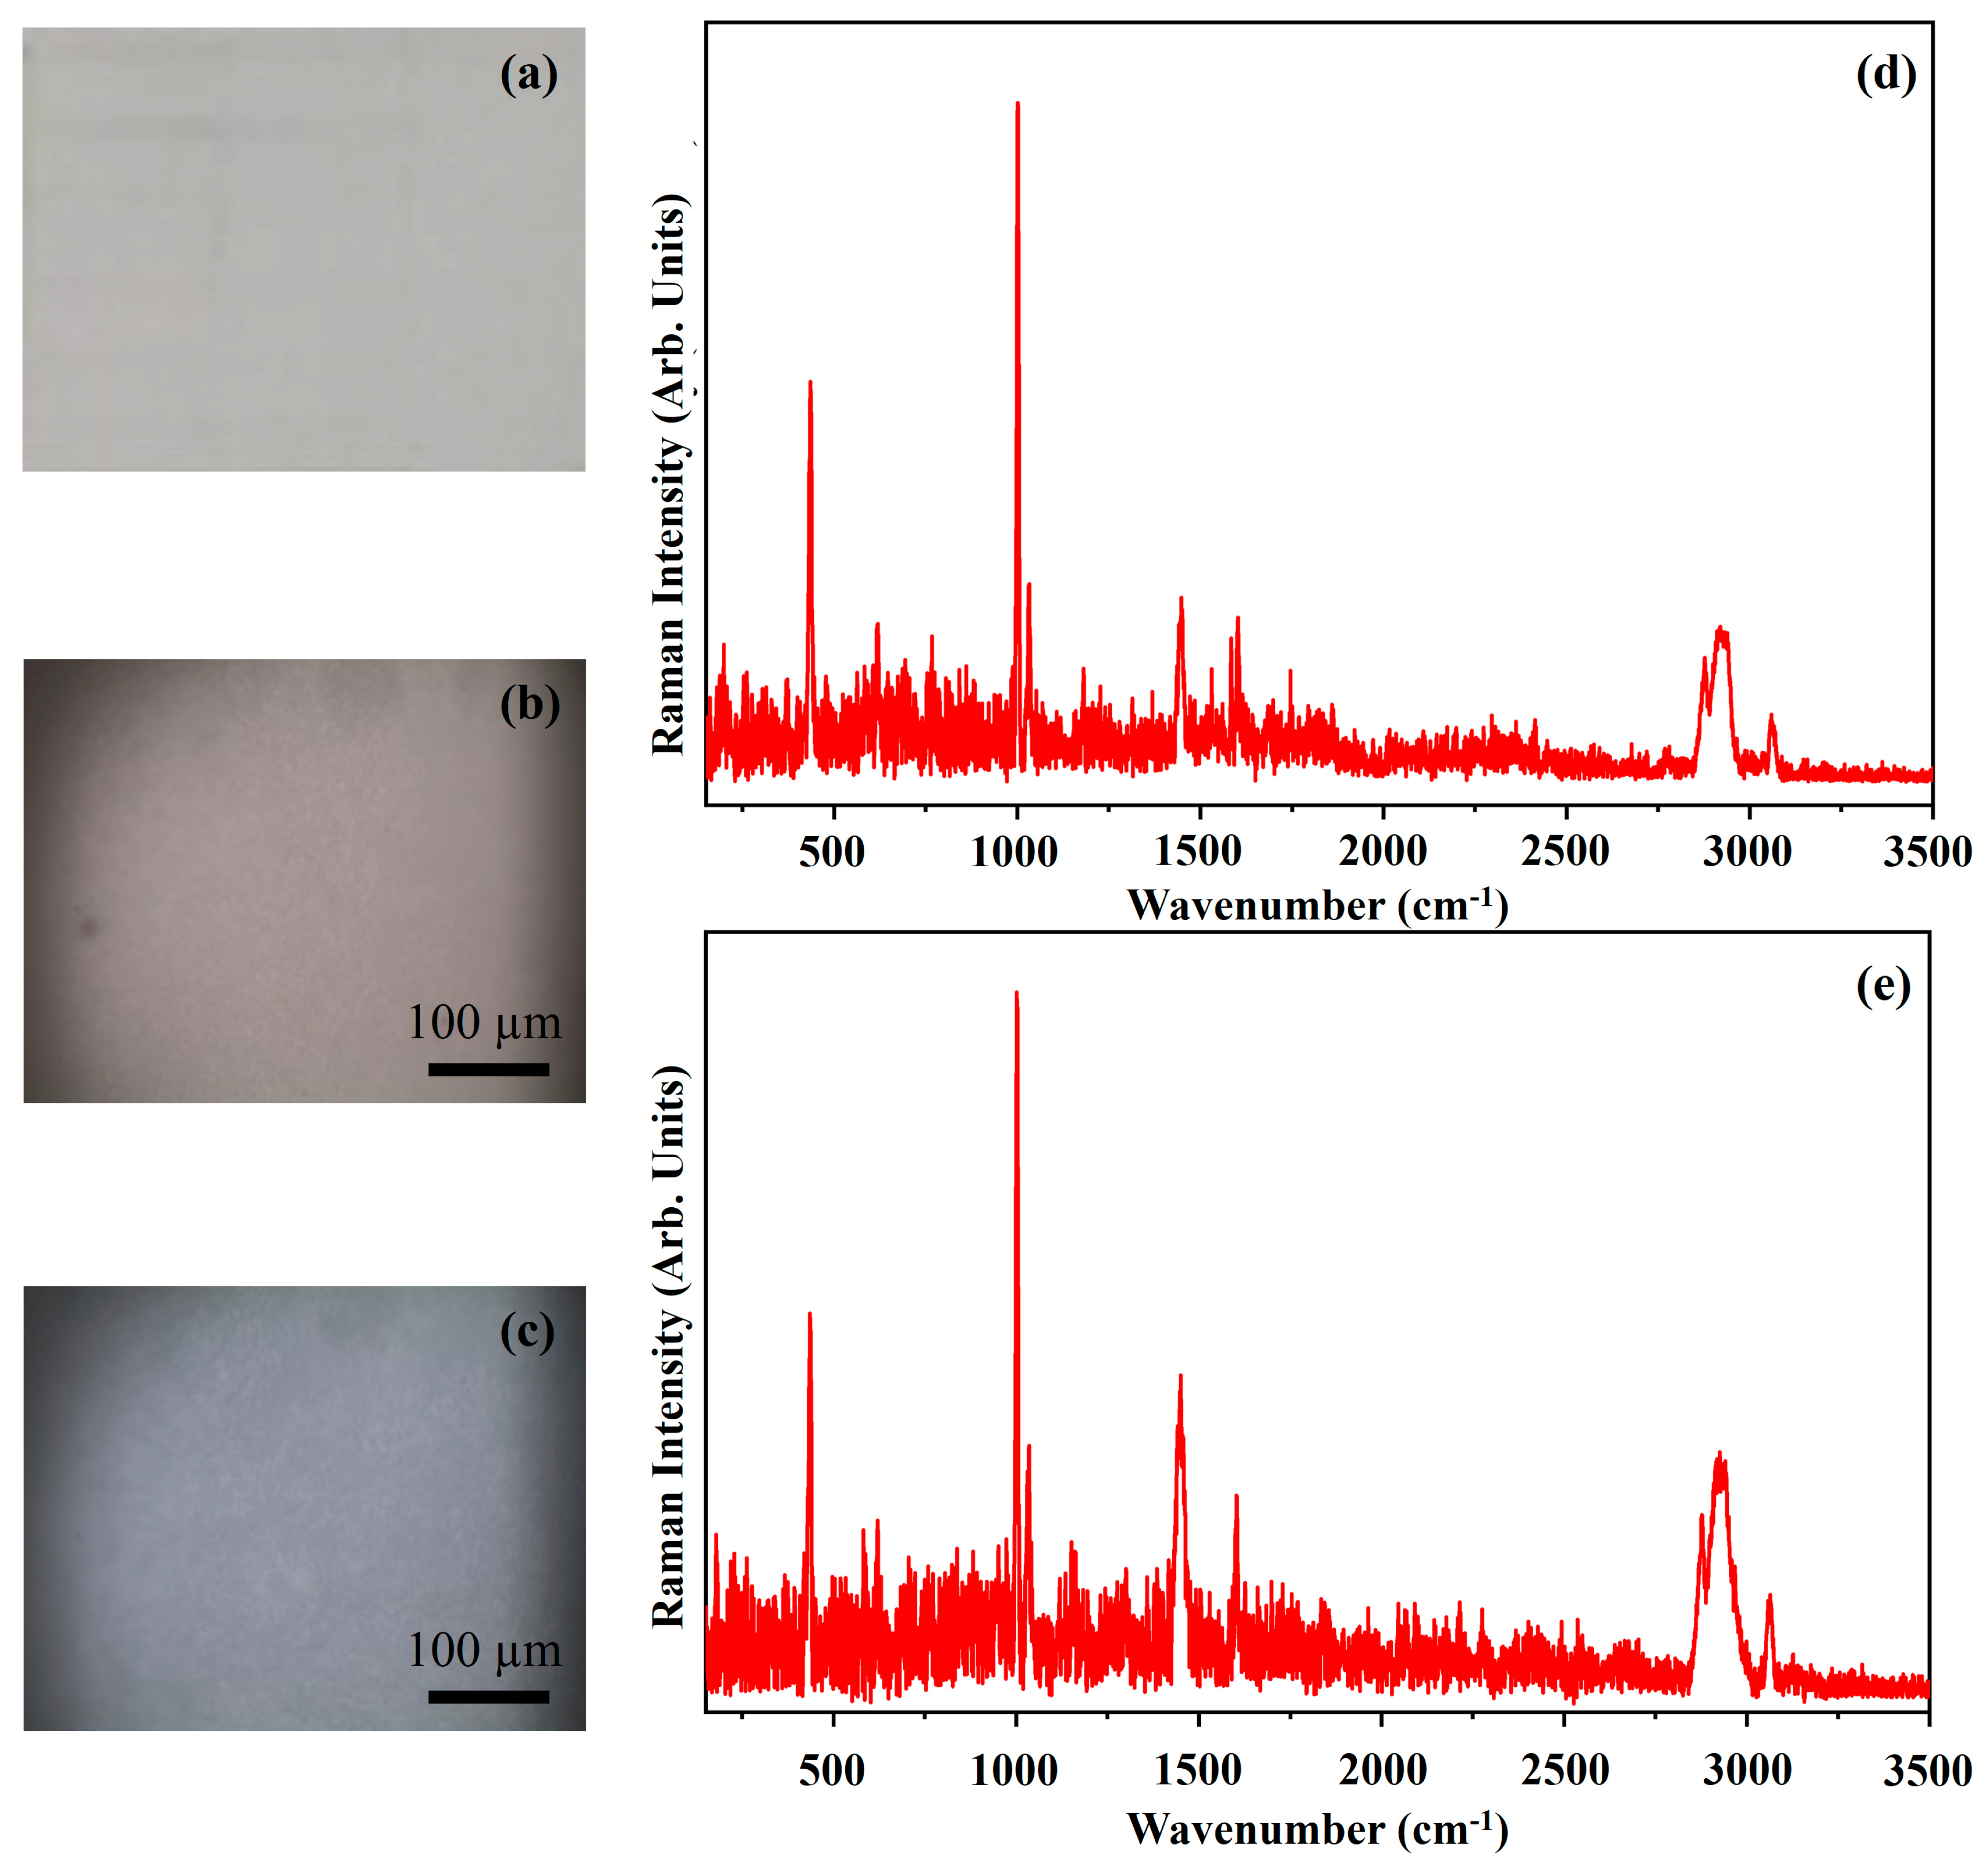
| IS | w | G | 440 s, 512 w (sh), 606 vs, 748 w, 837 w, 959 w br, 999 vs, 1030 m (sh), 1059 w (sh), 1117 w, 1152 w, 1189 m, 1298 w, 1449 m, 1584 w (sh), 1603 m, 1729 w, 2742 vw, 2876 s (sh), 2919 vs (sh), 2936 vs, 3056 s |
| g | G | 448 m, 513 w, 606 vs, 999 vs, 1030 m, 1196 w, 1450 m, 1603 m, 1729 w, 2749 vw, 2876 s (sh), 2934 vs, 3060 s | |
| CYM | w | G | 297 vs, 600 s, 998 vw |
| g | G | 300 vs, 601 s | |
| CB(H) | w | G | 483 w, 546 vs, 591 m, 640 vw, 678 s, 746 m, 804 w, 830 m, 845 m (sh), 953 m, 1008 vw, 1038 w, 1096 m, 1144 m, 1196 w, 1215 w, 1308 m, 1343 s, 1373 vw (sh), 1413 vw, 1431 vw, 1454 s, 1472 vw, 1485 w, 1531 vs, 1593 vw, 1610 vw, 1641 vw, 2188 vw, 2211 vw, 2279 vw, 2677 vw, 2797 vw, 2873 w, 2984 vw, 3061 w |
| R | 419 w, 482 s, 548 vs, 593 s, 640 w, 680 vs, 719 w, 747 vs, 776 w, 806 w, 832 m, 847 w (sh), 954 s, 1008 w, 1040 w, 1097 m (sh), 1107 m, 1131 m (sh), 1142 m, 1183 w (sh), 1193 m, 1215 m, 1305 m, 1451 s, 1482 w, 1494 w, 1529 vs, 1611 w, 1813 w, 1891 w, 1933 w, 2021 w, 2091 w, 2211 w, 2278 s, 2675 m, 2877 s, 2984 m, 3062 s | ||
| g | G | 543 vs, 588 m (sh), 675 s, 741 m, 826 m, 841 m (sh), 948 m, 1004 vw, 1033 w, 1090 m, 1139 m, 1191 w, 1303 m, 1339 s, 1409 vw, 1426 vw, 1450 s, 1468 vw, 1481 w, 1527 vs, 1590 vw, 1608 vw, 2277 vw, 2675 vw, 2797 vw, 2872 w, 2981 vw, 3057 w | |
| R | 418 w, 481 s, 547 vs, 594 s, 639 w, 679 vs, 718 w, 746 vs, 775 w, 807 vw, 831 m, 846 w (sh), 954 s, 1008 w, 1037 w, 1095 m (sh), 1106 m, 1129 m (sh), 1140 m, 1180 w (sh), 1194 m (sh), 1214 m, 1304 m, 1320 w (sh), 1341 s, 1413 m, 1429 w, 1450 s, 1494 vw, 1529 vs, 1610 w, 1815 w, 1934 w, 2019 m, 2091 m, 2211 m, 2278 s, 2676 m, 2876 s, 2985 w, 3062 s | ||
| PBL | w | G | 443 s, 593 s, 678 s, 718 vw, 745 m, 779 vw, 830 m, 846 m (sh), 869 vw, 952 m, 977 vw, 1007 m, 1037 m, 1081 w, 1107 w, 1143 s, 1195 m, 1215 m (sh), 1282 w (sh), 1307 m (sh), 1342 s, 1389 w, 1412 w, 1430 w, 1452 s, 1471 w (sh), 1484 m (sh), 1508 w (sh), 1530 vs, 1592 w, 1608 w, 1704 vw, 1787 vw, 1891 vw, 2024 vw, 2091 vw, 2126 vw, 2184 vw, 2211 vw, 2278 vw, 2386 vw, 2427 vw, 2487 vw, 2598 vw, 2676 vw, 2794 vw, 2872 w, 2938 w (sh), 2981 vw (sh), 3058 w |
| R | 421 w, 445 w (sh) br, 483 m, 491 vw (sh), 510 vw, 547 vw, 594 m, 642 w, 681 vs, 707 vw (sh), 741 vw (sh), 747 vs, 777 m, 818 w, 832 w, 850 w, 955 m, 981 m, 1008 vw, 1040 vw, 1085 m, 1110 vw, 1134 w (sh), 1145 m, 1215 vs, 1283 m, 1294 w, 1306 w, 1342 s, 1362 vw, 1452 s, 1531 vs, 1540 vs (sh), 1611 w, 1815 w, 2033 w, 2095 w, 2213 w, 2280 m, 2679 m, 2877 m, 2895 w, 3062 m | ||
| g | G | 440 s, 588 s, 603 s (sh), 675 s, 714 w, 741 m, 773 w, 826 m, 842 m (sh), 949 m, 974 vw, 1004 m, 1033 m, 1079 w, 1105 w, 1128 w (sh), 1140 s, 1191 m, 1213 m, 1280 vw (sh), 1304 w, 1340 s, 1387 vw, 1410 vw, 1426 vw, 1450 s, 1468 w, 1482 w, 1505 w, 1527 vs, 1592 w, 1609 w (sh), 2123 vw, 2211 vw, 2277 vw, 2489 vw, 2596 vw, 2676 w, 2794 vw, 2873 w, 2981 vw, 3057 w | |
| R | 419 vw, 482 m, 510 vw, 546 vw, 594 m, 641 w, 680 vs, 707 vw (sh), 747 vs, 776 m, 818 vw, 832 w, 848 vw, 955 m, 980 m, 1009 vw, 1038 vw, 1083 w, 1109 vw, 1130 w (sh), 1142 m, 1213 vs, 1341 s, 1451 s, 1529 vs, 1538 vs (sh), 1611 vw, 1815 vw, 2020 w, 2091 vw, 2211 vw, 2278 m, 2677 w, 2878 m, 2984 w, 3063 m | ||
| VB | w | R | 693 m, 1002 m, 1317 m, 1599 m |
| g | R | 462 m, 696 m, 1004 m, 1317 m, 1598 m | |
| PGL | w | G | 506 m, 613 w, 639 vw, 681 vs, 737 vw, 771 w, 815 m, 975 m, 998 m, 1027 vw, 1081 s, 1134 vw, 1187 m (sh), 1197 s, 1209 m (sh), 1281 vs, 1338 s (sh), 1387 s, 1444 m, 1481 s (sh), 1505 vs (sh), 1538 vs, 1560 m (sh), 1605 w, 1969 vw, 2188 vw, 2220 w, 2370 vw, 2423 vw, 2590 vw, 2651 vw, 2821 w, 2871 w, 2943 w, 3041 w (sh), 3069 w |
| R | 507 w, 545 vw, 594 vw, 641 m, 683 vs, 706 m (sh), 739 s, 775 s, 816 m, 958 w (sh), 979 s, 1083 s, 1214 vs, 1282 s, 1292 s (sh), 1317 vw, 1338 s, 1360 vw, 1389 m, 1395 w (sh), 1445 s, 1481 vw, 1506 m (sh), 1538 vs, 1899 vw, 2225 vw, 2270 vw, 2314 vw, 2428 vw, 2831 vw, 2879 vw, 3079 vw | ||
| g | G | 504 m, 681 vs, 772 w, 814 m, 978 m, 997 w (sh), 1034 vw, 1083 s, 1197 m, 1281 vs, 1338 s, 1388 s, 1445 m, 1482 m (sh), 1505 vs, 1539 vs, 1562 m (sh), 3076 w | |
| R | 508 w, 545 w, 595 vw, 641 m, 684 vs, 706 m (sh), 739 s, 776 s, 817 m, 959 w (sh), 980 s, 1082 s, 1212 vs, 1280 s, 1291 s (sh), 1316 vw, 1337 s, 1360 vw, 1388 m, 1394 w (sh), 1445 s, 1481 vw, 1505 m (sh), 1538 vs, 1899 vw, 2224 vw, 2280 vw, 2315 vw, 2428 vw, 2831 vw, 2880 vw, 3079 vw |
Disclaimer/Publisher’s Note: The statements, opinions and data contained in all publications are solely those of the individual author(s) and contributor(s) and not of MDPI and/or the editor(s). MDPI and/or the editor(s) disclaim responsibility for any injury to people or property resulting from any ideas, methods, instructions or products referred to in the content. |
© 2025 by the authors. Licensee MDPI, Basel, Switzerland. This article is an open access article distributed under the terms and conditions of the Creative Commons Attribution (CC BY) license (https://creativecommons.org/licenses/by/4.0/).
Share and Cite
Barba Castagnaro, I.; Nucera, A.; Castriota, M.; Barberi, R.C.; Striova, J.; Fontana, R. Spectral Raman Database of Modern Acrylic Paints at 532 nm and 633 nm Laser Excitation Wavelengths. Appl. Sci. 2025, 15, 5908. https://doi.org/10.3390/app15115908
Barba Castagnaro I, Nucera A, Castriota M, Barberi RC, Striova J, Fontana R. Spectral Raman Database of Modern Acrylic Paints at 532 nm and 633 nm Laser Excitation Wavelengths. Applied Sciences. 2025; 15(11):5908. https://doi.org/10.3390/app15115908
Chicago/Turabian StyleBarba Castagnaro, Irene, Antonello Nucera, Marco Castriota, Riccardo Cristoforo Barberi, Jana Striova, and Raffaella Fontana. 2025. "Spectral Raman Database of Modern Acrylic Paints at 532 nm and 633 nm Laser Excitation Wavelengths" Applied Sciences 15, no. 11: 5908. https://doi.org/10.3390/app15115908
APA StyleBarba Castagnaro, I., Nucera, A., Castriota, M., Barberi, R. C., Striova, J., & Fontana, R. (2025). Spectral Raman Database of Modern Acrylic Paints at 532 nm and 633 nm Laser Excitation Wavelengths. Applied Sciences, 15(11), 5908. https://doi.org/10.3390/app15115908