

Engineering-Driven Approach for the Structural Design of Geometrically Complex Modular Artificial Reefs


Abstract
1. Introduction
2. Materials and Methods
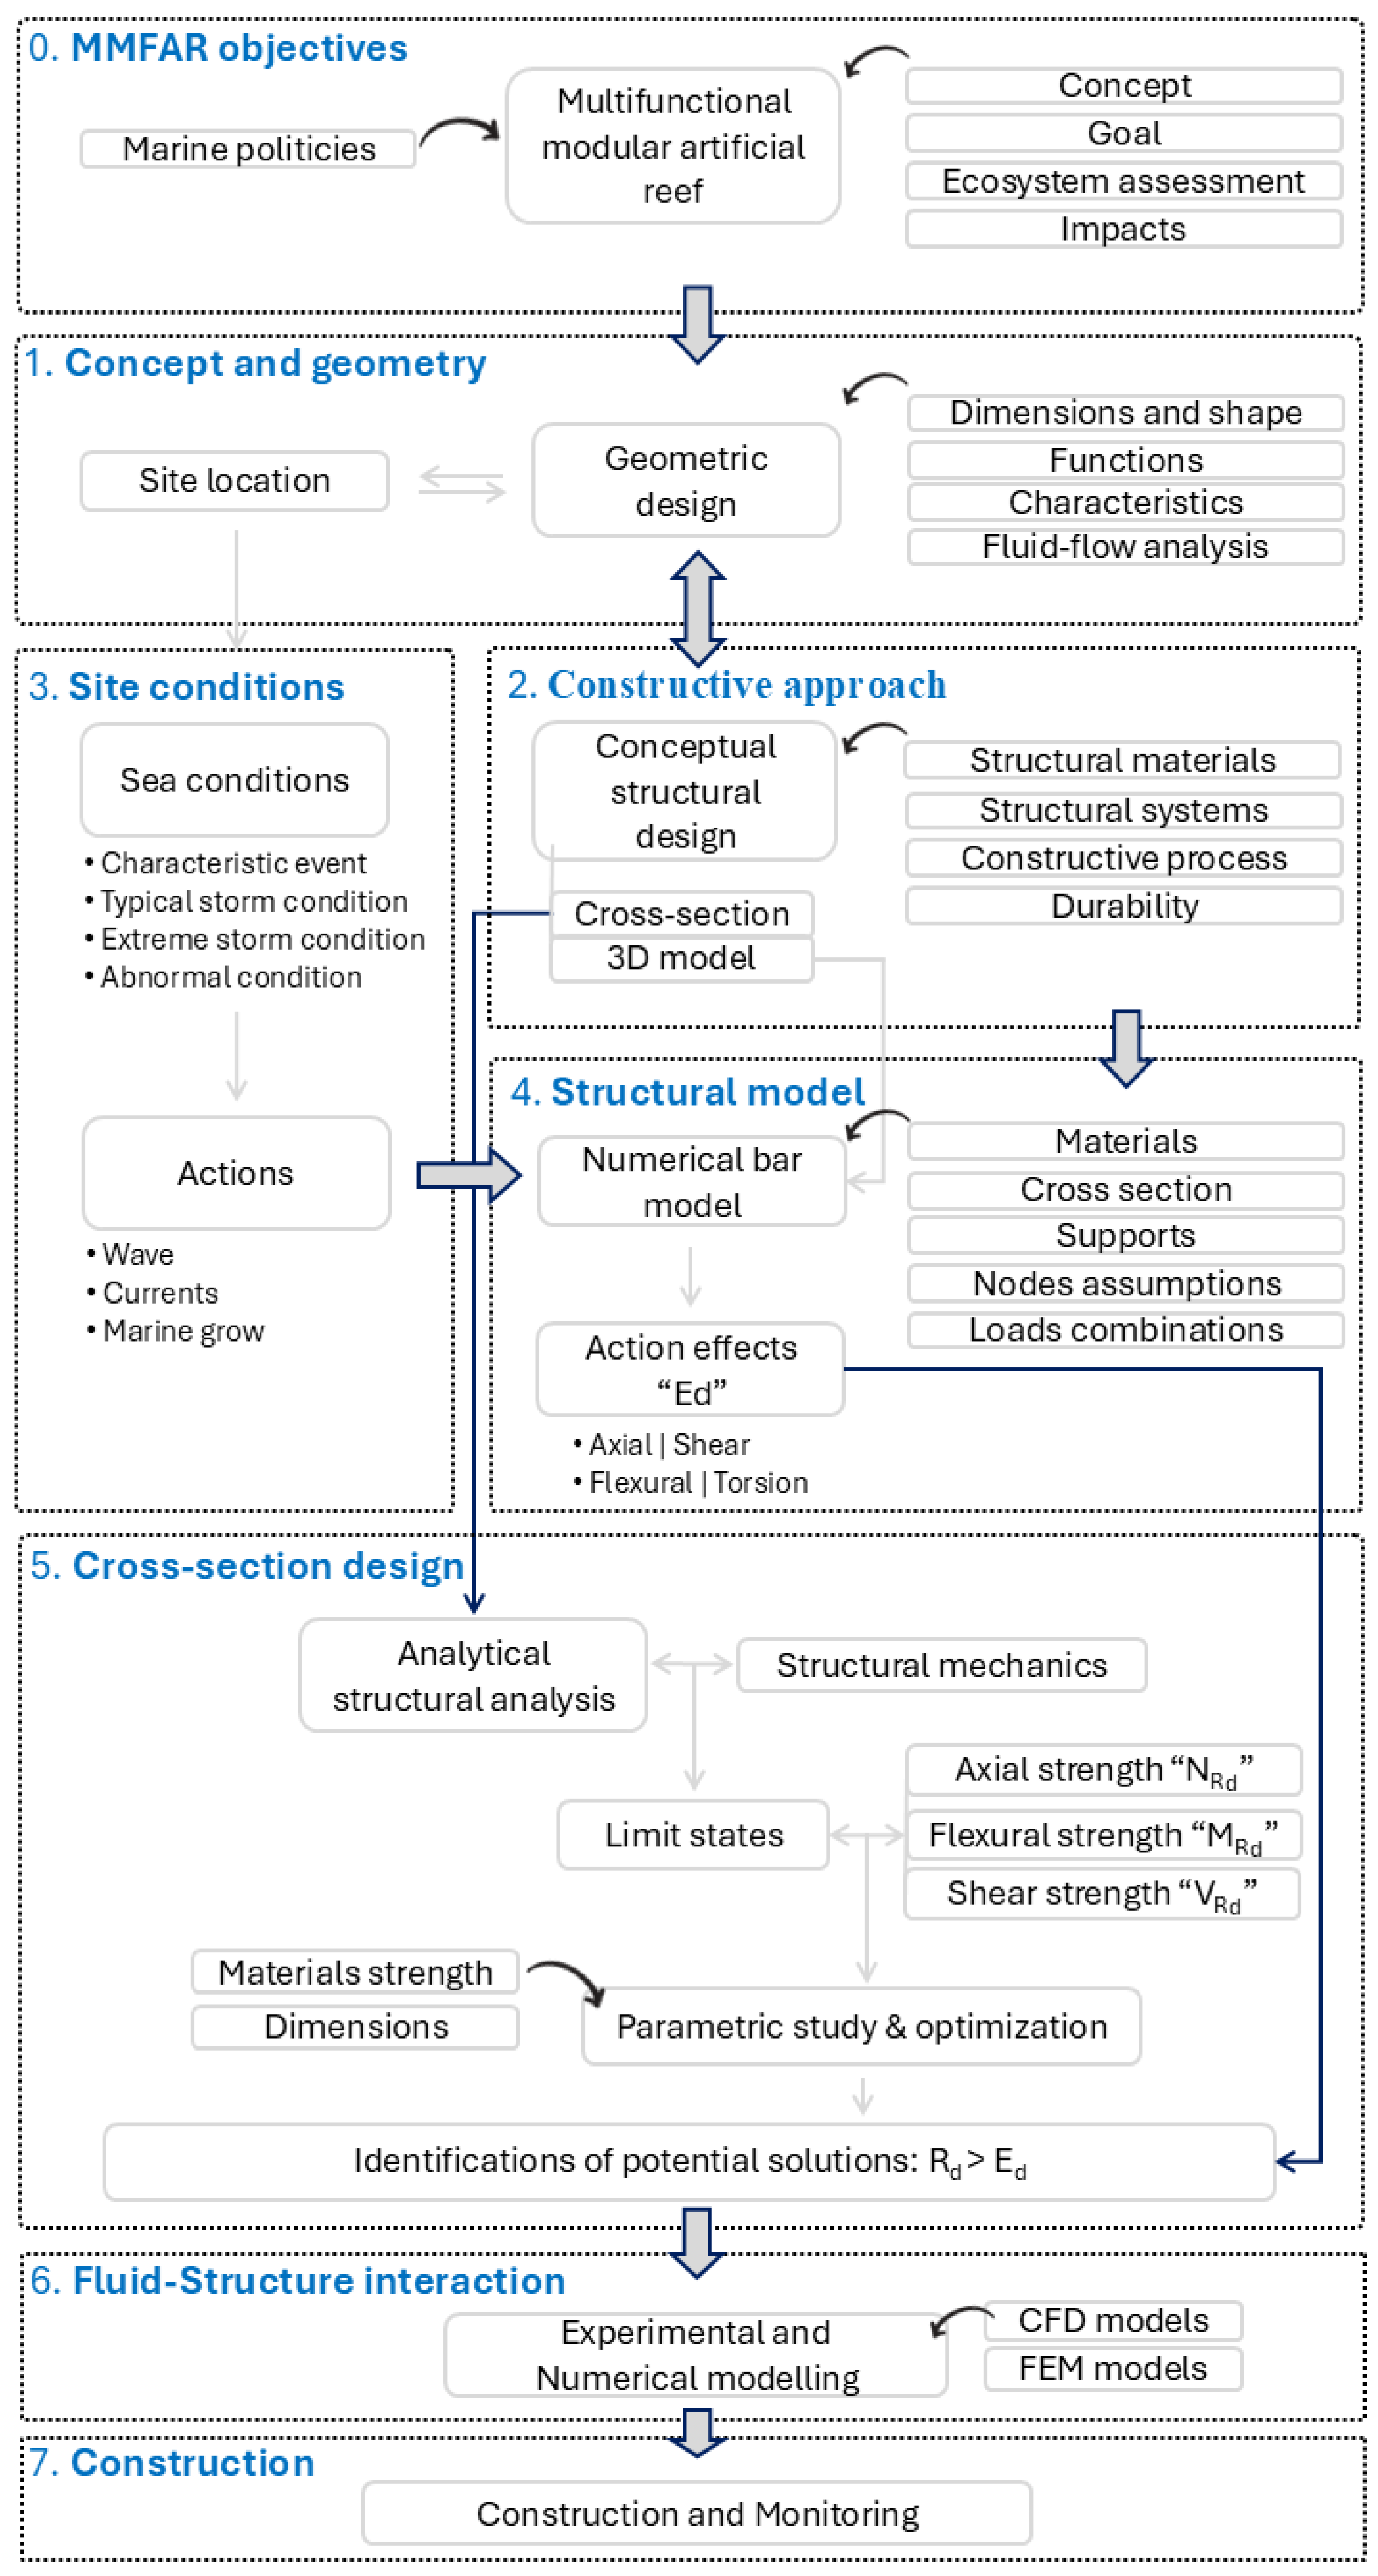
2.1. Engineering-Driven Methodology
- Concept and geometric design: in this stage, with the MMFAR objectives established, the process selects the site location and collects environmental data on physical and biological aspects. The design of shapes and dimensions is undertaken with the objective of meeting functional requirements. Stakeholders, including experts and the local community, participate actively.
- Constructive approach: the development of cross-sections and 3D models is initiated. It considers materials, structural systems, constructive processes, and durability specifications. These aspects must prevent marine pollution and establish a support that meets technical and functional requirements. Logistics and construction techniques are also considered.
- Site location and sea conditions: the analysis of the site location results in the identification of specific actions affecting the structure, such as dead, live, environmental, and accidental. Environmental actions are among the most important. The actions and load combinations follow the recommendations from ISO, API, DNV, and NORSOK [2,3,4,5]. Historical site data and prediction models are used to account for time and space variability.
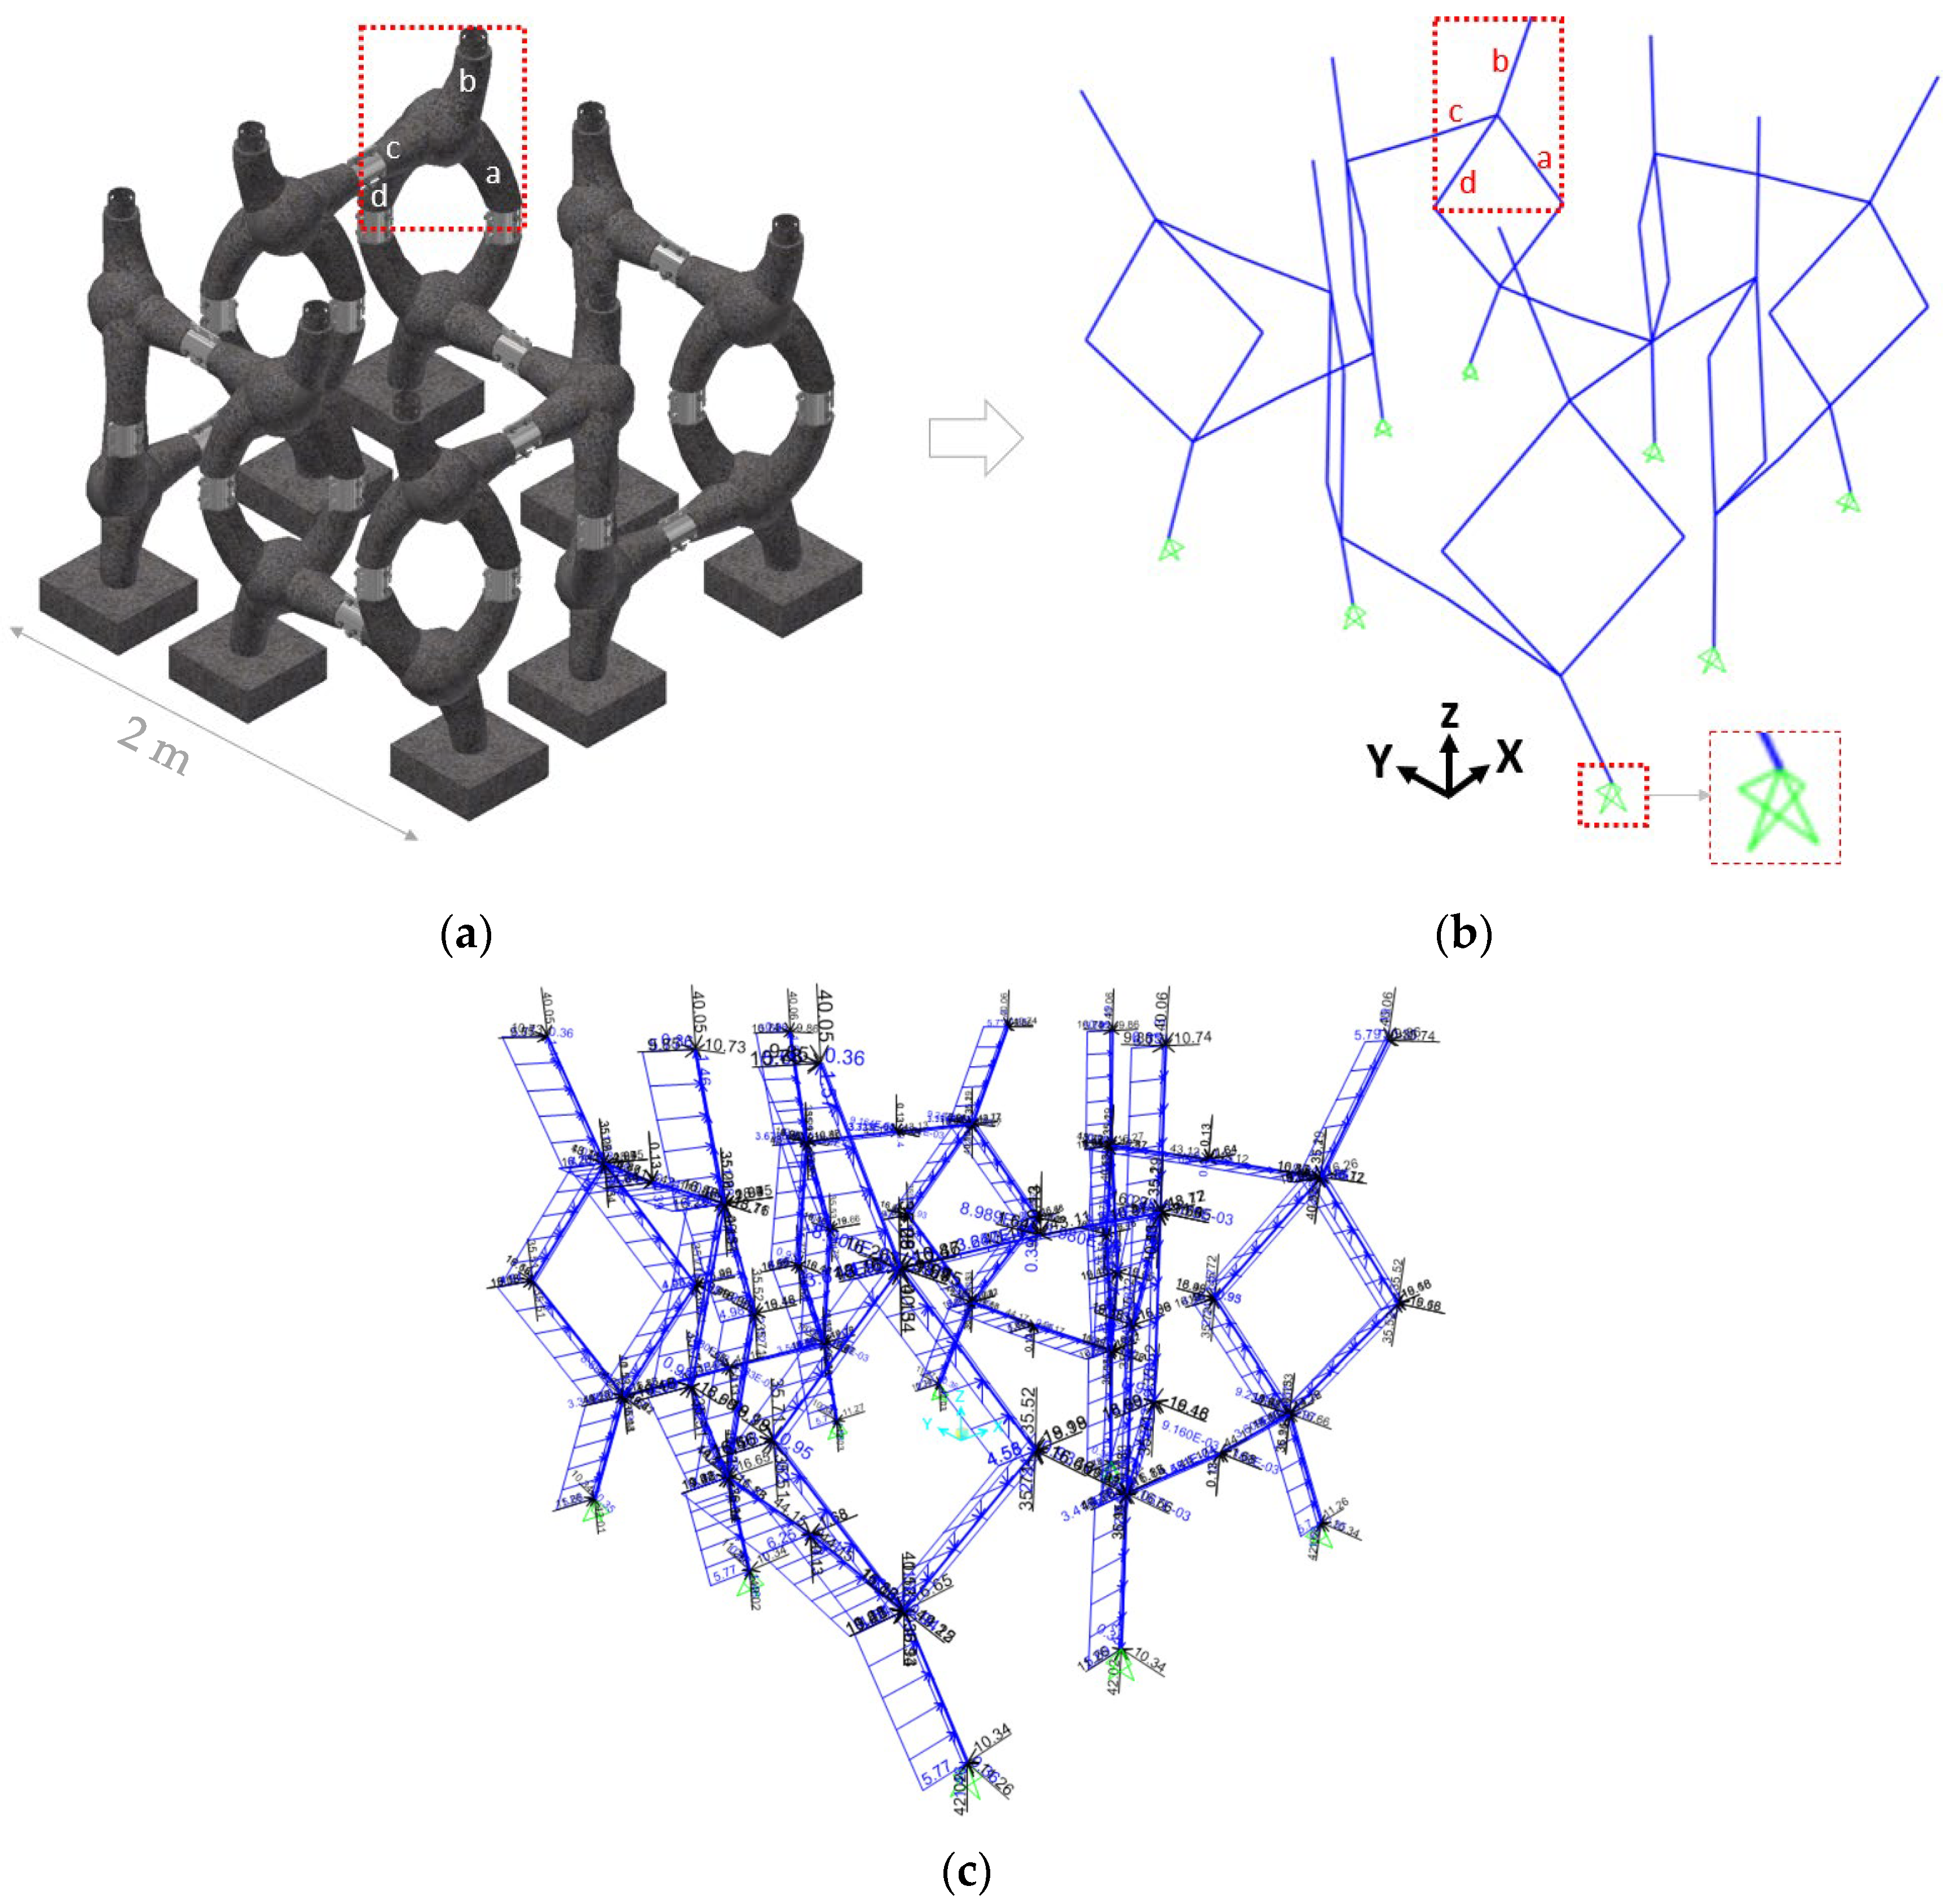
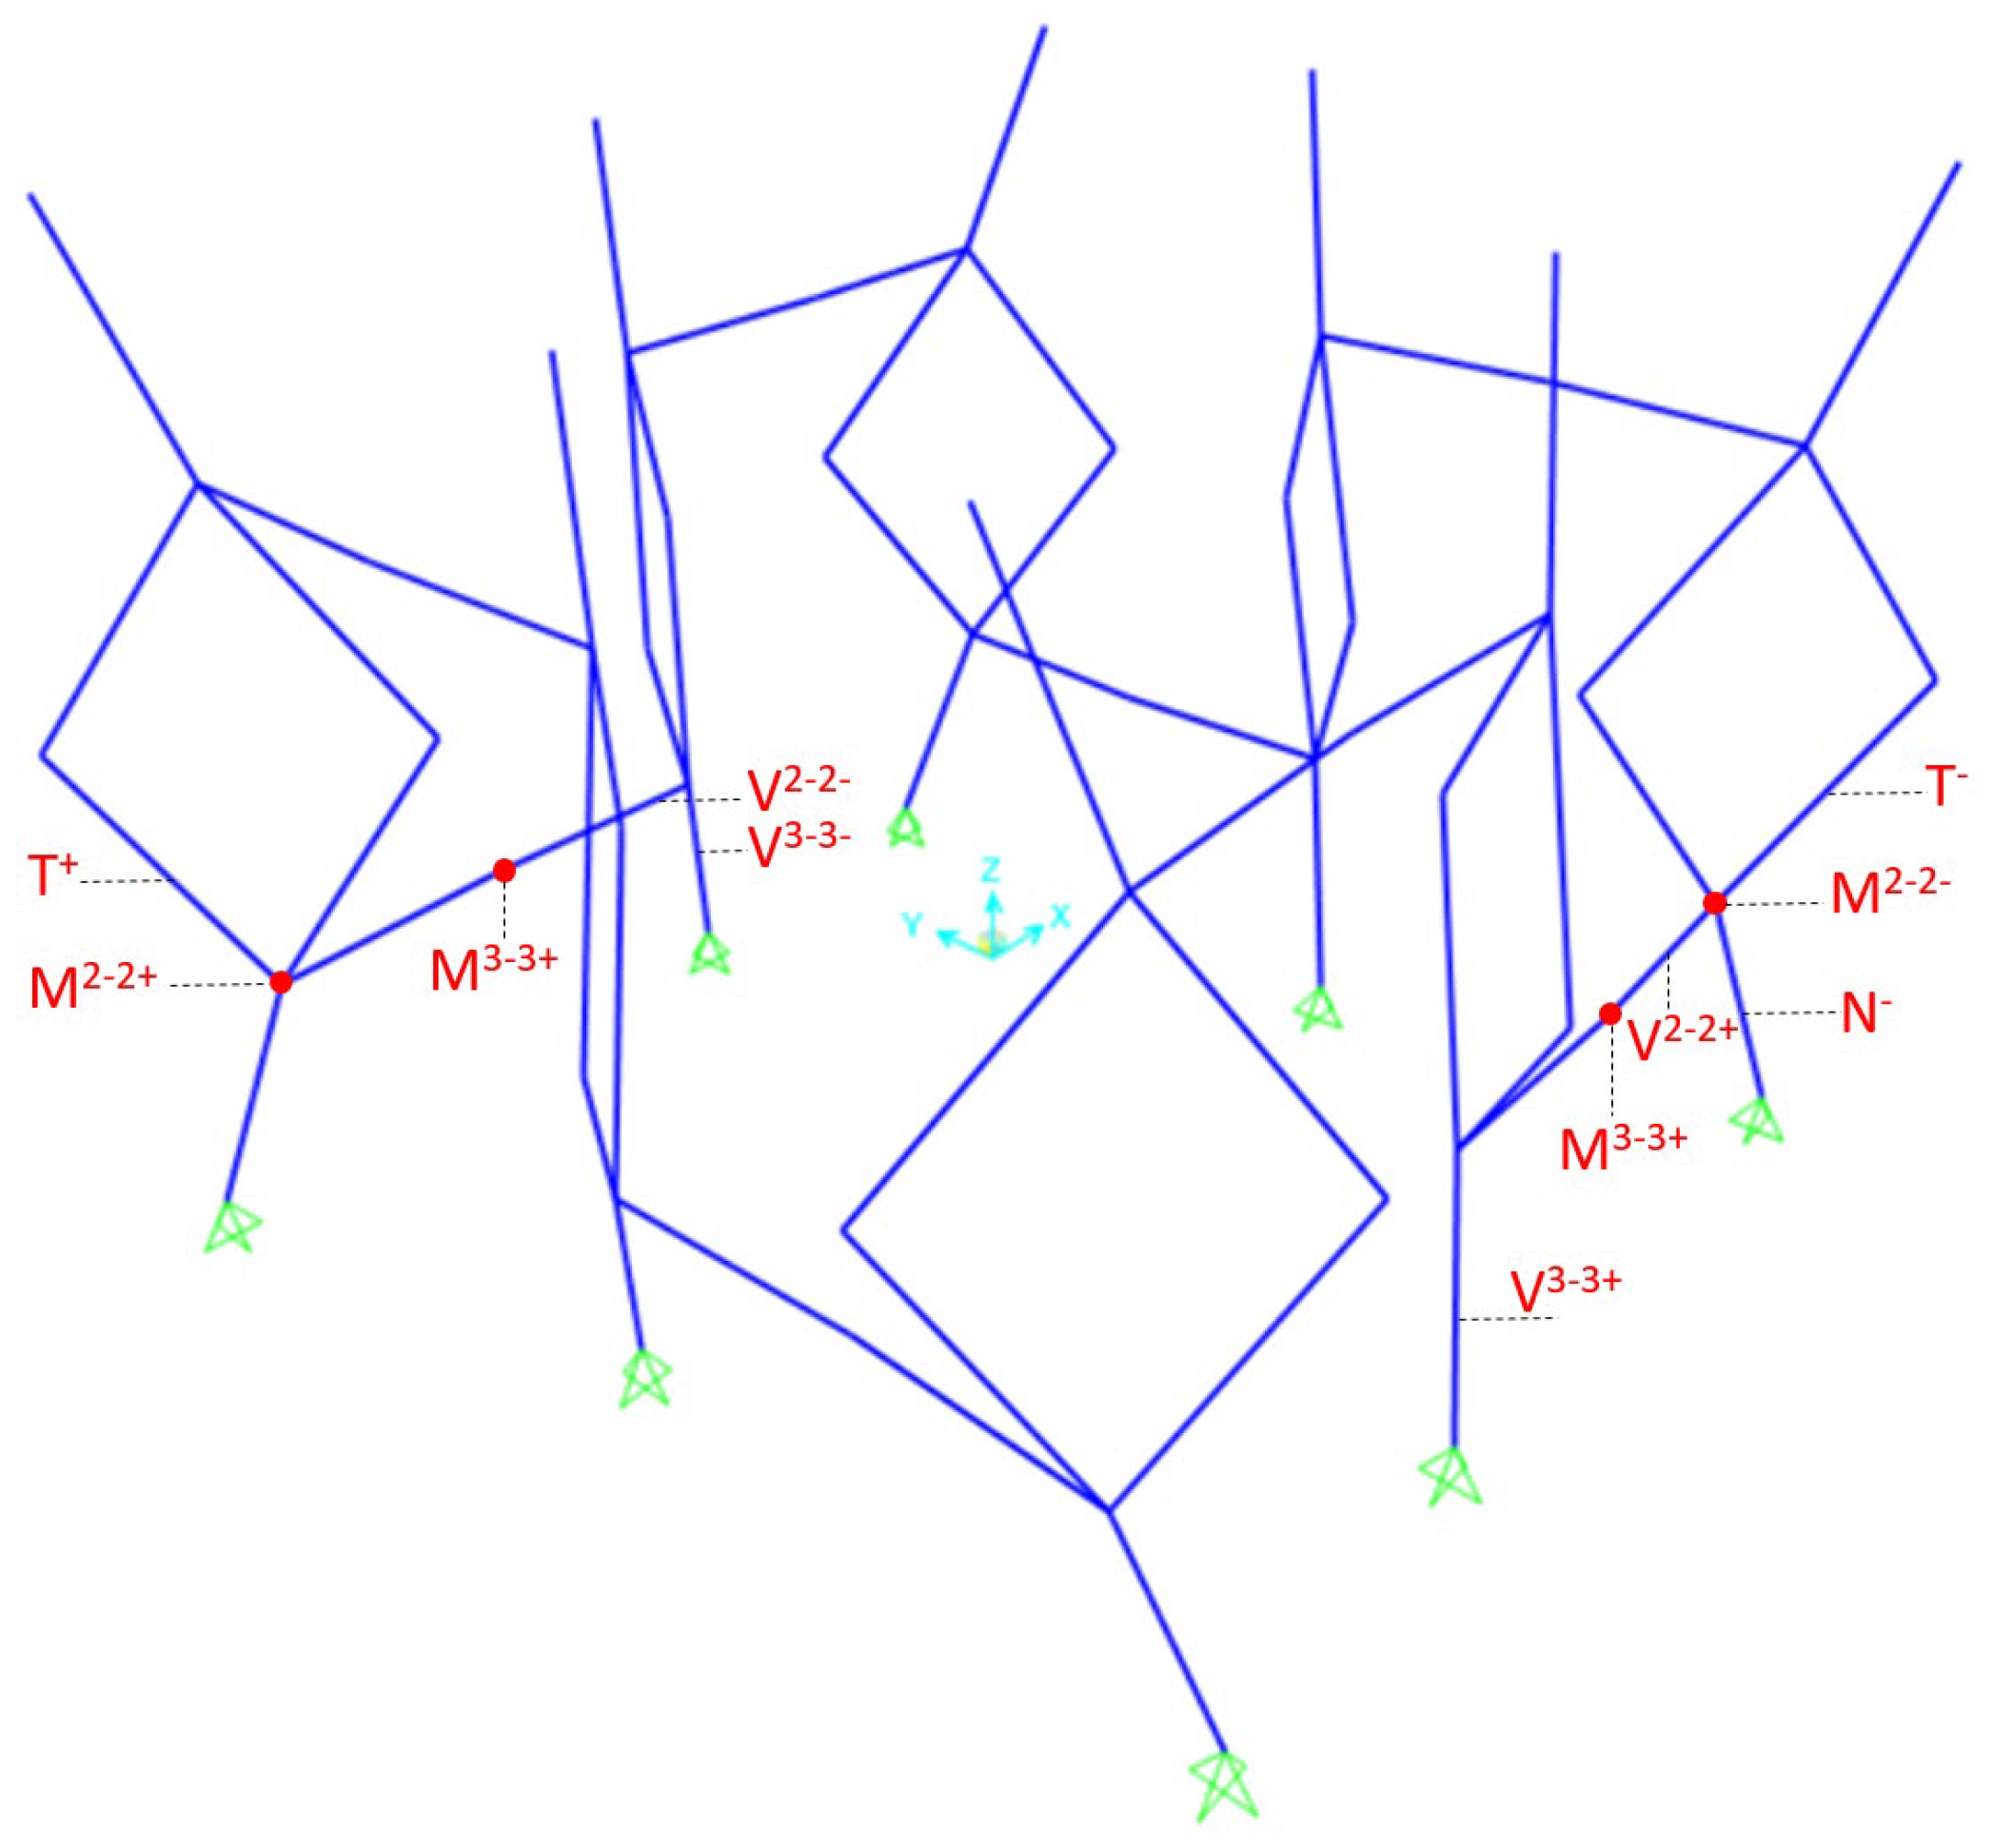
- Structural model: the effects of the loads are obtained from a simplified numerical simulation. For that, the numerical model is discretized in bar elements, and a linear-elastic quasi-static analysis is performed. The materials, section properties, and supports are defined, along with load cases and combinations. The results are the axial (N), shear (V), flexural (M), and torsional (T) stresses for safety verifications.
- Cross-section design: determines the load capacity based on material strength and cross-section dimensions, checking limit states to assess performance and feasibility. A parametric study explores various structural combinations in order to identify the promising solutions. This approach optimizes the cross-section, eliminates less promising options, and encourages new structural systems.
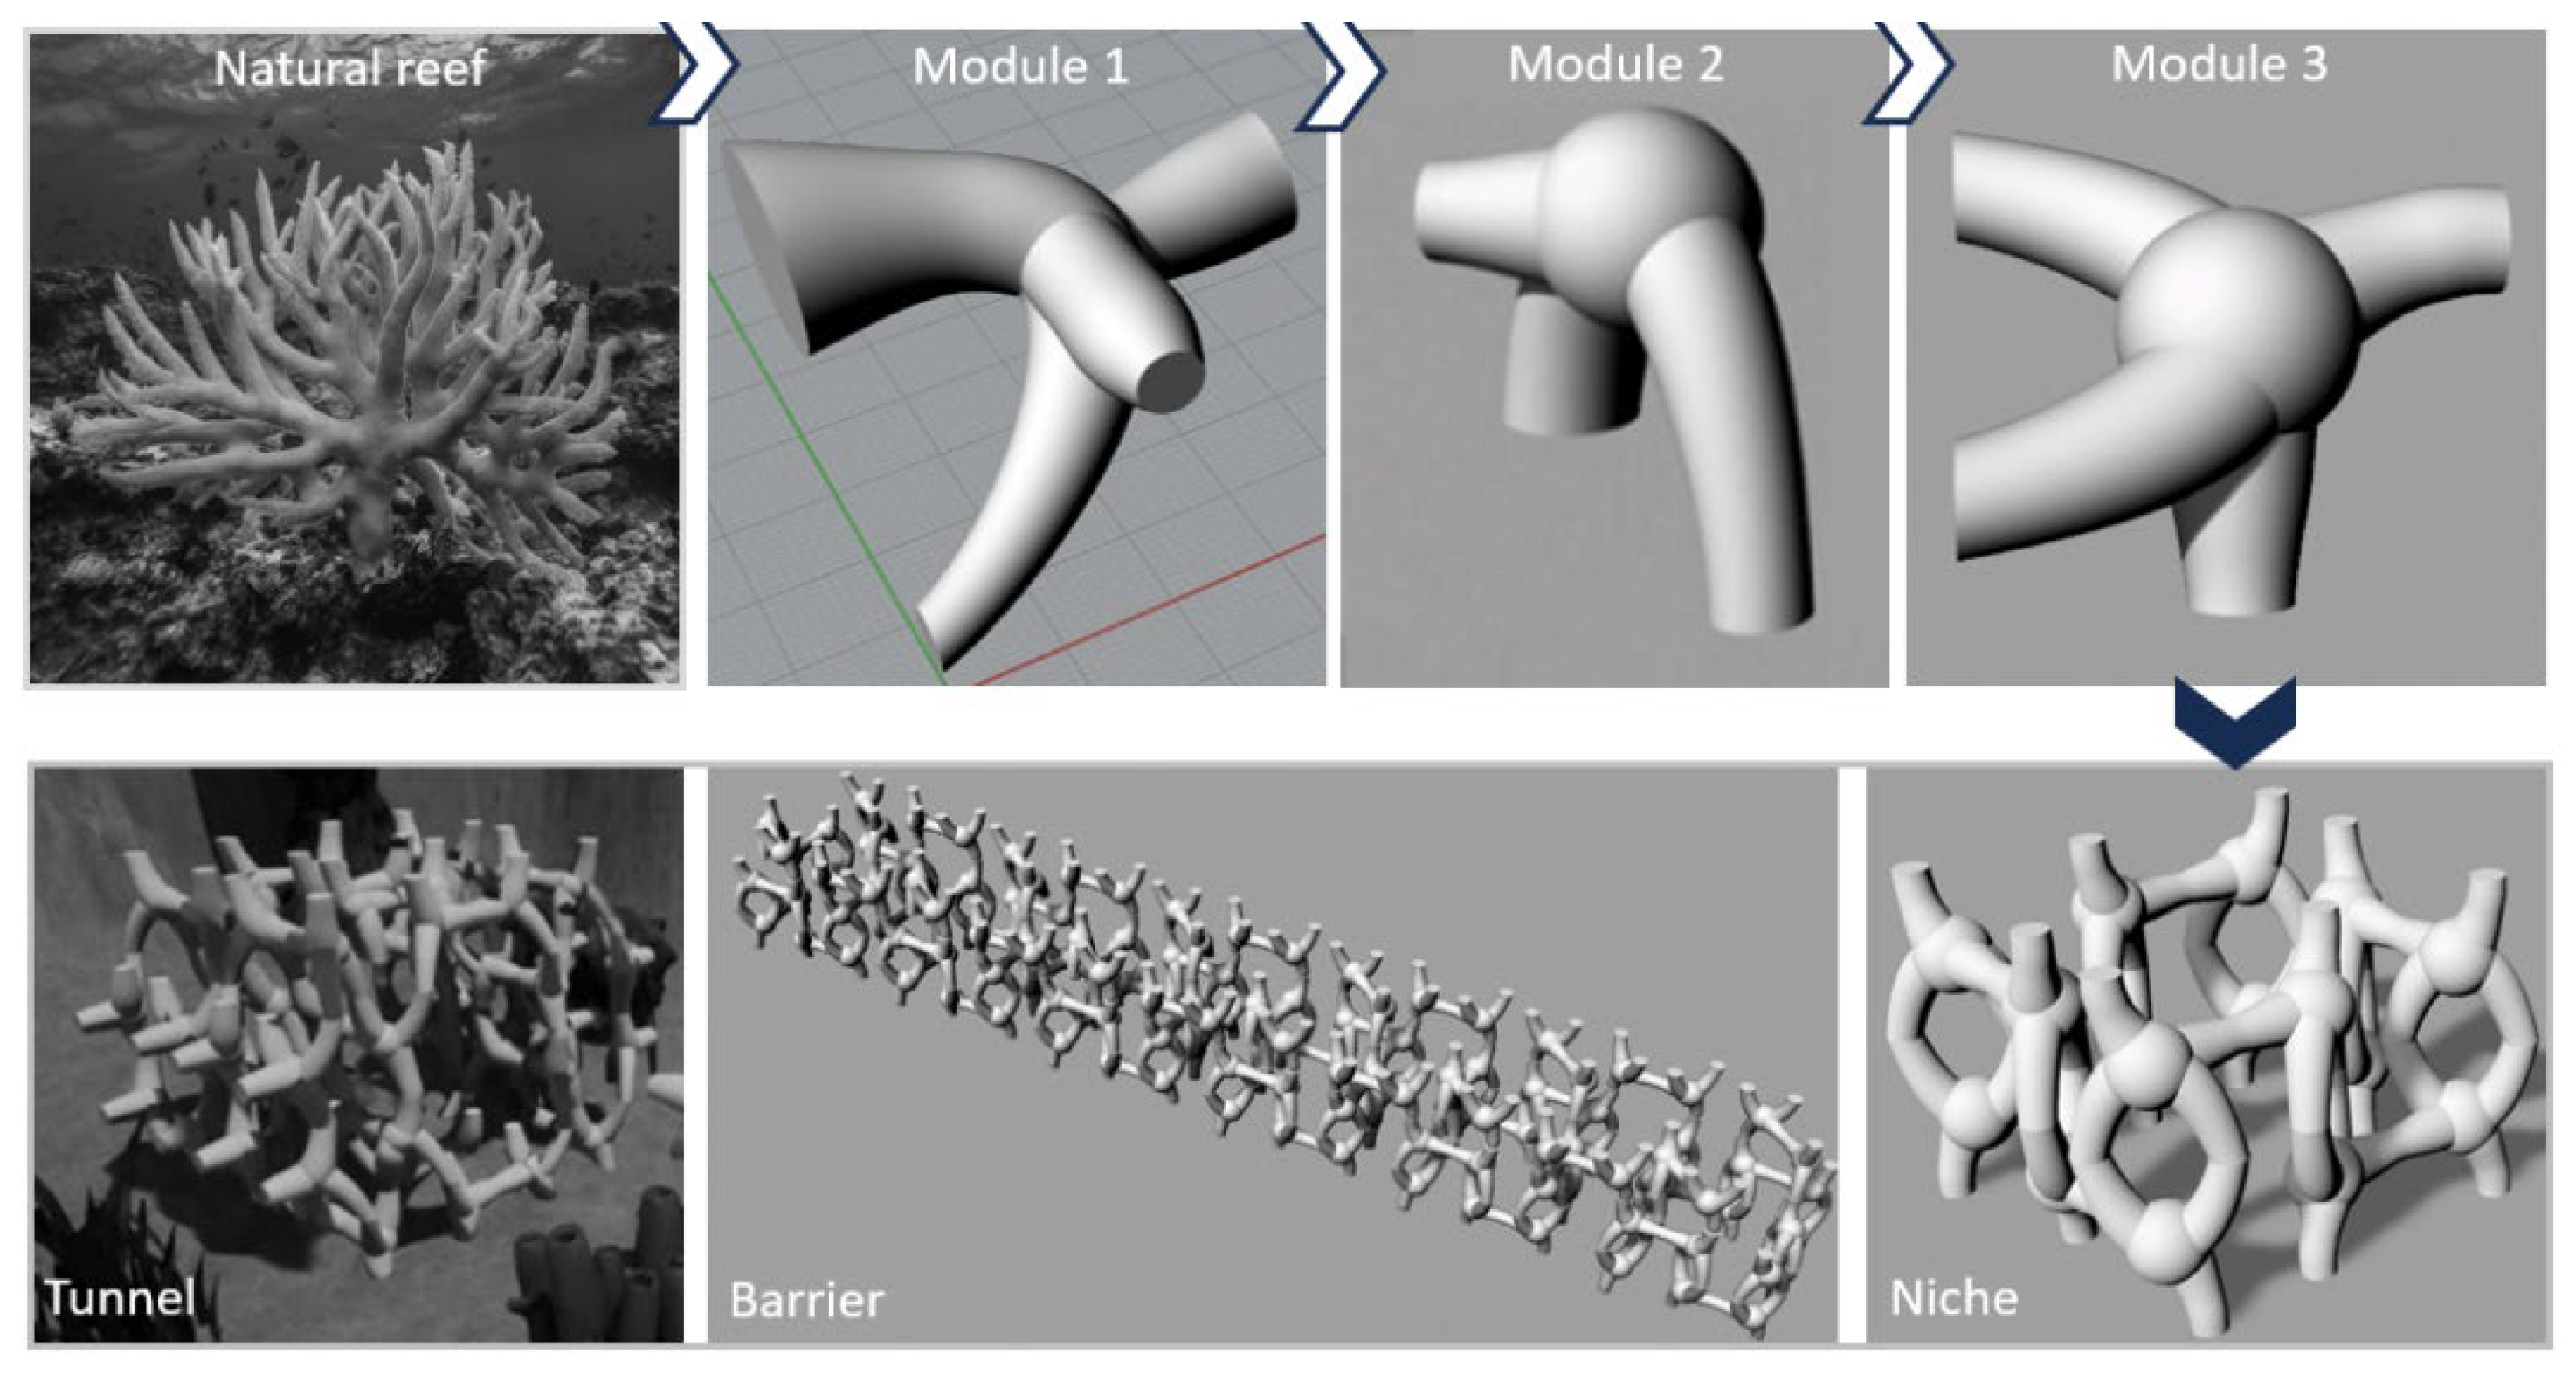
2.2. Concept and Geometric Design
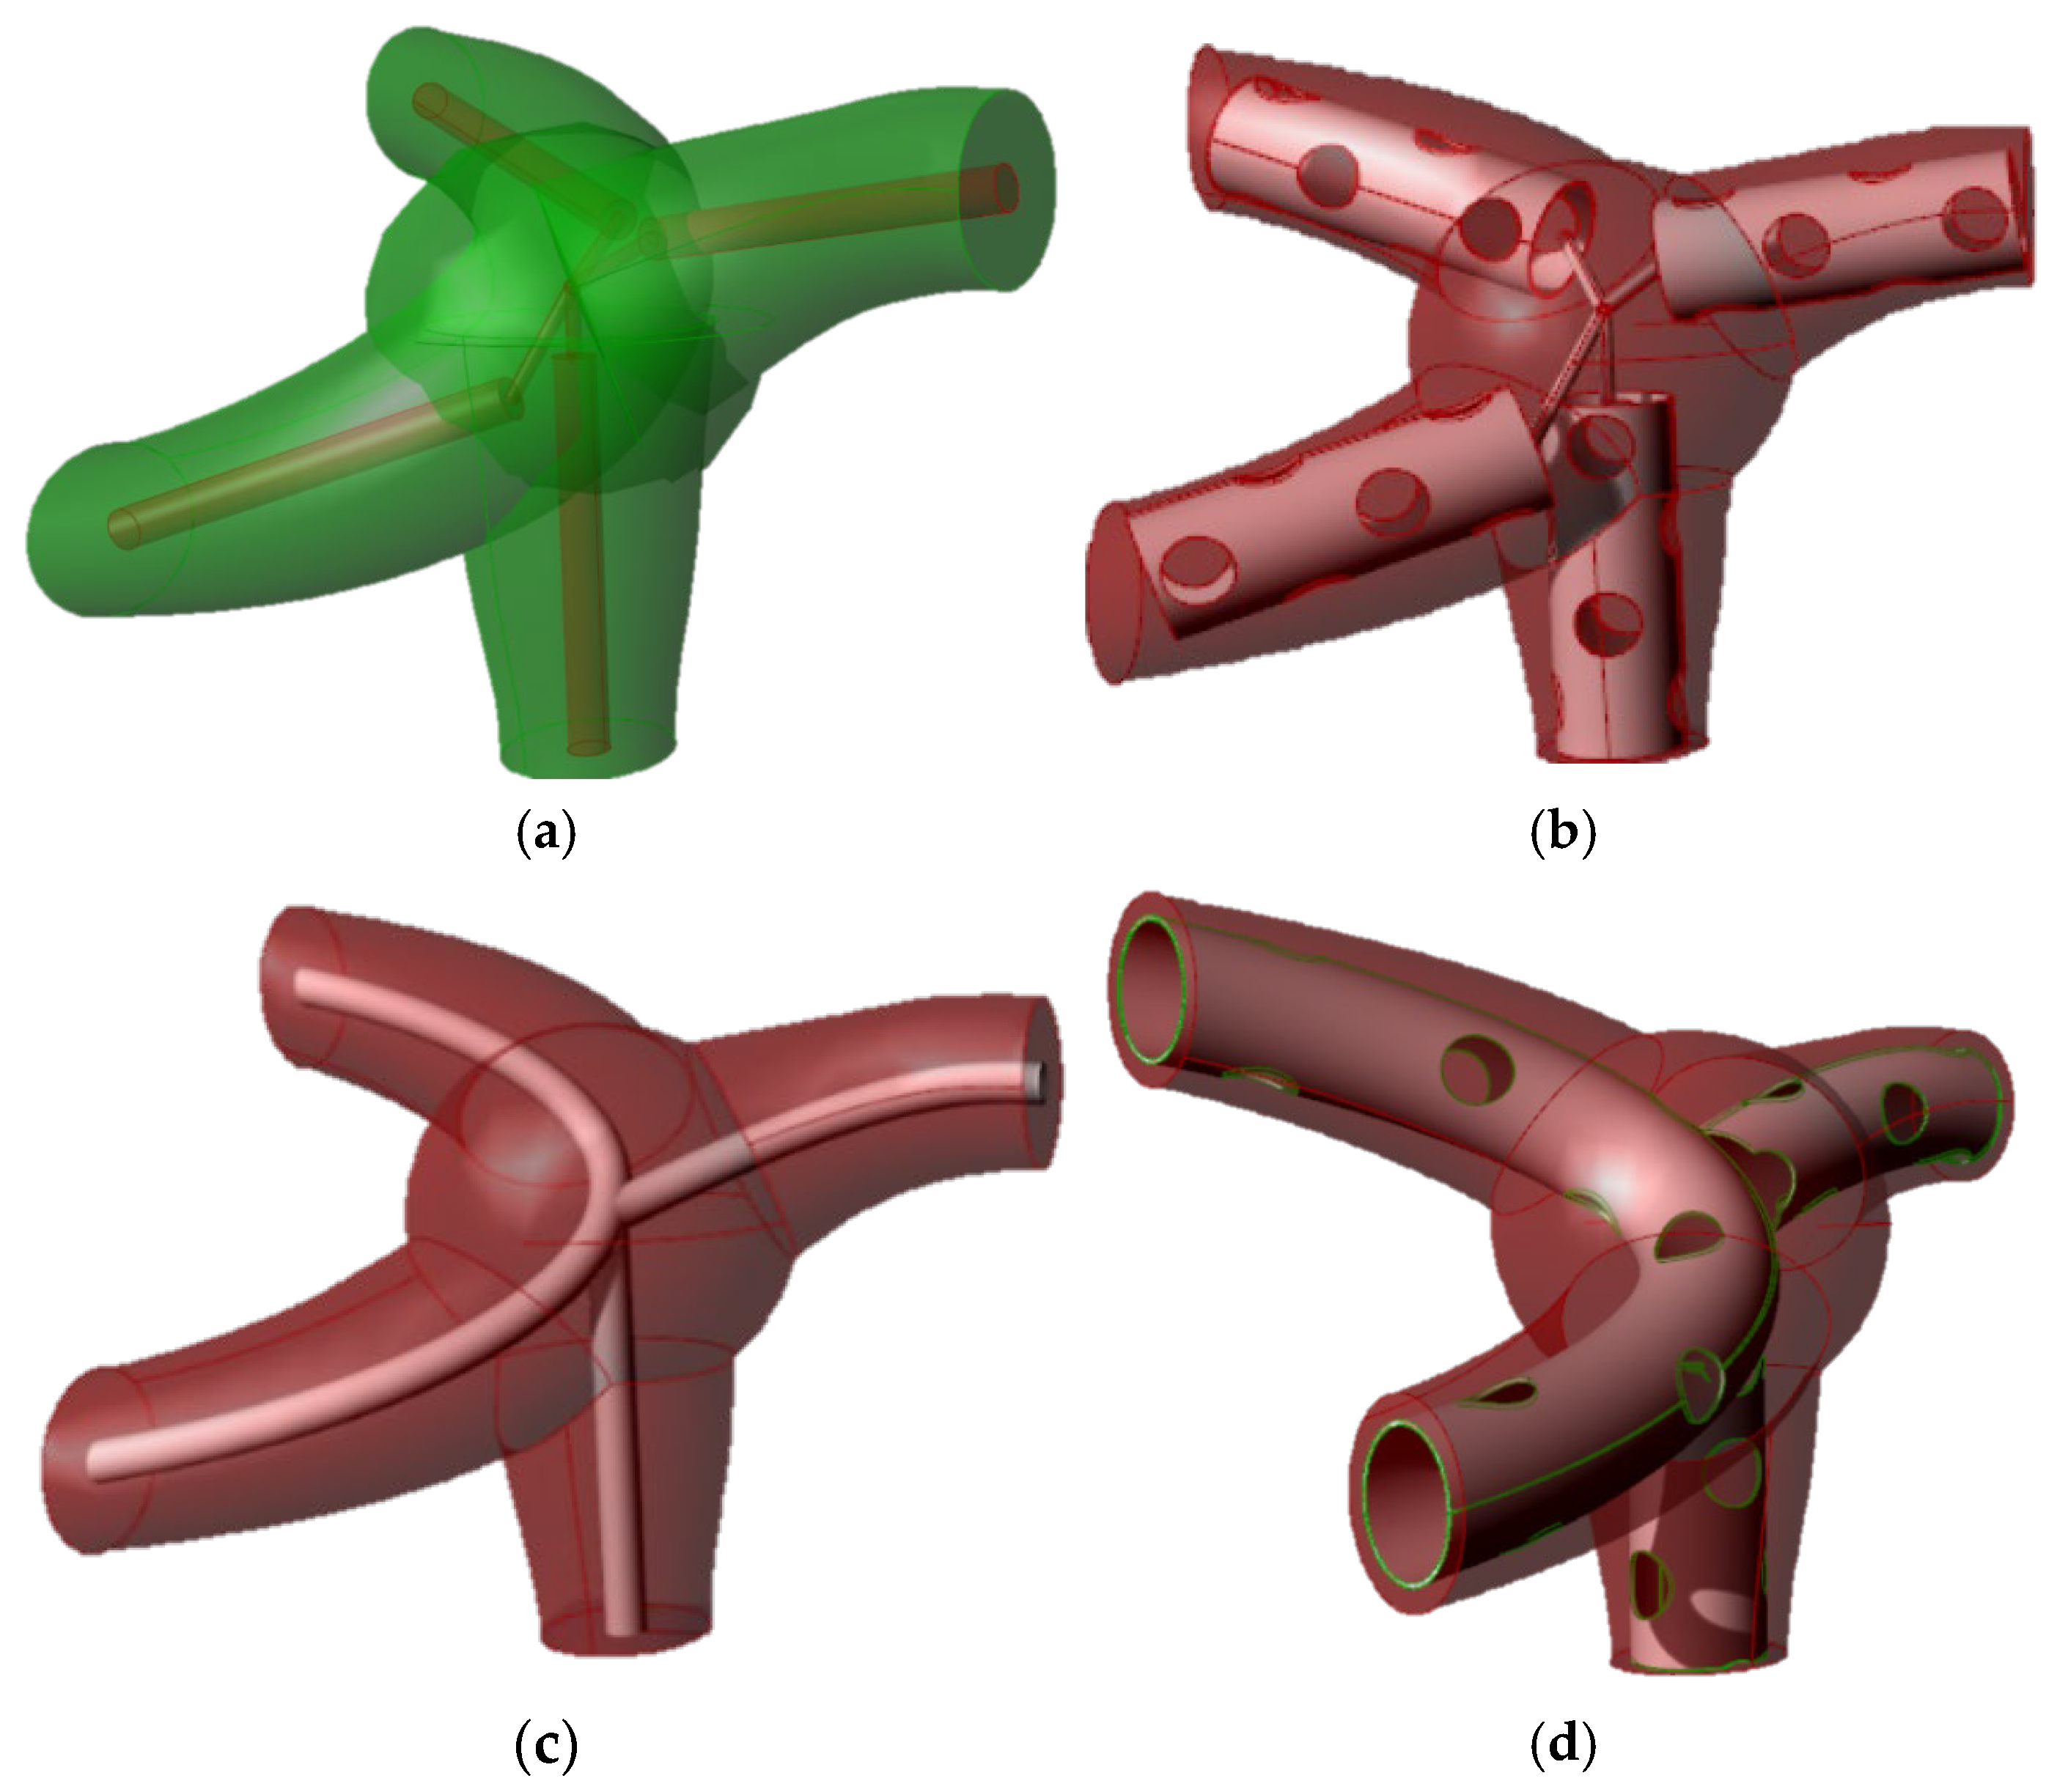
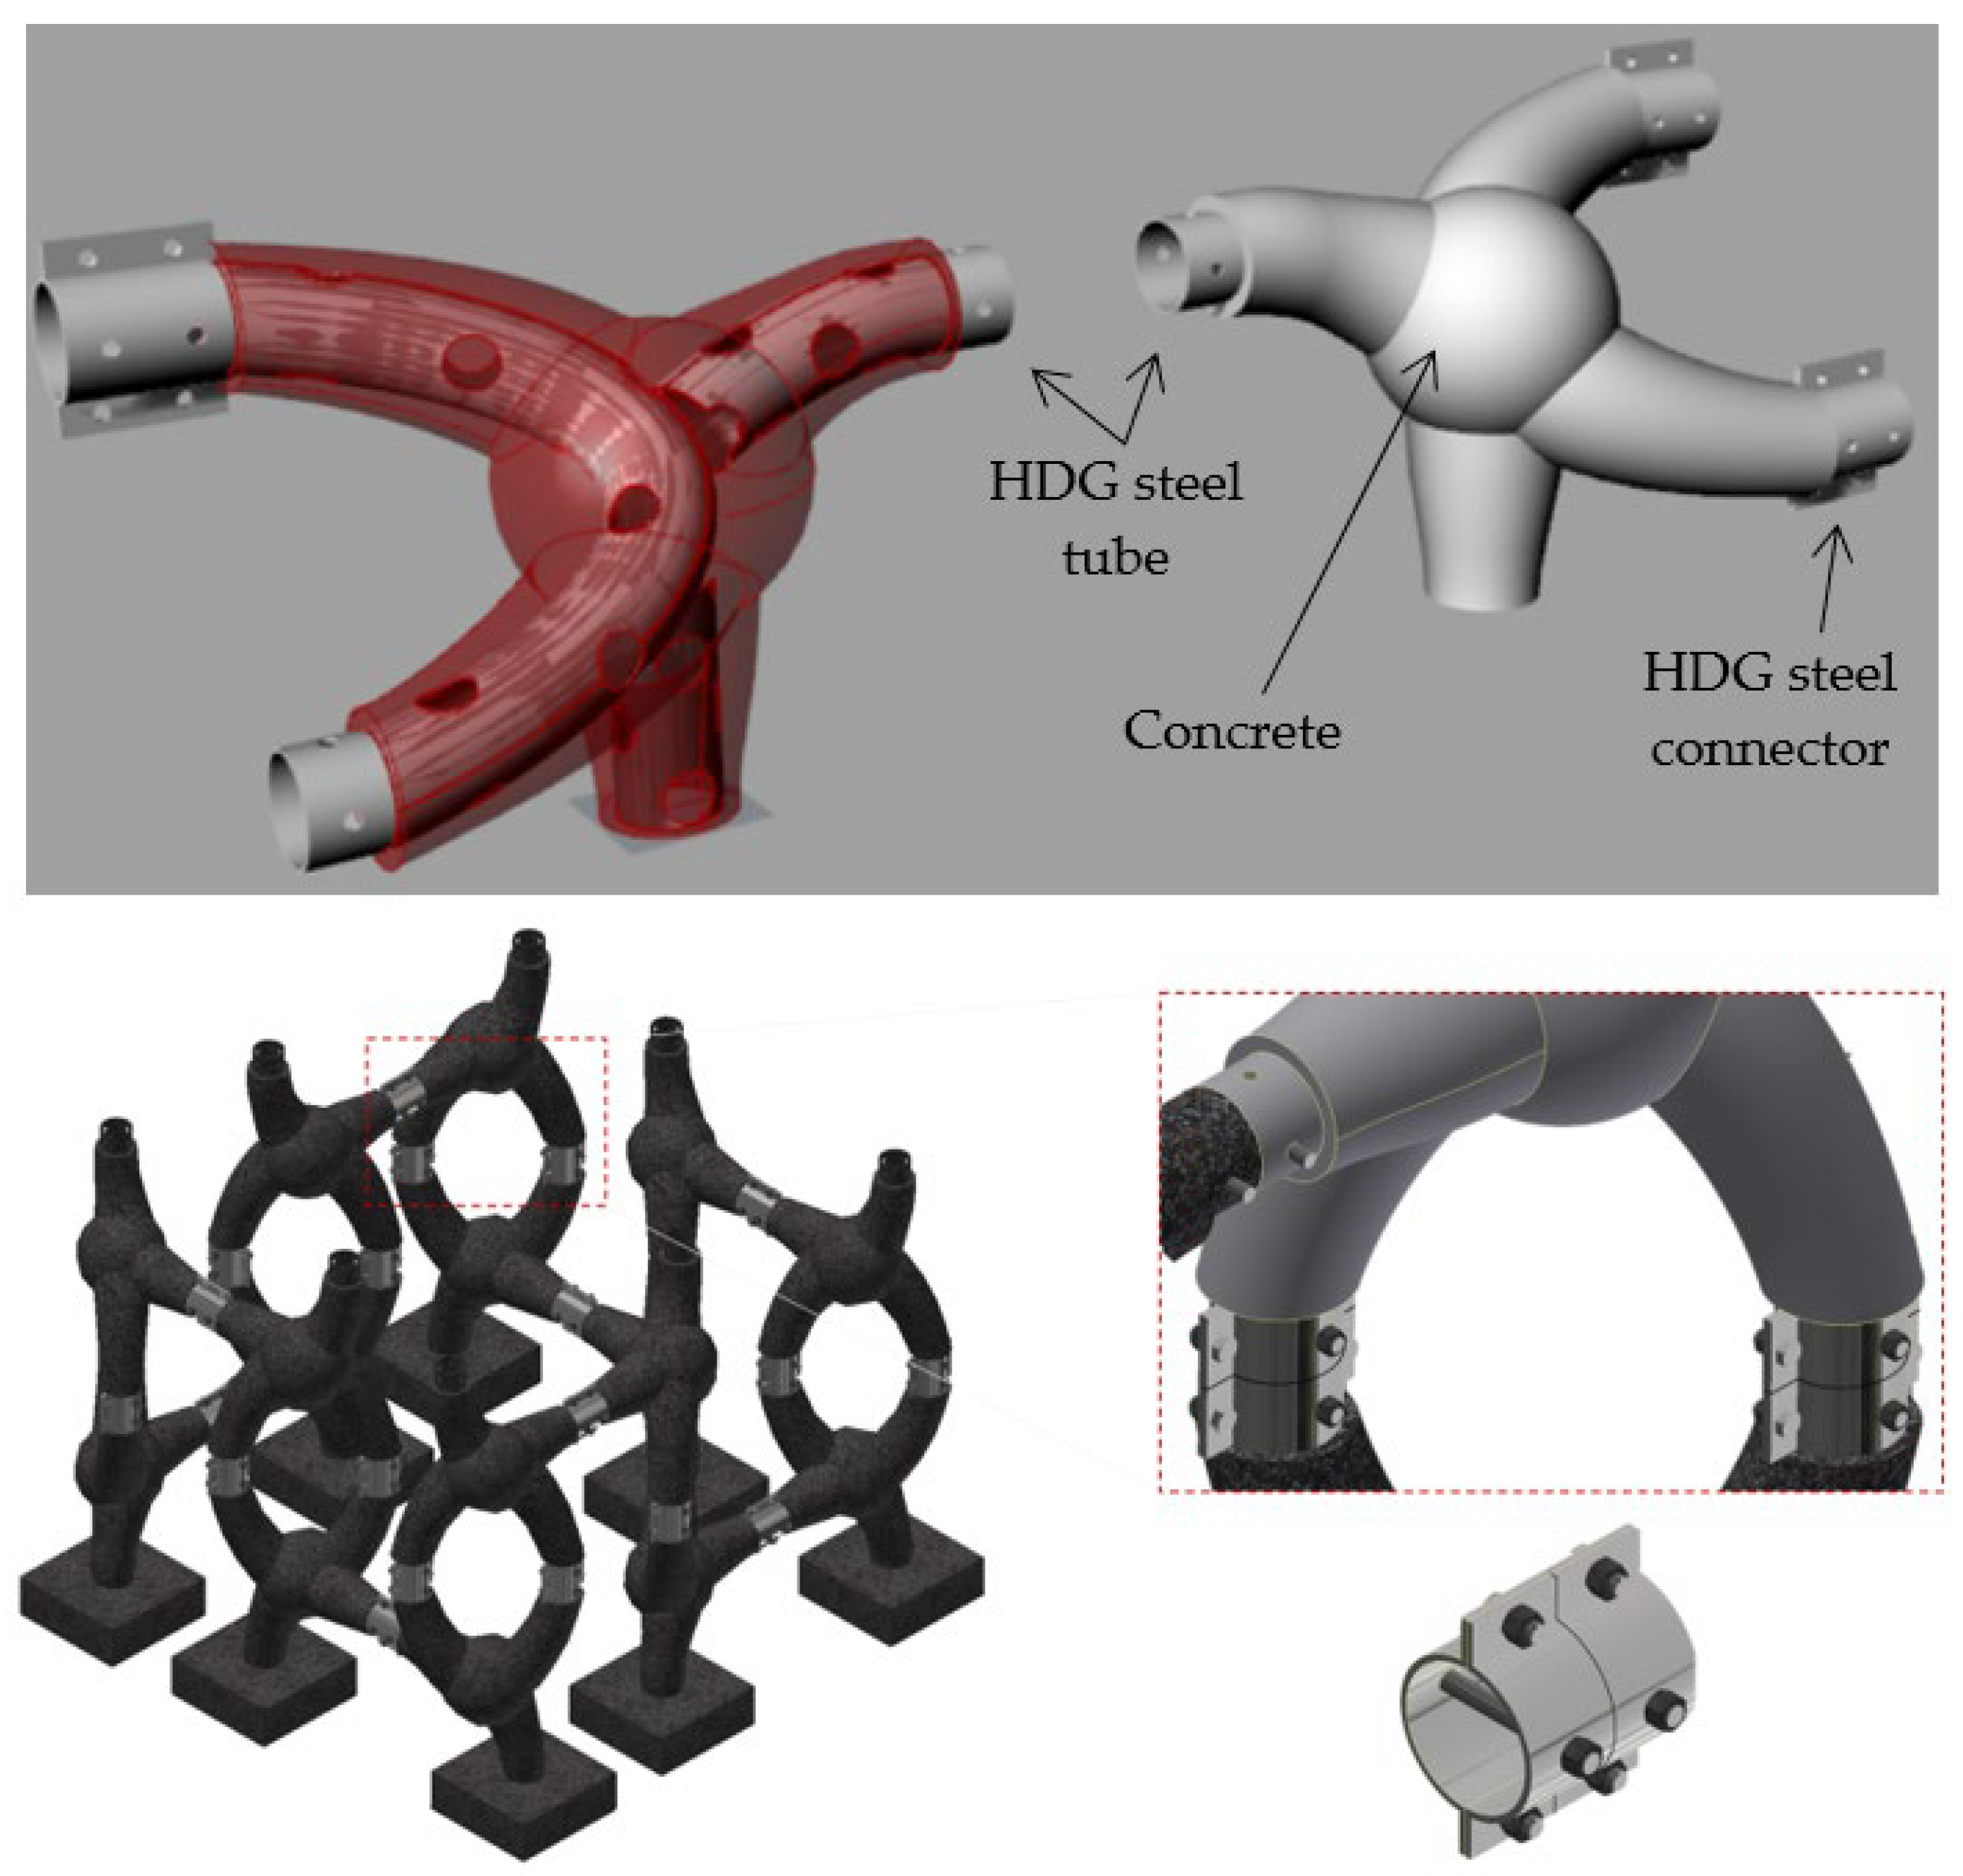
2.3. Constructive Approach
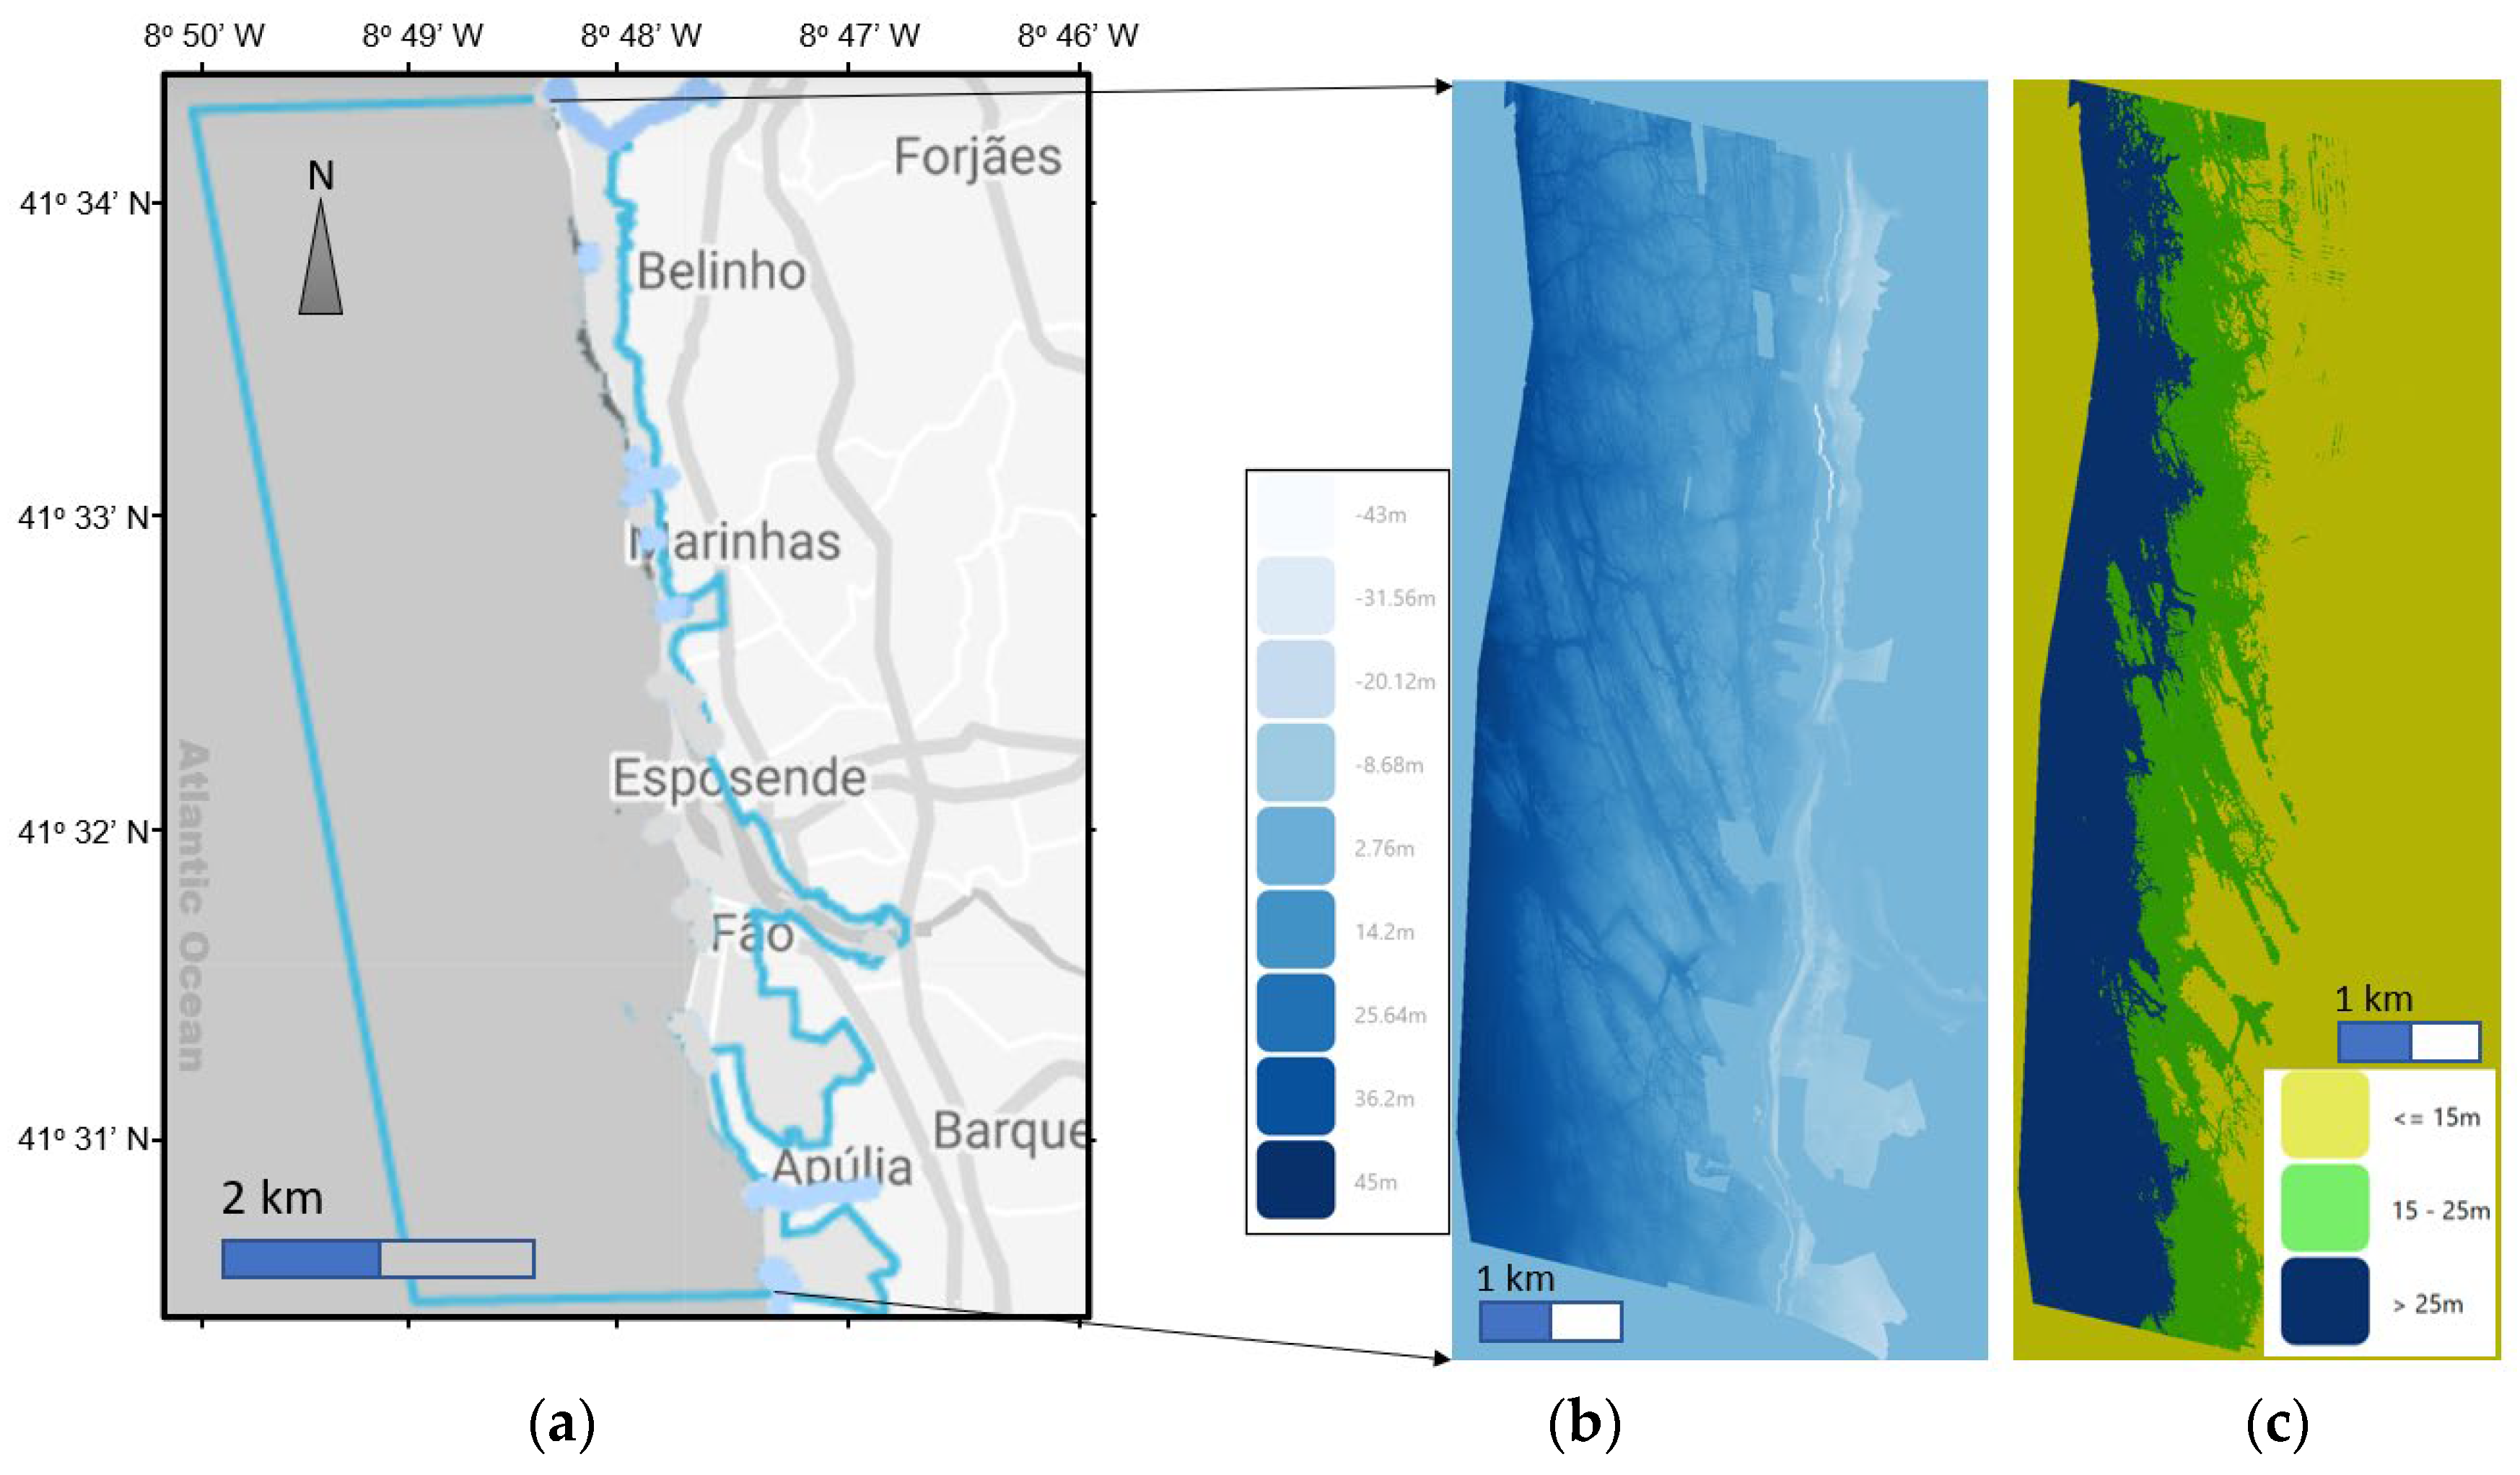
2.4. Site Location and Sea Conditions
2.5. Structural and Hydrodynamic Model
dFD = Cd × ½ × ρ × D × (uwave + ucurrent)2 dz
dFI = Cm × ρ × (π × D2)/4 × (∂u/∂t) dt
2.6. Actions and Effects
2.7. Design Considerations for Durability
2.8. Cross-Section Design
2.8.1. Axial Strength
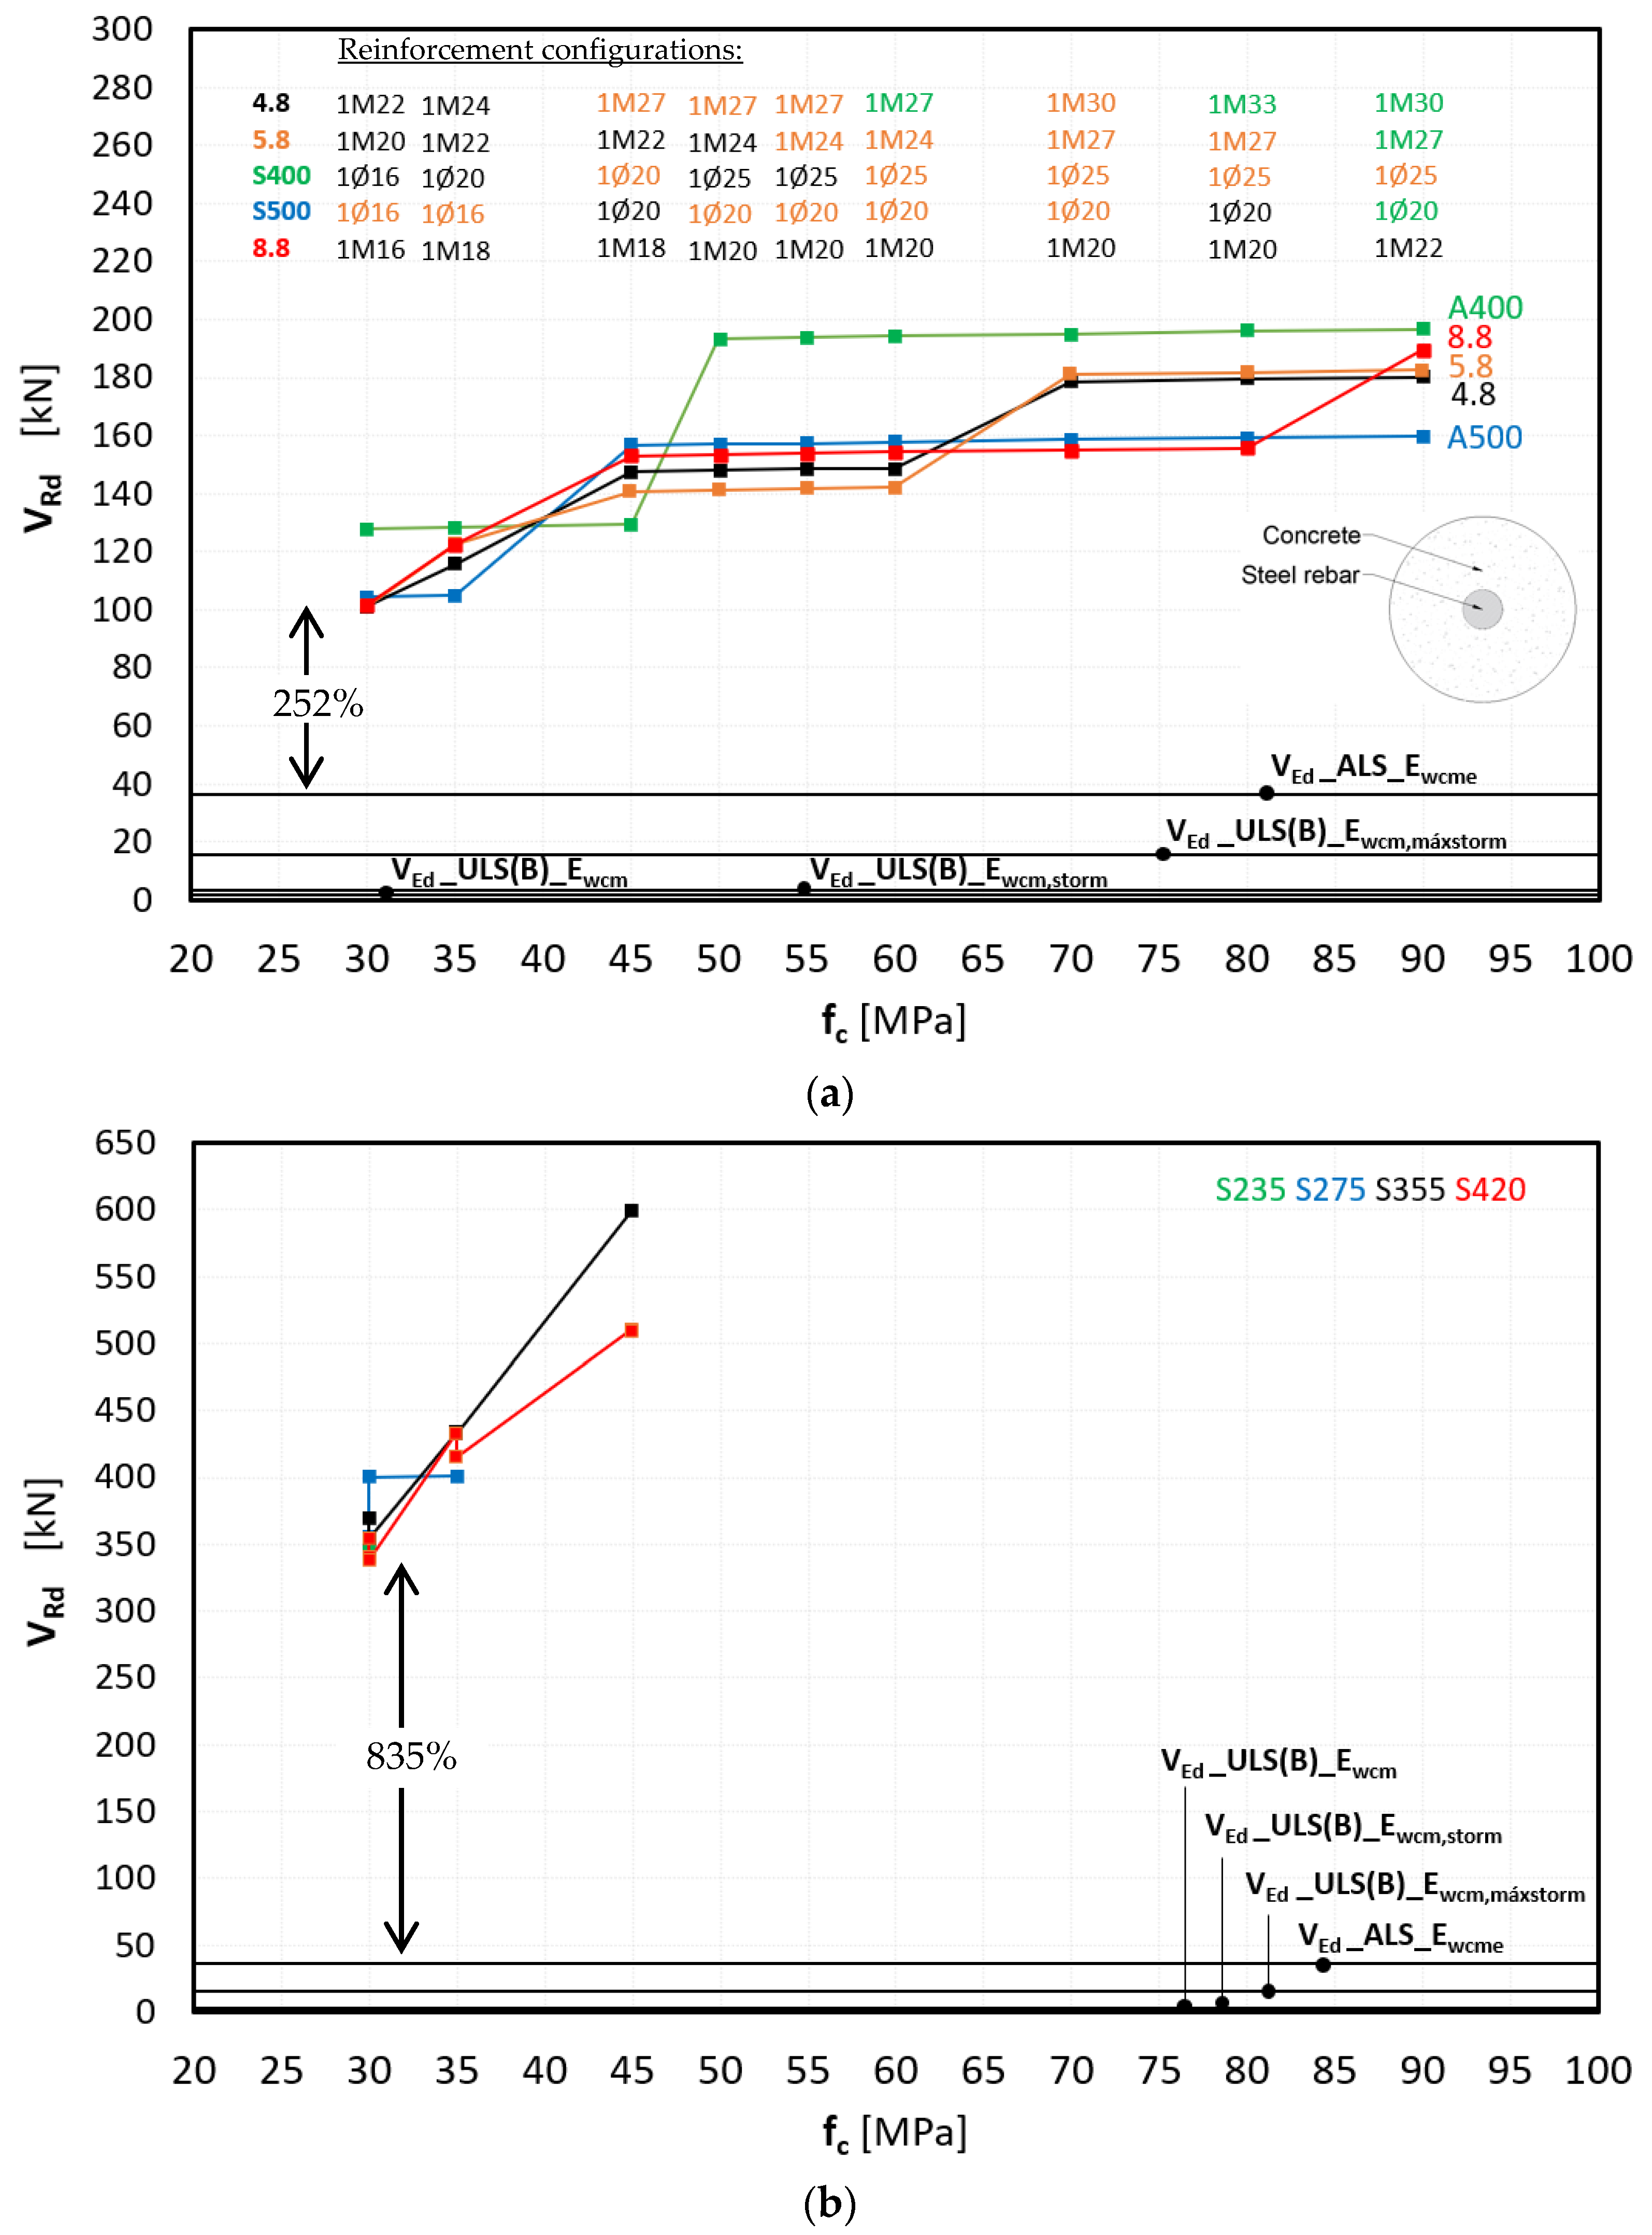
2.8.2. Shear Strength
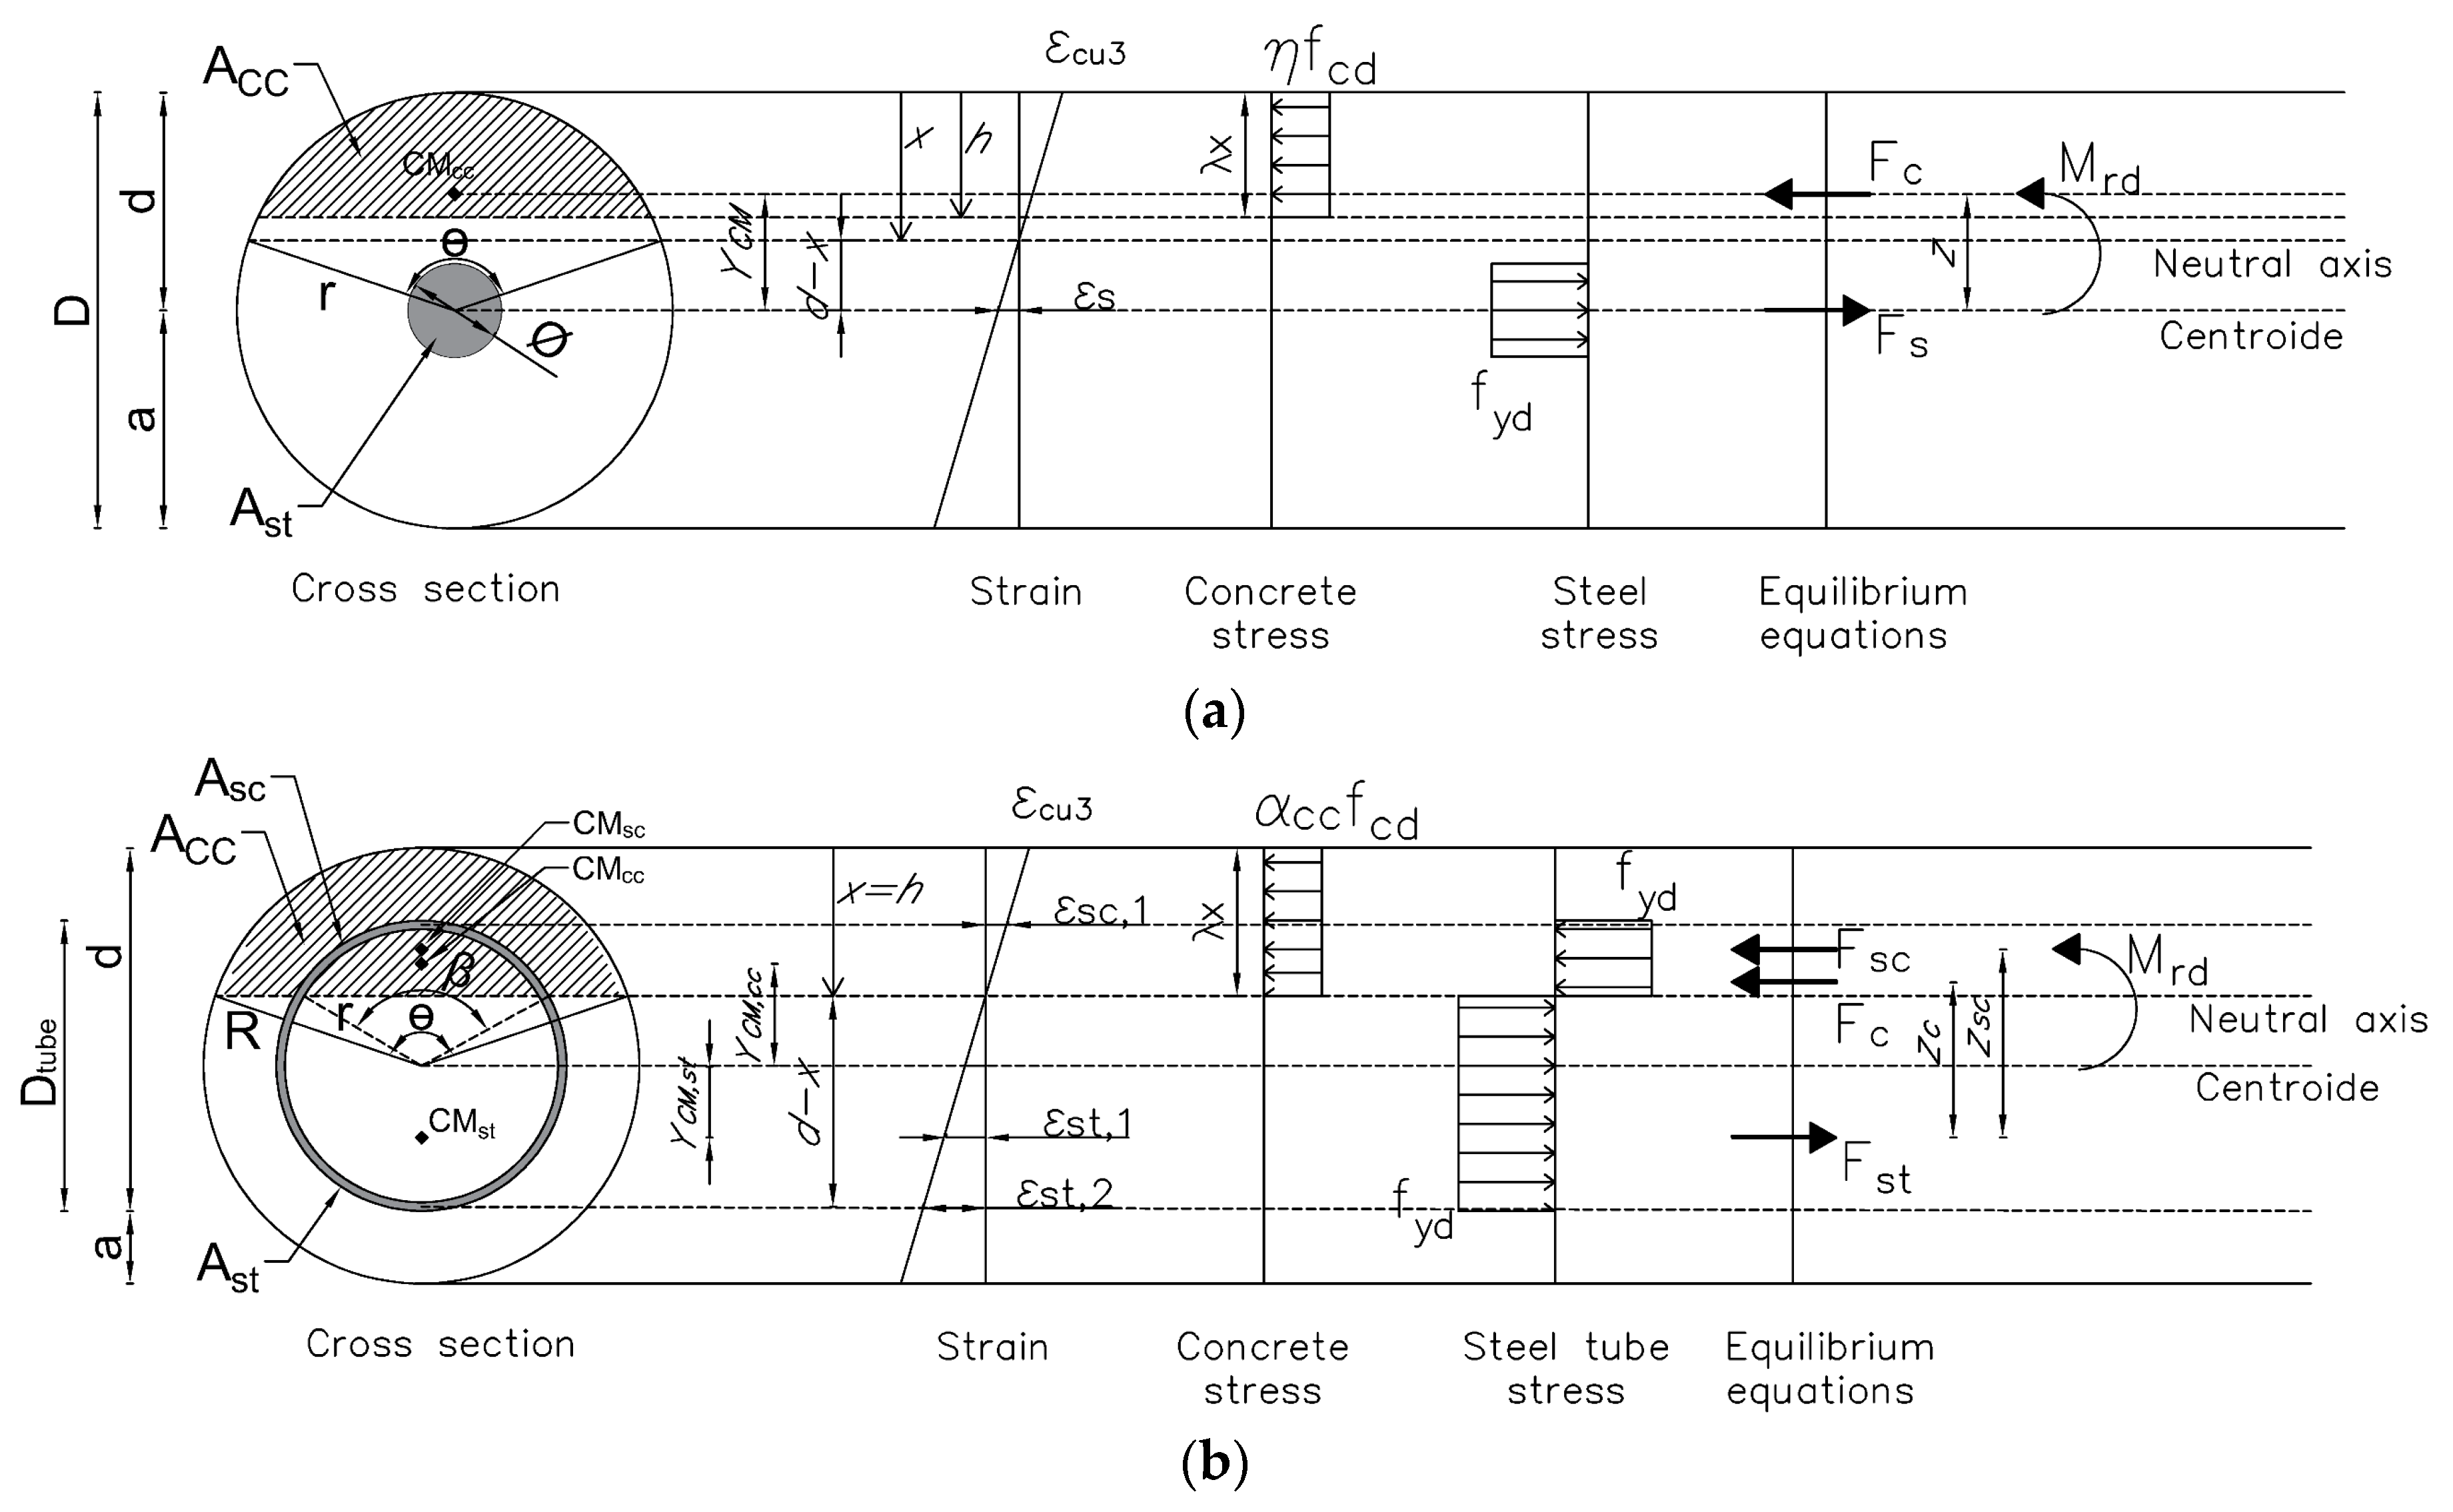
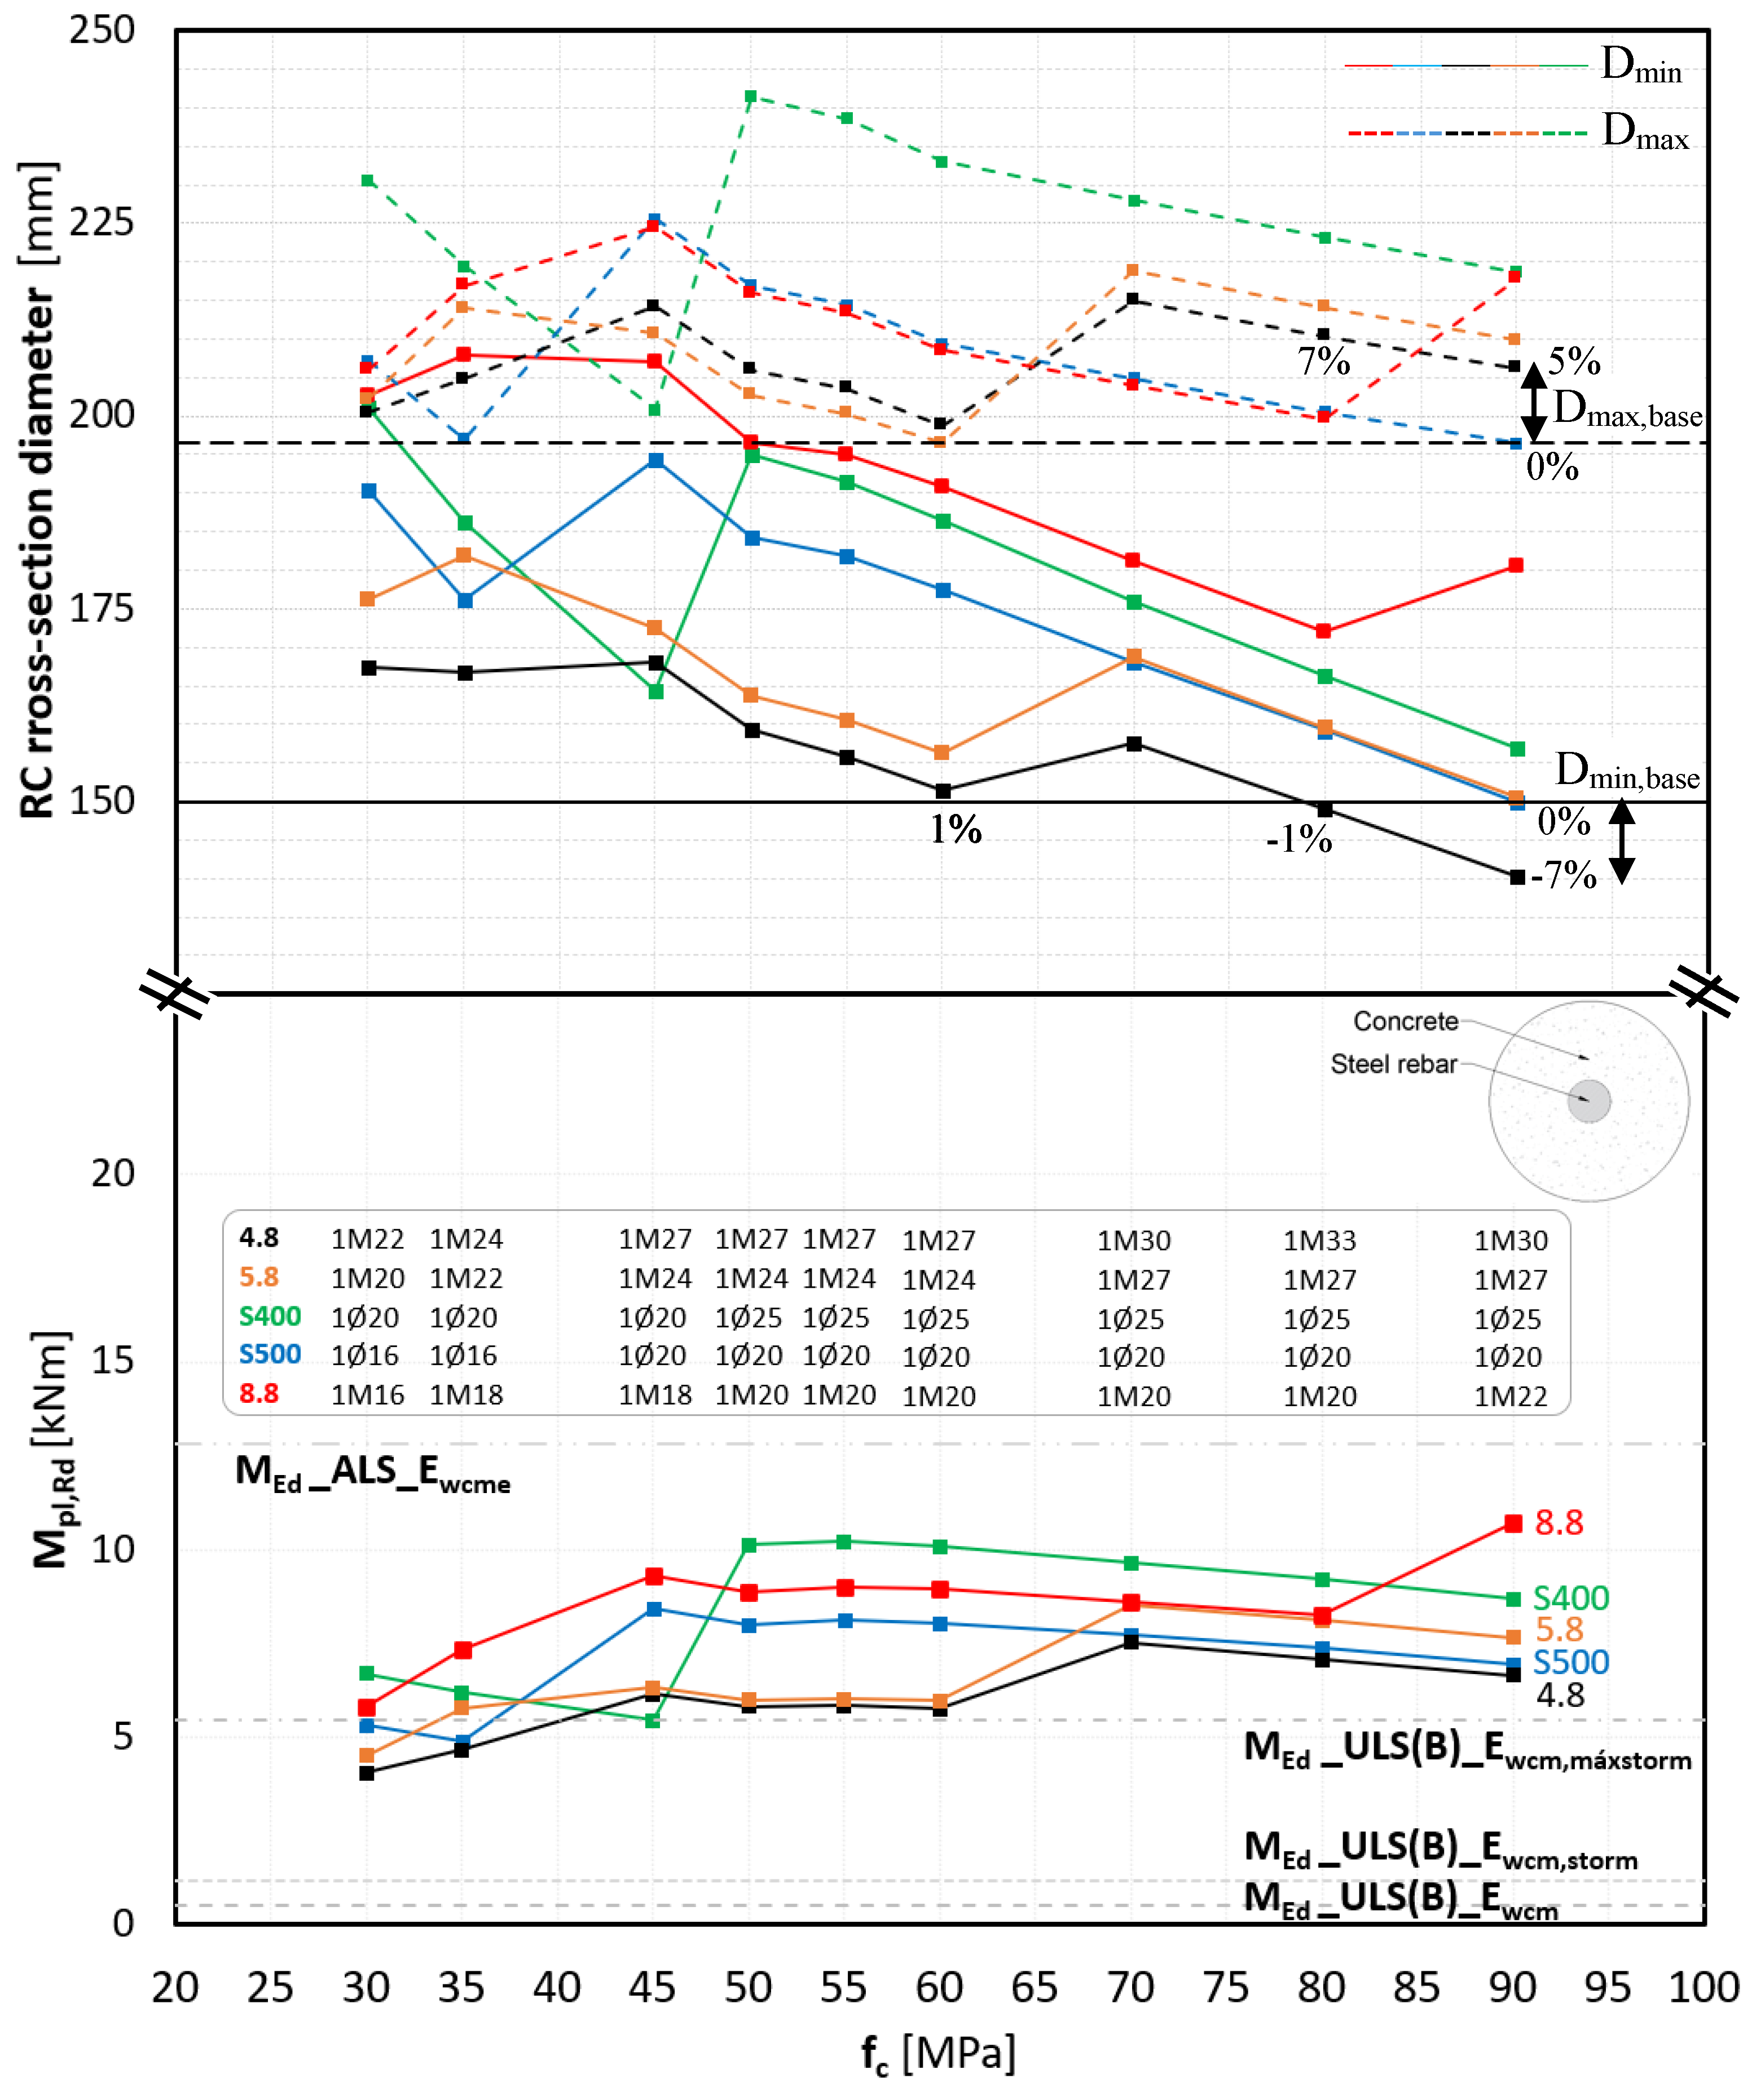
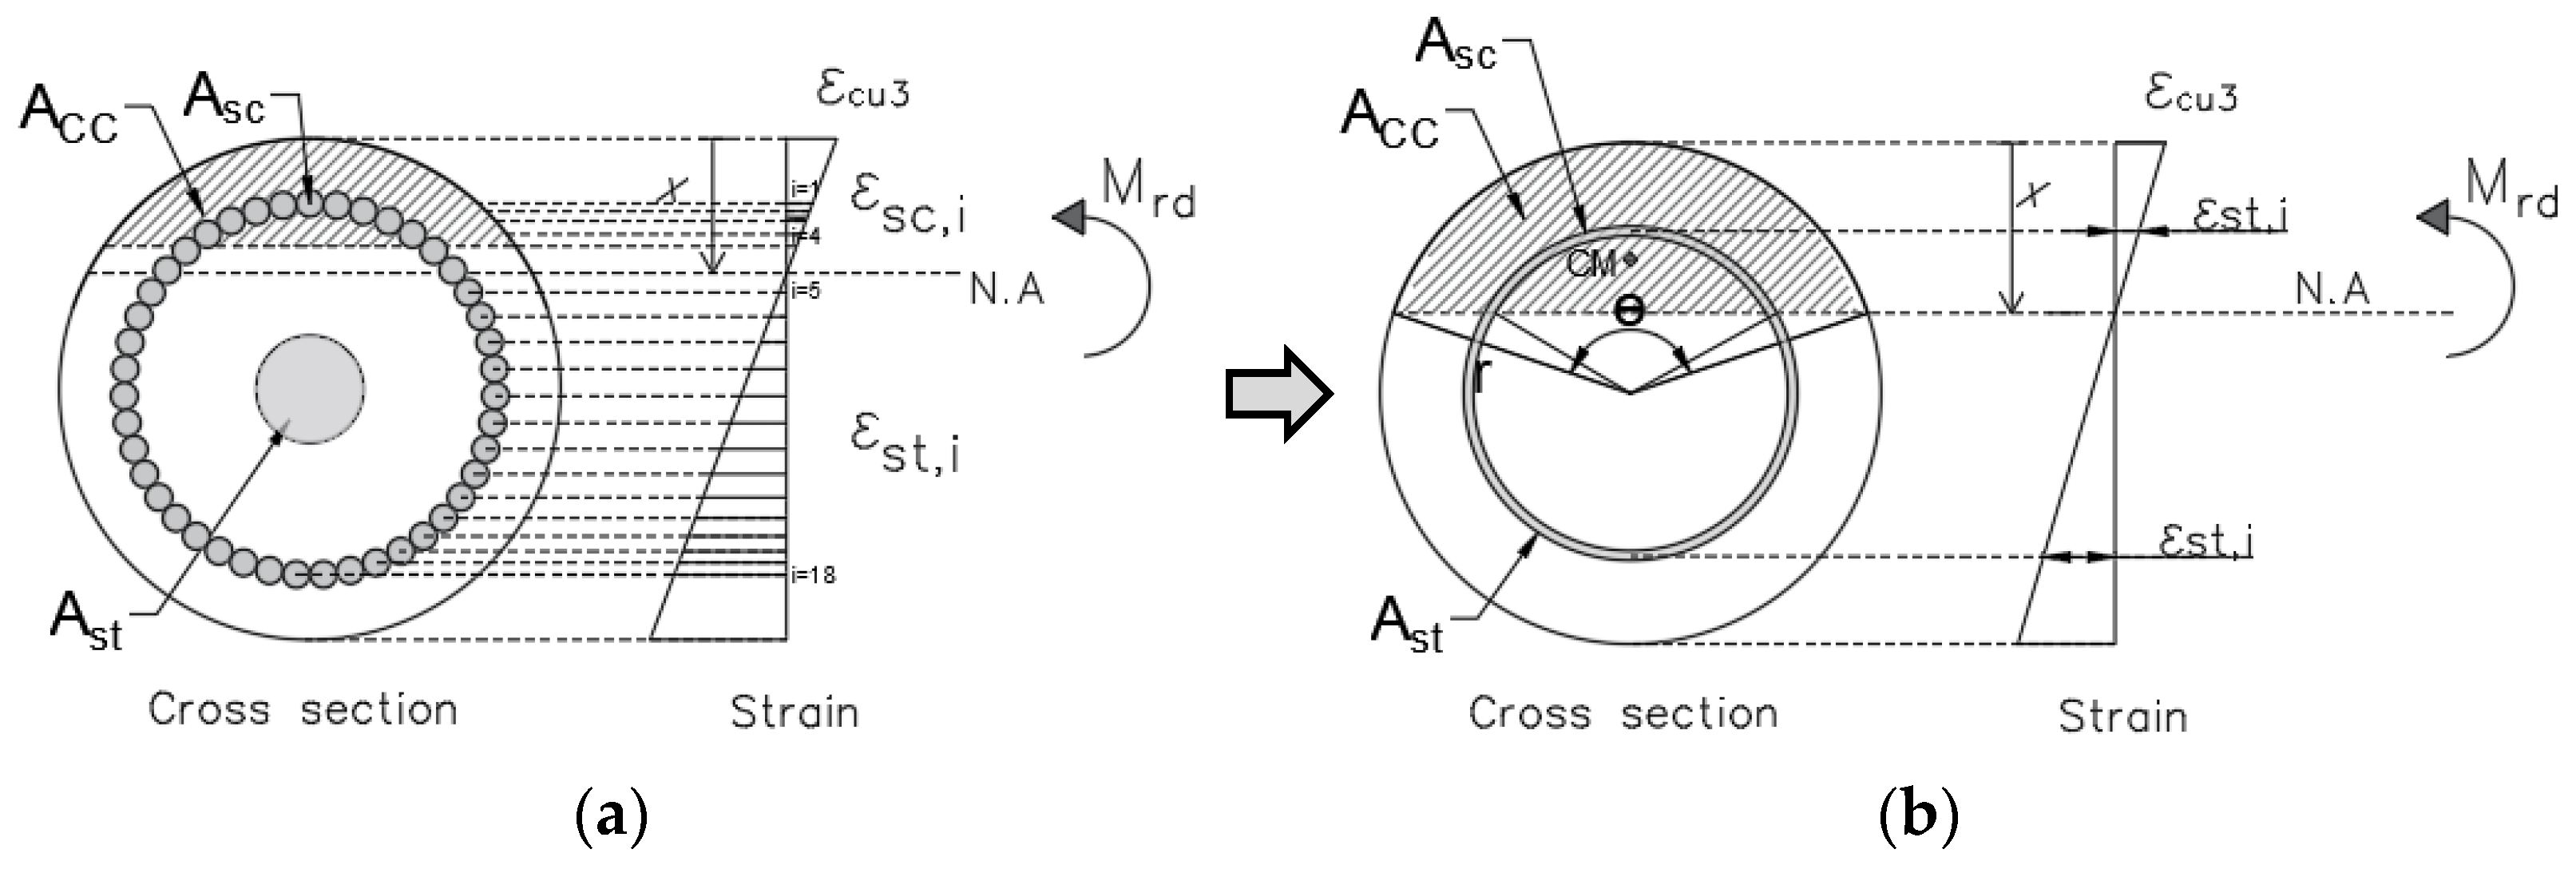
2.8.3. Flexural Strength
3. Results and Discussion
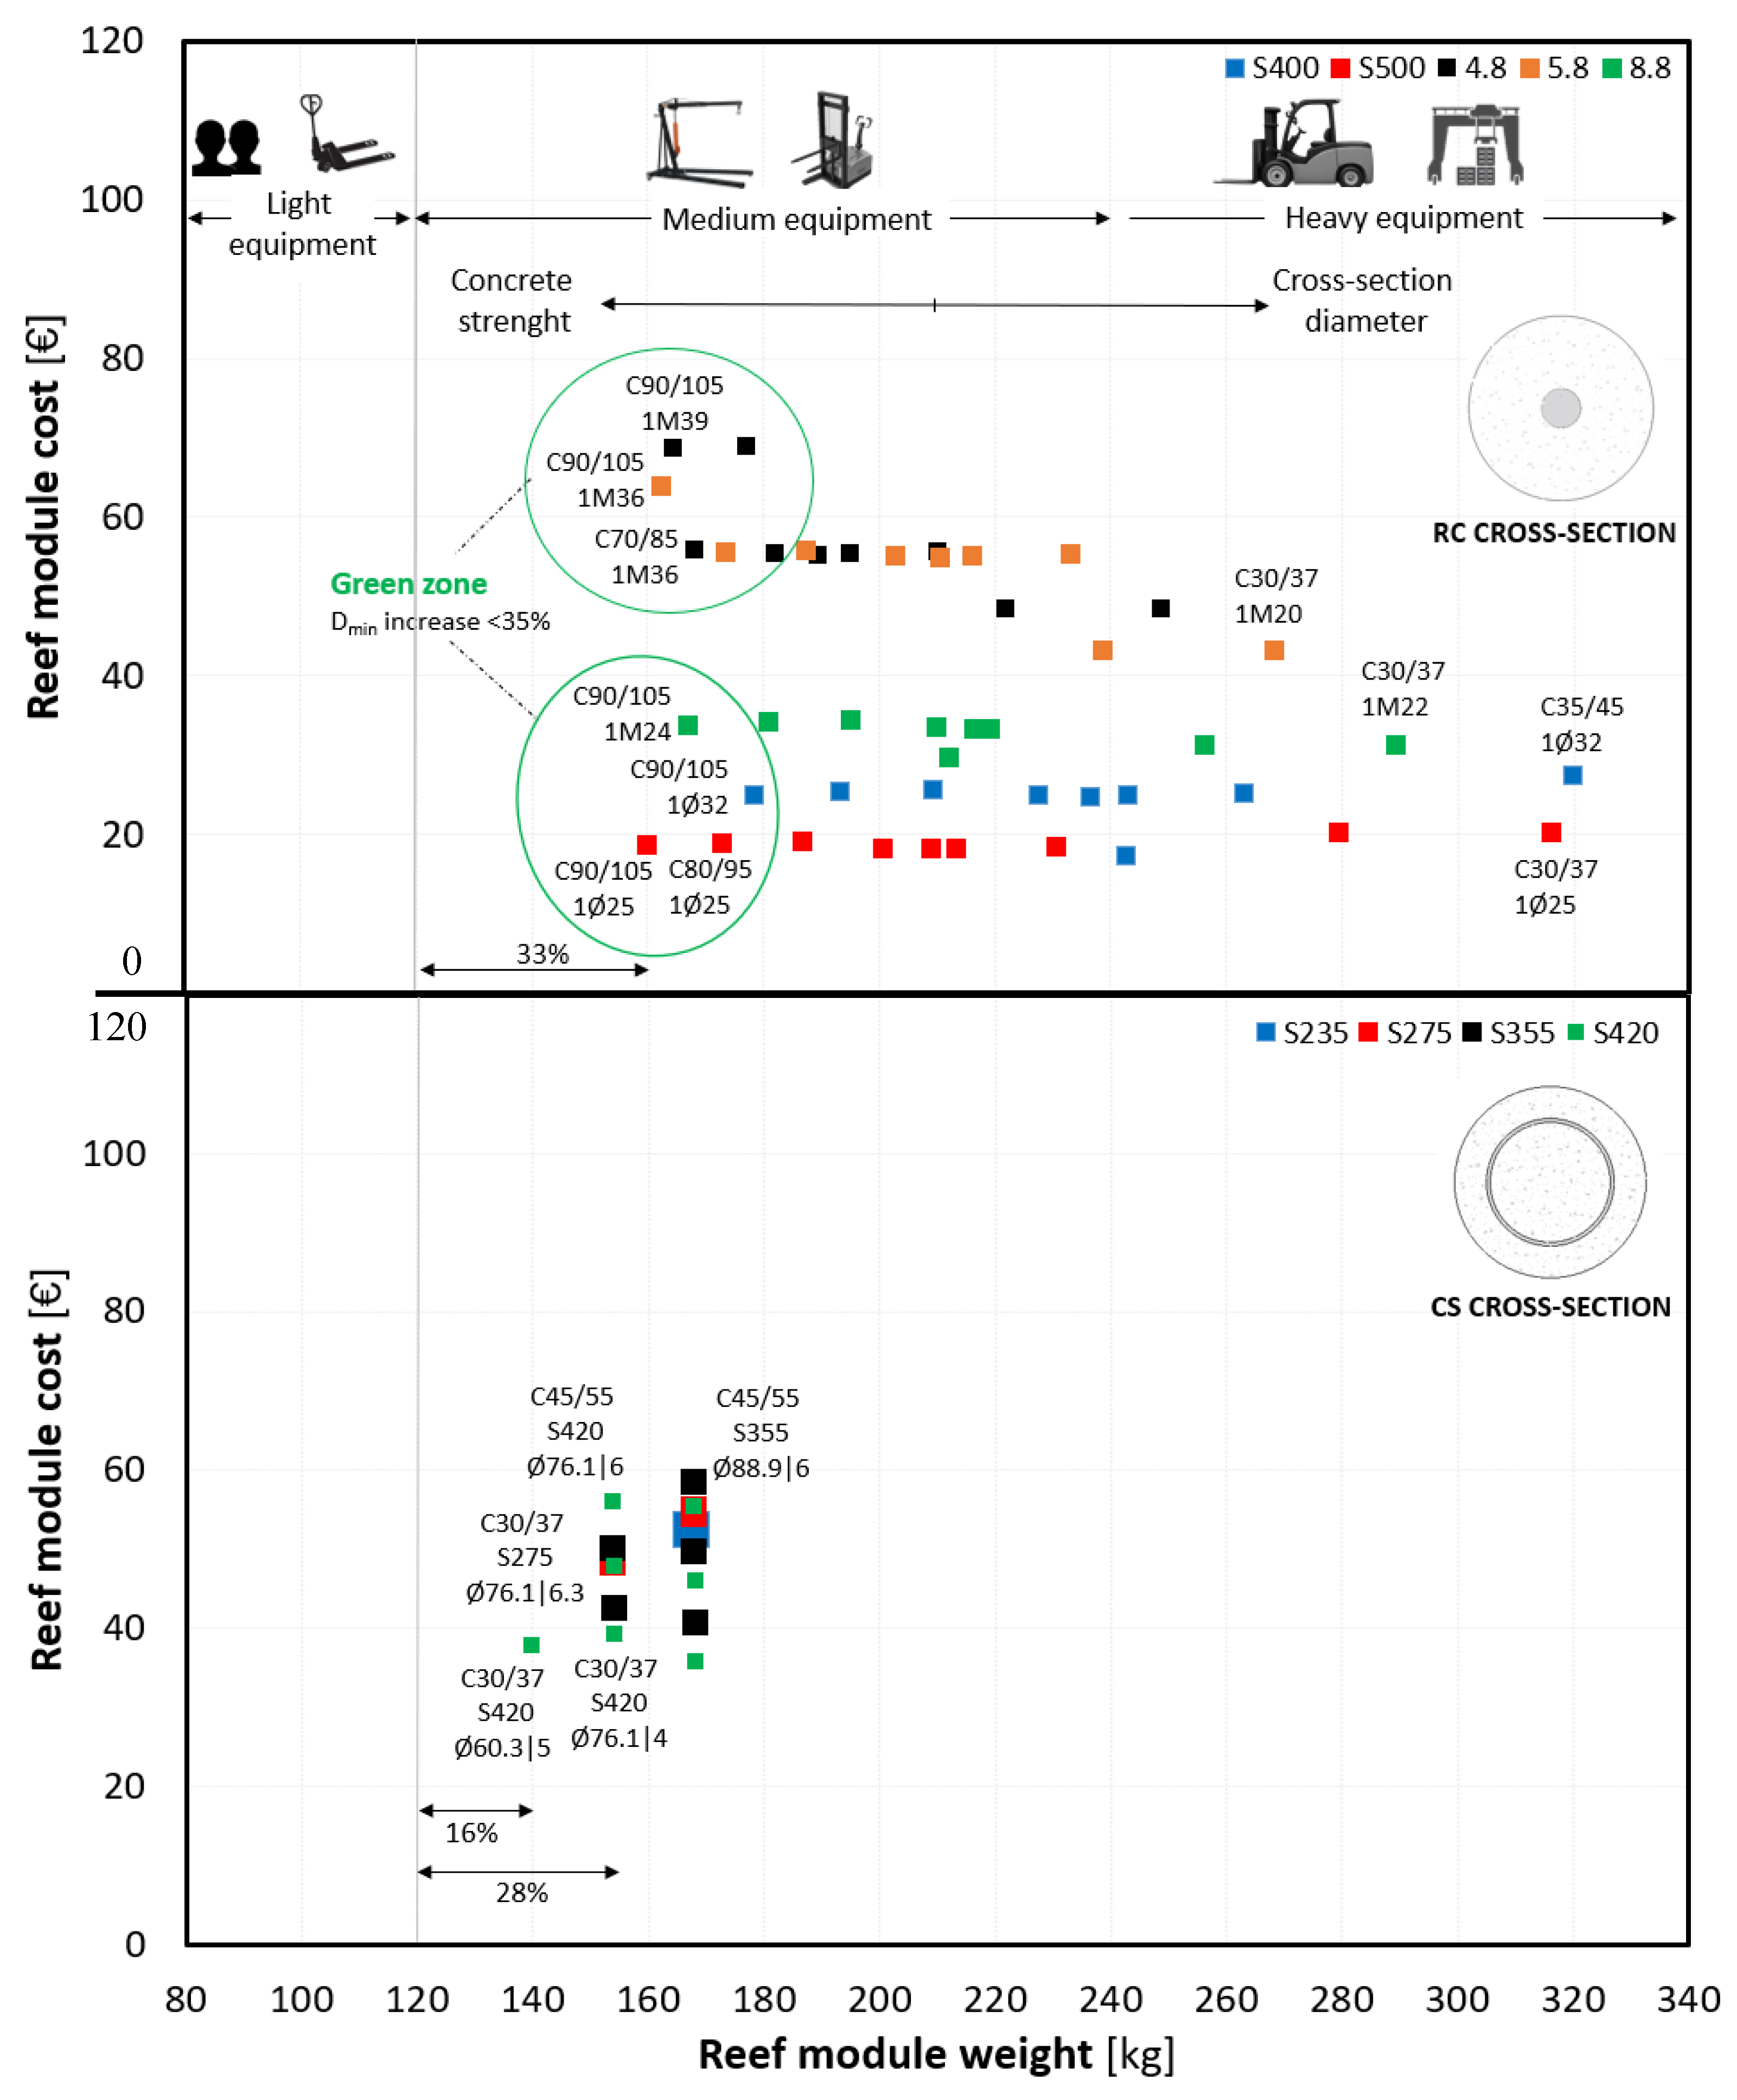
3.1. Parametric Study of RC and CS Design Without Cross-Sectional Diameters Modifications
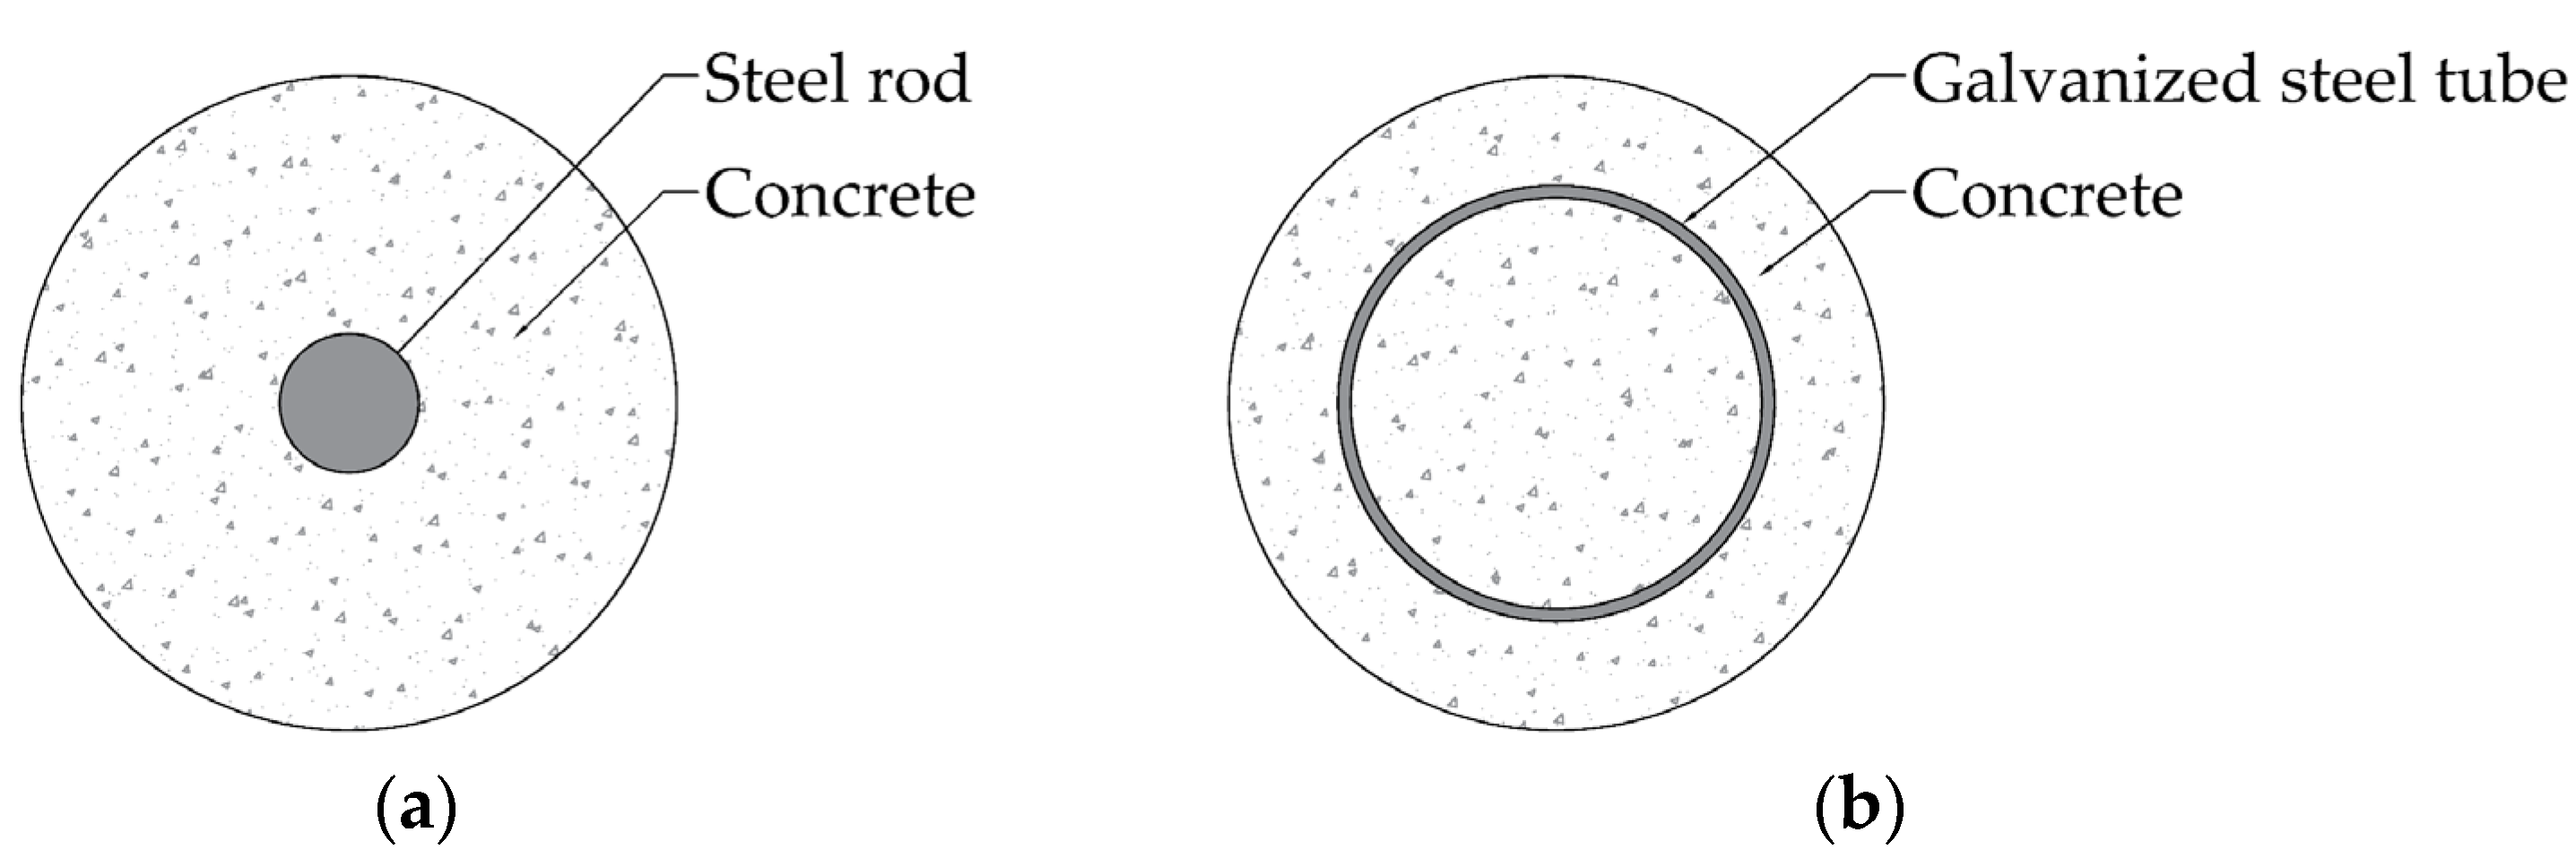
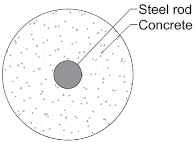
- RC cross-section
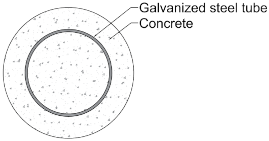
- CS cross-section
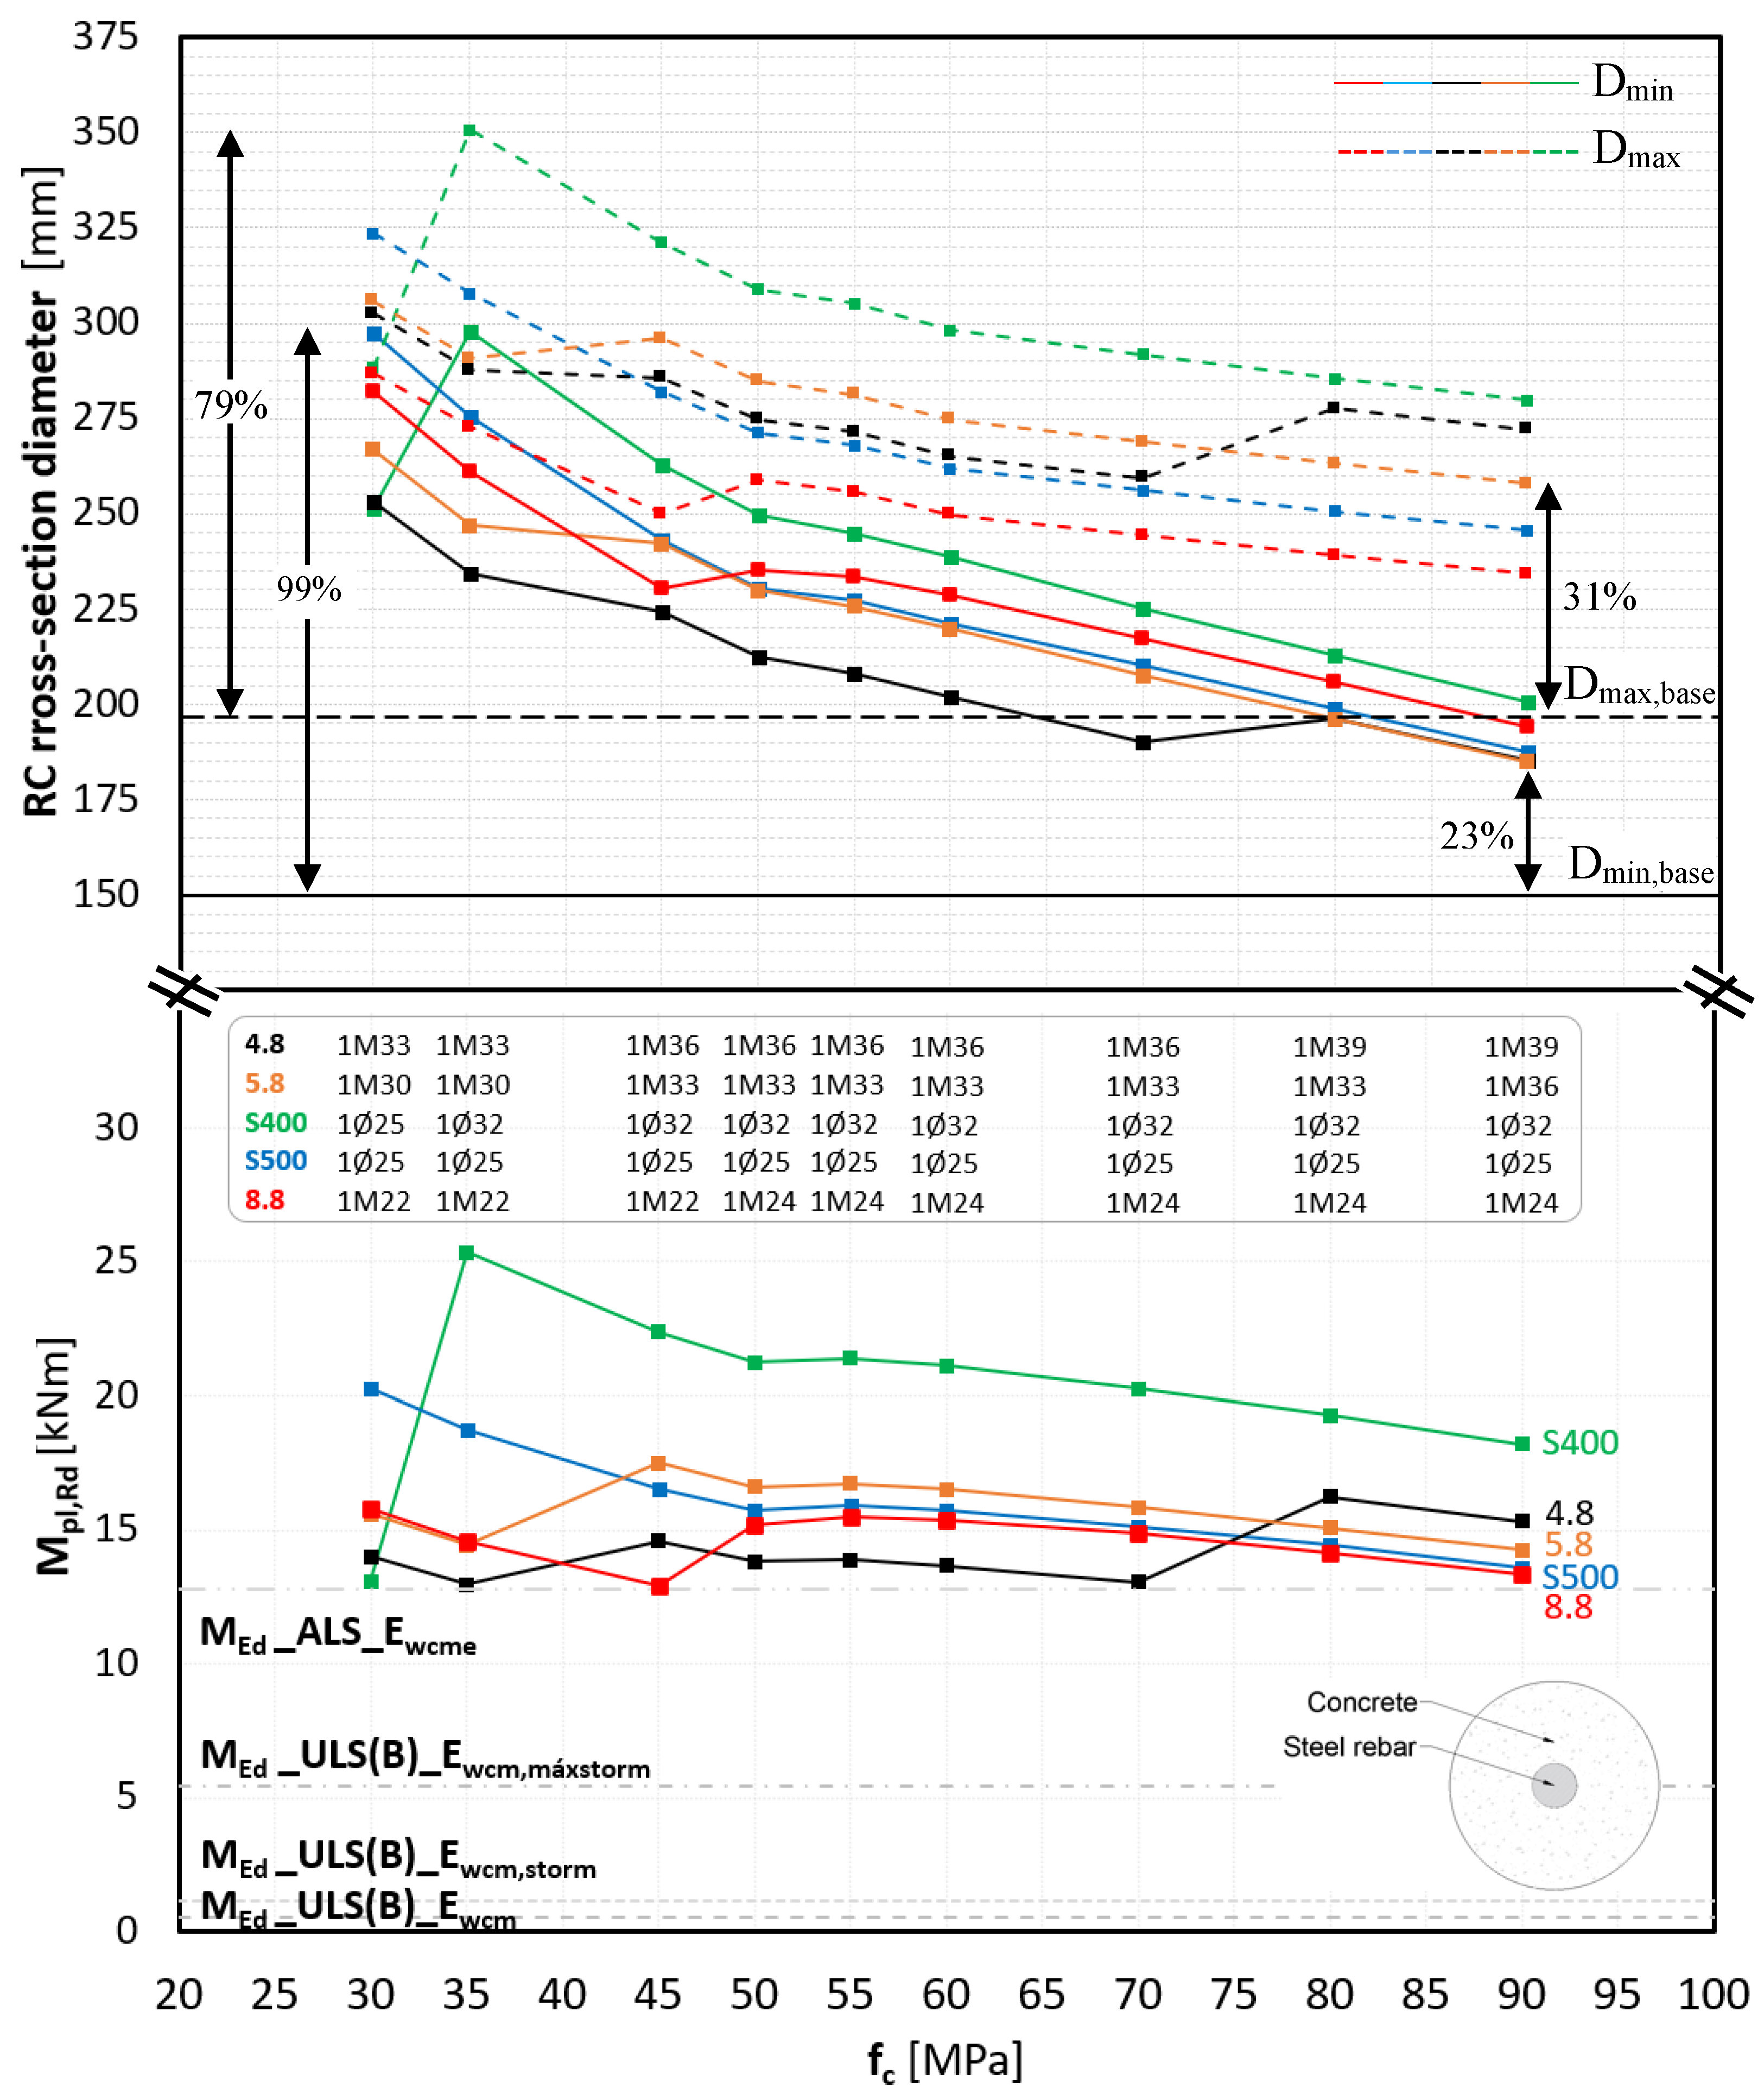
3.2. Optimization of the RC Cross-Section
3.3. RC Versus CS Cross-Section
3.4. Cost-Effectiveness
4. Conclusions
- Reduced fixed diameters establish an important geometric limit for optimizing the cross-section of the RC type.
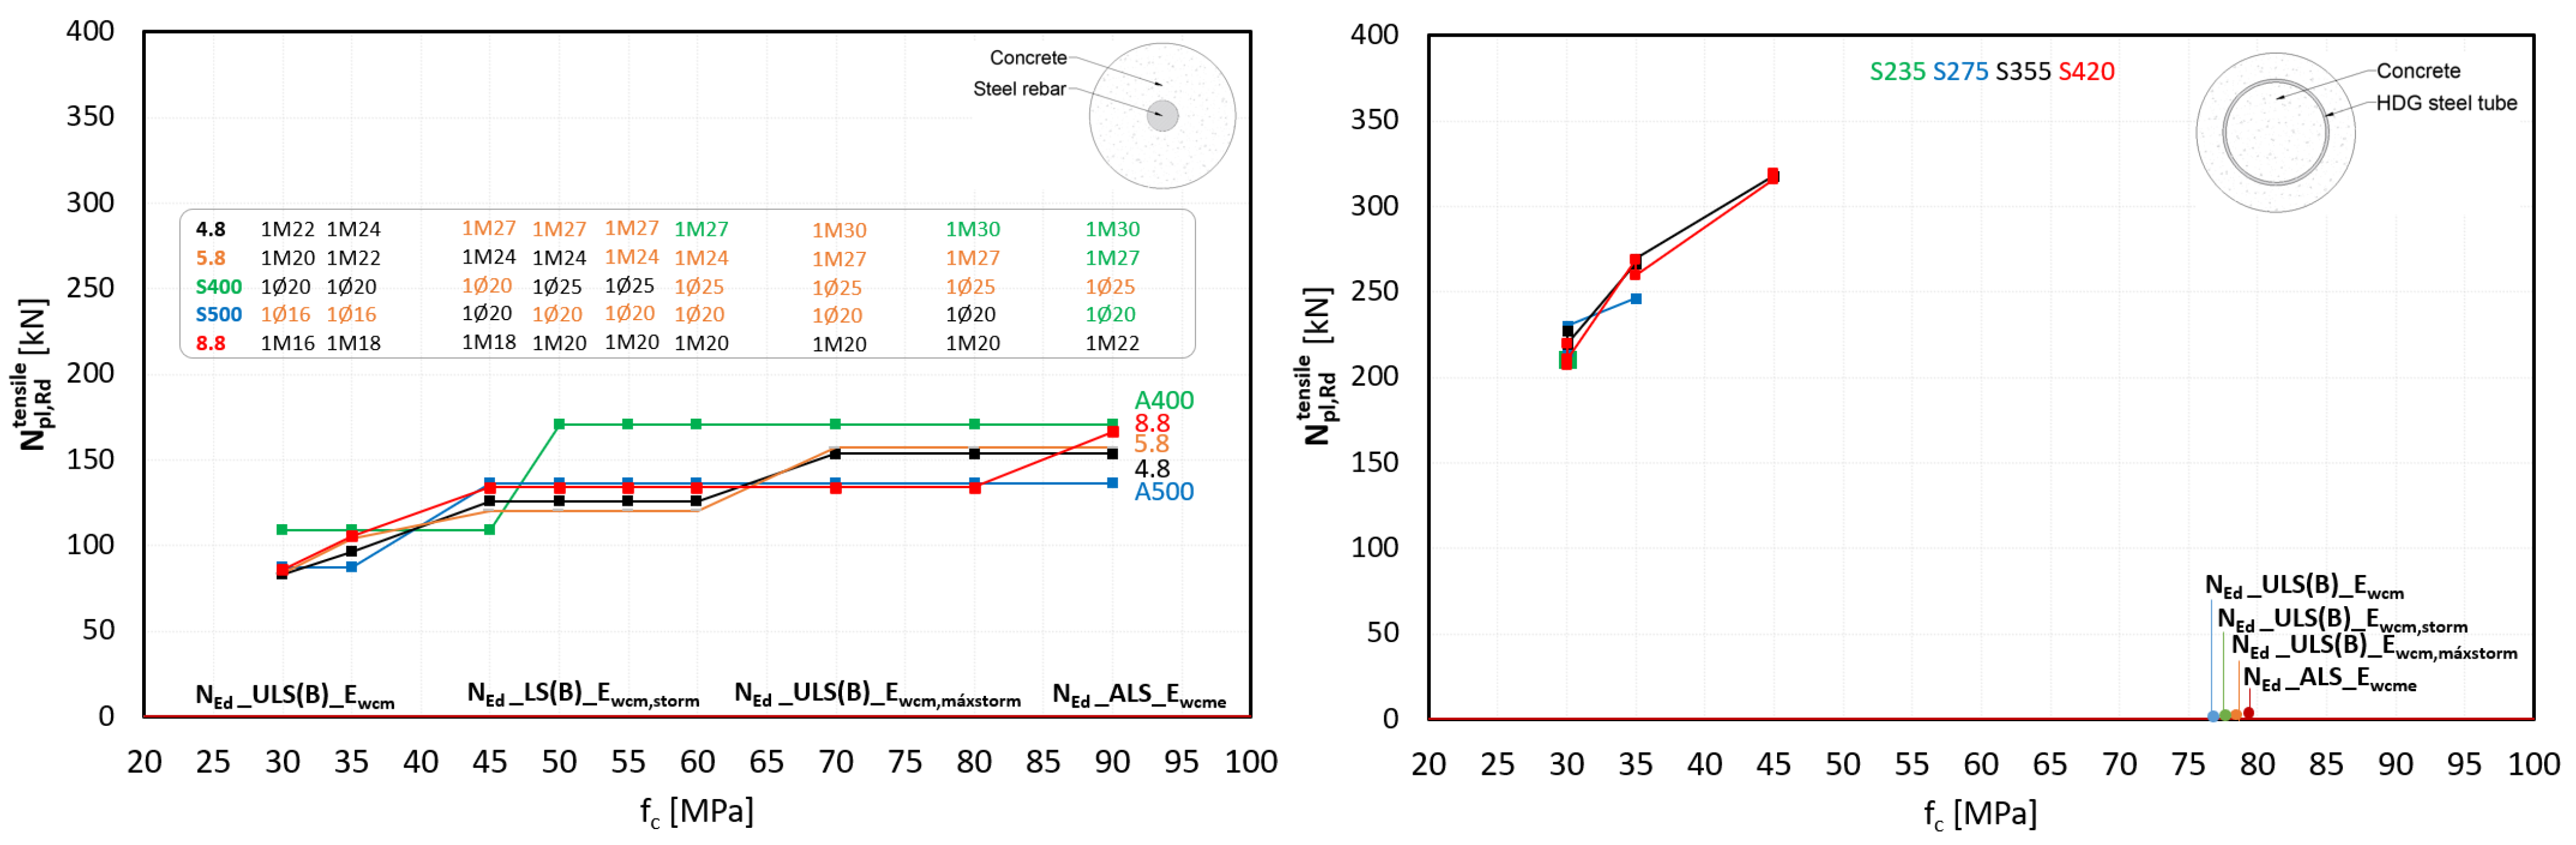
- Tensile strength emerged as the primary limiting factor, particularly in the RC type with variable cross-sections, where the minimum reinforcement was constrained by the larger section.
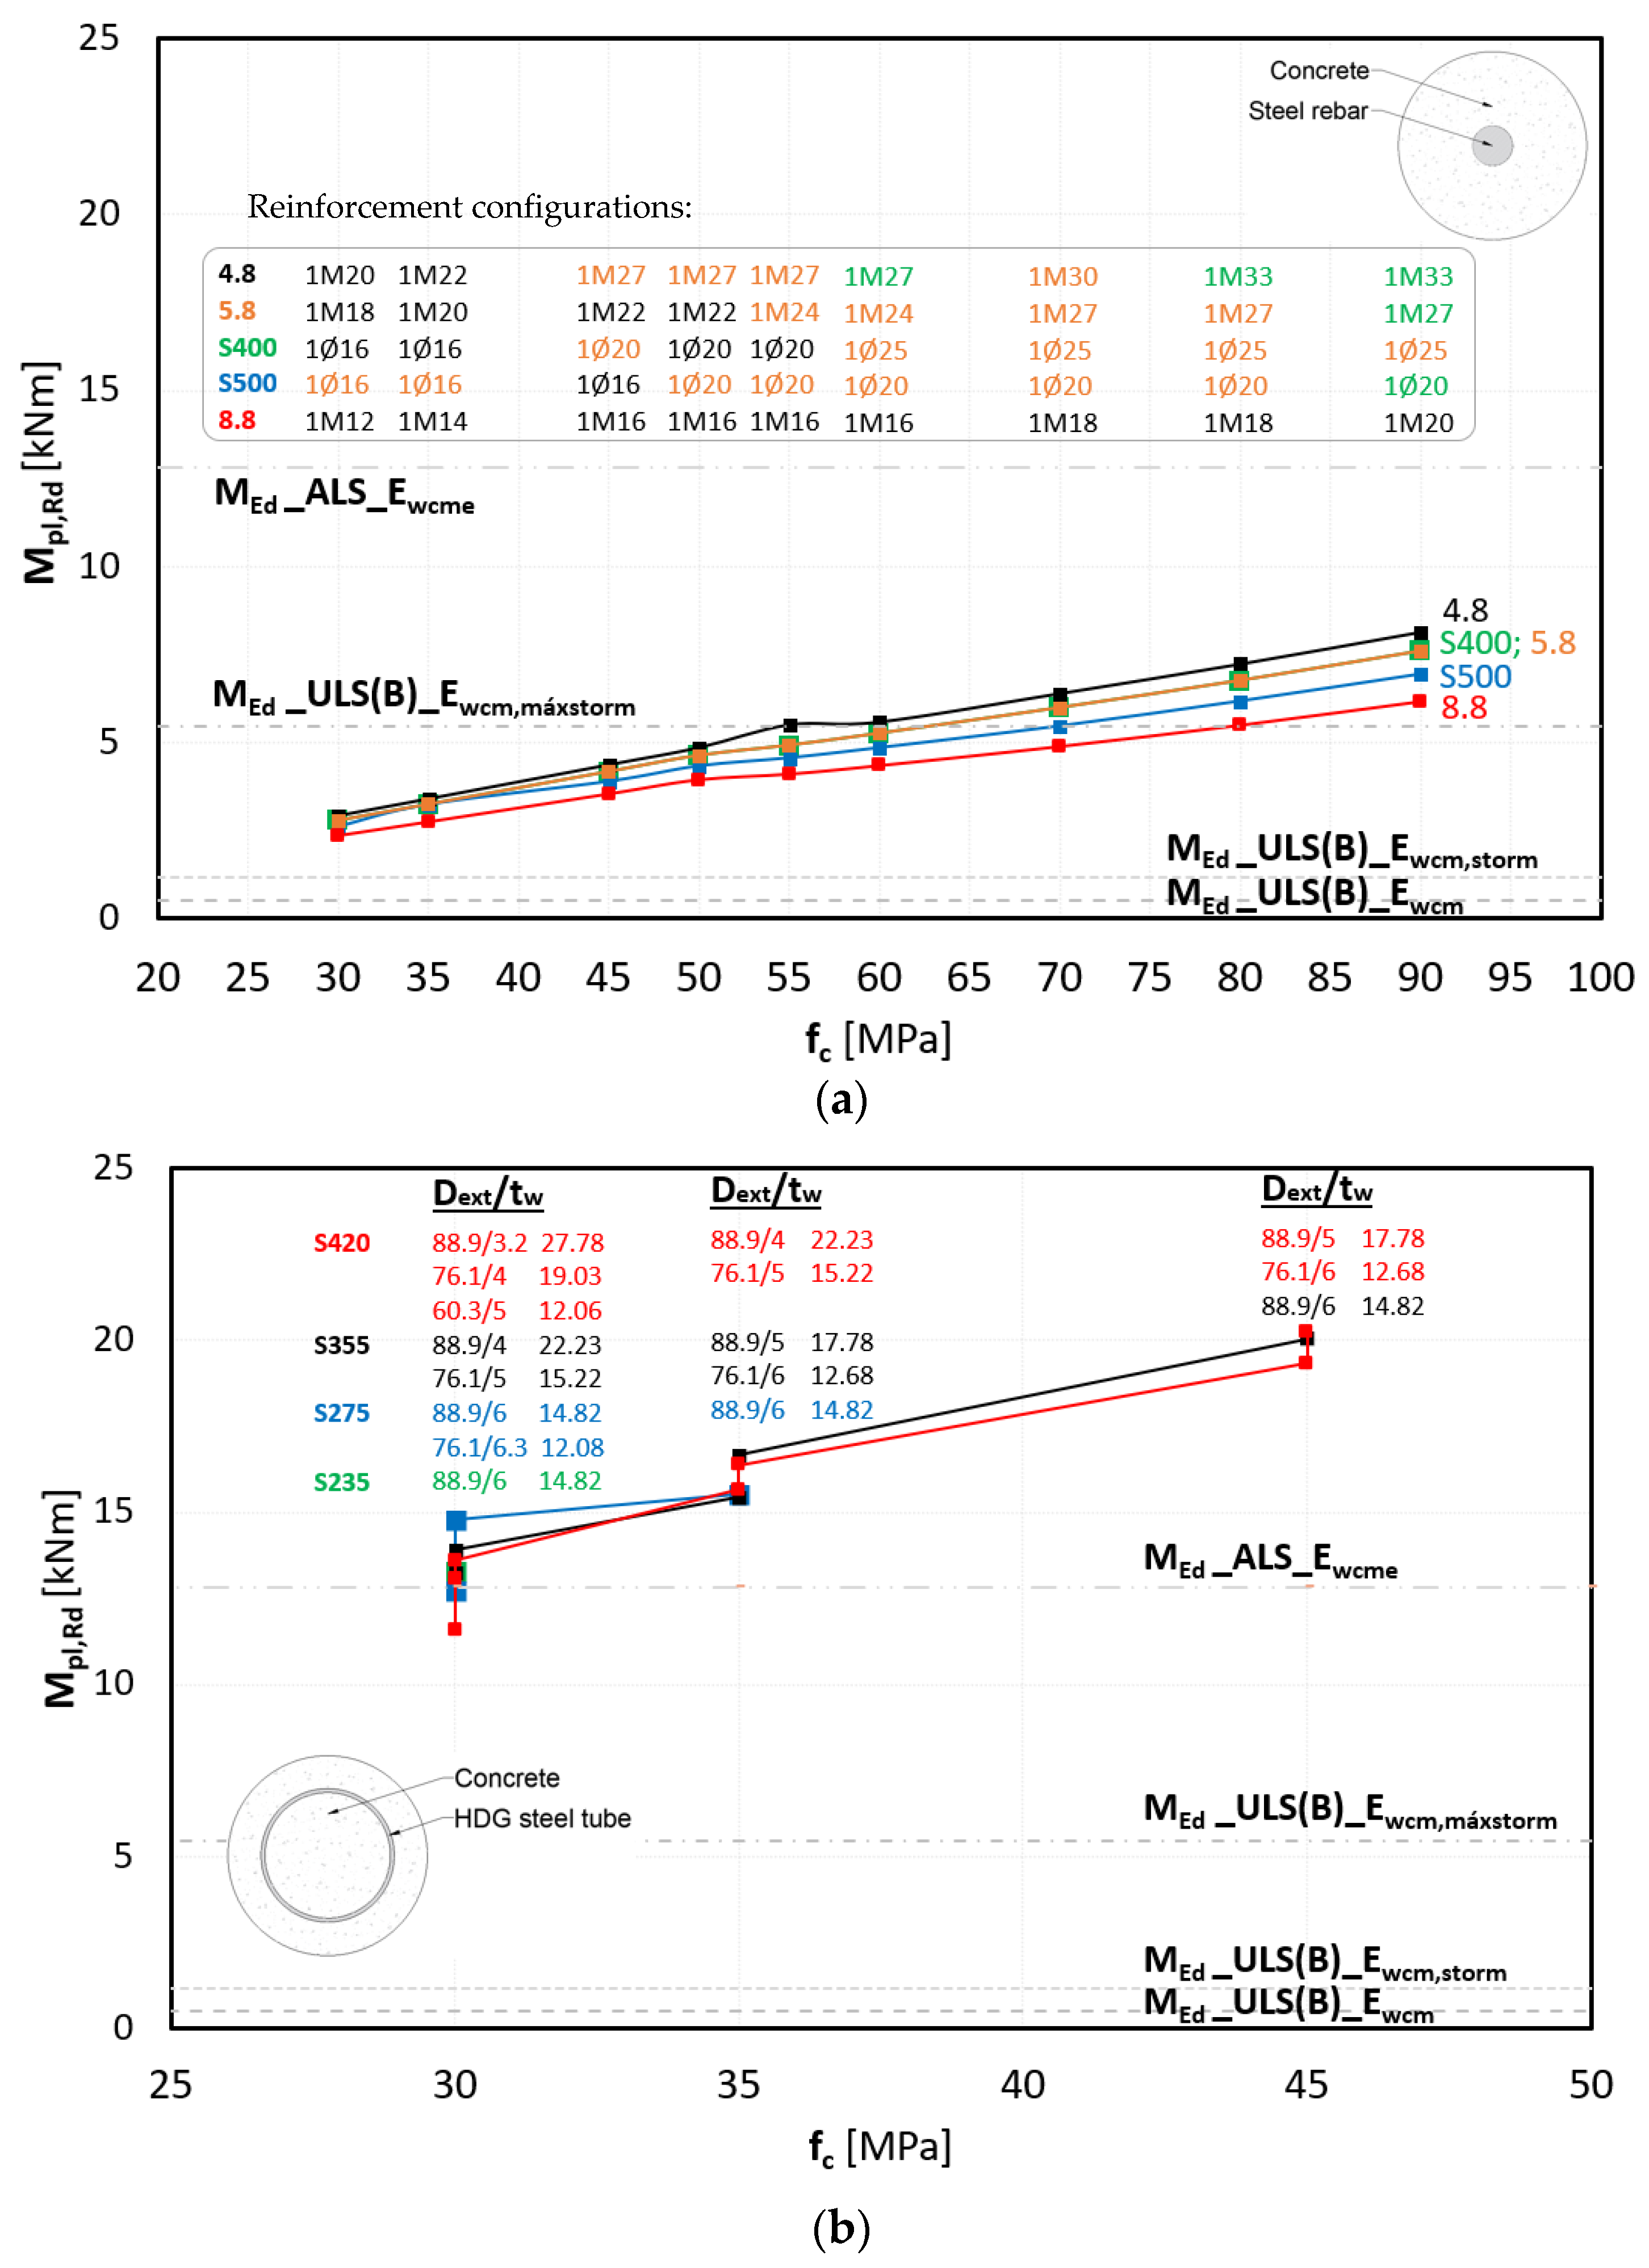
- Flexural strength was not a limiting factor for the CS structural solution, as the variety of structural combinations indicates sufficient robustness under flexural stresses.
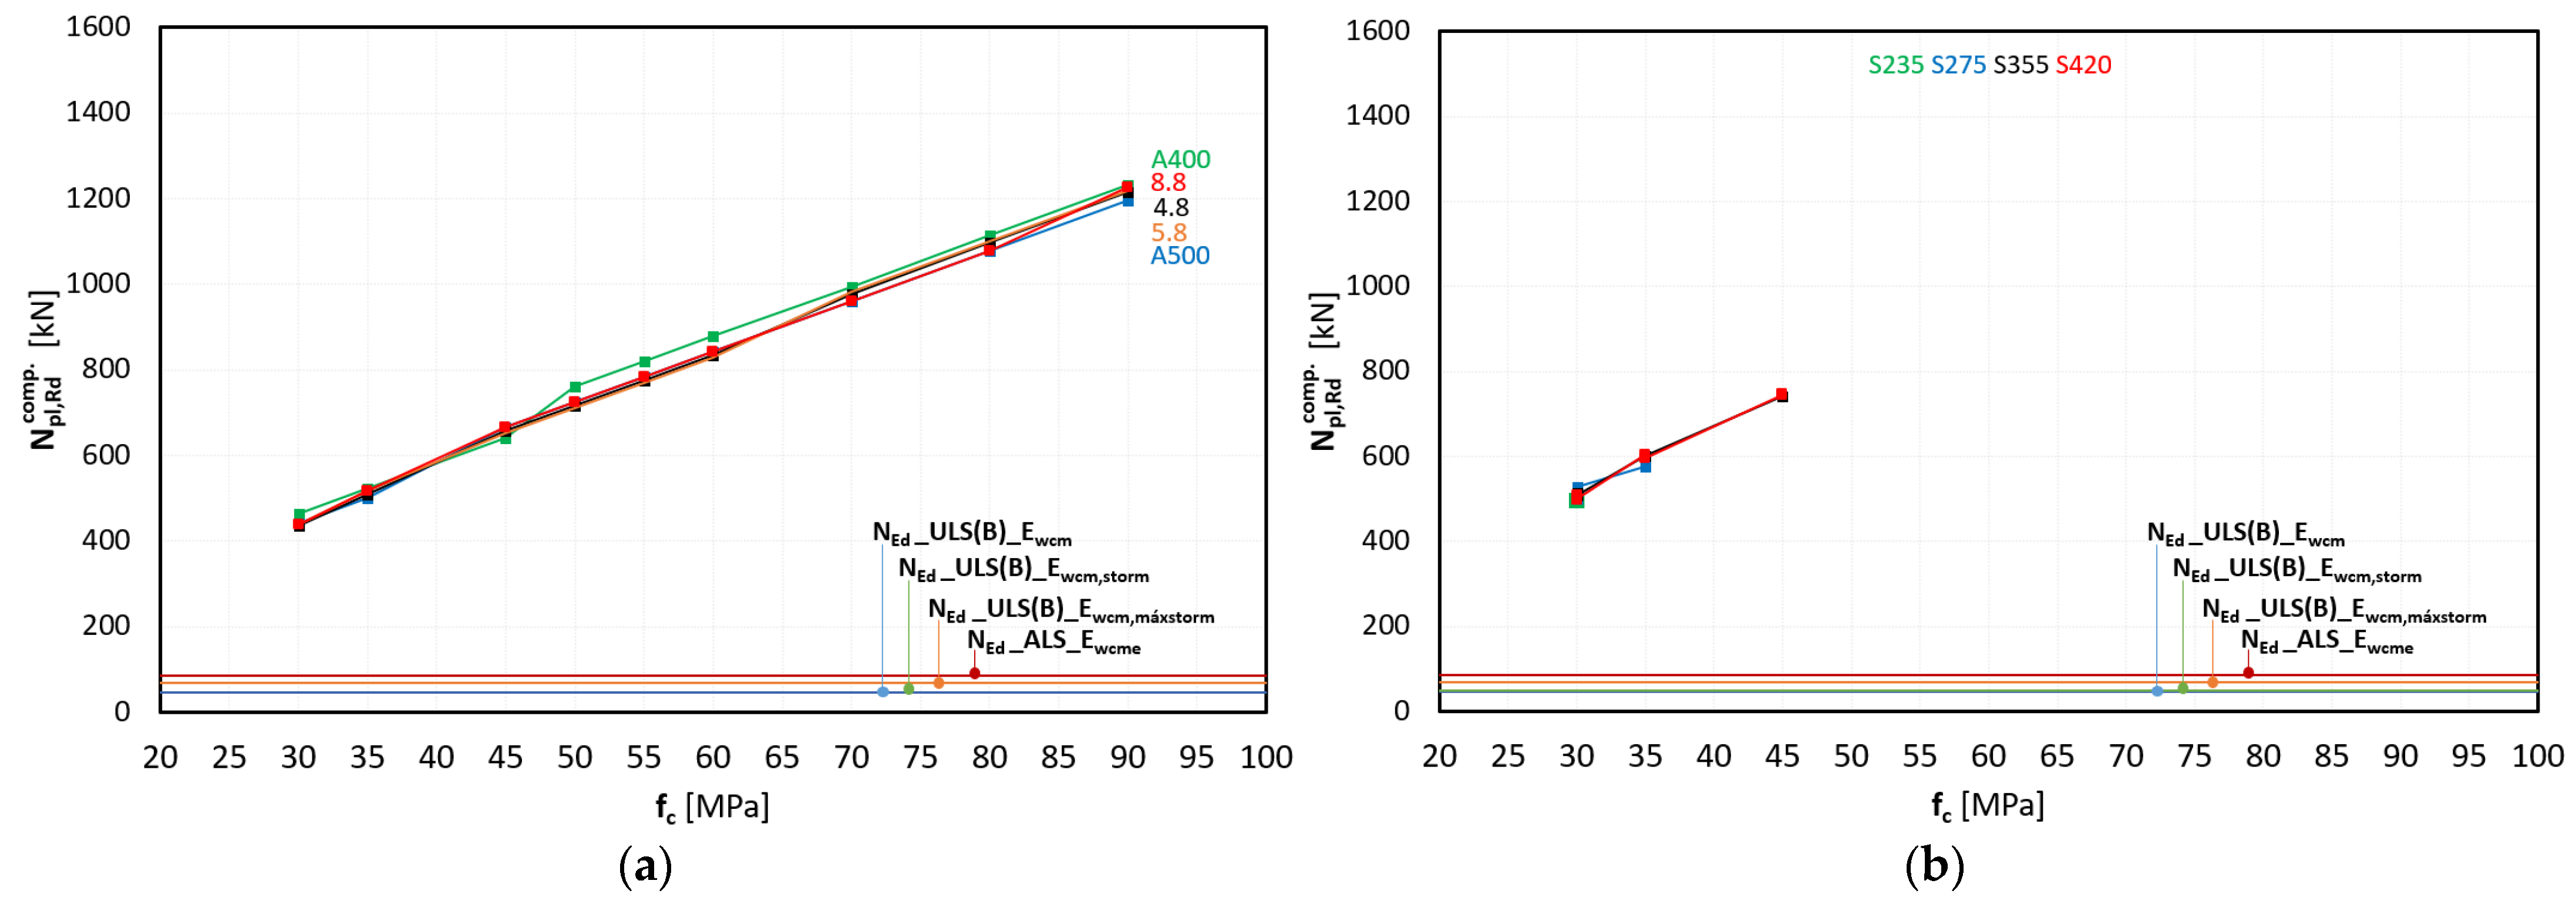
- In terms of axial and flexural strength, the CS system provided significantly higher design strengths when compared to RC sections. Additionally, the CS structure did not require the use of high-strength concrete, simplifying construction and potentially reducing costs and environmental impact.
- Shear strength was not a limiting factor for either structural solution.
- Full optimization of the cross-section to withstand the most demanding loading scenario would require a minimum size increase of 23%, making it bulky, heavier, and less attractive.
- If cost is not a limiting factor and preserving the original geometry is a priority, the CS solution stands out for its high structural efficiency, reduced carbon footprint, and minimal impact on hydrodynamic and ecological performance.
- The methodology needs to include factors such as fatigue or long-term plastic deformation, which are crucial for structures exposed to high load cycles, like artificial reefs.
Author Contributions
Funding
Institutional Review Board Statement
Informed Consent Statement
Data Availability Statement
Acknowledgments
Conflicts of Interest
Appendix A. RC Cross-Section

| Materials (Concrete + Steel) | As,min | Tensile Strength | Compressive Strength | Flexural Strength | MEd | |||||||
|---|---|---|---|---|---|---|---|---|---|---|---|---|
| As,req | Øeff | As,eff | Npl,Rd | Npl,Rd | As,satur | Mpl,Rd | Øsatur | ULS(B) Ewcm | ULS(B) Ewcm,storm | ULS(B) Ewcm,maxstorm | ALS Ewcme | |
| cm2 | mm | cm2 | kN | kN | cm2 | kNm | mm | kNm | kNm | kNm | kNm | |
| C30/37 + S400 | 2.28 | 1Ø20 | 3.14 | 109.22 | 462.65 | 1.75 | 2.77 | 1Ø16 | 0.52 | 1.16 | 5.47 | 12.81 |
| C30/37 + S500 | 1.81 | 1Ø16 | 2.01 | 87.39 | 440.82 | 1.25 | 2.60 | 1Ø16 | 0.52 | 1.16 | 5.47 | 12.81 |
| C30/37 + DIN 4.8 | 2.88 | 1M22 | 2.99 | 83.20 | 436.63 | 2.40 | 2.92 | 1M20 | 0.52 | 1.16 | 5.47 | 12.81 |
| C30/37 + DIN 5.8 | 2.28 | 1M20 | 2.41 | 83.83 | 437.26 | 1.75 | 2.77 | 1M18 | 0.52 | 1.16 | 5.47 | 12.81 |
| C30/37 + DIN 8.8 | 1.41 | 1M16 | 1.54 | 85.70 | 439.13 | 0.83 | 2.37 | 1M12 | 0.52 | 1.16 | 5.47 | 12.81 |
| C35/45 + S400 | 2.52 | 1Ø20 | 3.14 | 109.22 | 521.55 | 2.01 | 3.23 | 1Ø16 | 0.52 | 1.16 | 5.47 | 12.81 |
| C35/45 + S500 | 2.00 | 1Ø16 | 2.01 | 87.39 | 499.73 | 1.46 | 3.23 | 1Ø16 | 0.52 | 1.16 | 5.47 | 12.81 |
| C35/45 + DIN 4.8 | 3.19 | 1M24 | 3.46 | 96.28 | 508.61 | 2.80 | 3.40 | 1M22 | 0.52 | 1.16 | 5.47 | 12.81 |
| C35/45 + DIN 5.8 | 2.52 | 1M22 | 2.99 | 104.00 | 516.33 | 2.01 | 3.23 | 1M20 | 0.52 | 1.16 | 5.47 | 12.81 |
| C35/45 + DIN 8.8 | 1.55 | 1M18 | 1.89 | 105.18 | 517.52 | 0.98 | 2.76 | 1M14 | 0.52 | 1.16 | 5.47 | 12.81 |
| C45/55 + S400 | 3.01 | 1Ø20 | 3.14 | 109.22 | 639.36 | 2.62 | 4.16 | 1Ø20 | 0.52 | 1.16 | 5.47 | 12.81 |
| C45/55 + S500 | 2.39 | 1Ø20 | 3.14 | 136.52 | 666.67 | 1.87 | 3.89 | 1Ø16 | 0.52 | 1.16 | 5.47 | 12.81 |
| C45/55 + DIN 4.8 | 3.81 | 1M27 | 4.52 | 125.77 | 655.92 | 3.60 | 4.37 | 1M27 | 0.52 | 1.16 | 5.47 | 12.81 |
| C45/55 + DIN 5.8 | 3.01 | 1M24 | 3.46 | 120.35 | 650.49 | 2.62 | 4.16 | 1M22 | 0.52 | 1.16 | 5.47 | 12.81 |
| C45/55 + DIN 8.8 | 1.85 | 1M18 | 2.41 | 134.12 | 664.27 | 1.27 | 3.55 | 1M16 | 0.52 | 1.16 | 5.47 | 12.81 |
| C50/60 + S400 | 3.26 | 1Ø25 | 4.91 | 170.78 | 759.83 | 2.91 | 4.62 | 1Ø20 | 0.52 | 1.16 | 5.47 | 12.81 |
| C50/60 + S500 | 2.58 | 1Ø20 | 3.14 | 136.52 | 725.57 | 2.08 | 4.33 | 1Ø20 | 0.52 | 1.16 | 5.47 | 12.81 |
| C50/60 + DIN 4.8 | 4.12 | 1M27 | 4.52 | 125.77 | 714.82 | 4.00 | 4.86 | 1M27 | 0.52 | 1.16 | 5.47 | 12.81 |
| C50/60 + DIN 5.8 | 3.26 | 1M24 | 3.46 | 120.35 | 709.40 | 2.91 | 4.62 | 1M22 | 0.52 | 1.16 | 5.47 | 12.81 |
| C50/60 + DIN 8.8 | 2.00 | 1M20 | 2.41 | 134.12 | 723.17 | 1.41 | 3.95 | 1M16 | 0.52 | 1.16 | 5.47 | 12.81 |
| C55/67 + S400 | 3.33 | 1Ø25 | 4.91 | 170.78 | 818.74 | 3.02 | 4.91 | 1Ø20 | 0.52 | 1.16 | 5.47 | 12.81 |
| C55/67 + S500 | 2.64 | 1Ø20 | 3.14 | 136.52 | 784.48 | 2.14 | 4.56 | 1Ø20 | 0.52 | 1.16 | 5.47 | 12.81 |
| C55/67 + DIN 4.8 | 4.22 | 1M27 | 4.52 | 125.77 | 773.73 | 4.19 | 5.51 | 1M27 | 0.52 | 1.16 | 5.47 | 12.81 |
| C55/67 + DIN 5.8 | 3.33 | 1M24 | 3.46 | 120.35 | 768.30 | 3.02 | 4.91 | 1M24 | 0.52 | 1.16 | 5.47 | 12.81 |
| C55/67 + DIN 8.8 | 2.05 | 1M20 | 2.41 | 134.12 | 782.08 | 1.43 | 4.11 | 1Ø16 | 0.52 | 1.16 | 5.47 | 12.81 |
| C60/75 + S400 | 3.49 | 1Ø25 | 4.91 | 170.78 | 877.64 | 3.18 | 5.25 | 1Ø25 | 0.52 | 1.16 | 5.47 | 12.81 |
| C60/75 + S500 | 2.77 | 1Ø20 | 3.14 | 136.52 | 843.38 | 2.24 | 4.85 | 1Ø20 | 0.52 | 1.16 | 5.47 | 12.81 |
| C60/75 + DIN 4.8 | 4.42 | 1M27 | 4.52 | 125.77 | 832.63 | 4.43 | 5.59 | 1M27 | 0.52 | 1.16 | 5.47 | 12.81 |
| C60/75 + DIN 5.8 | 3.46 | 1M24 | 3.46 | 120.35 | 827.21 | 3.18 | 5.25 | 1M24 | 0.52 | 1.16 | 5.47 | 12.81 |
| C60/75 + DIN 8.8 | 2.15 | 1M20 | 2.41 | 134.12 | 840.98 | 1.49 | 4.35 | 1M16 | 0.52 | 1.16 | 5.47 | 12.81 |
| C70/85 + S400 | 3.65 | 1Ø25 | 4.91 | 170.78 | 994.45 | 3.57 | 5.98 | 1Ø25 | 0.52 | 1.16 | 5.47 | 12.81 |
| C70/85 + S500 | 2.89 | 1Ø20 | 3.14 | 136.52 | 961.19 | 2.50 | 5.47 | 1Ø20 | 0.52 | 1.16 | 5.47 | 12.81 |
| C70/85 + DIN 4.8 | 4.62 | 1M30 | 5.52 | 153.60 | 978.27 | 5.00 | 6.40 | 1M30 | 0.52 | 1.16 | 5.47 | 12.81 |
| C70/85 + DIN 5.8 | 3.65 | 1M27 | 4.52 | 157.22 | 981.89 | 3.57 | 5.98 | 1M27 | 0.52 | 1.16 | 5.47 | 12.81 |
| C70/85 + DIN 8.8 | 2.24 | 1M20 | 2.41 | 134.12 | 958.79 | 1.65 | 4.89 | 1M18 | 0.52 | 1.16 | 5.47 | 12.81 |
| C80/95 + S400 | 3.81 | 1Ø25 | 4.91 | 170.78 | 1113.26 | 3.99 | 6.75 | 1Ø25 | 0.52 | 1.16 | 5.47 | 12.81 |
| C80/95 + S500 | 3.02 | 1Ø20 | 3.14 | 136.52 | 1079.00 | 2.79 | 6.18 | 1Ø20 | 0.52 | 1.16 | 5.47 | 12.81 |
| C80/95 + DIN 4.8 | 4.82 | 1M30 | 5.52 | 153.60 | 1096.08 | 5.62 | 7.24 | 1M33 | 0.52 | 1.16 | 5.47 | 12.81 |
| C80/95 + DIN 5.8 | 3.81 | 1M27 | 4.52 | 157.22 | 1099.70 | 3.99 | 6.75 | 1M27 | 0.52 | 1.16 | 5.47 | 12.81 |
| C80/95 + DIN 8.8 | 2.34 | 1M20 | 2.41 | 134.12 | 1076.60 | 1.84 | 5.49 | 1M18 | 0.52 | 1.16 | 5.47 | 12.81 |
| C90/105 + S400 | 3.97 | 1Ø25 | 4.91 | 170.78 | 1231.07 | 4.49 | 7.59 | 1Ø25 | 0.52 | 1.16 | 5.47 | 12.81 |
| C90/105 + S500 | 3.14 | 1Ø20 | 3.14 | 136.52 | 1196.81 | 3.14 | 6.95 | 1Ø20 | 0.52 | 1.16 | 5.47 | 12.81 |
| C90/105 + DIN 4.8 | 5.02 | 1M30 | 5.52 | 153.60 | 1213.89 | 6.32 | 8.15 | 1M33 | 0.52 | 1.16 | 5.47 | 12.81 |
| C90/105 + DIN 5.8 | 3.97 | 1M27 | 4.52 | 157.22 | 1217.50 | 4.49 | 7.59 | 1M27 | 0.52 | 1.16 | 5.47 | 12.81 |
| C90/105 + DIN 8.8 | 2.44 | 1M22 | 2.99 | 166.40 | 1226.69 | 2.07 | 6.16 | 1M20 | 0.52 | 1.16 | 5.47 | 12.81 |
Appendix B. CS Cross-Section
| Materials (Concrete + Steel) | Steel Tube | Steel Ratio 1 | Compressive Strength | Tensile Strength | Flexural Strength | MEd | Reef Unit Weight | Reef Unit Cost | |
|---|---|---|---|---|---|---|---|---|---|
| Dext | tw | 0.2 < d < 0.9 | Npl,Rd,comp | Npl,Rd,trac | MRd | ALS_Ewcme | |||
| [mm] | [mm] | [-] | [kN] | [kN] | [kN.m] | [kN.m] | [kg] | [€] | |
| C30/37 S235 | 88.9 | 6 | 0.20 | 493.24 | 210.32 | 13.30 | 12.81 | 167.76 | 52.24 |
| C30/37 S275 | 76.1 | 6.3 | 0.21 | 500.79 | 215.71 | 12.71 | 12.81 | 153.79 | 48.38 |
| 88.9 | 6 | 0.23 | 529.04 | 230.19 | 14.77 | 12.81 | 167.76 | 54.47 | |
| C30/37 S355 | 76.1 | 5 | 0.22 | 515.20 | 227.30 | 13.28 | 12.81 | 153.93 | 42.55 |
| 88.9 | 4 | 0.21 | 507.89 | 219.57 | 13.90 | 12.81 | 168.03 | 40.85 | |
| C30/37 S420 | 60.3 | 5 | 0.20 | 497.91 | 207.13 | 11.57 | 12.81 | 139.72 | 37.81 |
| 76.1 | 4 | 0.21 | 509.91 | 219.73 | 13.09 | 12.81 | 154.05 | 39.23 | |
| 88.9 | 3.2 | 0.20 | 501.36 | 210.76 | 13.59 | 12.81 | 168.14 | 35.77 | |
| C35/45 S275 | 88.9 | 6 | 0.21 | 576.19 | 246.12 | 15.54 | 12.81 | 167.76 | 55.07 |
| C35/45 S355 | 76.1 | 6 | 0.22 | 600.28 | 266.95 | 15.45 | 12.81 | 153.82 | 50.19 |
| 88.9 | 5 | 0.22 | 600.78 | 269.61 | 16.66 | 12.81 | 167.89 | 49.76 | |
| C35/45 S420 | 76.1 | 5 | 0.22 | 604.80 | 268.92 | 15.64 | 12.81 | 153.93 | 47.91 |
| 88.9 | 4 | 0.21 | 596.15 | 259.77 | 16.37 | 12.81 | 168.03 | 46.02 | |
| C45/55 S355 | 88.9 | 6 | 0.21 | 742.10 | 317.72 | 20.04 | 12.81 | 167.76 | 58.56 |
| C45/55 S420 | 76.1 | 6 | 0.20 | 744.39 | 315.82 | 19.32 | 12.81 | 153.82 | 56.00 |
| 88.9 | 5 | 0.21 | 747.33 | 318.98 | 20.24 | 12.81 | 167.89 | 55.51 | |
References
- Ng, K.; Phillips, M.R.; Calado, H.; Borges, P.; Veloso-gomes, F. Seeking harmony in coastal development for small islands: Exploring multifunctional artificial reefs for São Miguel Island, the Azores. Appl. Geogr. 2013, 44, 99–111. [Google Scholar] [CrossRef]
- López, I.; Tinoco, H.; Aragonés, L.; García-barba, J. The multifunctional artificial reef and its role in the defence of the Mediterranean coast. Sci. Total Environ. 2016, 550, 910–923. [Google Scholar] [CrossRef] [PubMed]
- Dafforn, K.A.; Glasby, T.M.; Airoldi, L.; Rivero, N.K.; Mayer-pinto, M.; Johnston, E.L. Marine urbanization: An ecological framework for designing multifunctional artificial structures. Front. Ecol. Environ. 2015, 13, 82–90. [Google Scholar] [CrossRef]
- Lee, M.O.; Otake, S.; Kim, J.K. Transition of artificial reefs (ARs) research and its prospects. Ocean Coast. Manag. 2018, 154, 55–65. [Google Scholar] [CrossRef]
- Pörtner, H.O.; Roberts, D.C.; Masson-Delmotte, V.P.; Zhai, P.; Tignor, E.; Poloczanska, E.; Mintenbeck, K.; Nicolai, M.; Okem, A.; Petzold, J.; et al. The Ocean and Cryosphere in a Changing Climate; Cambridge University Press: Cambridge, UK, 2019. [Google Scholar]
- Bracho-Villavicencio, C.; Matthews-Cascon, H.; Rossi, S. Artificial Reefs around the World: A Review of the State of the Art and a Meta-Analysis of Its Effectiveness for the Restoration of Marine Ecosystems. Environments 2023, 10, 121. [Google Scholar] [CrossRef]
- Kim, Y.C. Handbook of Coastal and Ocean Engineering; World Scientific Publishing Company: Singapore, 2010. [Google Scholar]
- Ergin, S.; Soares, C.G. Sustainable Development and Innovations in Marine Technologies. Sustain. Dev. Innov. Mar. Technol. 2022, 9, 474. [Google Scholar] [CrossRef]
- Carral, L.; Alvarez-feal, J.C.; Tarrio-Saavedra, J. Social interest in developing a green modular arti fi cial reef structure in concrete for the ecosystems of the Galician rías. J. Clean. Prod. 2018, 172, 1881–1898. [Google Scholar] [CrossRef]
- Ramos, J.; Lino, P.G.; Himes-cornell, A.; Santos, M.N. Local fishermen’s perceptions of the usefulness of artificial reef ecosystem services in Portugal. PeerJ 2019, 6, e6206. [Google Scholar] [CrossRef]
- Cruz, F.; Pereira, E.; Valente, I.B.; Tiago, M.; Maslov, D.; Pinheiro, M. Structural Design of an Innovative Multifunctional Artificial Reef; Oceans 2018 MTS/IEEE Charleston; IEEE: Charleston, SC, USA, 2018; pp. 1–7. [Google Scholar] [CrossRef]
- Boakes, Z.; Hall, A.E.; Ampou, E.E.; Jones, G.C.A.; Suryaputra, I.G.N.A.; Mahyuni, L.P.; Prasetijo, R.; Stafford, R. Coral reef conservation in Bali in light of international best practice, a literature review. J. Nat. Conserv. 2022, 67, 126190. [Google Scholar] [CrossRef]
- Li, Y.; Ren, N.; Li, X.; Ou, J. Hydrodynamic Analysis of a Novel Modular Floating Structure System Integrated with Floating Artificial Reefs and Wave Energy Converters. J. Mar. Sci. Eng. 2022, 10, 1091. [Google Scholar] [CrossRef]
- De Almeida, J.L. REEFS: An artificial reef for wave energy harnessing and shore protection—A new concept towards multipurpose sustainable solutions. Renew. Energy 2017, 114, 817–829. [Google Scholar] [CrossRef]
- Bohnsack, J.A.; Sutherland, D.L. Artificial reef research: A review with recommendations for future priorities. Bull. Mar. Sci. 1985, 37, 11–39. [Google Scholar]
- Kirkbride-Smith, A.E. The Economic, Social and Conservation Benefits of Recreation-orientated Artificial Reefs. Ph.D. Thesis, University of Hull, Hull, UK, 2014. [Google Scholar]
- Ten Voorde, M. Contribution to the design of Multi-Functional Artificial Reefs. Ph.D. Thesis, University of Coimbra, Coimbra, Portugal, 2009. [Google Scholar]
- Vieira, B.F.V.; Pinho, J.L.S.; Barros, J.A.O.; Antunes do Carmo, J.S. Hydrodynamics and morphodynamics performance assessment of three coastal protection structures. J. Mar. Sci. Eng. 2020, 8, 175. [Google Scholar] [CrossRef]
- Vieira, B. Engineering with Nature: An Innovative Solution for Coastal Erosion Protection. Ph.D. Thesis, University of Minho, Largo do Paço, Braga, 2023. [Google Scholar]
- Fabi, G.; Spagnolo, A.; Bellan-santini, D.; Charbonnel, E.; Çiçek, B.A.; García, J.J.G.; Jensen, A.C.; Kallianiotis, A.; Santos, M.N. Overview on artificial reefs in Europe. Brazilian J. Oceanogr. 2011, 59, 155–166. [Google Scholar] [CrossRef]
- Silva, J.; Rosental, I.; Love, M. Overview and trends of ecological and socioeconomic research on artificial reefs. Mar. Environ. Res. 2019, 145, 81–96. [Google Scholar] [CrossRef]
- Dini, E.; Nuzzolese, M.; Cafaro, F.; Lernia, A.; Gadaleta, A.; Sollecito, F. Subsidence of Artificial Reefs with Bamboo Foundations on a Soft Seabed. Appl. Sci. 2024, 14, 720. [Google Scholar] [CrossRef]
- Wang, F.; Feng, Y.; Liu, S.; Chen, Y.; Ding, J. Artificial Fish Reef Site Evaluation Based on Multi-Source High-Resolution Acoustic Images. J. Mar. Sci. Eng. 2025, 13, 309. [Google Scholar] [CrossRef]
- Broomfield, J.P. Chapter 9 Galvanized Steel Reinforcement in Concrete: A Consultant’s Perspective; Elsevier Science: Amsterdam, The Netherlands, 2004. [Google Scholar]
- Reeds, K.A.; Smith, J.A.; Suthers, I.M.; Johnston, E.L. An ecological halo surrounding a large offshore artificial reef: Sediments, infauna, and fish foraging. Mar. Environ. Res. 2018, 141, 30–38. [Google Scholar] [CrossRef]
- Mendonça, A.; Neves, M.G.; Mendonça, A.; Fortes, C.J.; Carmo, J.S.A.D.; Moura, T. Hydrodynamics around an Artificial Surfing Reef at Leirosa, Portugal. J. Waterw. Port. Coast. Ocean. Eng. 2012, 138, 226–235. [Google Scholar] [CrossRef]
- Soon, C.; Ng, L.; Chou, L.M. Artificial reefs as a reef restoration strategy in sediment—Affected environments: Insights from long—Term monitoring. Aquat. Conserv. Mar. Freshw. Ecosyst. 2017, 27, 976–985. [Google Scholar] [CrossRef]
- Cruz, F.; Valente, I.; Almeida, J.; Neves, A.; Pereira, E. Experimental characterization of bond between concrete and HDG steel tubes for mixed steel—Concrete structures. Mater. Struct. 2024, 57, 89. [Google Scholar] [CrossRef]
- UNEP-MAPUNEP-MAP. Guidelines for the Placement at Sea of Matter for Purpose Other Than the Mere Disposal (Construction of Artificial Reefs); UNEP-MAP: Athens, Greece, 2005. [Google Scholar]
- Fabi, G.; Scarcella, G.; Spagnolo, A.; Stephen, A.B.; Charbonnel, E.; Goutayer, J.J.; Haddad, N.; Altan, L.; Michel, T. Pratical guidelines for the use of artificial reefs in the Mediterranean and the Black sea. Rome Stud. Rev. 2015, 96, 1. [Google Scholar]
- Great Barrier Reef Marine Park Authority. Guidelines for the Management of Artificial Reefs in Great Barrier Reef Marine Park; Great Barrier Reef Marine Park Authority: Townsville City, QLD, Australia, 2011; pp. 1–6. [Google Scholar]
- Florida, S.; Reef, C.; Industry, M. Guidelines and Management Practices for Artificial Reef Siting, Use, Construction, and Anchoring in Southeast Florida; Florida Department of Environmental Protection: Tallahassee, FL, USA, 2011. [Google Scholar]
- Vogler, V. A New Framework for Artificial Coral Reef Design. J. Digit. Landsc. Archit. 2022, 2022, 524–537. [Google Scholar] [CrossRef]
- Vogler, V. A Framework for Artificial Coral Reef Design: Integrating Computational Modelling and High Precision Monitoring Strategies for Artificial Coral Reefs—An Ecosystem-Aware Approach. Ph.D. Thesis, Bauhaus-Universität Weimar, Faculty of Architecture and Urban Planning, Weimar, Germany, 2021. Available online: https://www.db-thueringen.de/receive/dbt_mods_00061874 (accessed on 18 May 2025).
- Carral, L.; Lamas, M.I.; Barros, J.J.C.; López, I.; Carballo, R. Proposed Conceptual Framework to Design Artificial Reefs Based on Particular Ecosystem Ecology Traits. Biology 2022, 11, 680. [Google Scholar] [CrossRef]
- Carral, L.; Alvarez-Feal, C.; Jesús Rodríguez-Guerreiro, M.; Vargas, A.; Arean, N.; Carballo, R. Methodology for positioning a group of green artificial reef based on a database management system, applied in the estuary of Ares-Betanzos (Nw Iberian Peninsula). J. Clean. Prod. 2019, 233, 1047–1060. [Google Scholar] [CrossRef]
- Antunes do Carmo, J.S.; Neves, M.G.; tenVoorde, M. Designing a multifunctional artificial reef: Studies on the influence of parameters with most influence in the vertical plane. J. Coast. Conserv. 2011, 15, 99–112. [Google Scholar] [CrossRef]
- Jackson, A.; Tomlinson, R.; Corbett, B.; Strauss, D. Long term performance of a submerged coastal control structure: A case study of the Narrowneck multifunctional artificial reef. Coast. Eng. Proc. 2012, 1, 1–13. [Google Scholar] [CrossRef]
- Charbonnel, E.; Serre, C.; Ruitton, S.; Harmelin, J.G.; Jensen, A. Effects of increased habitat complexity on fish assemblages associated with large artificial reef units (French Mediterranean coast). ICES J. Mar. Sci. 2002, 59, 208–213. [Google Scholar] [CrossRef]
- Pondella, D.J.; Claisse, J.T.; Williams, C.M. Theory, practice, and design criteria for utilizing artificial reefs to increase production of marine fishes. Front. Mar. Sci. 2022, 9, 983253. [Google Scholar] [CrossRef]
- Stolk, P.; Markwell, K.; Jenkins, J.M. Artificial reefs as recreational scuba diving resources: A critical review of research. J. Sustain. Tour. 2007, 15, 331–350. [Google Scholar] [CrossRef]
- London Convention and Protocol/UNEP. London Convention and Protocol/UNEP Guidelines for the Placement of Artificial Reefs; International Maritime Organization: London, UK, 2009; 100p, ISBN 978-92-807-3022-7. Available online: https://wwwcdn.imo.org/localresources/en/OurWork/Environment/Documents/London_convention_UNEP_Low-res-Artificial%20Reefs.pdf (accessed on 18 May 2025).
- OSPAR Commission. OSPAR Guidelines on Artificial Reefs in Relation to Living Marine Resources; OSPAR Commission: London, UK, 2013; Volume 1. [Google Scholar]
- Maslov, D.; Johnson, J.; Pereira, E.; Duarte, D.; Miranda, T.; Lima, M.; Cruz, F.; Valente, I.; Pinheiro, M. Experimental Testing and CFD Modelling for Prototype Design of Innovative Artificial Reef Structures. In Proceedings of the OCEANS 2019, Marseille, France, 17–20 June 2019; pp. 1–7. [Google Scholar] [CrossRef]
- Maslov, D.; Pereira, E.; Duarte, D.; Miranda, T.; Ferreira, V.; Tieppo, M.; Cruz, F.; Johnson, J. Numerical analysis of the flow field and cross section design implications in a multifunctional artificial reef. Ocean. Eng. 2023, 272, 113817. [Google Scholar] [CrossRef]
- Androulakis, D.N.; Dounas, C.G.; Banks, A.C.; Magoulas, A.N.; Margaris, D.P. An assessment of computational fluid dynamics as a tool to aid the design of the HCMR-artificial-reefsTM diving oasis in the Underwater Biotechnological Park of Crete. Sustainability 2020, 12, 4847. [Google Scholar] [CrossRef]
- Jiang, Z.; Liang, Z.; Zhu, L.; Guo, Z.; Tang, Y. Effect of hole diameter of rotary-shaped artificial reef on flow field. Ocean Eng. 2020, 197, 106917. [Google Scholar] [CrossRef]
- Liu, Y.; Dong, G.; Zhao, Y. The Investigation of the Hydrodynamics of an Artificial Reef; INTECH Open Access Publisher: London, UK, 2007. [Google Scholar]
- Galdo, M.I.L.; Guerreiro, M.J.R.; Vigo, J.L.; Rodriguez, I.A.; Lorenzo, R.V.; Couce, J.C.C.; Couce, L.C. Definition of an Artificial Reef Unit through Hydrodynamic and Structural (CFD and FEM) Models—Application to the Ares-Betanzos Estuary. J. Mar. Sci. Eng. 2022, 10, 230. [Google Scholar] [CrossRef]
- Xue, D.; Wang, C.; Huang, T.; Pan, Y.; Zhang, N.; Zhang, L. Flow field effects and physical stability of pyramidal artificial reef with different slope angles. Ocean. Eng. 2023, 283, 115059. [Google Scholar] [CrossRef]
- Jang, S.; Jeong, J.; Lee, S.; Kim, D. Identifying Hydraulic Characteristics Related to Fishery Activities Using Numerical Analysis and an Automatic Identification System of a Fishing Vessel. J. Mar. Sci. Eng. 2022, 10, 1619. [Google Scholar] [CrossRef]
- Shu, A.; Qin, J.; Rubinato, M.; Sun, T.; Wang, M.; Wang, S.; Wang, L.; Zhu, J.; Zhu, F. An Experimental Investigation of Turbulence Features Induced by Typical Artificial M-Shaped Unit Reefs. Appl. Sci. 2021, 11, 21. [Google Scholar] [CrossRef]
- Cruz, F.; Pereira, E.; Lima, M.; Johnson, J.; Duarte, D.; Valente, I.B.; Miranda, T.; Maslov, D.; Pinheiro, M. Experimental Characterization of the Scour of Innovative Artificial Reef Prototypes Using Hydraulic Flume and Photogrammetry. In Proceedings of the OCEANS 2019, Marseille, France, 17–20 June 2019; pp. 1–10. [Google Scholar] [CrossRef]
- Galdo, L.; Carballo, R. Numerical and Experimental Analysis of the Velocity Field Inside an Artificial Reef. Application to the Ares-Betanzos Estuary. J. Mar. Sci. Eng. 2022, 10, 1827. [Google Scholar] [CrossRef]
- Kertorahardjo, S.P.; Vincent, H.; Duta, P.H. Structure Analysis on Artificial Reefs. Appl. Mech. Mater. 2018, 874, 27–34. [Google Scholar] [CrossRef]
- Jin, L.; Du, L.; Zhou, Z.; Bao, X. Peak Acceleration Distribution on the Surface of Reef Islands under the Action of Vertical Ground Motion. Appl. Sci. 2024, 14, 2515. [Google Scholar] [CrossRef]
- Maslov, D.; Cruz, F.; Pinheiro, M.; Miranda, T.; Valente, I.B.; Ferreira, V.; Pereira, E. Functional Conception of Biomimetic Artificial Reefs Using Parametric Design and Modular Construction. J. Mar. Sci. Eng. 2024, 12, 1682. [Google Scholar] [CrossRef]
- Gomes, A.C.; Pinho, J.L.d.S.; Granja, H.P. Caracterização Da Morfodinâmica De Praias Sob Influência De Cilindros Geossintéticos: Caso De Estudo Da Praia De Ofir, Portugal. Rev. Eletrônica Gestão e Tecnol. Ambient. 2020, 8, 5. [Google Scholar] [CrossRef]
- Loureiro, E. Indicadores Geomorfológicos e Sedimentológicos na Avaliação da Tendência Evolutiva da Zona Costeira (Aplicação ao Concelho de Esposende); Universidade do Minho: Braga, Portugal, 2006. [Google Scholar]
- Mendes, R.P.G. Energia das Ondas Desenvolvimento de uma Tecnologia de Geração (Gerador Tubular); Universidade da Beira Interior: Covilhã, Portugal, 2011. [Google Scholar]
- Vieira, F.V. Extreme wave value analysis under uncertainty of climate change scenarios off Iberian Peninsula coast. Ocean. Eng. 2021, 229, 15. [Google Scholar] [CrossRef]
- Sorensen, R.M. Basic Coastal Engineering, 3rd ed.; Springer Science & Business Media: Berlin/Heidelberg, Germany, 2005. [Google Scholar]
- Petroleum Institute (API). API RECOMMENDED PRACTICE 2A-WSD: Planning, Designing, and Constructing Fixed Offshore Platforms—Working Stress Design, 22nd ed.; API Publishing Services: Chicago, IL, USA, 2014; pp. 1–324. [Google Scholar]
- Chakrabarti, S.K. Handbook of Offshore Engineering, 1st ed.; Elsevier: Amsterdam, The Netherlands, 2005; Volume I. [Google Scholar]
- DNV-RP-C205: Environmental Conditions and Environmental Loads; Det Norske Veritas (DNV): Høvik, Norway, 2010; pp. 1–124.
- ISO 19903:2006; Petroleum and Natural Gas Industries—Fixed Steel Offshore Structures. International Organization for Standardization: Geneva, Switzerland, 2006.
- EN 1992-1-1; Eurocode 2: Design of Concrete Structures—Part 1-1: General Rules and Rules for Buildings. European Committee for Standardization (CEN): Plzen, Czech Republic, 2004; p. 225.
- EN 1990; Eurocode 0: Basis of Structural Design. European Committee for Standardization (CEN): Plzen, Czech Republic, 2013; pp. 92–126. [CrossRef]
- NP EN 206-1; ConcretePart 1: Specification, Performance, Production and Conformity. European Committee for Standardization (CEN): Brussels, Belgium, 2005; pp. 1–29.
- EN 1994-1-1; Eurocode 4: Design of Composite Steel and Concrete Structures—Part 1-1: General Rules and Rules for Buildings. European Committee for Standardization (CEN): Brussels, Belgium, 2007; pp. 1–9.
- Cruz, F.; Valente, I.B.; Monteiro, F.; Maslov, D.; Miranda, T.; Pereira, E.B. Development and characterization of structural connections for modular artificial reefs. Ocean. Eng. 2025, 320, 120311. [Google Scholar] [CrossRef]
- Maslov, D.; Pereira, E.; Miranda, T.; Valente, I.B.; Cruz, F.; Pinheiro, M. Innovative monitoring strategies for multifunctional artificial reefs. In Proceedings of the OCEANS 2018 MTS/IEEE Charleston, Charleston, SC, USA, 22–25 October 2018; pp. 1–8. [Google Scholar]
| Characteristic Event Ew | Typical Storm Condition Ew,storm | Extreme Storm Condition Ew,máxstorm | Abnormal Extreme Condition Ew,e |
|---|---|---|---|
| HS = 2.20 m | HS,storm = 4 m | HS,máxstorm = 9 m | HS,40 = 15.61 m |
| T = 7.89 s | T = 10 s | T = 14.6 s | Tp,40 = 20 s |
| Quantity | 1st Order Component | 2nd Order Component |
|---|---|---|
| Dispersion Relationship, | ||
| Wave profile, η | ||
| Horizontal velocity, | ||
| Vertical velocity, | ||
| Horizontal acceleration, | ||
| Vertical acceleration, | ||
| Dynamic pressure, |
| Load Combination | Ur | N− | N+ | V2-2− | V2-2+ | V3-3− | V3-3+ | M2-2− | M2-2+ | M3-3− | M3-3+ | T− | T+ |
|---|---|---|---|---|---|---|---|---|---|---|---|---|---|
| [mm] | [kN] | [kN] | [kN] | [kNm] | [kNm] | [kNm] | |||||||
| Type of support: double support | |||||||||||||
| LC1_ULS(A)_Ewcm_dXX | 0.09 | −26.89 | - | −1.17 | 1.00 | −0.29 | 0.44 | −0.15 | 0.13 | −0.24 | 0.37 | −0.08 | 0.06 |
| LC2_ULS(B)_Ewcm_dXX | 0.14 | −46.37 | - | −1.62 | 1.38 | −0.73 | 1.08 | −0.37 | 0.25 | −0.24 | 0.52 | −0.11 | 0.08 |
| LC3_ULS(A)_Ewcm,storm_dXX | 0.12 | −28.32 | - | −1.96 | 1.97 | −0.51 | 0.81 | −0.27 | 0.21 | −0.47 | 0.61 | −0.13 | 0.08 |
| LC4_ULS(B)_Ewcm,storm_dXX | 0.22 | −49.32 | - | −3.22 | 3.33 | −1.14 | 1.76 | −0.59 | 0.38 | −0.84 | 1.16 | −0.20 | 0.15 |
| LC5_ULS(A)_Ewcm,máxstorm_dXX | 0.42 | −38.23 | - | −8.53 | 8.53 | −2.32 | 3.03 | −1.07 | 1.02 | −2.75 | 2.93 | −0.44 | 0.43 |
| LC6_ULS(B)_Ewcm,máxstorm_dXX | 0.79 | −67.99 | - | −15.43 | 15.51 | −4.05 | 5.88 | −2.00 | 1.89 | −5.08 | 5.47 | −0.81 | 0.81 |
| LC7_ALS_Ewcme_dXX | 1.79 | −86.05 | - | −36.43 | 36.43 | −11.14 | 12.65 | −4.70 | 4.61 | −12.46 | 12.81 | −1.94 | 1.94 |
| Critical section | - | Support leg | Connection Leg zone | Support leg | Central node | Connection Leg zone | Connection leg zone | ||||||
| RC | CS | ||
|---|---|---|---|
 |  | ||
| As,min | (2) | ||
| Npl,Rd,trac | (3) | ||
| Npl,Rd,comp | (4) | ||
| (5) | ||
| (6) | ||
| (7) |
| RC Structure | CS Structure | ||
|---|---|---|---|
| Mcr | (8) | ||
| As,min | (9) | ||
| MRd |
|
| (10) |
| As | (11) | ||
| Condition | |λ = 0.8|η = 0.9 | |λ = 1.0|η = 0.85 | |
| Validation | |||
Disclaimer/Publisher’s Note: The statements, opinions and data contained in all publications are solely those of the individual author(s) and contributor(s) and not of MDPI and/or the editor(s). MDPI and/or the editor(s) disclaim responsibility for any injury to people or property resulting from any ideas, methods, instructions or products referred to in the content. |
© 2025 by the authors. Licensee MDPI, Basel, Switzerland. This article is an open access article distributed under the terms and conditions of the Creative Commons Attribution (CC BY) license (https://creativecommons.org/licenses/by/4.0/).
Share and Cite
Cruz, F.; Valente, I.B.; Maslov, D.; Miranda, T.; Pereira, E.B. Engineering-Driven Approach for the Structural Design of Geometrically Complex Modular Artificial Reefs. Appl. Sci. 2025, 15, 5907. https://doi.org/10.3390/app15115907
Cruz F, Valente IB, Maslov D, Miranda T, Pereira EB. Engineering-Driven Approach for the Structural Design of Geometrically Complex Modular Artificial Reefs. Applied Sciences. 2025; 15(11):5907. https://doi.org/10.3390/app15115907
Chicago/Turabian StyleCruz, Fábio, Isabel B. Valente, Dmytro Maslov, Tiago Miranda, and Eduardo B. Pereira. 2025. "Engineering-Driven Approach for the Structural Design of Geometrically Complex Modular Artificial Reefs" Applied Sciences 15, no. 11: 5907. https://doi.org/10.3390/app15115907
APA StyleCruz, F., Valente, I. B., Maslov, D., Miranda, T., & Pereira, E. B. (2025). Engineering-Driven Approach for the Structural Design of Geometrically Complex Modular Artificial Reefs. Applied Sciences, 15(11), 5907. https://doi.org/10.3390/app15115907