
Crack-Based Estimation of Seismic Damage Level in Confined Masonry Walls in the Lima Metropolitan Area Using Deep Learning Techniques

 , ,
, ,
Abstract
1. Introduction
2. Experimental Basis and Structural Characterization of Confined Masonry Walls
2.1. Construction Practice
2.2. Cyclic Lateral Loading Test on Full-Scale Confined Masonry Walls
2.3. Selected Confined Masonry Walls Database and Crack Amount
2.3.1. Description of the Experimental Database
2.3.2. Cumulative Crack Length
2.4. Damage Level Classification
3. Crack Pattern Identification
3.1. Crack Labeling
3.2. Deep Learning Model
3.3. Experimental Setup
3.4. Hyper Parameter Details
3.5. Dataset and Training
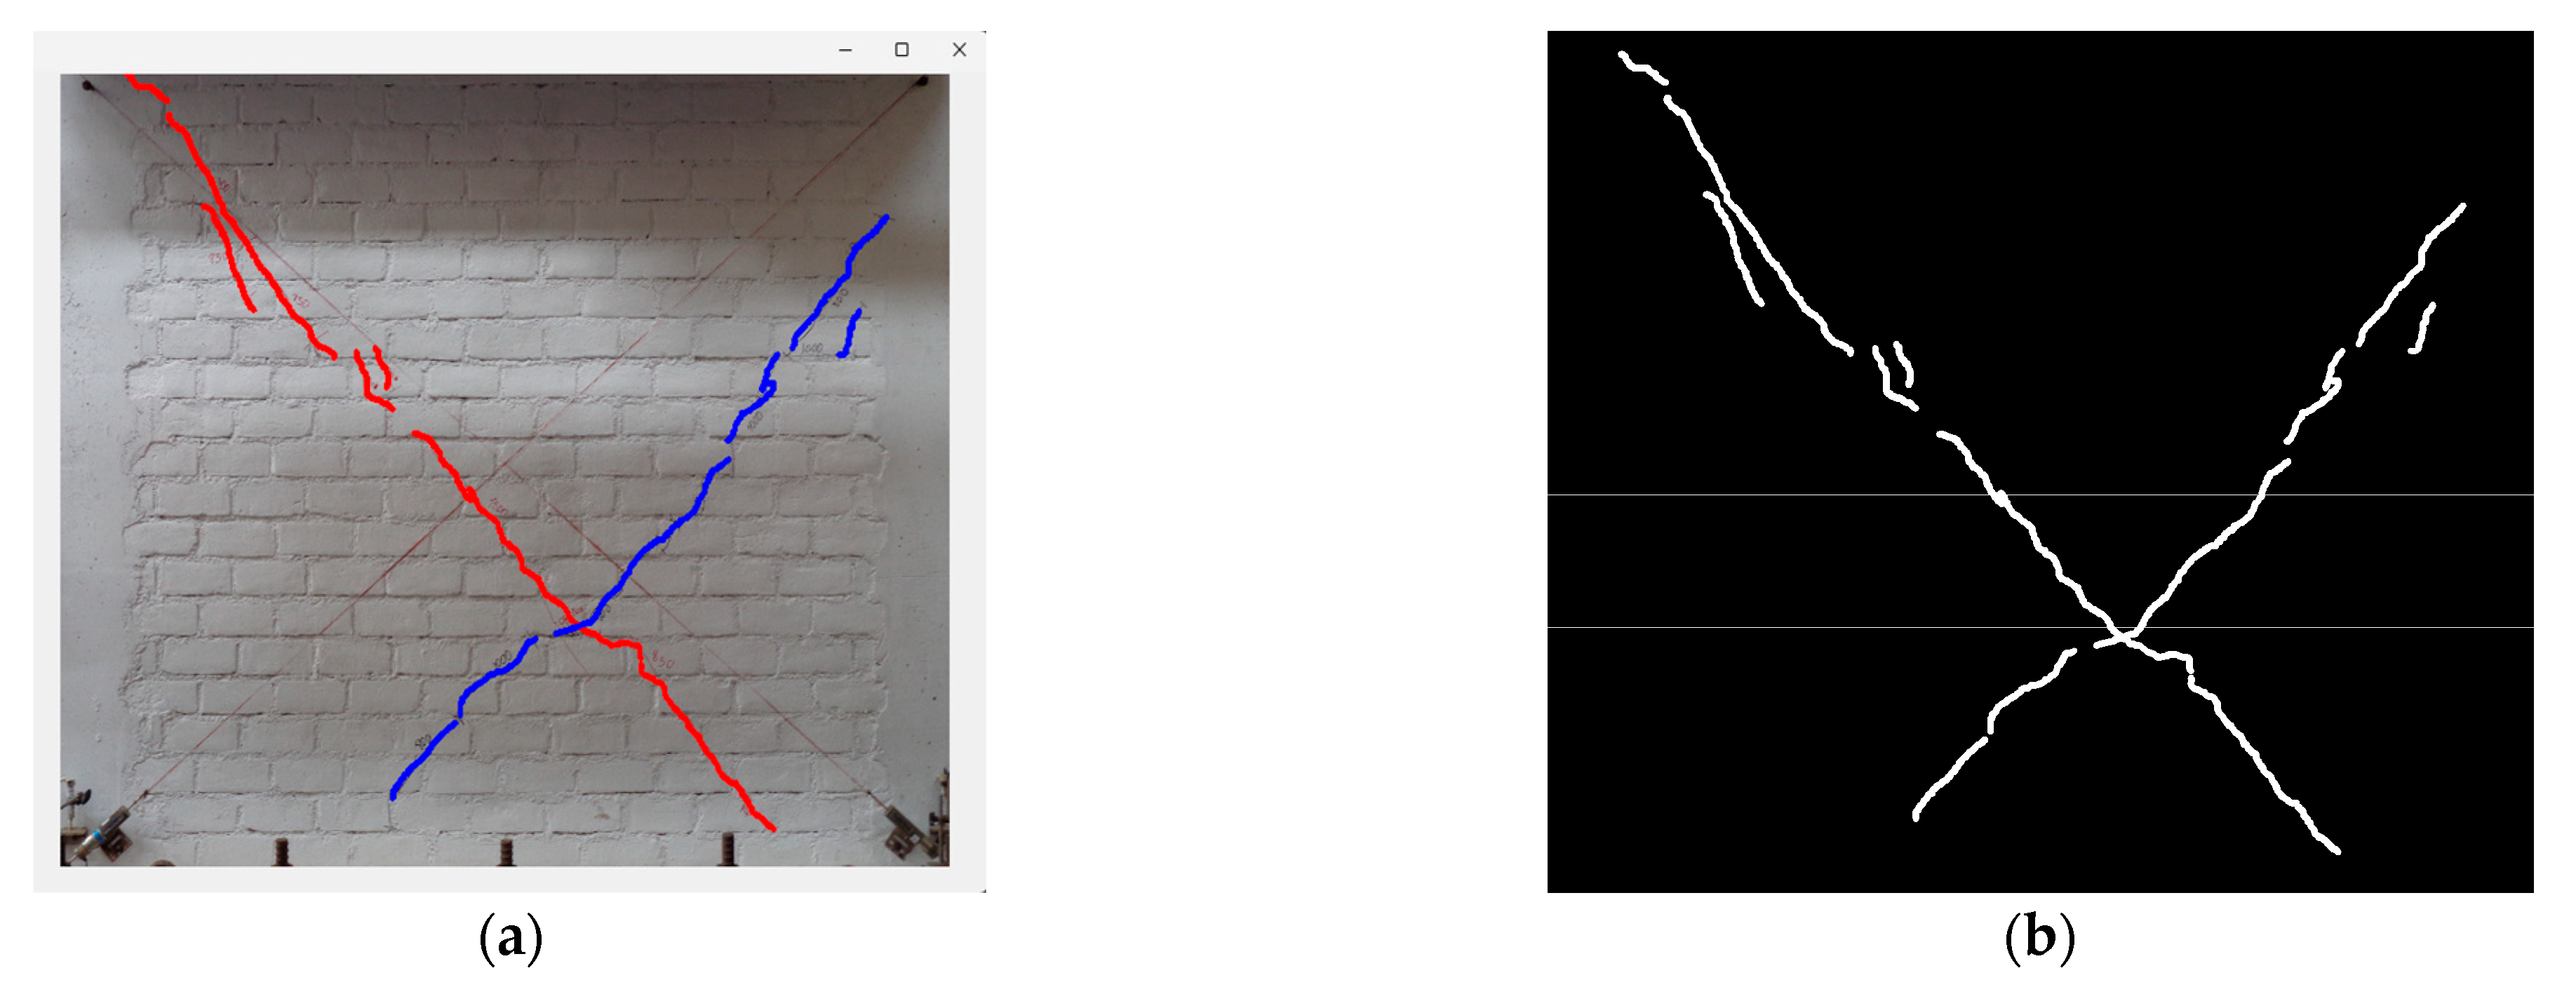
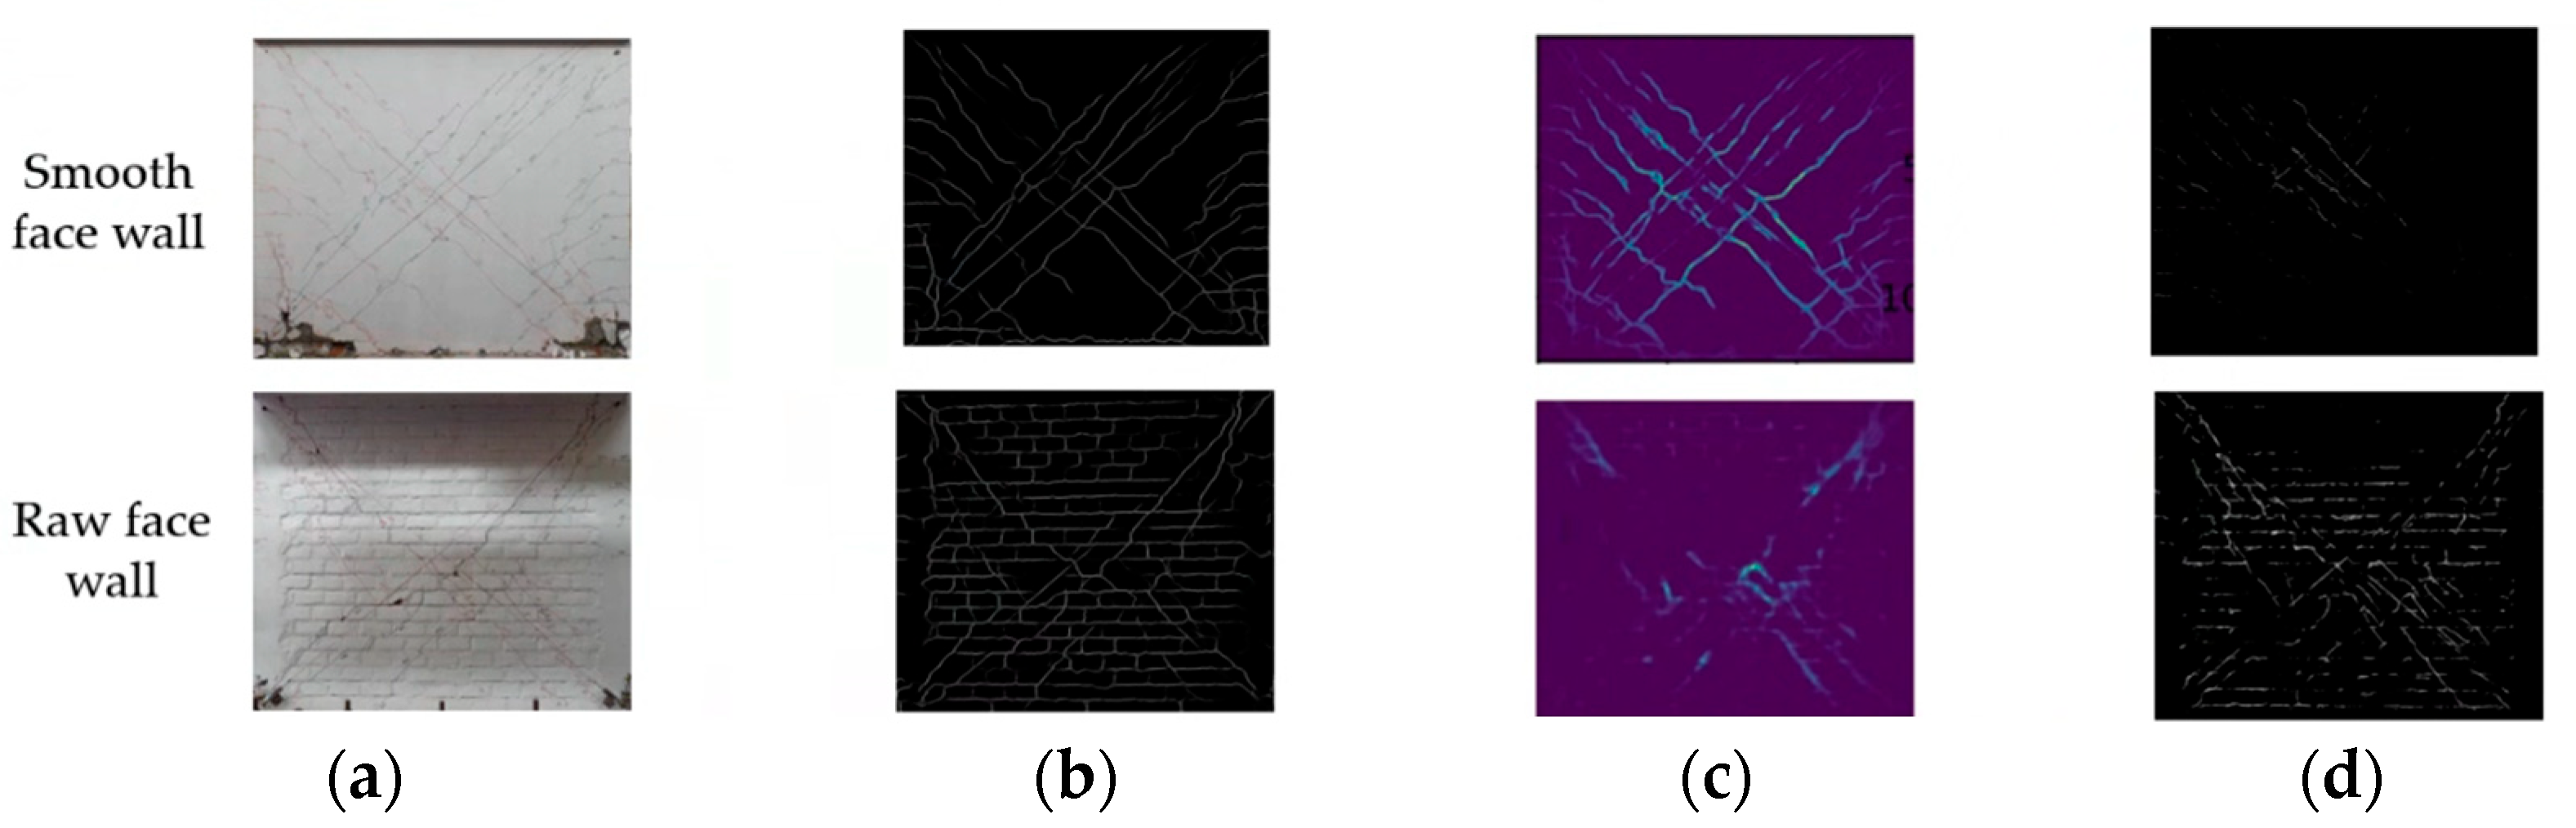
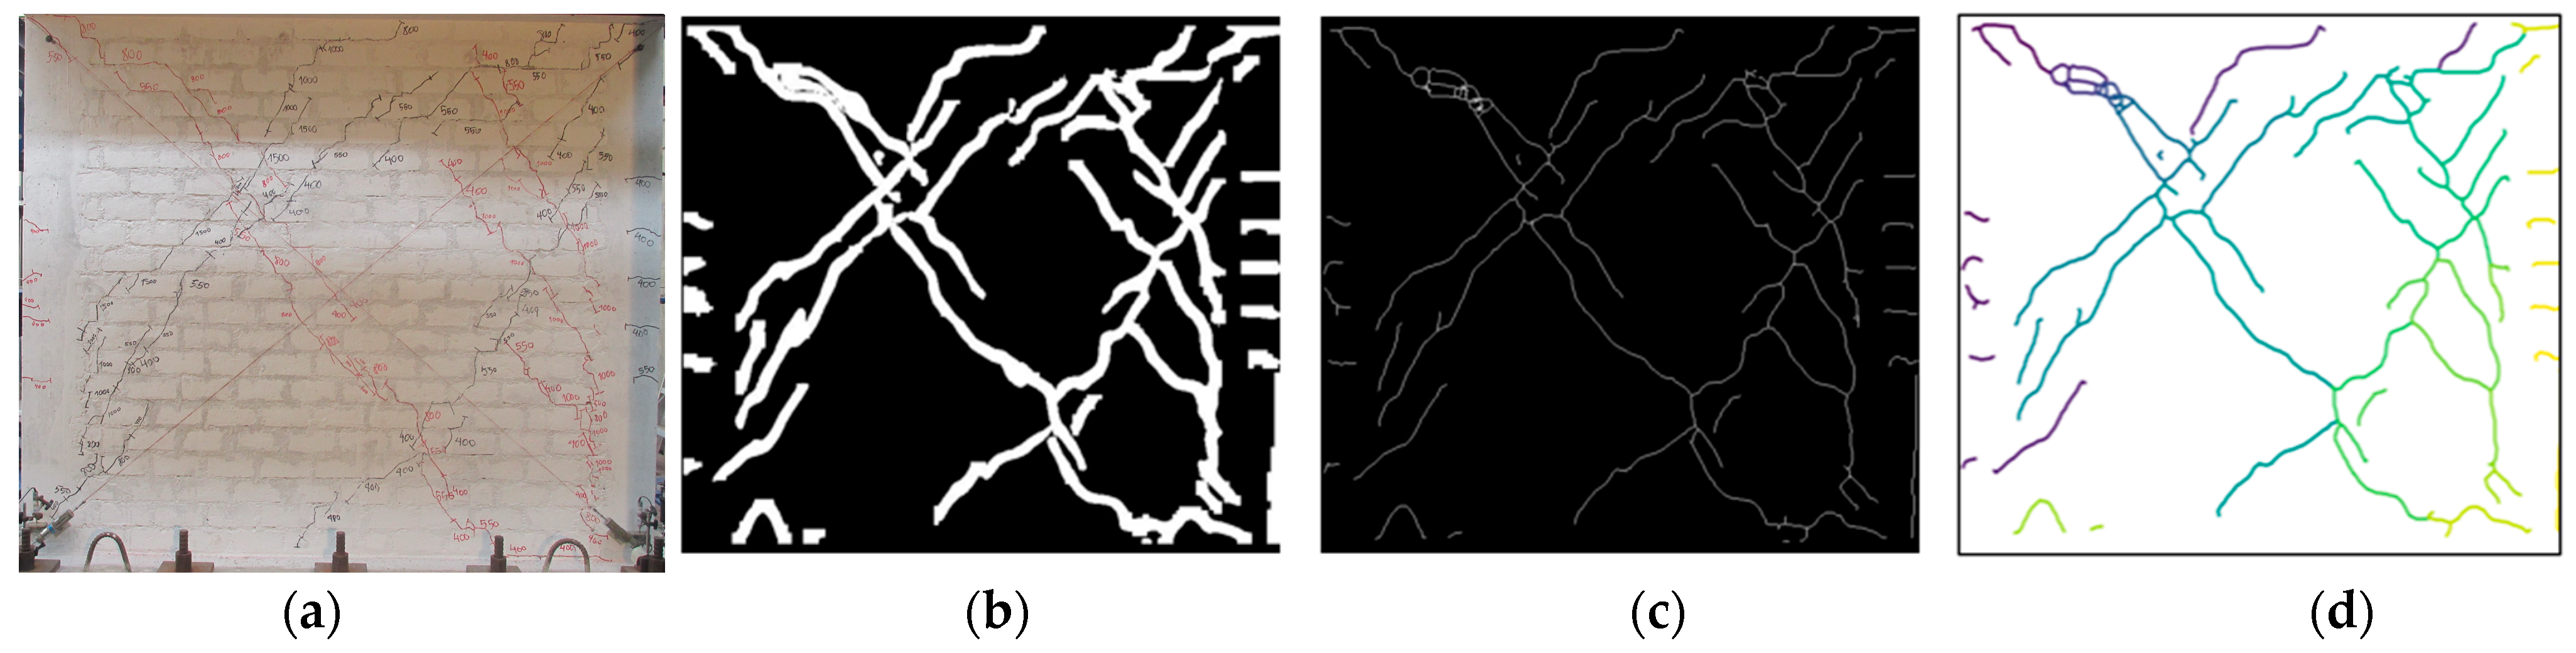
3.6. Skeleton Algorithm
4. Crack Length Ratio and Damage Index Correlation
5. Results and Discussion
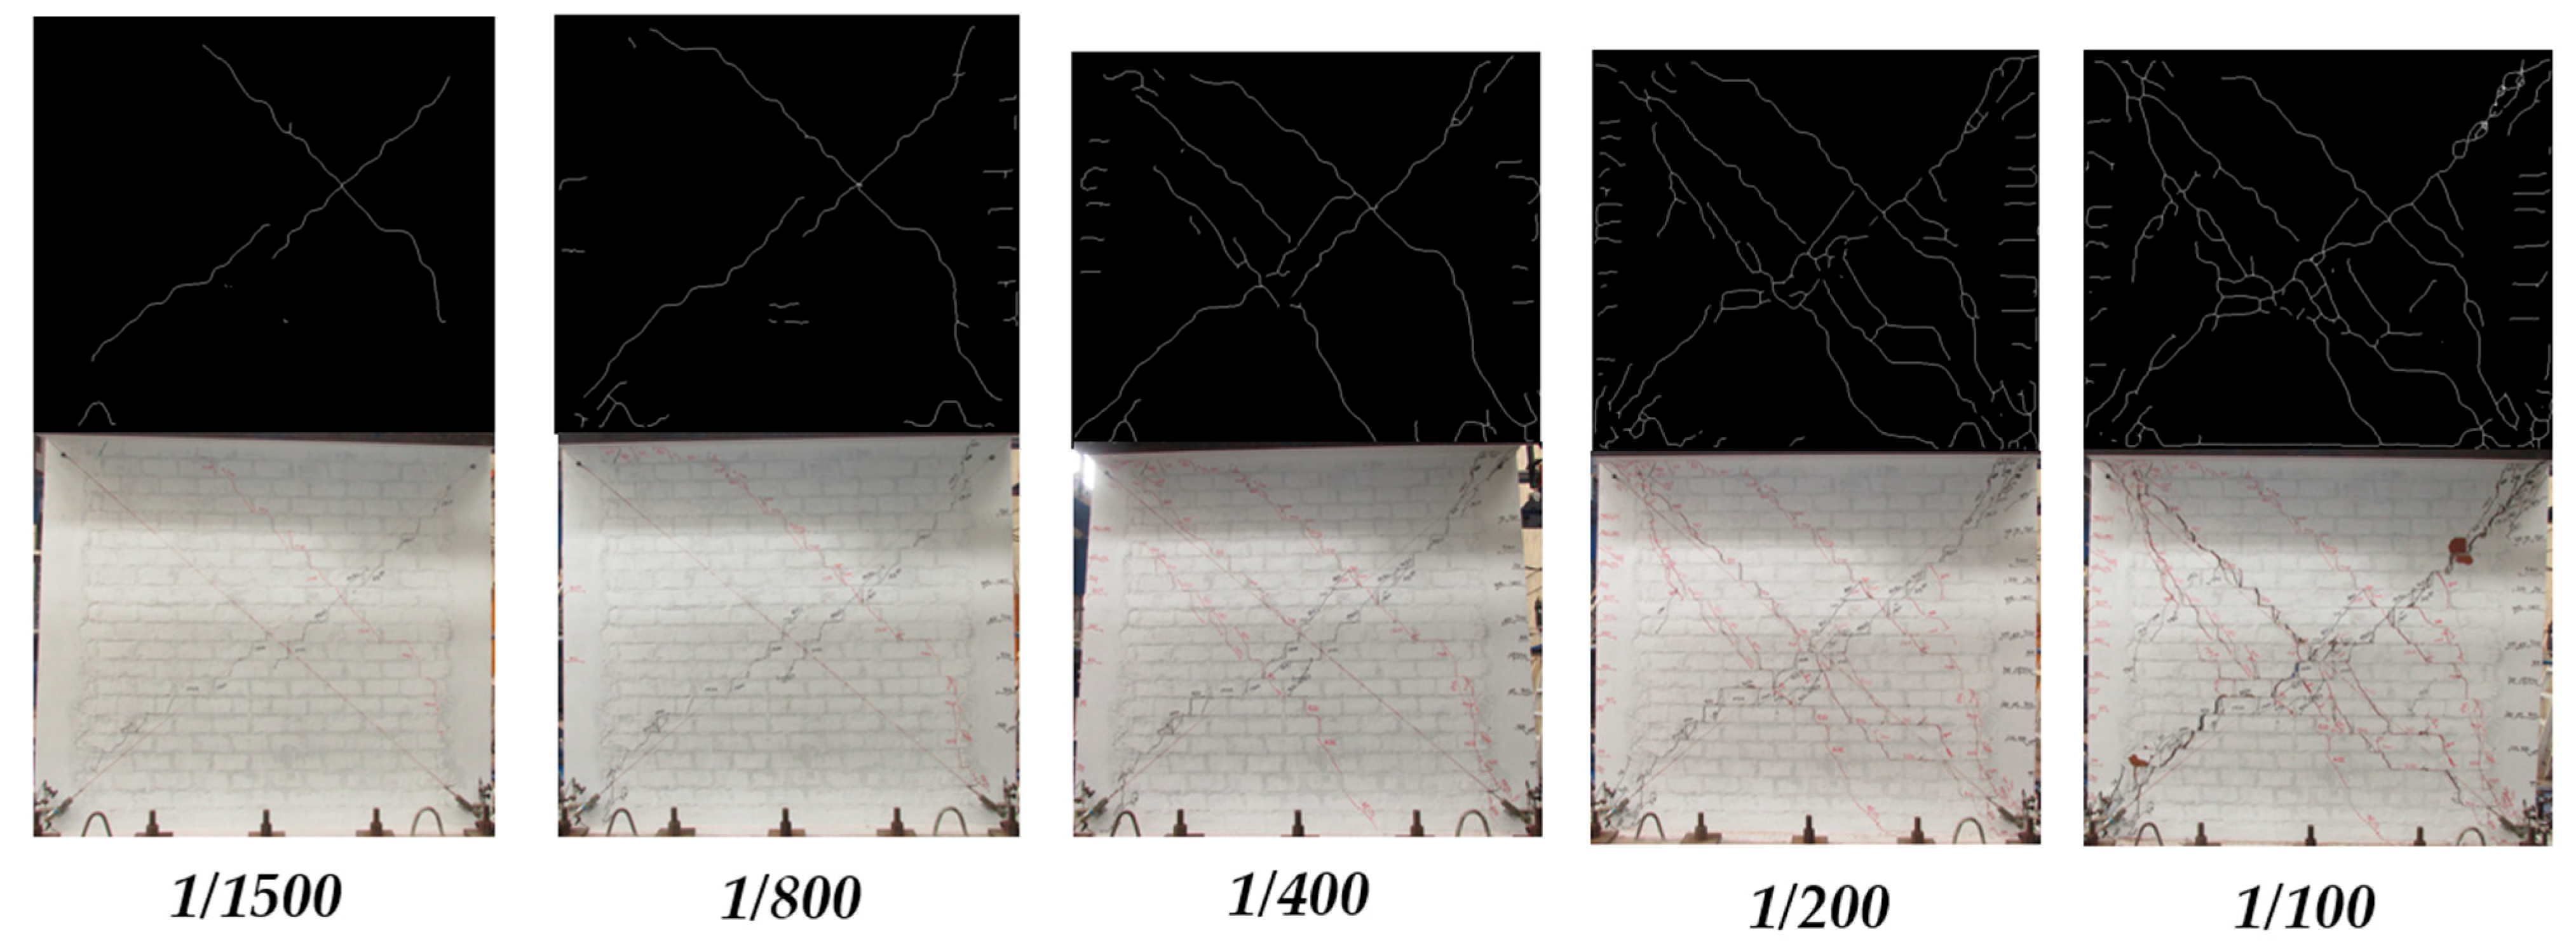
5.1. Model Validation
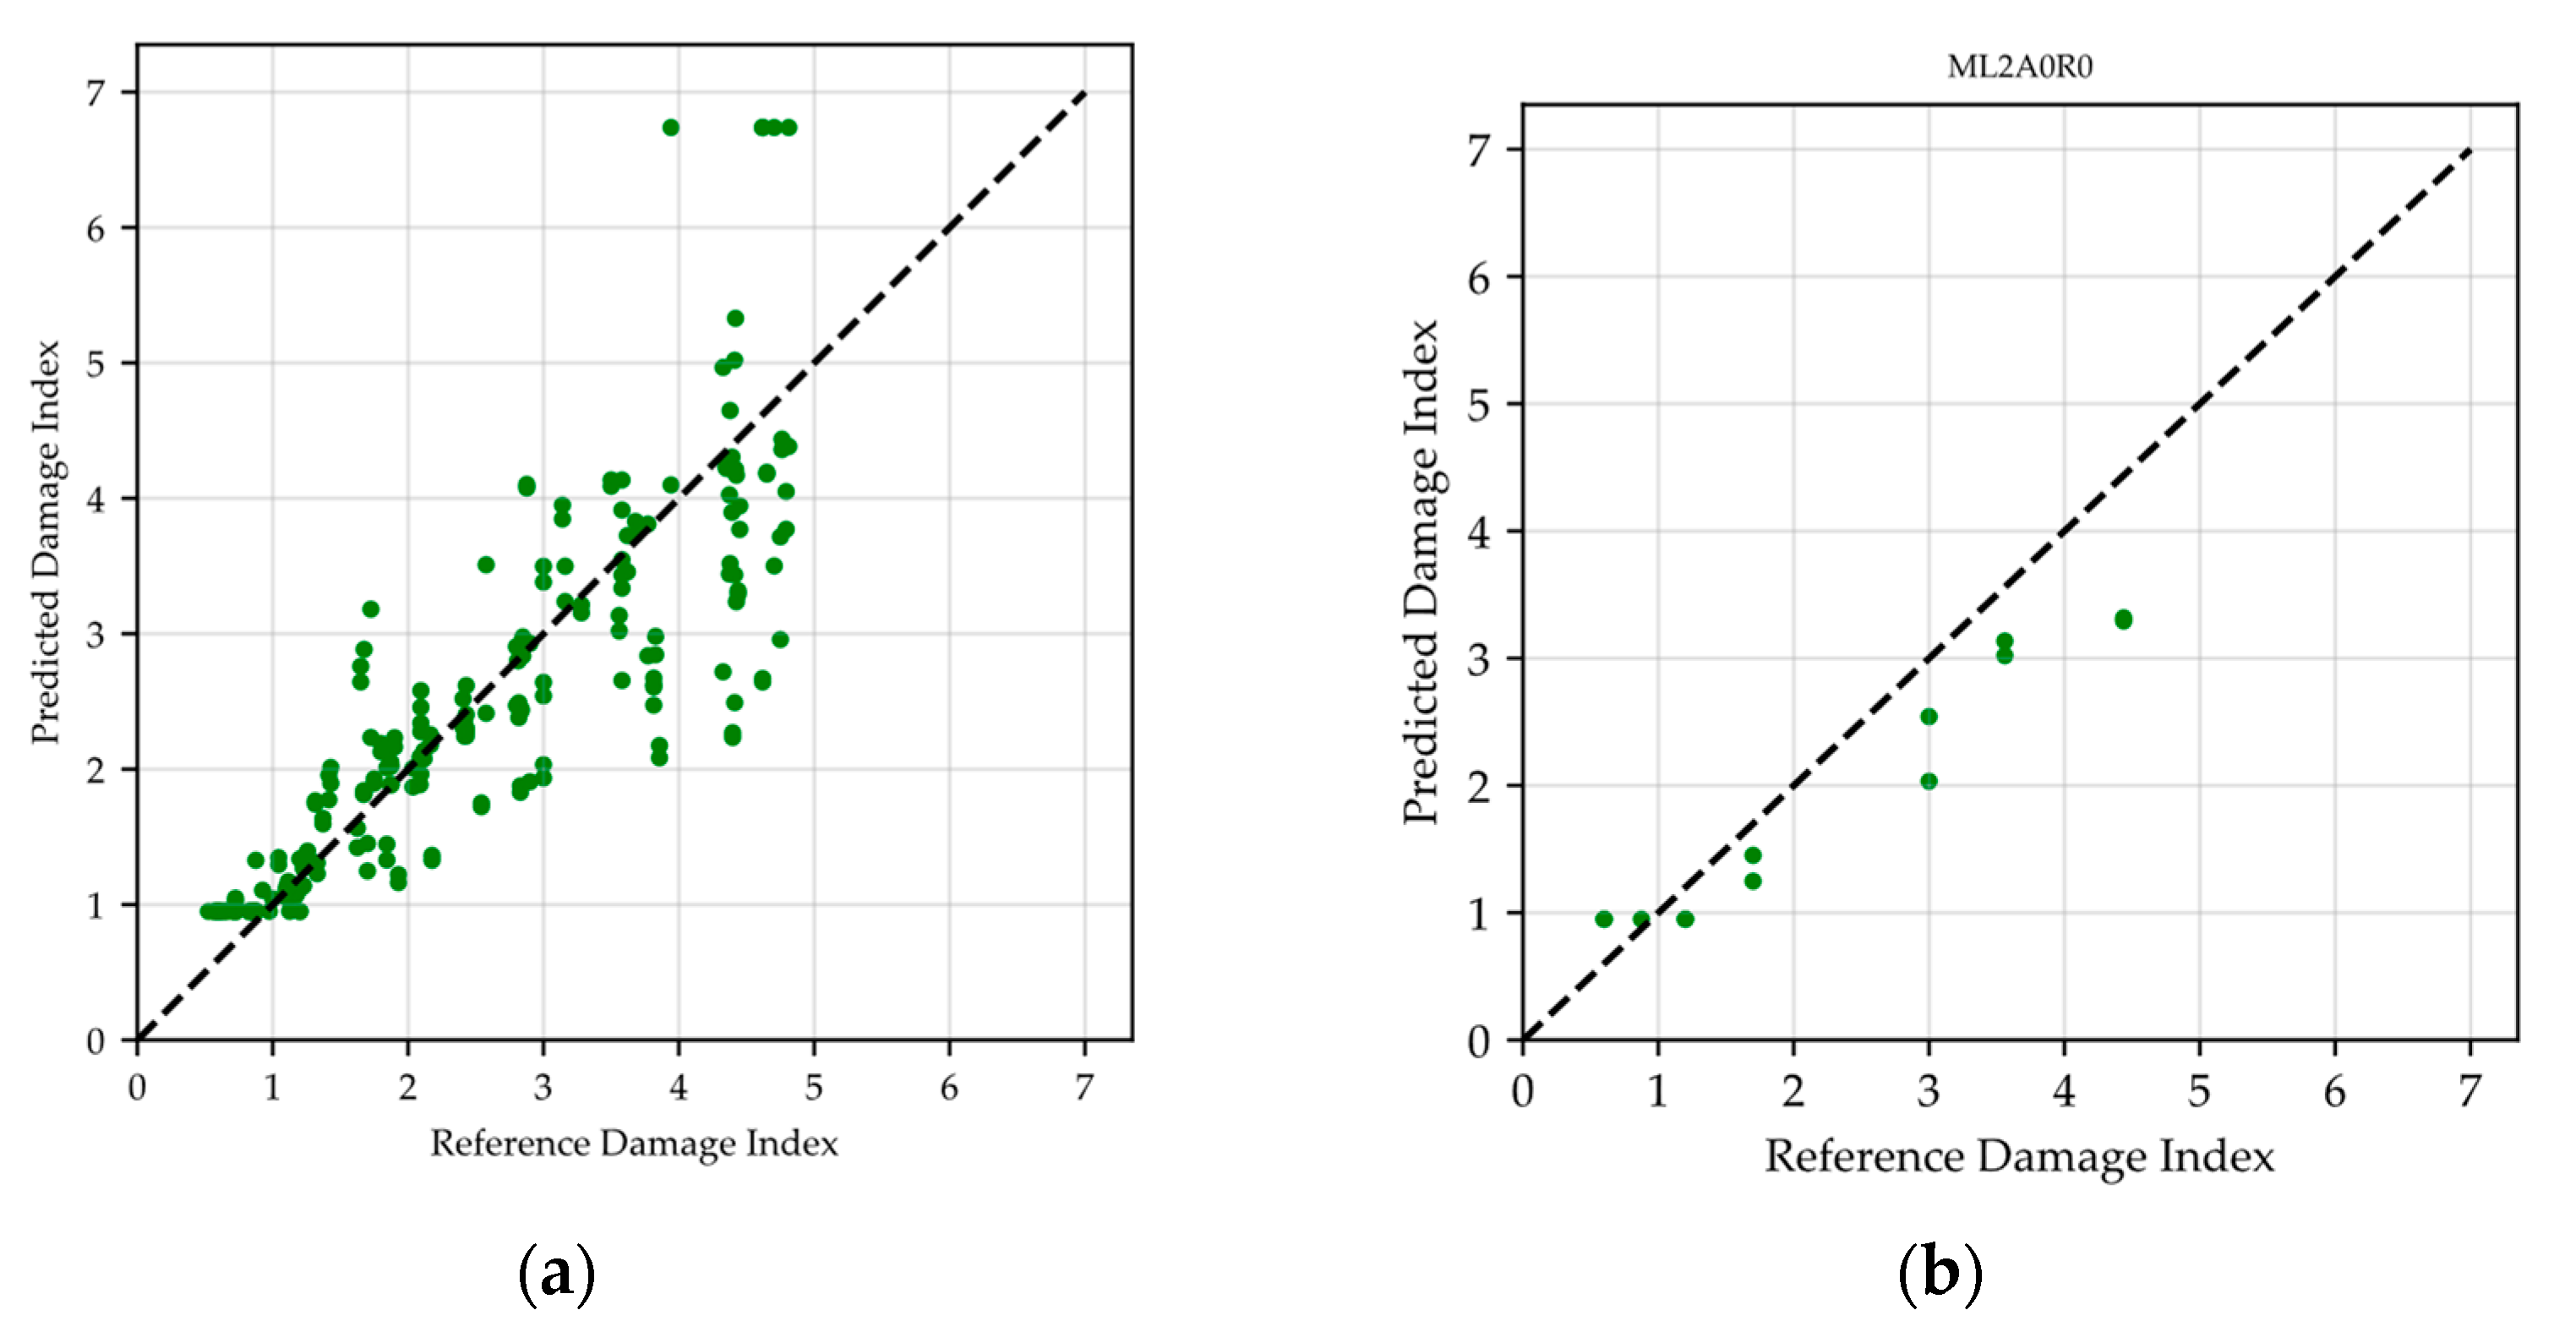
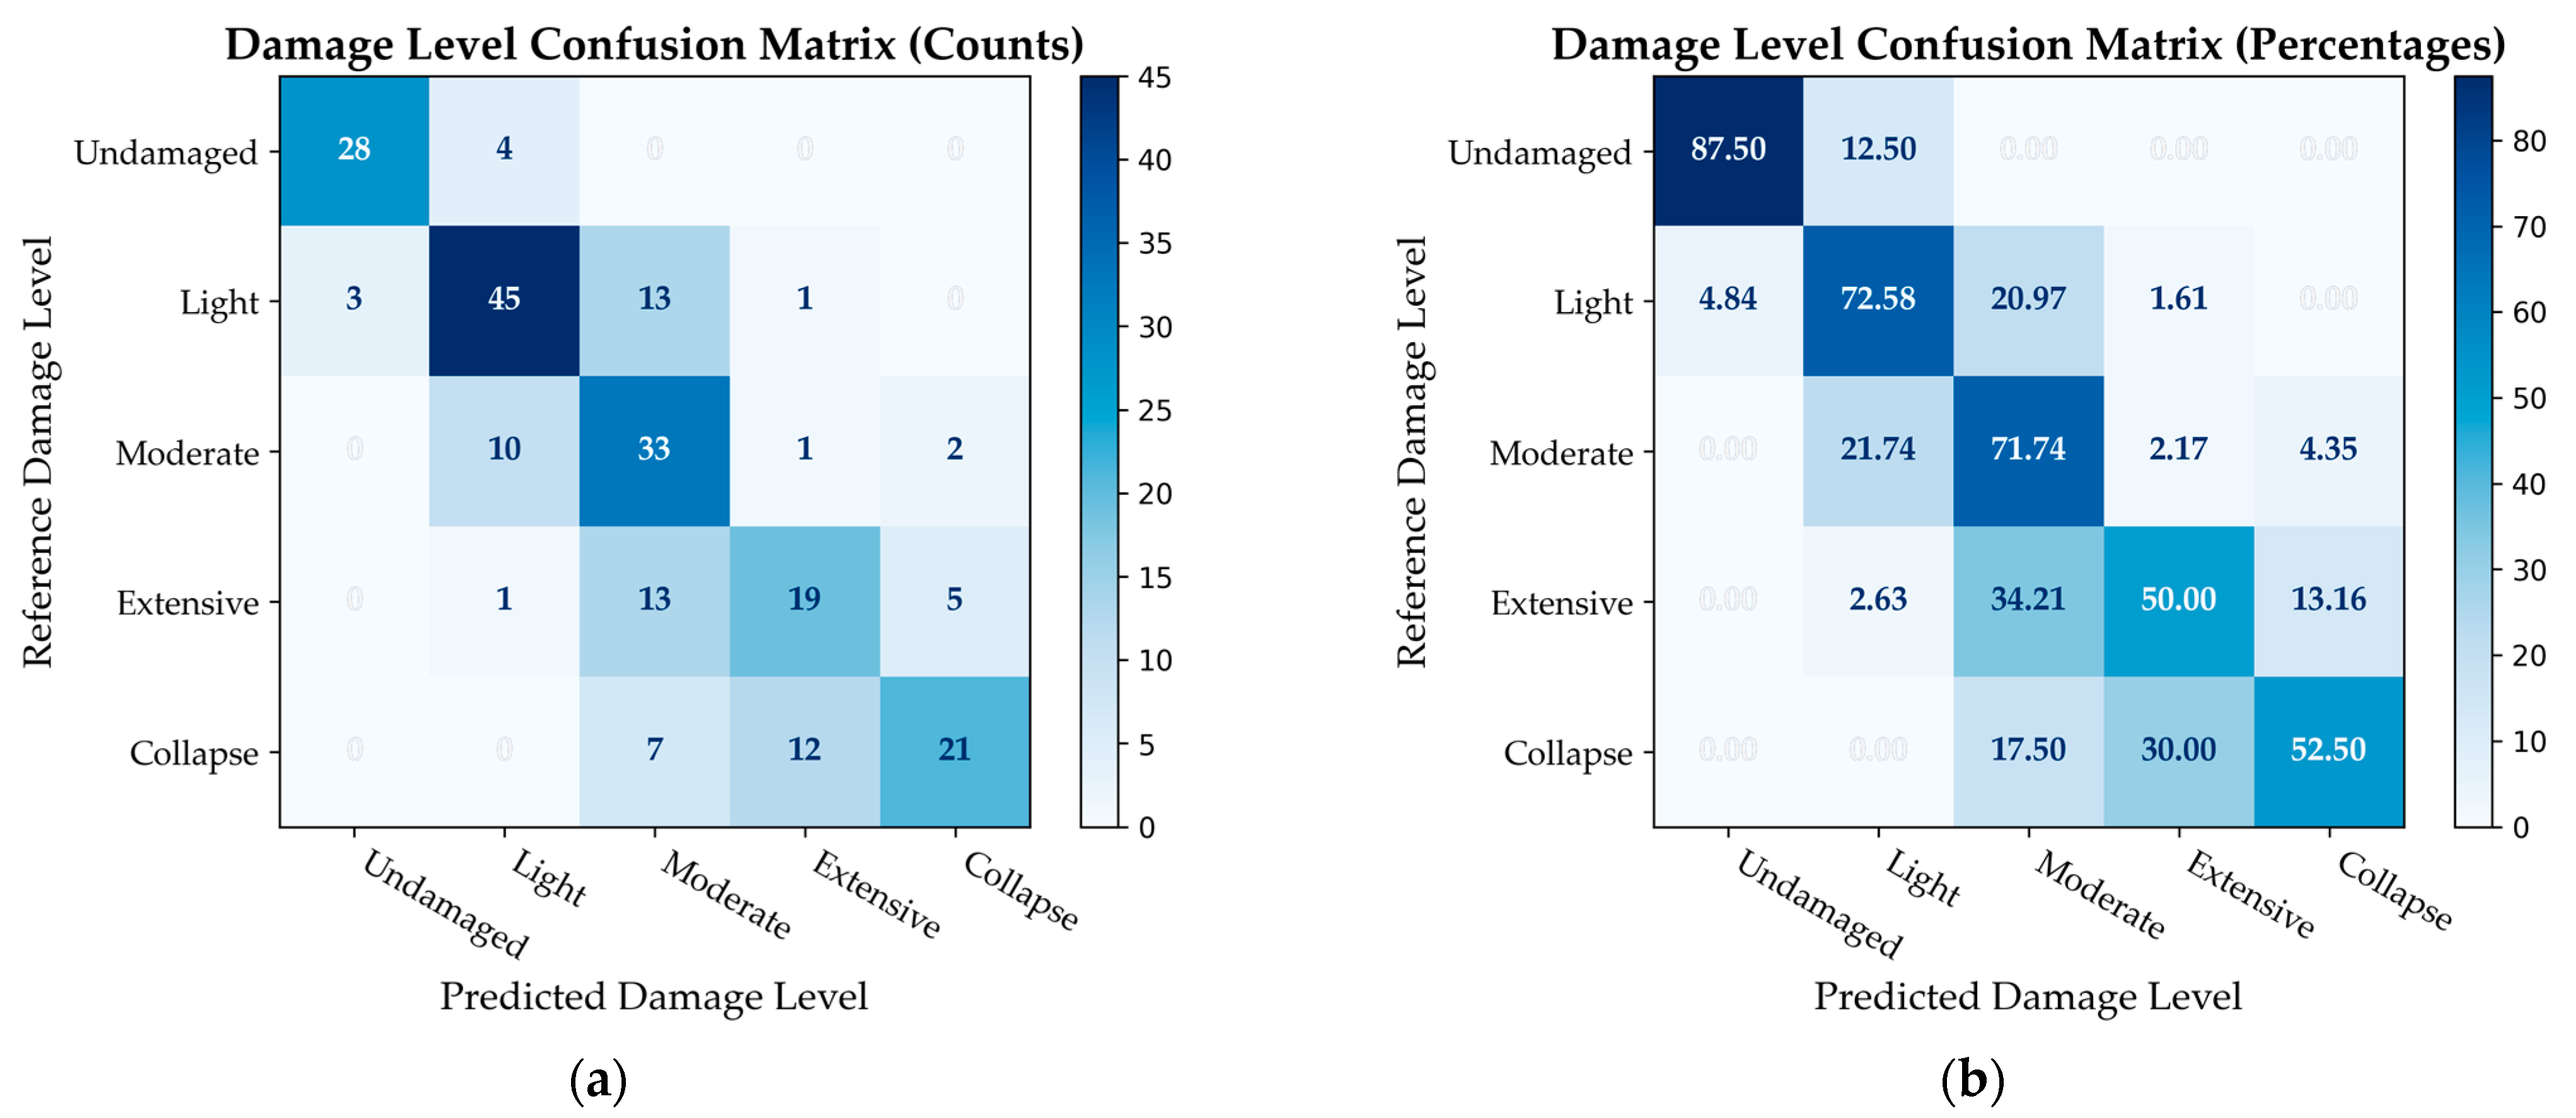
5.2. Damage Index Validation
6. Conclusions
Author Contributions
Funding
Institutional Review Board Statement
Informed Consent Statement
Data Availability Statement
Acknowledgments
Conflicts of Interest
Abbreviations
| CNN | Convolutional Neural Network |
| MSE | Mean Squared Error |
| RMSE | Root Mean Squared Error |
| CISMID | Peruvian–Japanese Center of Seismic Research and Disaster Mitigation |
| SENCICO | National Training Service for the Construction Industry |
| FONDECYT | Technology, and Technological Innovation under contract |
References
- Silgado, E. Historia de los Sismos más Notables Ocurridos en el Perú (1513–1974); Serie C: Geodinámica e Ingeniería Geológica; Instituto de Geología y Minería del Perú: San Borja, Perú, 1978. [Google Scholar]
- Aguilar, Z.; Tarazona, J.C. New Seismicity Based Seismic Sources and Hazard Model for Peru. In Proceedings of the 18th World Conference on Earthquake Engineering–WCEE, Milan, Italy, 30 June–5 July 2024. [Google Scholar]
- Pulido, N.; Aguilar, Z.; Tavera, H.; Chlieh, M.; Calderón, D.; Sekiguchi, T.; Nakai, S.; Yamazaki, F. Scenario Source Models and Strong Ground Motion for Future Mega-earthquakes: Application to Lima, Central Peru. Bull. Seismol. Soc. Am. 2015, 105, 368–386. [Google Scholar] [CrossRef]
- Diaz, M.; Zavala, C.; Estrada, M.; Matsuoka, M. Characterization of the Structural Typologies of Buildings in the Lima Metropolitan Area. J. Disaster Res. 2023, 18, 329–337. [Google Scholar] [CrossRef]
- CISMID Experimental Wall Database 2015. Available online: https://www.cismid.uni.edu.pe/base-de-datos-del-laboratorio-de-estructuras-satreps-project-jica-gobierno-del-peru-ppr-068/ (accessed on 6 July 2024).
- Sugano, S.; Saito, T.; Zavala, C.; Cardenas, L. Strength and Deformation of Confined Brick Masonry Walls Subjected to Lateral Forces—Review of Existing Test Data in Japan and Peru—. J. Disaster Res. 2014, 9, 984–992. [Google Scholar] [CrossRef]
- Cardenas, L.; Reyna, R.; Estacio, L.; Zavala, C. Implementation of Database of Masonry Walls Test—Review of Existing Test Data in Peru. J. Disaster Res. 2014, 9, 993–1000. [Google Scholar] [CrossRef]
- Choi, Y.; Park, D.; Kim, S.; Hong, J.-W. Seismic Performance of Crack-Damaged Masonry Wall Structures via Shaking Table Tests. Structures 2022, 45, 2272–2291. [Google Scholar] [CrossRef]
- Sarhosis, V.; Dais, D.; Smyrou, E.; Bal, İ.E.; Drougkas, A. Quantification of Damage Evolution in Masonry Walls Subjected to Induced Seismicity. Eng. Struct. 2021, 243, 112529. [Google Scholar] [CrossRef]
- Kim, M.-K.; Wang, Q.; Li, H. Non-Contact Sensing Based Geometric Quality Assessment of Buildings and Civil Structures: A Review. Autom. Constr. 2019, 100, 163–179. [Google Scholar] [CrossRef]
- Chang, C.-Y.; Huang, C.-W. Non-Contact Measurement of Inter-Story Drift in Three-Layer RC Structure under Seismic Vibration Using Digital Image Correlation. Mech. Syst. Signal Process. 2020, 136, 106500. [Google Scholar] [CrossRef]
- Oh, B.K.; Park, Y.; Park, H.S. Seismic Response Prediction Method for Building Structures Using Convolutional Neural Network. Struct. Control Health Monit. 2020, 27, e2519. [Google Scholar] [CrossRef]
- Oh, B.K.; Kim, J. Optimal Architecture of a Convolutional Neural Network to Estimate Structural Responses for Safety Evaluation of the Structures. Measurement 2021, 177, 109313. [Google Scholar] [CrossRef]
- Alcantara, E.A.M.; Saito, T. Machine Learning-Based Rapid Post-Earthquake Damage Detection of RC Resisting-Moment Frame Buildings. Sensors 2023, 23, 4694. [Google Scholar] [CrossRef]
- Liu, Z.; Cao, Y.; Wang, Y.; Wang, W. Computer Vision-Based Concrete Crack Detection Using U-Net Fully Convolutional Networks. Autom. Constr. 2019, 104, 129–139. [Google Scholar] [CrossRef]
- Loverdos, D.; Sarhosis, V. Automatic Image-Based Brick Segmentation and Crack Detection of Masonry Walls Using Machine Learning. Autom. Constr. 2022, 140, 104389. [Google Scholar] [CrossRef]
- Chen, L.; Wang, Y. CrackFormer: Transformer Network for Fine-Grained Crack Detection. In Proceedings of the 2022 IEEE/CVF Conference on Computer Vision and Pattern Recognition Workshops (CVPRW), New Orleans, LA, USA, 18–24 June 2022; IEEE: New York, NY, USA; pp. 1–8. [Google Scholar]
- Haciefendioğlu, K.; Altunişık, A.C.; Abdioğlu, T. Deep Learning-Based Automated Detection of Cracks in Historical Masonry Structures. Buildings 2023, 13, 3113. [Google Scholar] [CrossRef]
- Lazaridis, P.C.; Thomoglou, A.K. Rapid Shear Capacity Prediction of TRM-Strengthened Unreinforced Masonry Walls through Interpretable Machine Learning Deployed in a Web App. J. Build. Eng. 2024, 98, 110912. [Google Scholar] [CrossRef]
- E.030; Earthquake-Resistant Design. SENCICO Technical Standard of Buildings. SENCICO: Lima, Peru, 2018.
- E.070; Masonry. SENCICO Technical Standard of Buildings. SENCICO: Lima, Peru, 2006.
- Diaz, M.; Zavala, C.; Lopez, L.; Amancio, M. Analysis of Adaptive Pushover in Confined Masonry Dwellings with Height Irregularity in the Lima Metropolitan Area. J. Disaster Res. 2023, 18, 350–358. [Google Scholar] [CrossRef]
- Diaz, M.; Zavala, C.; Gallardo, J.; Lavado, L. Experimental Study of Non-Engineered Confined Masonry Walls Retrofitted with Wire Mesh and Cement-Sand Mortar. In Proceedings of the 16th World Conference on Earthquake, 16WCEE 2017, Santiago, Chile, 9–13 January 2017. [Google Scholar]
- Lopez, L.; Diaz, M. Análisis de la Eficacia del Reforzamiento de Viviendas de Albañilería Confinada Usando Malla de Acero y Mortero en Lima Metropolitana; Universidad Nacional de Ingeniería: Lima, Peru, 2023. [Google Scholar]
- CISMID. Crack Labeler 2025, Version 1.0. Available online: https://github.com/tic-cismid/Crack_labeler (accessed on 6 July 2024).
- Python Software Foundation. Python Language Reference, Version 3.8 ed; Python Software Foundation: Beaverton, OR, USA, 2025. [Google Scholar]
- Zou, Q.; Zhang, Z.; Li, Q.; Qi, X.; Wang, Q.; Wang, S. Deepcrack: Learning Hierarchical Convolutional Features for Crack Detection. IEEE Trans. Image Process. 2019, 28, 1498–1512. [Google Scholar] [CrossRef]
- Zou, Q.; Cao, Y.; Li, Q.; Mao, Q.; Wang, S. CrackTree: Automatic Crack Detection from Pavement Images. Pattern Recognit. Lett. 2012, 33, 227–238. [Google Scholar] [CrossRef]
- Zhang, J.; Xia, H.; Li, P.; Zhang, K.; Hong, W.; Guo, R. A Pavement Crack Detection Method via Deep Learning and a Binocular-Vision-Based Unmanned Aerial Vehicle. Appl. Sci. 2024, 14, 1778. [Google Scholar] [CrossRef]
- Cheng, B.; Misra, I.; Schwing, A.G.; Kirillov, A.; Girdhar, R. Masked-Attention Mask Transformer for Universal Image Segmentation. In Proceedings of the CVPR, New Orleans, LA, USA, 18–24 June 2022. [Google Scholar]
- Wu, Y.; Kirillov, A.; Massa, F.; Lo, W.-Y.; Girshick, R. Detectron2. 2019. Available online: https://github.com/facebookresearch/detectron2 (accessed on 18 August 2024).
- Khanam, R.; Hussain, M. YOLOv11: An Overview of the Key Architectural Enhancements. arXiv 2024, arXiv:2410.17725. [Google Scholar]
- Paszke, A.; Gross, S.; Massa, F.; Lerer, A.; Bradbury, J.; Chanan, G.; Killeen, T.; Lin, Z.; Gimelshein, N.; Antiga, L.; et al. PyTorch: An Imperative Style, High-Performance Deep Learning Library. In Proceedings of the Advances in Neural Information Processing Systems 32 (NeurIPS 2019), Vancouver, BC, Canada, 8–14 December 2019. [Google Scholar]
- Bradski, G. The OpenCV Library. Dr. Dobb’s Journal of Software Tools 2000. Available online: https://opencv.org/ (accessed on 18 August 2024).
- Clark, A. Pillow (PIL Fork) Documentation. 2015. Available online: http://python-pillow.org/ (accessed on 18 August 2024).
- Loshchilov, I.; Hutter, F. Decoupled Weight Decay Regularization. In Proceedings of the 7th International Conference on Learning Representations, New Orleans, LA, USA, 6–9 May 2019. [Google Scholar]
- Yang, S.; Xiao, W.; Zhang, M.; Guo, S.; Zhao, J.; Shen, F. Image Data Augmentation for Deep Learning: A Survey. arXiv 2023, arXiv:2204.08610. [Google Scholar]
- Dong, L. Skeleton Tracing 2020. Available online: https://github.com/LingDong-/skeleton-tracing (accessed on 18 August 2024).
- Kato, H.; Goto, T.; Mizuno, H. Cyclic Loading Test of Confined Masonry Wall Elements for Structural Design Development of Apartment Houses in the Third World. In Proceedings of the Tenth World Conference on Earthquake Engineering, Madrid, Spain, 19–24 July 1992. [Google Scholar]


| # | Wall Id. | Type of Brick Unit | Length of Wall (mm) | Thickness of Wall (mm) | Axial Force in kN (Axial Stress in MPa) | Project |
|---|---|---|---|---|---|---|
| 1 | ML1CCA-2 | L1 (S) | 2600 | 114 | 140 (0.47) | I |
| 2 | ML1CCA-3 | L1 (S) | 2600 | 114 | 140 (0.47) | I |
| 3 | ML1SCA-1 | L1 (S) | 2600 | 114 | 0.0 (0.00) | I |
| 4 | ML1SCA-2 | L1 (S) | 2600 | 114 | 0.0 (0.00) | I |
| 5 | ML1SCA-3 | L1 (S) | 2600 | 114 | 0.0 (0.00) | I |
| 6 | ML2CCA-1 | L2 (T) | 2600 | 108 | 140 (0.50) | I |
| 7 | ML2CCA-3 | L2 (T) | 2600 | 108 | 141 (0.50) | I |
| 8 | ML2SCA-1 | L2 (T) | 2600 | 108 | 0.0 (0.00) | I |
| 9 | ML2SCA-2 | L2 (T) | 2600 | 108 | 0.0 (0.00) | I |
| 10 | ML2SCA-3 | L2 (T) | 2600 | 108 | 0.0 (0.00) | I |
| 11 | ML1R0 | L1 (S) | 2600 | 121 | 200 (0.63) | II |
| 12 | ML2R0 | L2 (T) | 2600 | 110 | 200 (0.70) | II |
| 13 | ML1A0R0 | L1 (S) | 2600 | 122 | 200 (0.63) | III |
| 14 | ML2A0R0 | L2 (T) | 2600 | 109 | 140 (0.49) | III |
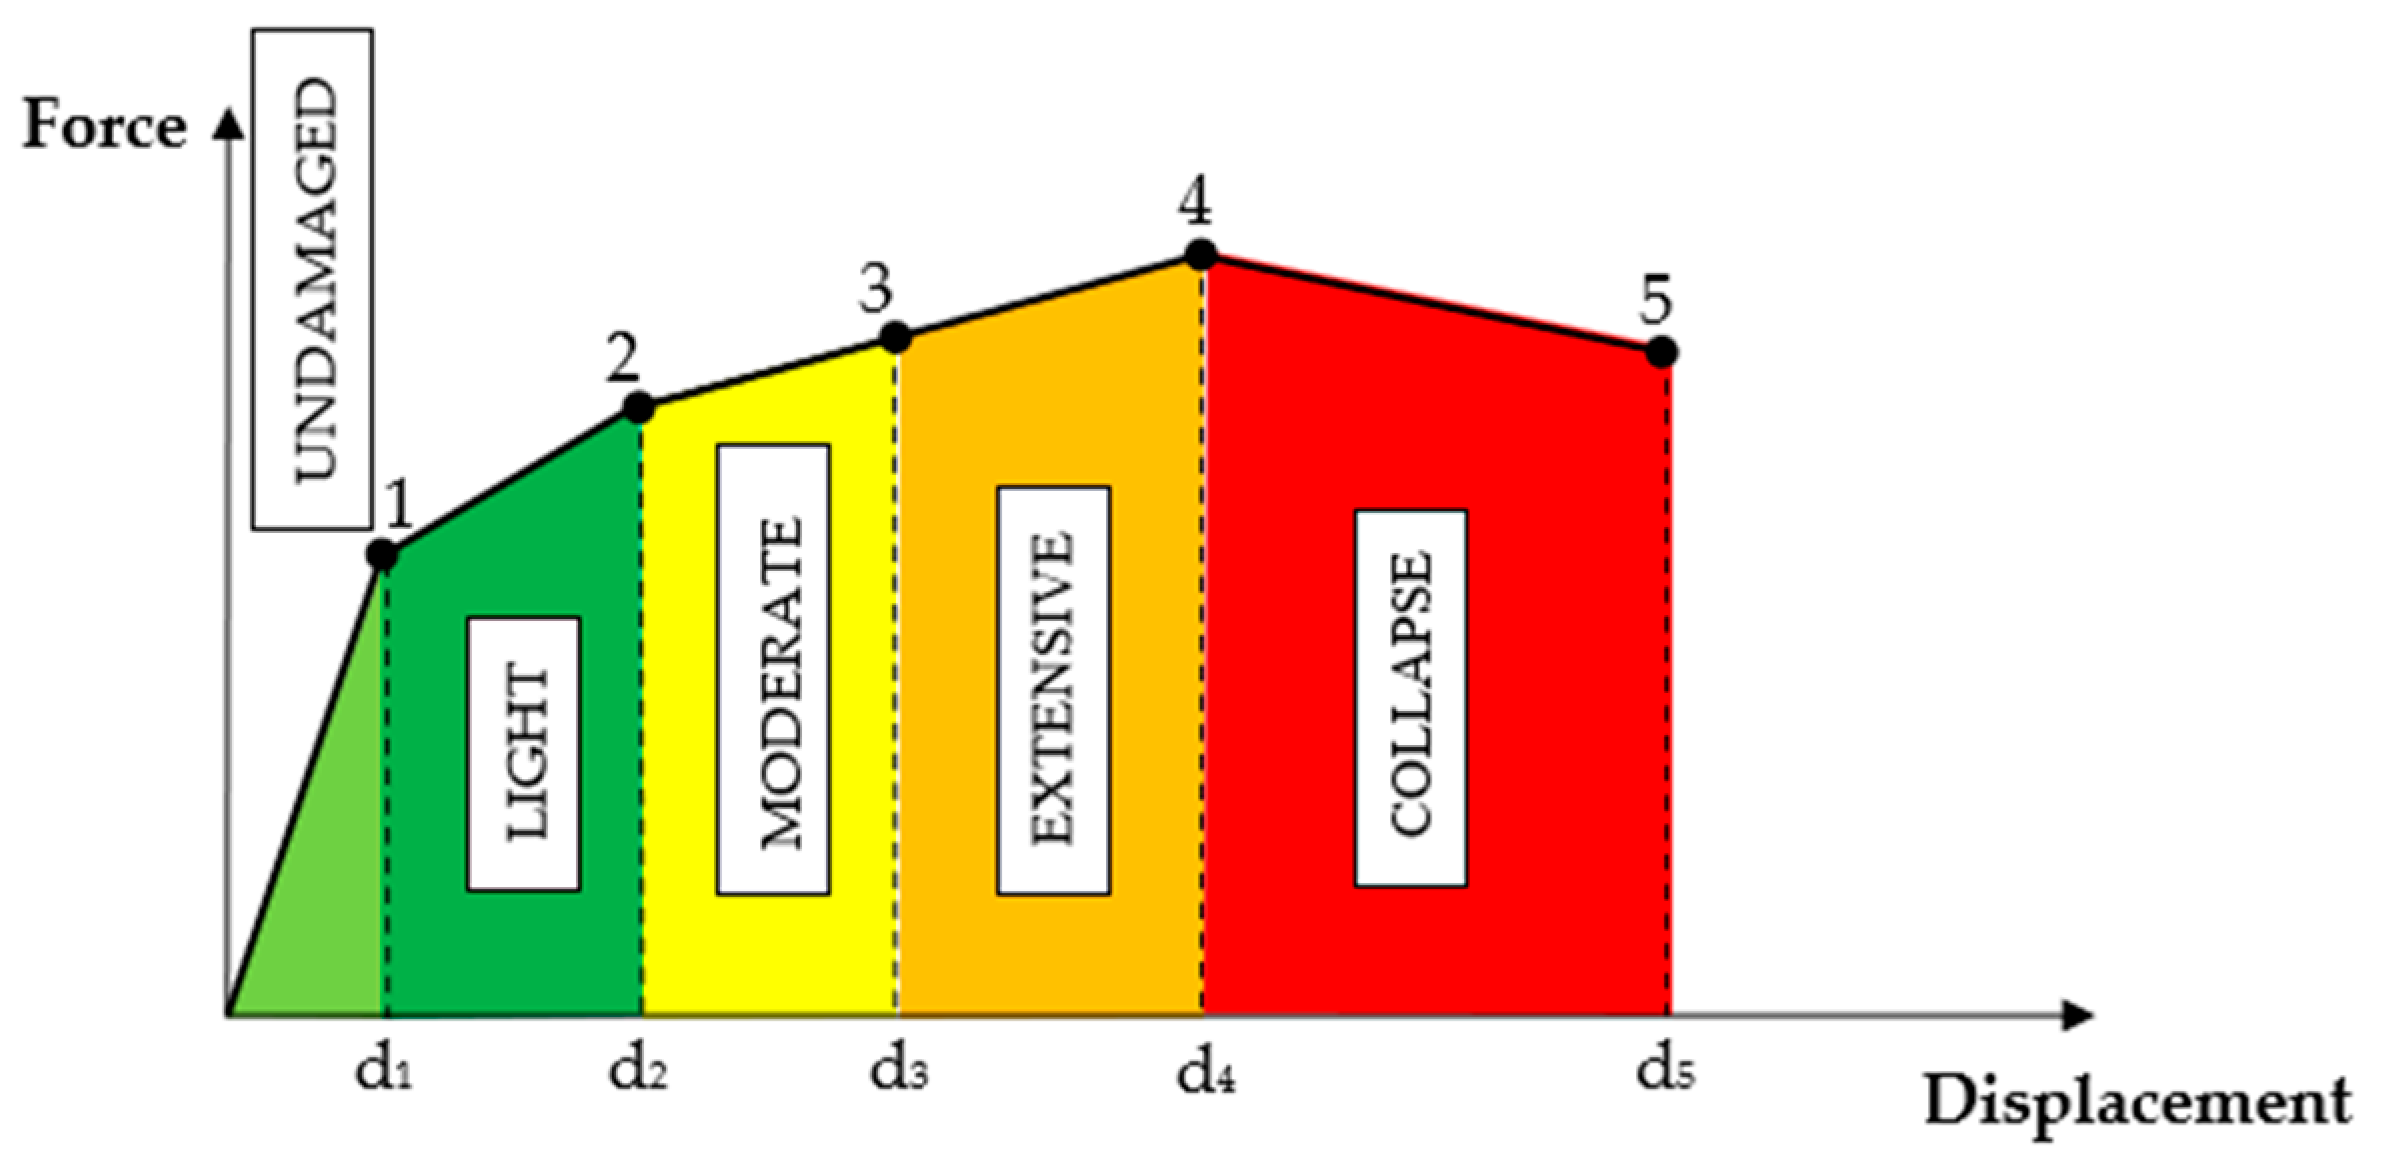
| Damage Level | Drift Limits () | |
|---|---|---|
| S | T | |
| Undamaged or Slight (ND) | 0.40 | 0.40 |
| Light (LD) | 1.10 | 0.80 |
| Moderate (MD) | 2.80 | 1.00 |
| Extensive (EX) | 3.50 | 1.50 |
| Collapse (CO) | 6.70 | 2.30 |
| Damage Level | Index Values |
|---|---|
| Undamaged or Slight (ND) | [0; 1> |
| Light (LD) | [1; 2> |
| Moderate (MD) | [2; 3> |
| Extensive (EX) | [3; 4> |
| Collapse (CO) | [4; 5] |
| Parameter | Value |
|---|---|
| Image size | 640 |
| Number of epochs | 120 |
| Batch size | 16 |
| Loss function | Cross Entropy |
| Optimizer | AdamW |
| Initial learning rate | 0.001 |
| Learning rate decay | Decay by a factor of 10 every 10 epochs |
| Classes | Training | Validation | Total |
|---|---|---|---|
| Pushing (red) | 5771 | 1443 | 7214 |
| Pulling (blue) | 5234 | 1309 | 6543 |
| 13,757 |
| Model | Image Size | Validation Mask- * | Validation Mask- ** |
|---|---|---|---|
| Mask2Former | 640 × 640 | 0.51 | 0.26 |
| Mask R-CNN | 640 × 640 | 0.56 | 0.28 |
| YOLOv11 | 640 × 640 | 0.62 | 0.31 |
| Confined Masonry Wall Type | |||
|---|---|---|---|
| S-type with axial load | 10.3 | 2.29 | 1.16 |
| S-type solid without axial load | 10.3 | 2.32 | 0.87 |
| T-type tubular with axial load | 7.8 | 1.24 | 1.28 |
| T-type without axial load | 7.8 | 1.13 | 0.73 |
| N° | Wall Id. | MSE | RMSE | r | R2 |
|---|---|---|---|---|---|
| 1 | ML1CCA-2 | 0.605 | 0.778 | 0.974 | 0.94 |
| 2 | ML1CCA-3 | 0.5 | 0.707 | 0.983 | 0.964 |
| 3 | ML1SCA-1 | 0.165 | 0.406 | 0.997 | 0.967 |
| 4 | ML1SCA-2 | 0.769 | 0.877 | 0.986 | 0.951 |
| 5 | ML1SCA-3 | 0.578 | 0.76 | 0.975 | 0.95 |
| 6 | ML2CCA-1 | 1.17 | 1.082 | 0.971 | 0.923 |
| 7 | ML2CCA-3 | 0.342 | 0.584 | 0.981 | 0.96 |
| 8 | ML2SCA-1 | 0.611 | 0.782 | 0.969 | 0.927 |
| 9 | ML2SCA-2 | 0.45 | 0.671 | 0.991 | 0.939 |
| 10 | ML2SCA-3 | 0.997 | 0.999 | 0.939 | 0.872 |
| 11 | ML1R0 | 0.935 | 0.967 | 0.98 | 0.96 |
| 12 | ML2R0 | 0.804 | 0.897 | 0.958 | 0.909 |
| 13 | ML1A0R0 | 0.118 | 0.343 | 0.994 | 0.983 |
| 14 | ML2A0R0 | 0.251 | 0.501 | 0.988 | 0.97 |
| Average | 0.593 | 0.740 | 0.978 | 0.944 |
| N° | Wall Id. | MSE | RMSE | r | R2 |
|---|---|---|---|---|---|
| 1 | ML1A0R0 | 1.83 | 1.35 | 0.99 | 0.98 |
| 2 | ML1CCA-2 | 0.35 | 0.59 | 0.98 | 0.97 |
| 3 | ML1CCA-3 | 0.51 | 0.72 | 0.97 | 0.94 |
| 4 | ML1R0 | 1.04 | 1.02 | 0.98 | 0.96 |
| 5 | ML1SCA-1 | 0.04 | 0.21 | 0.99 | 0.99 |
| 6 | ML1SCA-2 | 0.32 | 0.56 | 0.98 | 0.96 |
| 7 | ML1SCA-3 | 0.25 | 0.50 | 0.99 | 0.97 |
| 8 | ML2A0R0 | 0.37 | 0.61 | 0.99 | 0.98 |
| 9 | ML2CCA-1 | 0.19 | 0.44 | 0.99 | 0.99 |
| 10 | ML2CCA-3 | 0.28 | 0.53 | 0.98 | 0.97 |
| 11 | ML2R0 | 0.07 | 0.25 | 1.00 | 0.99 |
| 12 | ML2SCA-1 | 0.27 | 0.52 | 0.99 | 0.97 |
| 13 | ML2SCA-2 | 0.28 | 0.53 | 0.98 | 0.97 |
| 14 | ML2SCA-3 | 0.77 | 0.88 | 0.96 | 0.92 |
| Average | 0.469 | 0.622 | 0.984 | 0.968 |
Disclaimer/Publisher’s Note: The statements, opinions and data contained in all publications are solely those of the individual author(s) and contributor(s) and not of MDPI and/or the editor(s). MDPI and/or the editor(s) disclaim responsibility for any injury to people or property resulting from any ideas, methods, instructions or products referred to in the content. |
© 2025 by the authors. Licensee MDPI, Basel, Switzerland. This article is an open access article distributed under the terms and conditions of the Creative Commons Attribution (CC BY) license (https://creativecommons.org/licenses/by/4.0/).
Share and Cite
Diaz, M.; Lopez, L.; Amancio, M.; Inocente, I.; Salinas, J.; Isuhuaylas, S.; Flores, E.; Moscoso, E. Crack-Based Estimation of Seismic Damage Level in Confined Masonry Walls in the Lima Metropolitan Area Using Deep Learning Techniques. Appl. Sci. 2025, 15, 5875. https://doi.org/10.3390/app15115875
Diaz M, Lopez L, Amancio M, Inocente I, Salinas J, Isuhuaylas S, Flores E, Moscoso E. Crack-Based Estimation of Seismic Damage Level in Confined Masonry Walls in the Lima Metropolitan Area Using Deep Learning Techniques. Applied Sciences. 2025; 15(11):5875. https://doi.org/10.3390/app15115875
Chicago/Turabian StyleDiaz, Miguel, Luis Lopez, Michel Amancio, Italo Inocente, Jhianpiere Salinas, Sergio Isuhuaylas, Erika Flores, and Edisson Moscoso. 2025. "Crack-Based Estimation of Seismic Damage Level in Confined Masonry Walls in the Lima Metropolitan Area Using Deep Learning Techniques" Applied Sciences 15, no. 11: 5875. https://doi.org/10.3390/app15115875
APA StyleDiaz, M., Lopez, L., Amancio, M., Inocente, I., Salinas, J., Isuhuaylas, S., Flores, E., & Moscoso, E. (2025). Crack-Based Estimation of Seismic Damage Level in Confined Masonry Walls in the Lima Metropolitan Area Using Deep Learning Techniques. Applied Sciences, 15(11), 5875. https://doi.org/10.3390/app15115875