


High-Temperature Creep and Microstructure Evolution of Alloy 800H Weldments with Inconel 625 and Haynes 230 Filler Materials


Abstract
1. Introduction
2. Materials and Experiments
2.1. Materials
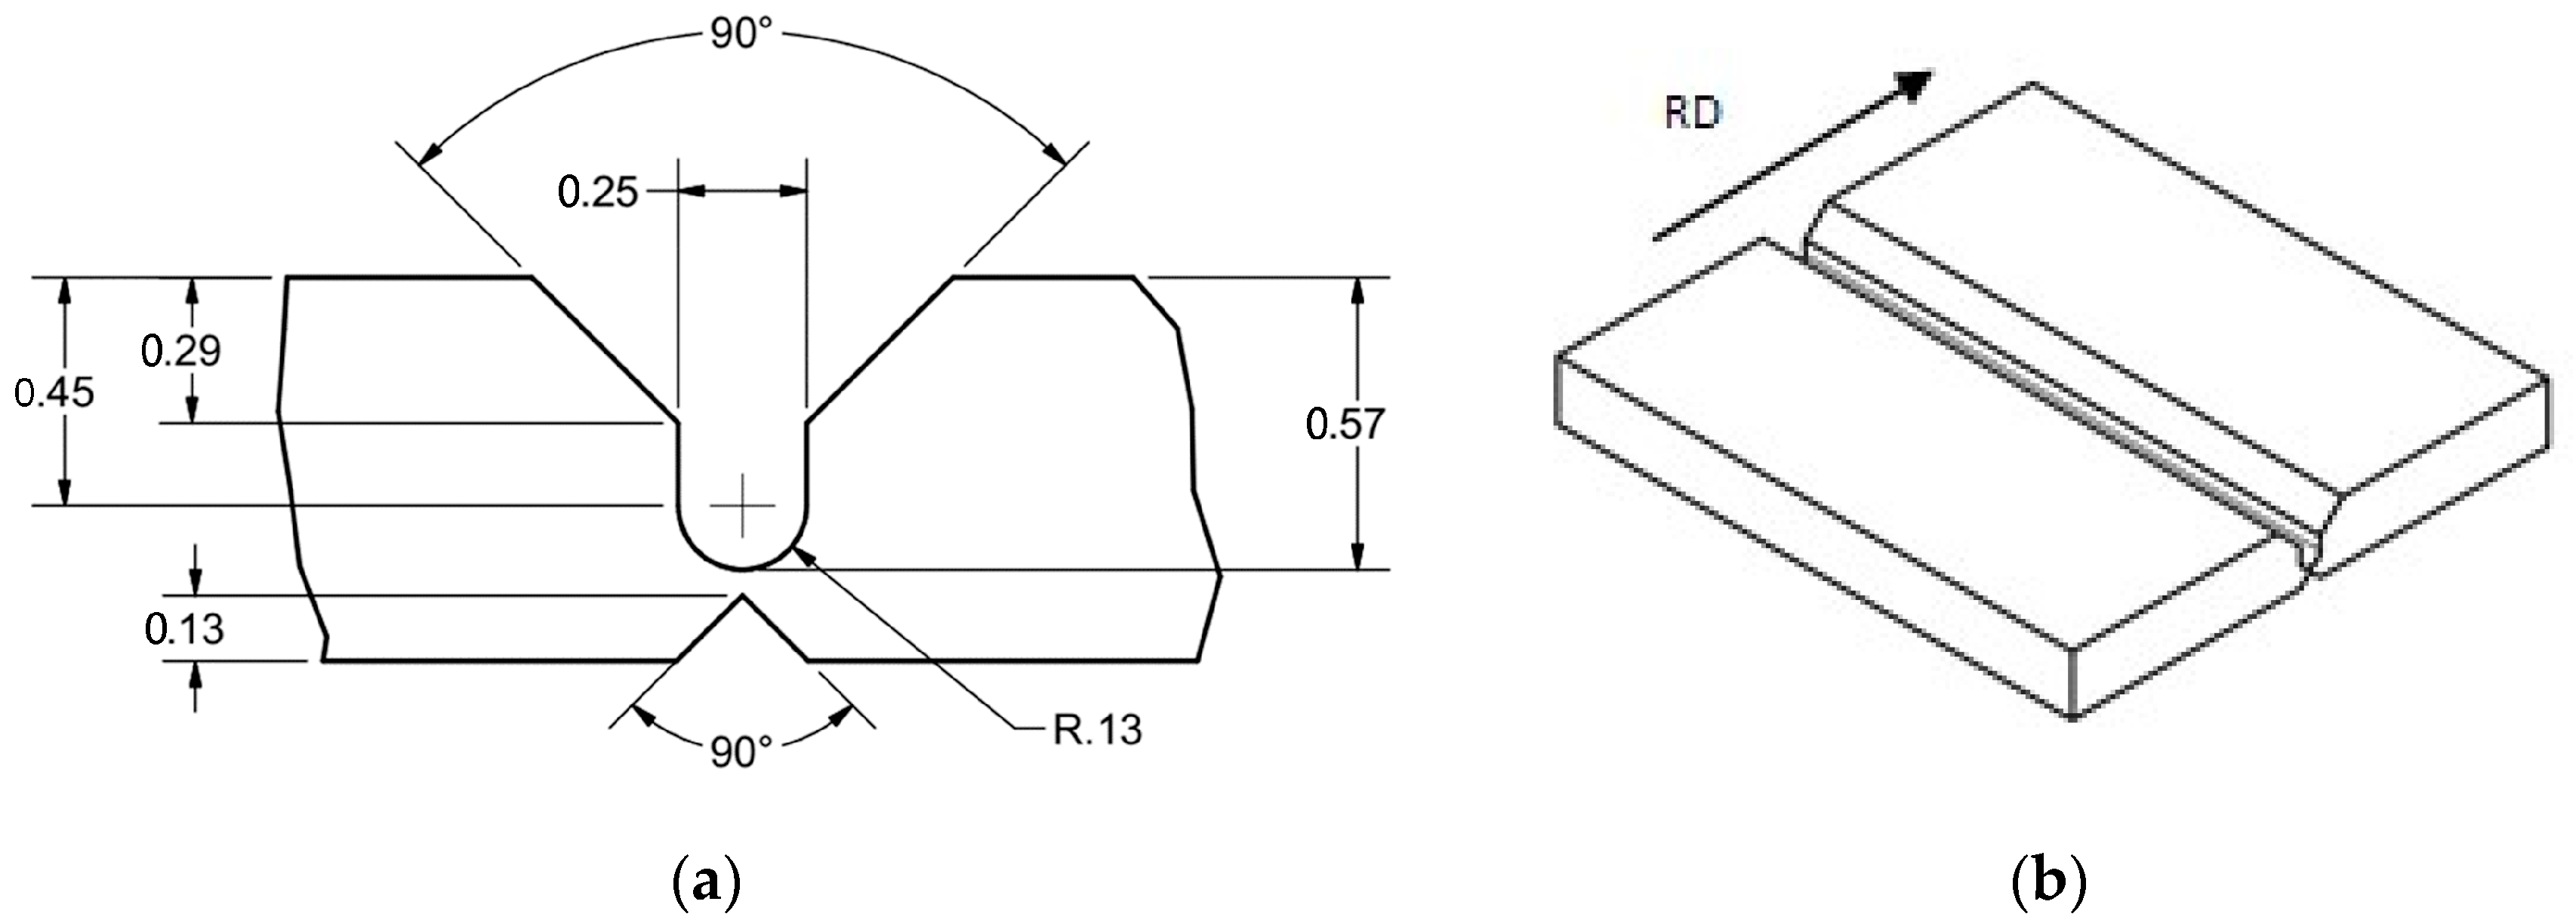
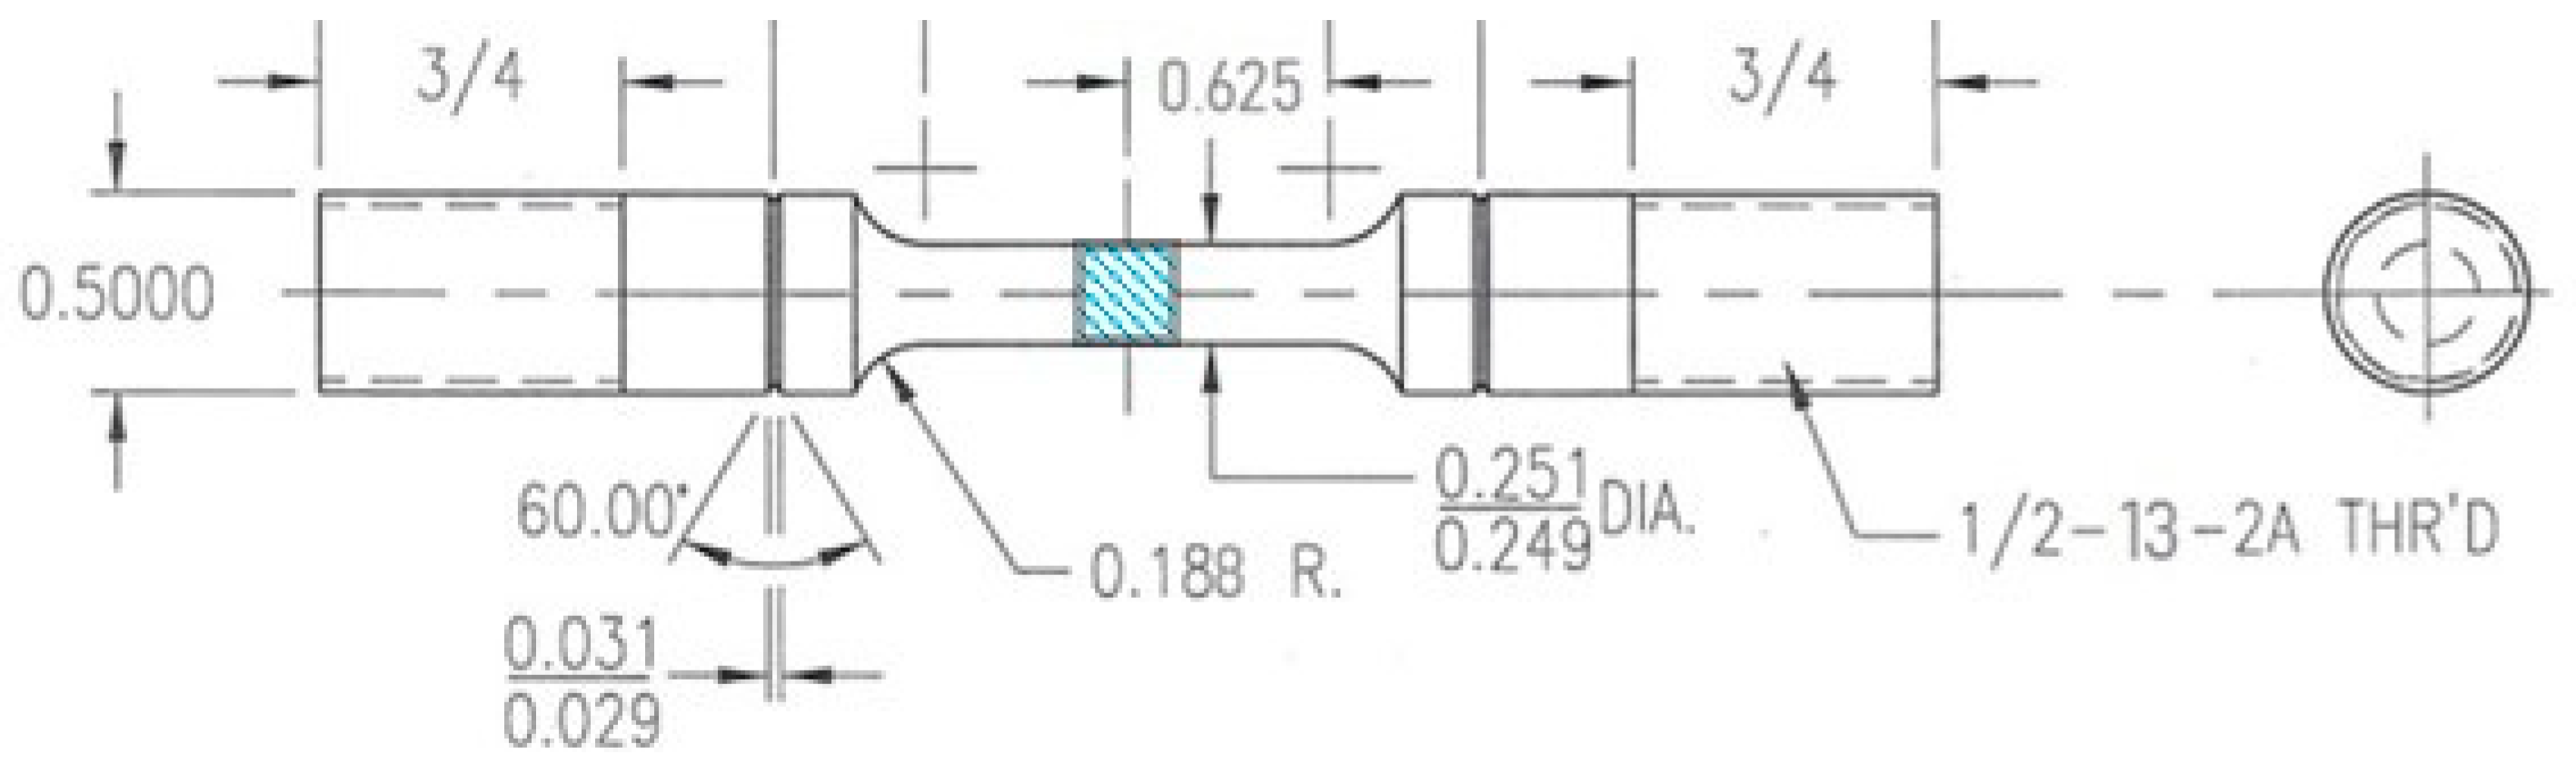
2.2. Welding Process and Specimen Fabrication
2.3. Hardness Measurement
2.4. High-Temperature Tensile and Creep Tests
2.5. Microstructure Examination
3. Results
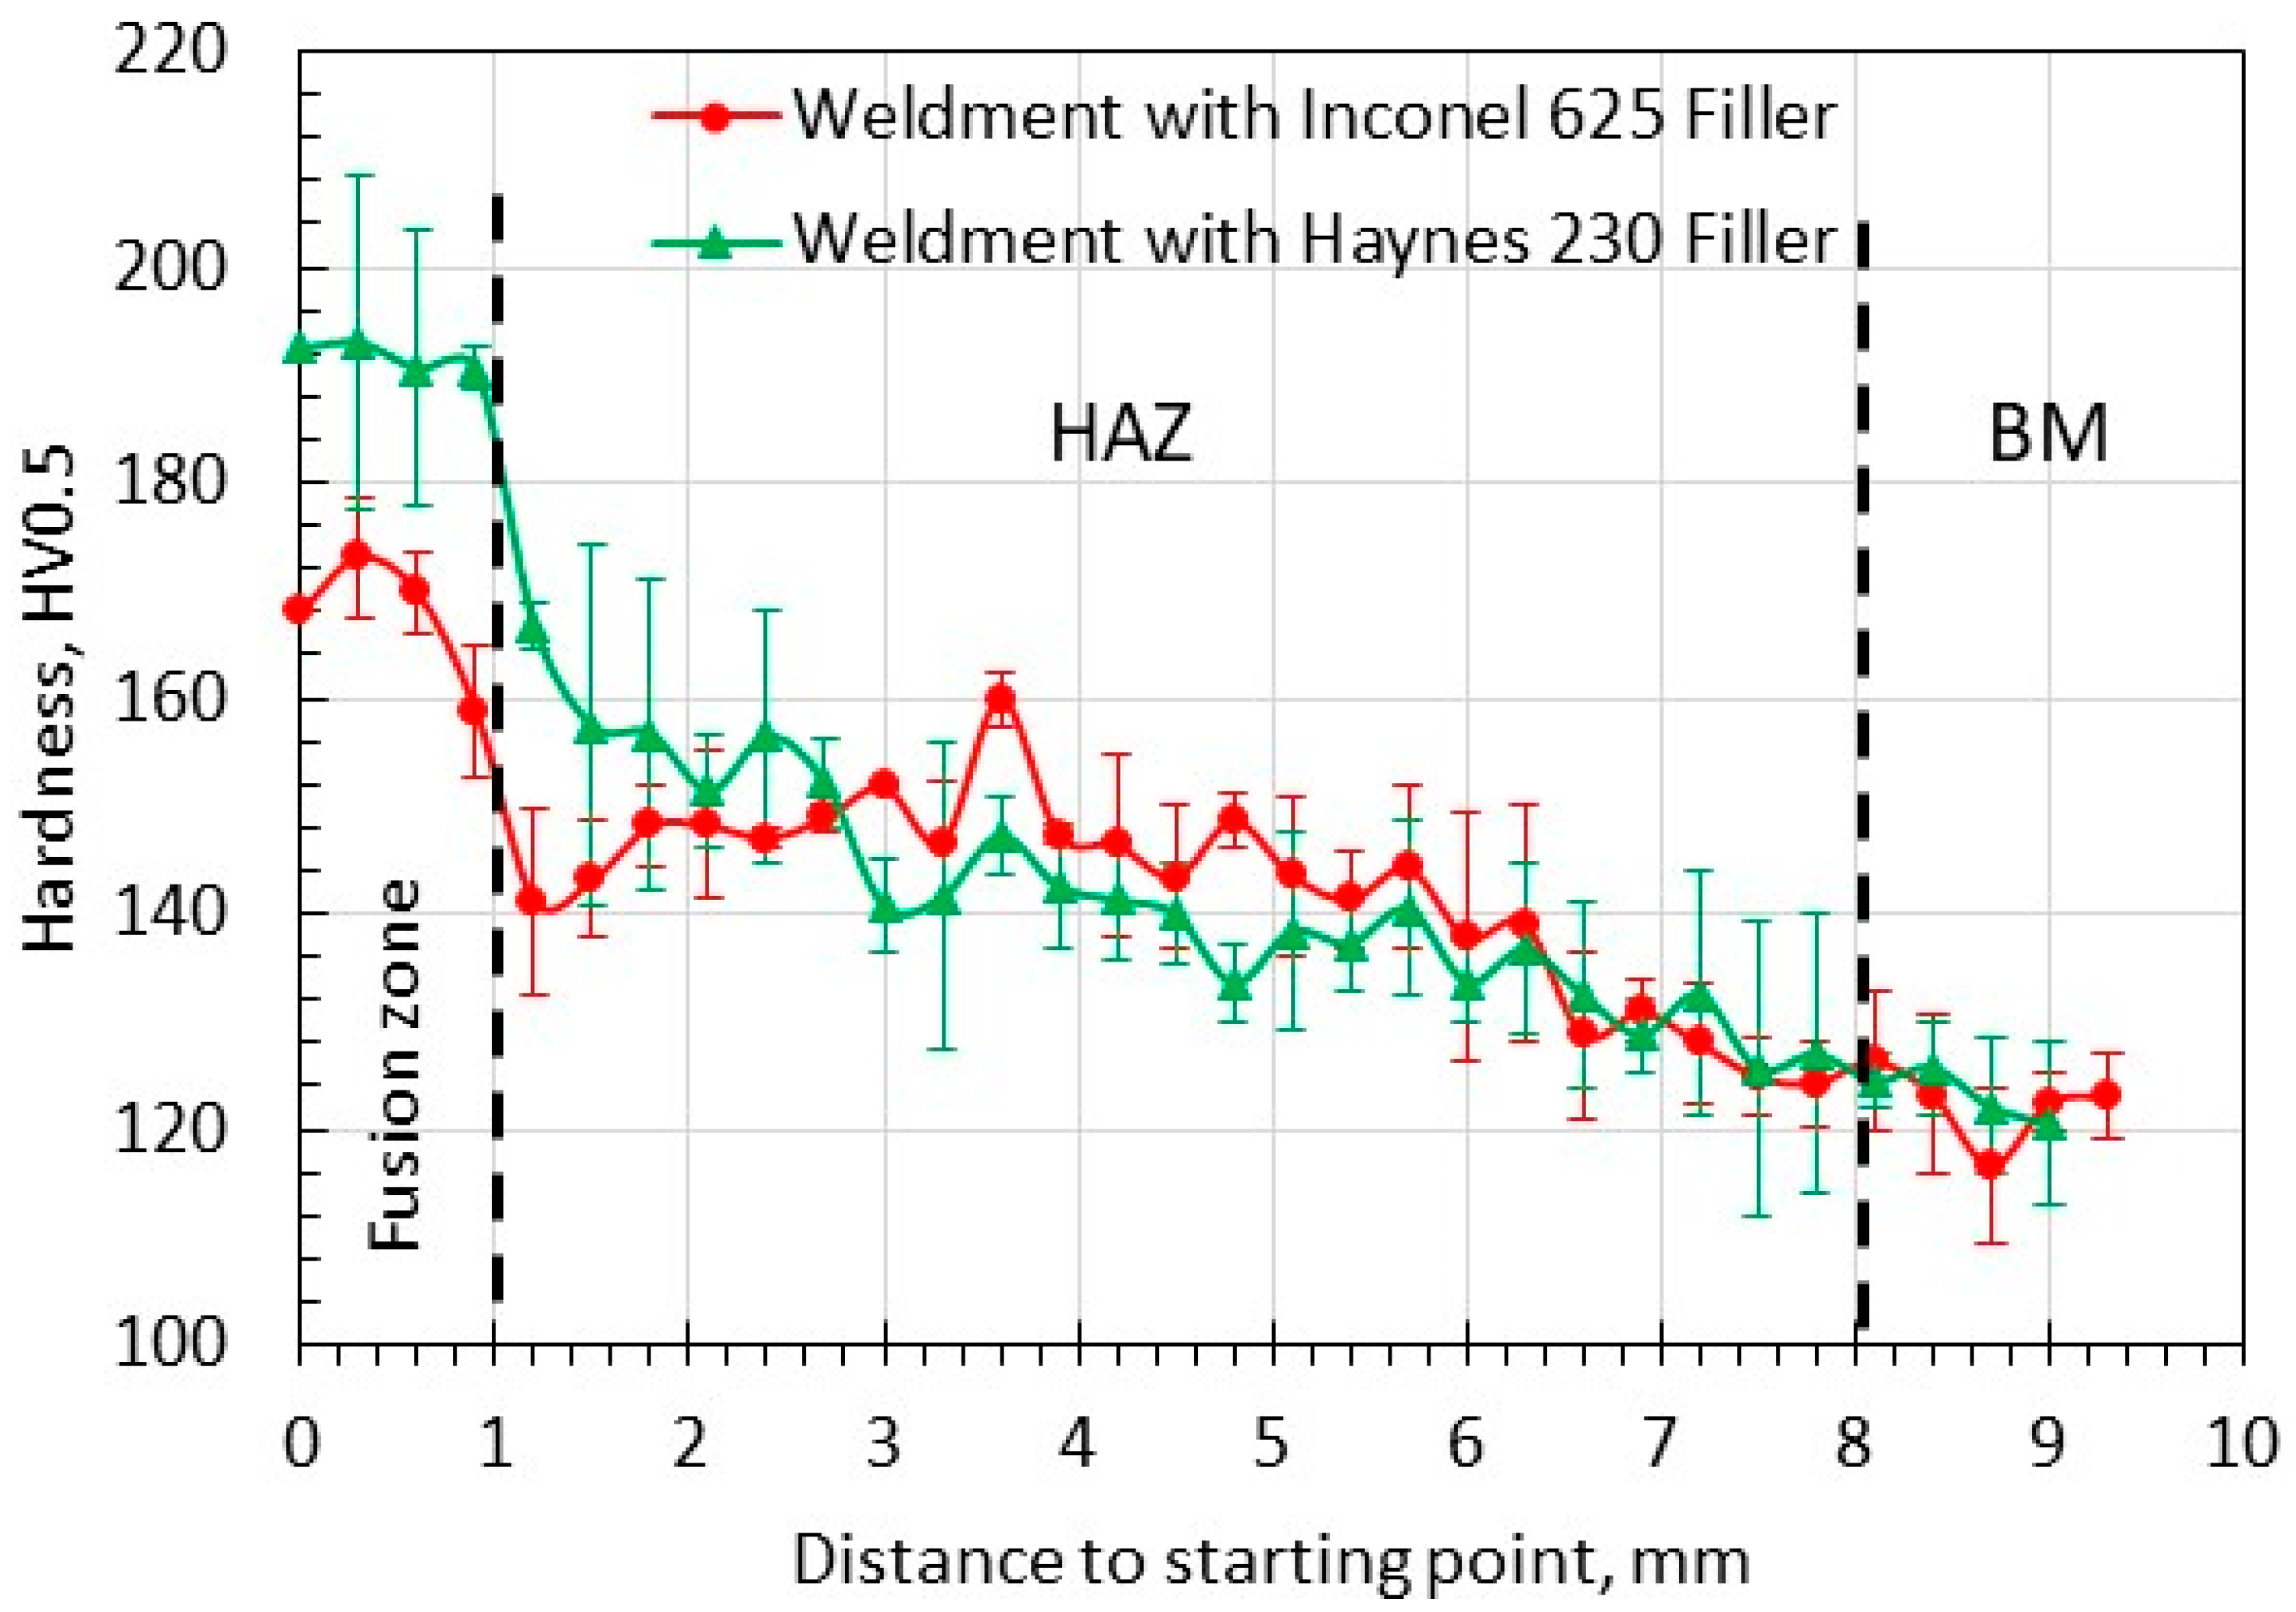
3.1. Hardness
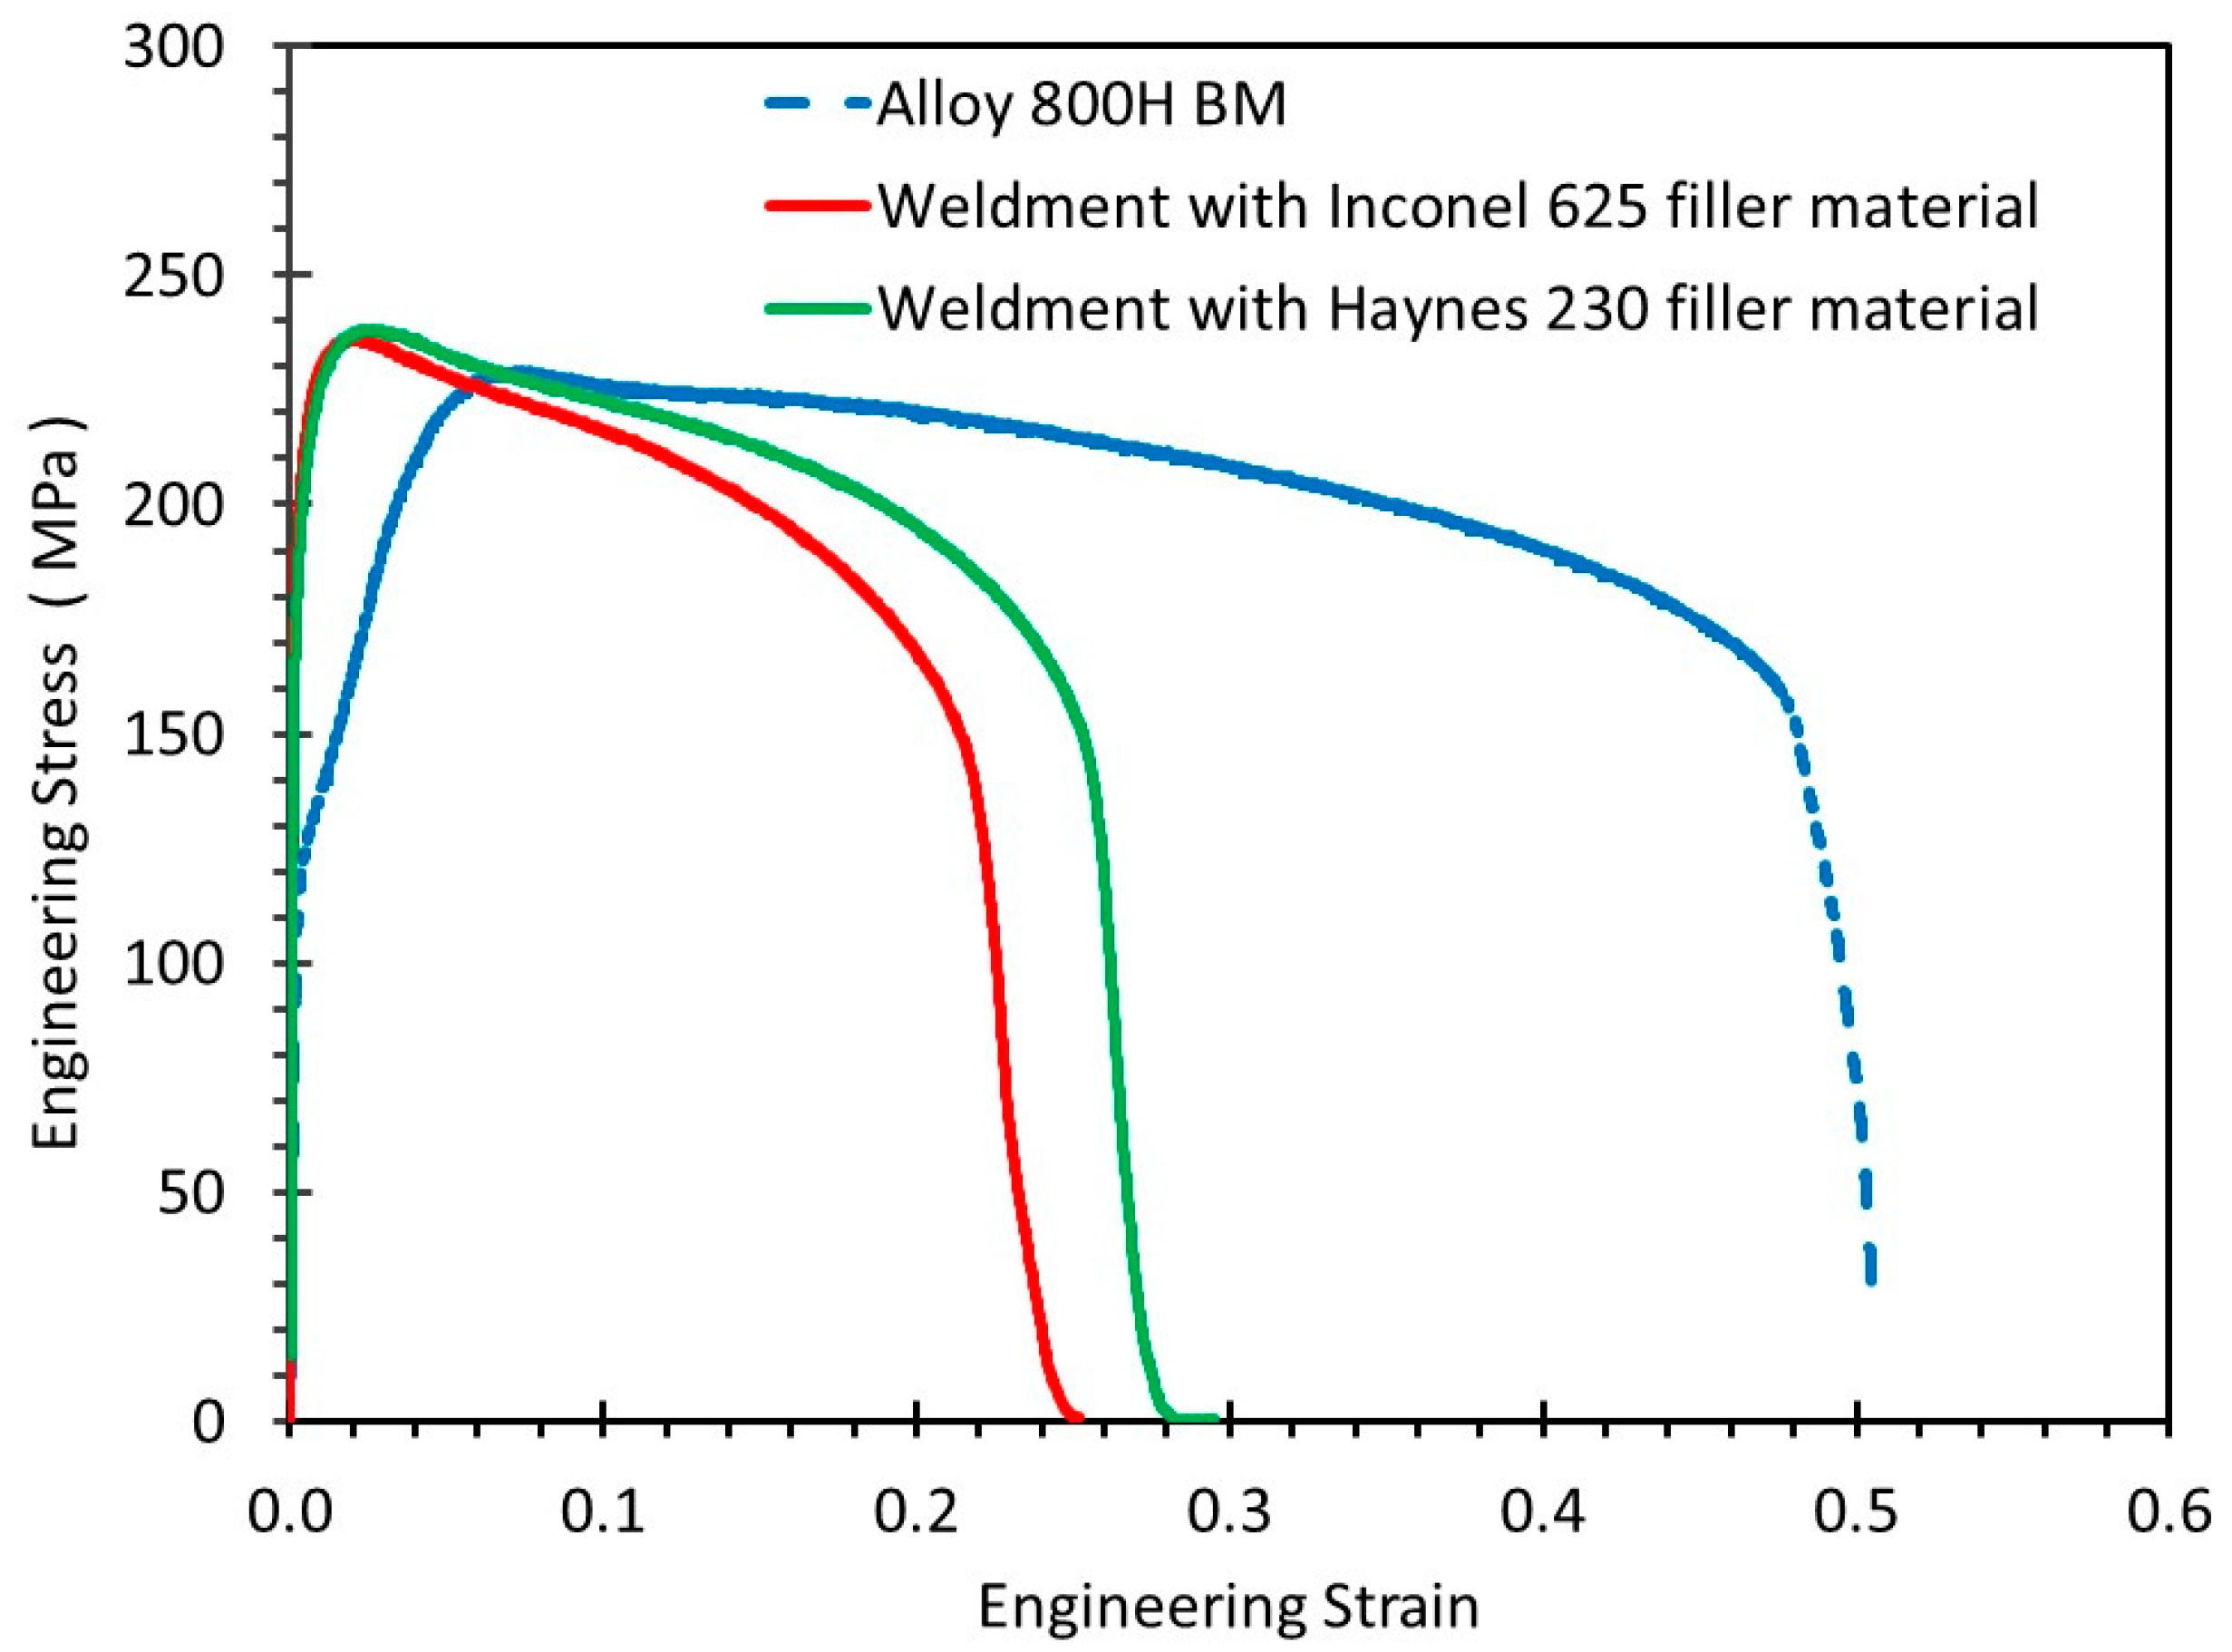
3.2. High-Temperature Tensile Test
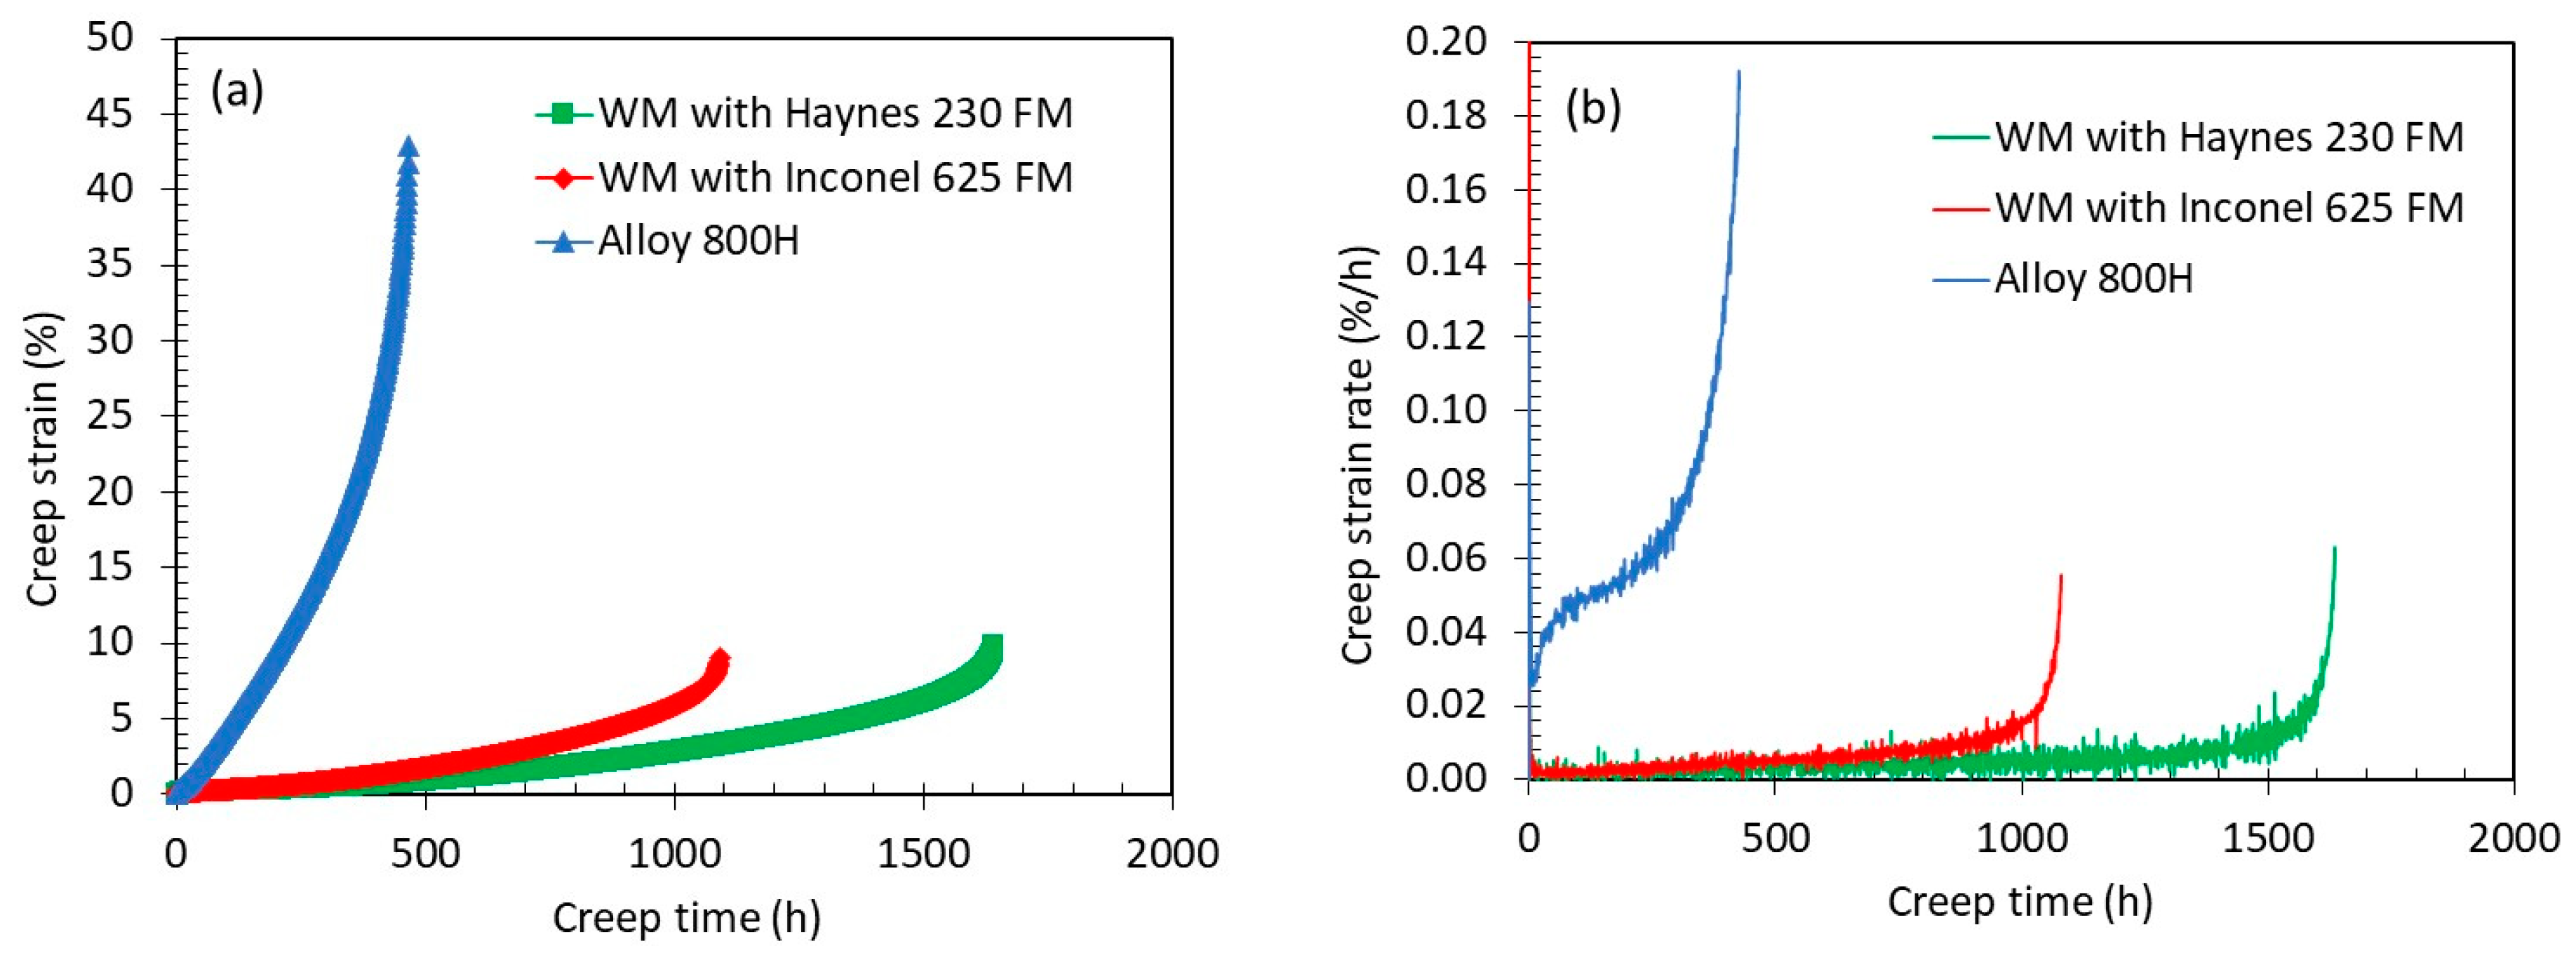
3.3. High-Temperature Creep Test
3.4. Microstructures
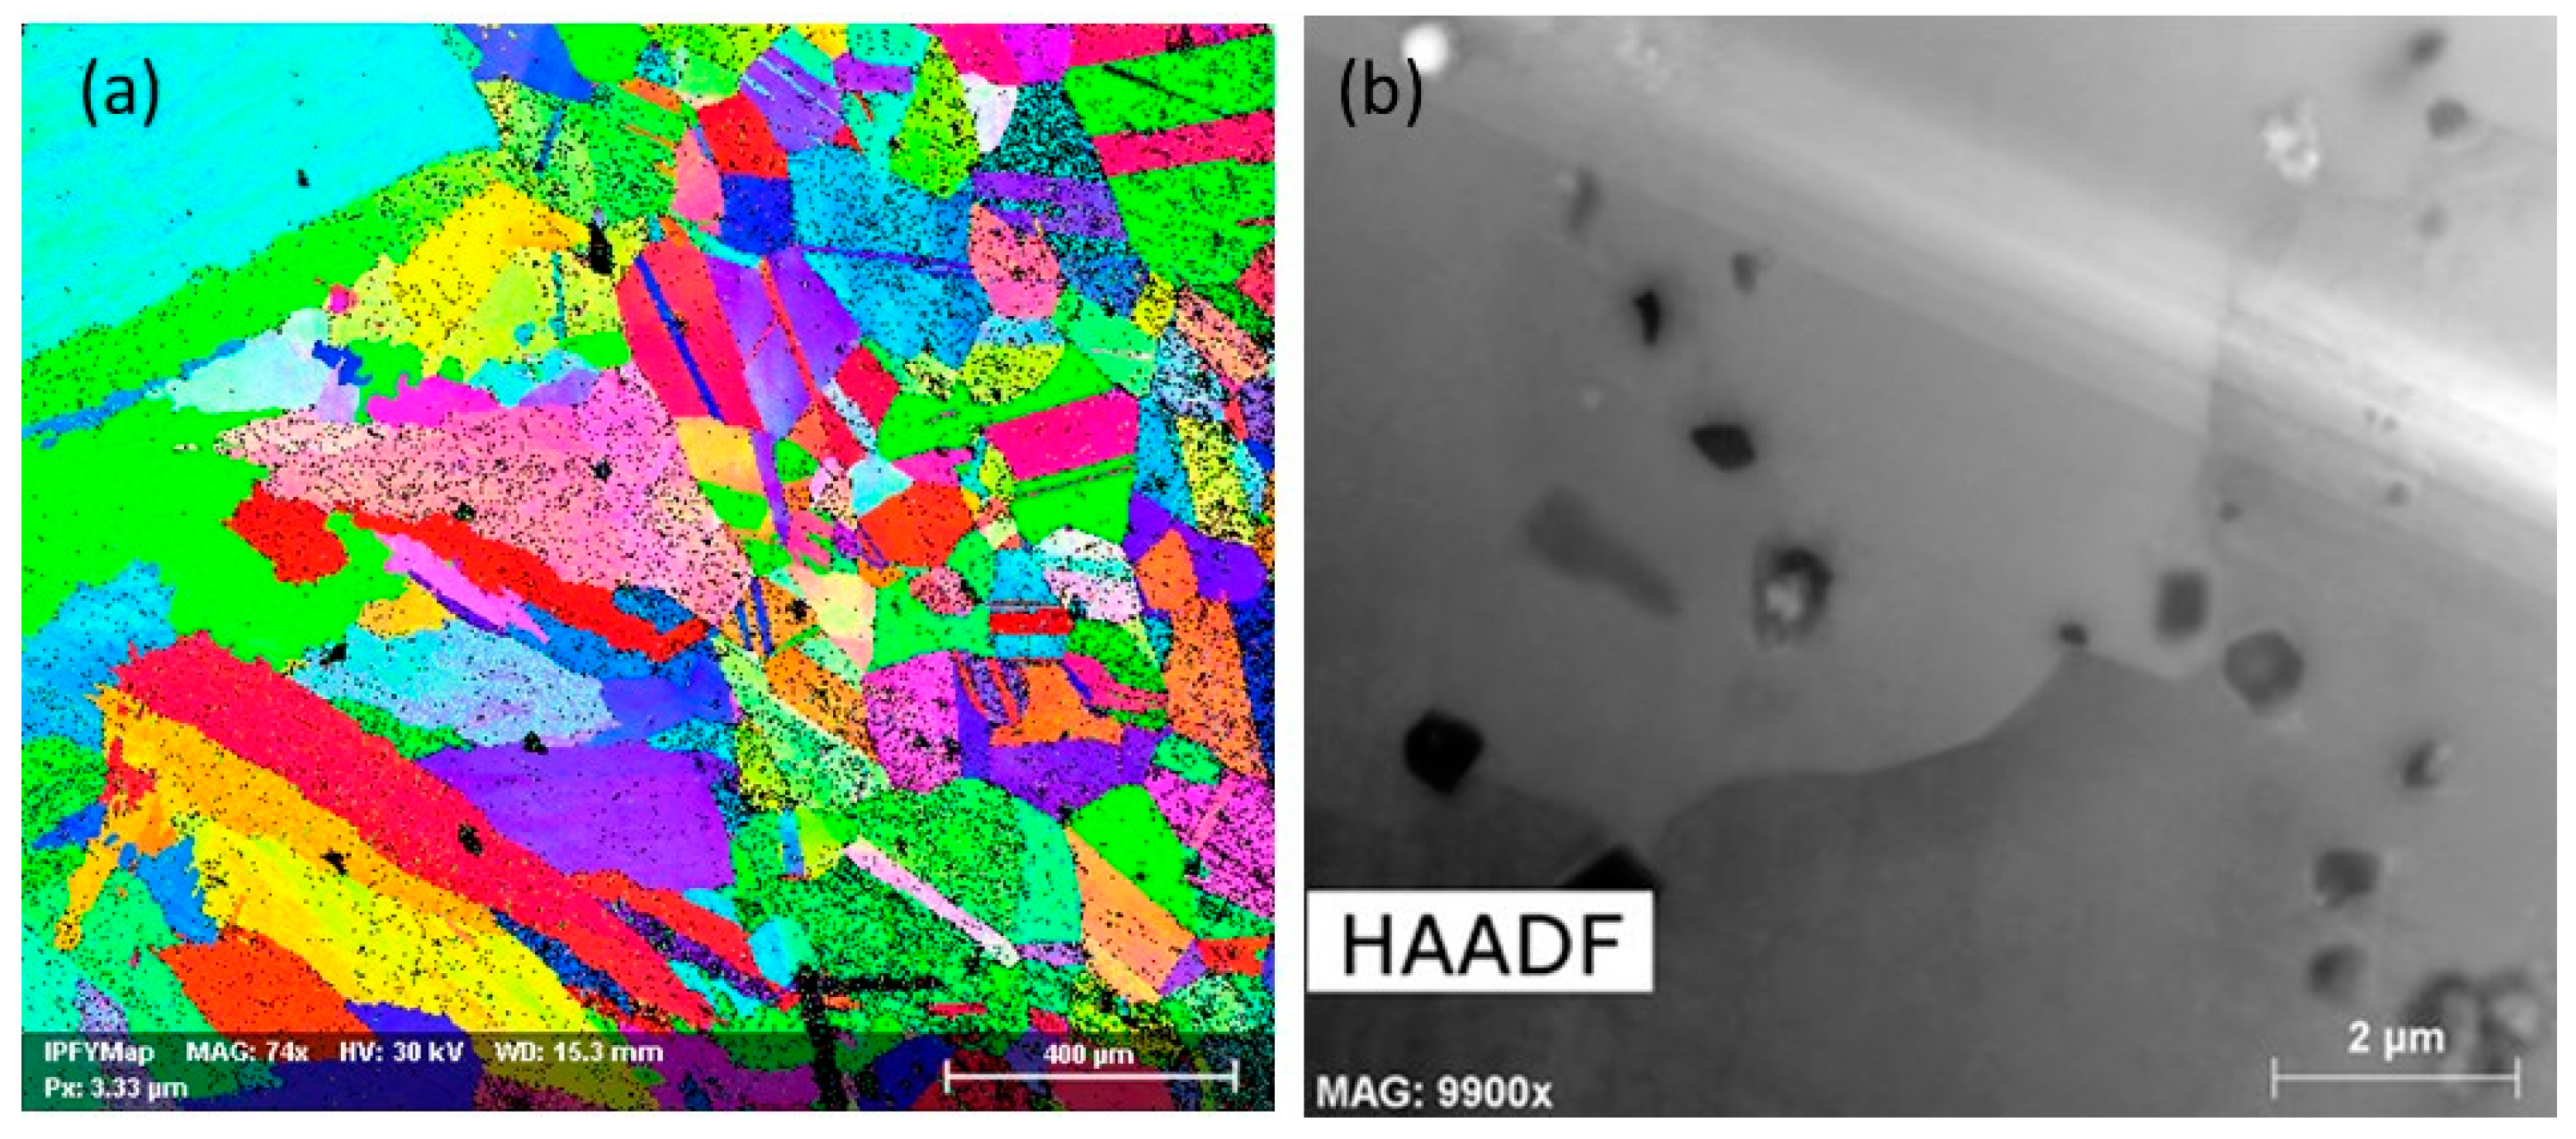
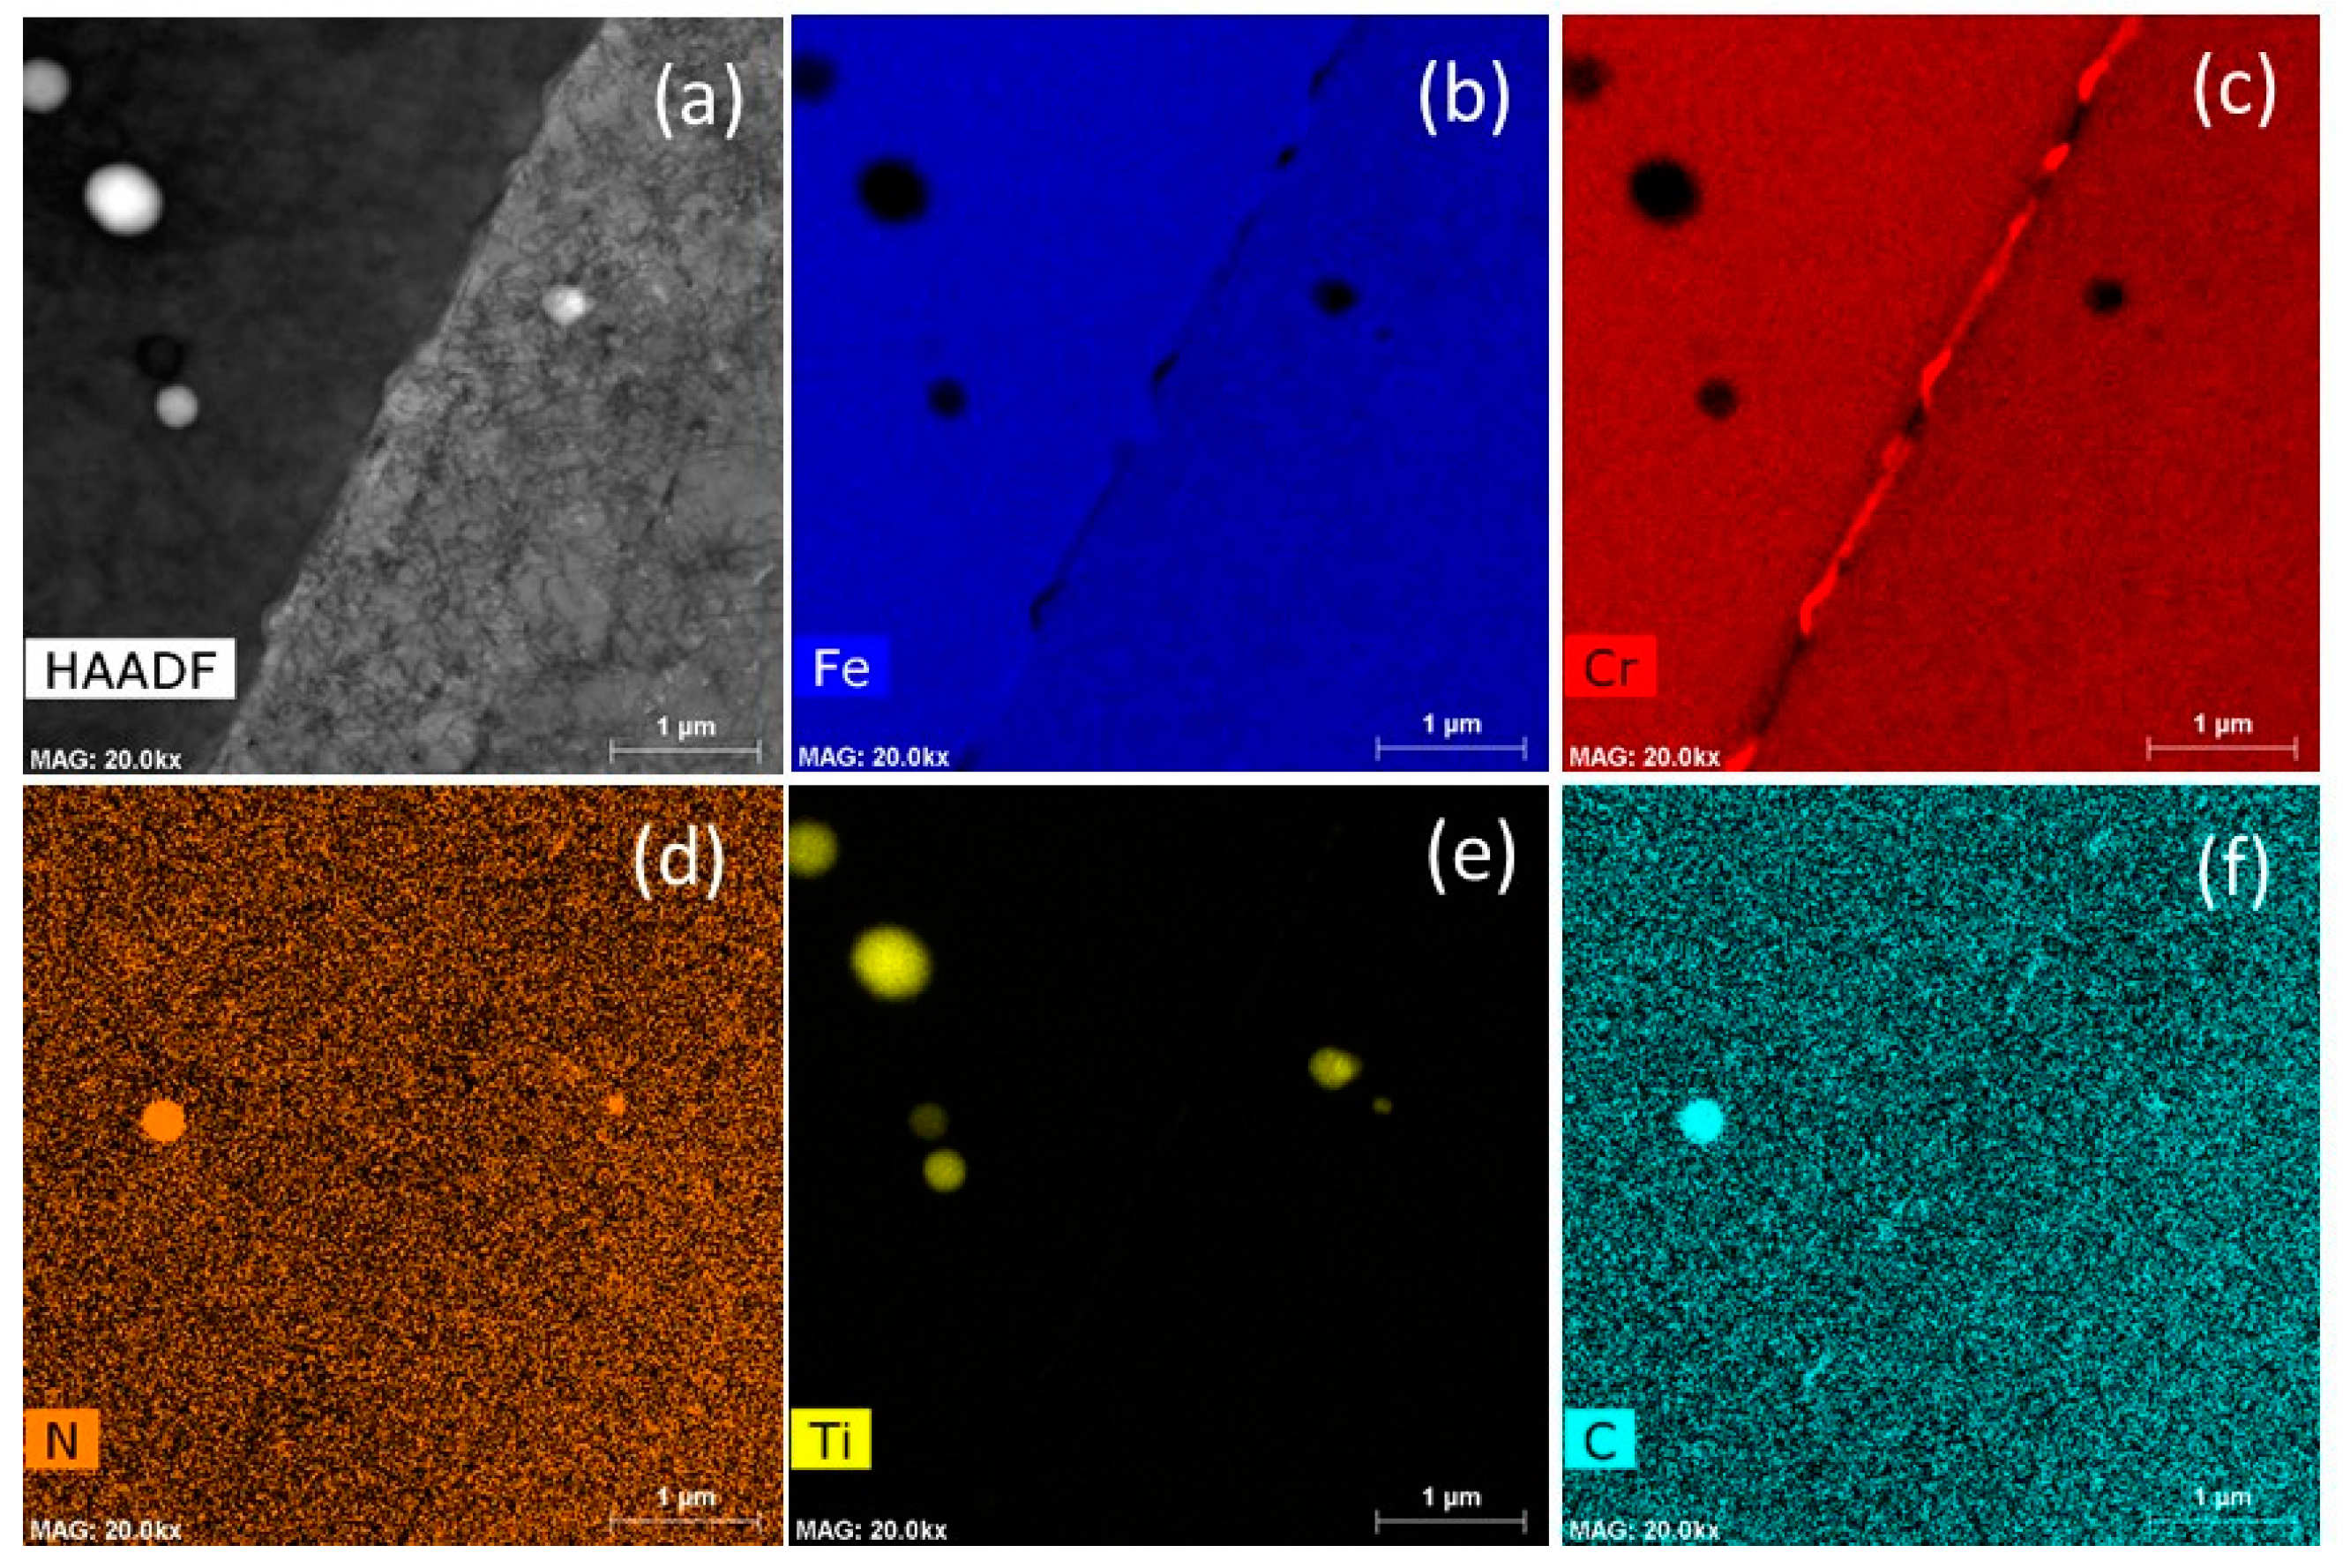
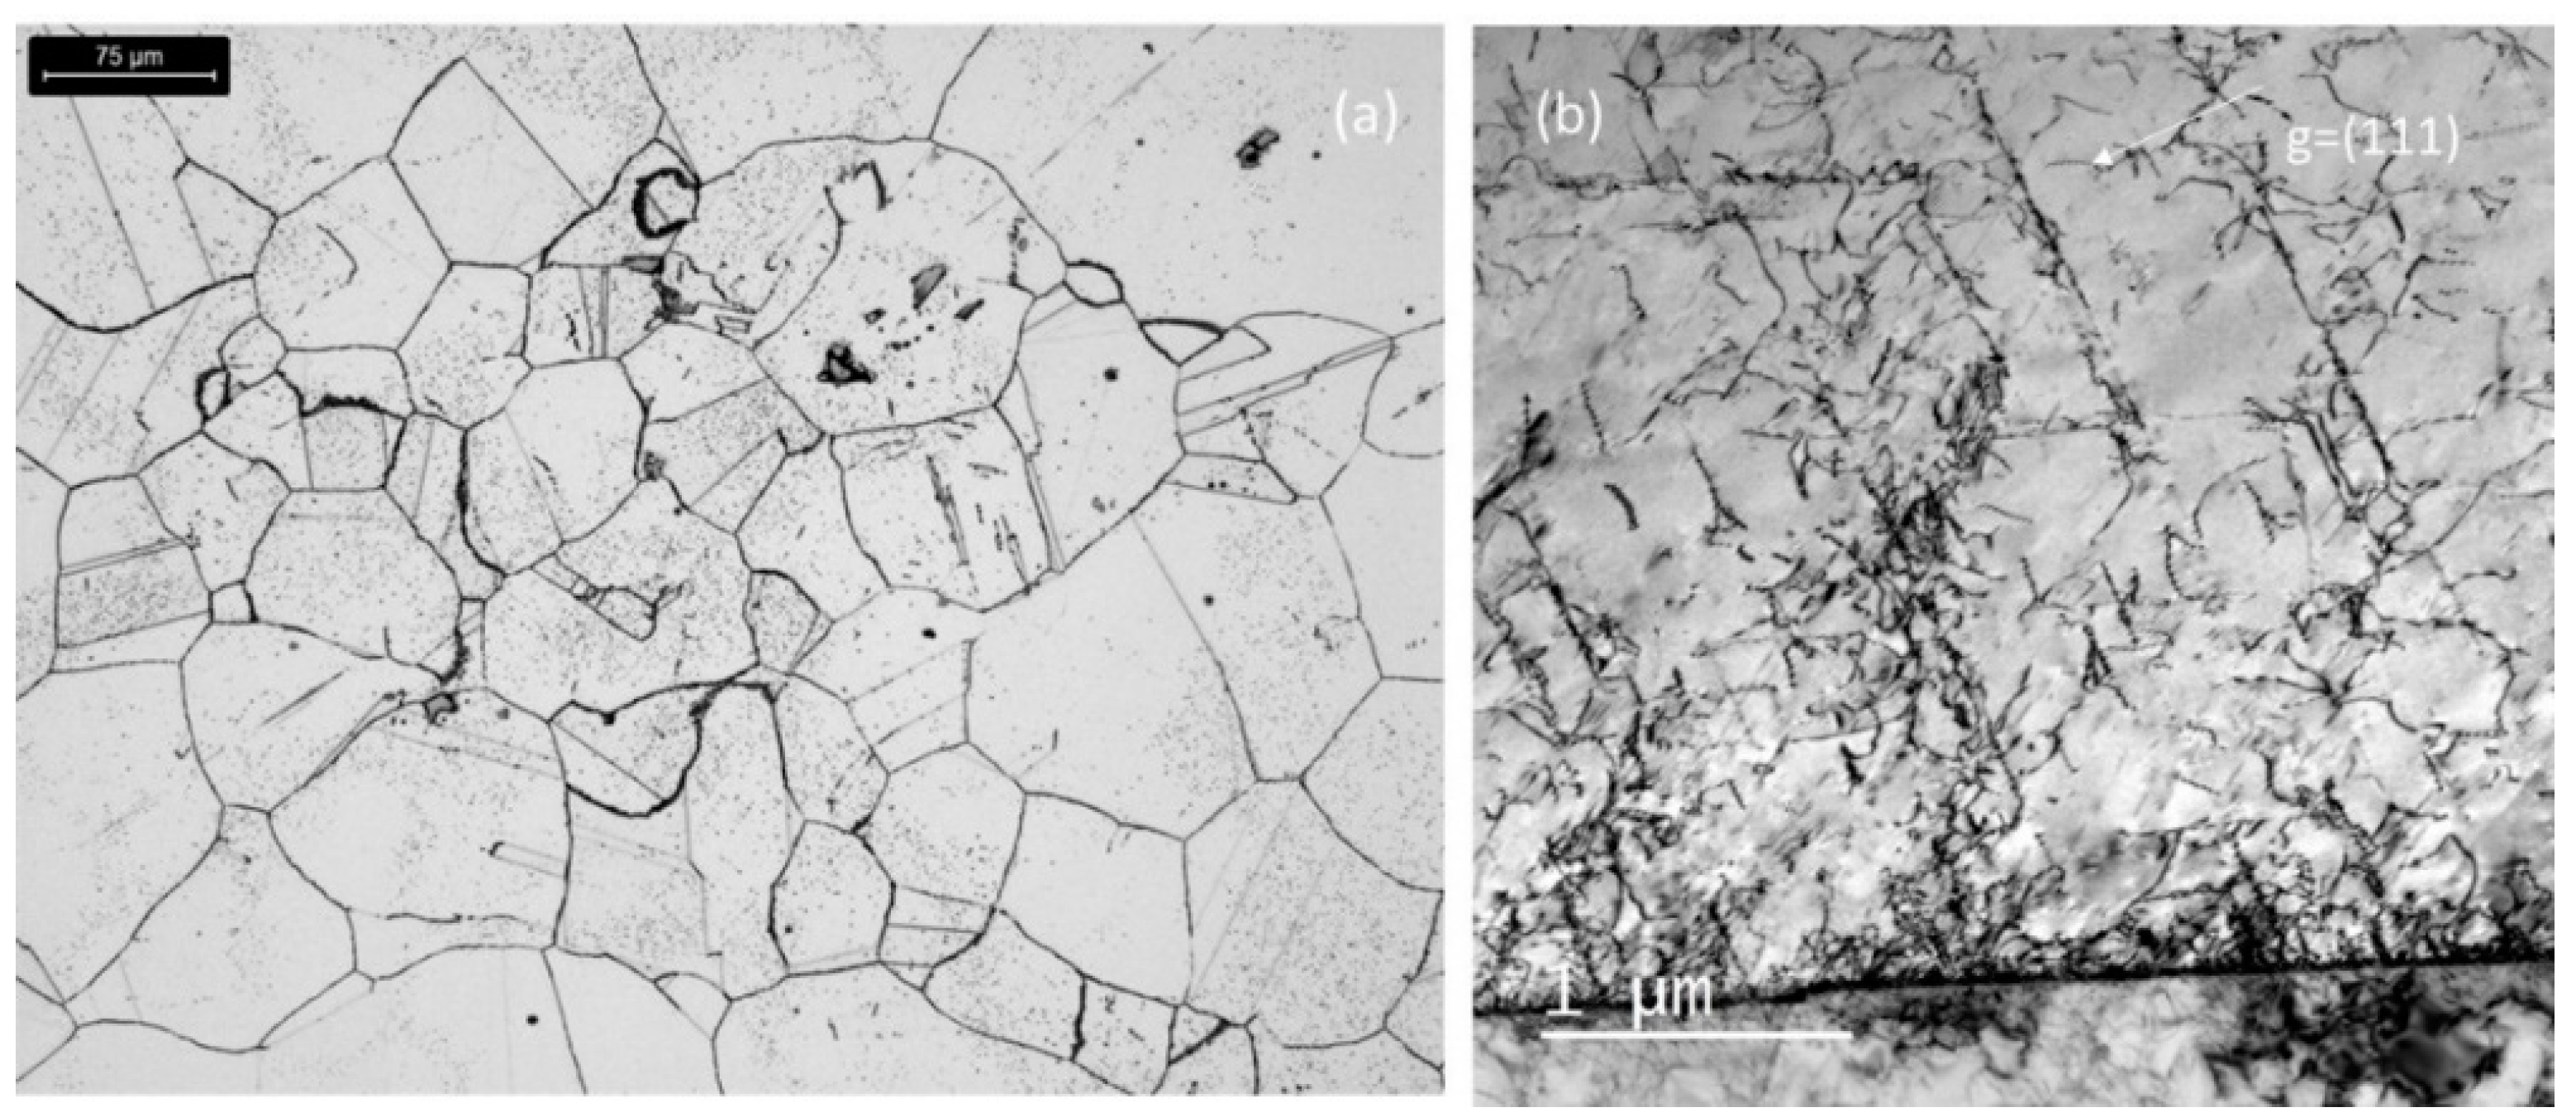
3.4.1. As-Received Alloy 800H Base Metal
3.4.2. As-Welded Microstructure
3.4.3. Microstructure after Creep Rupture
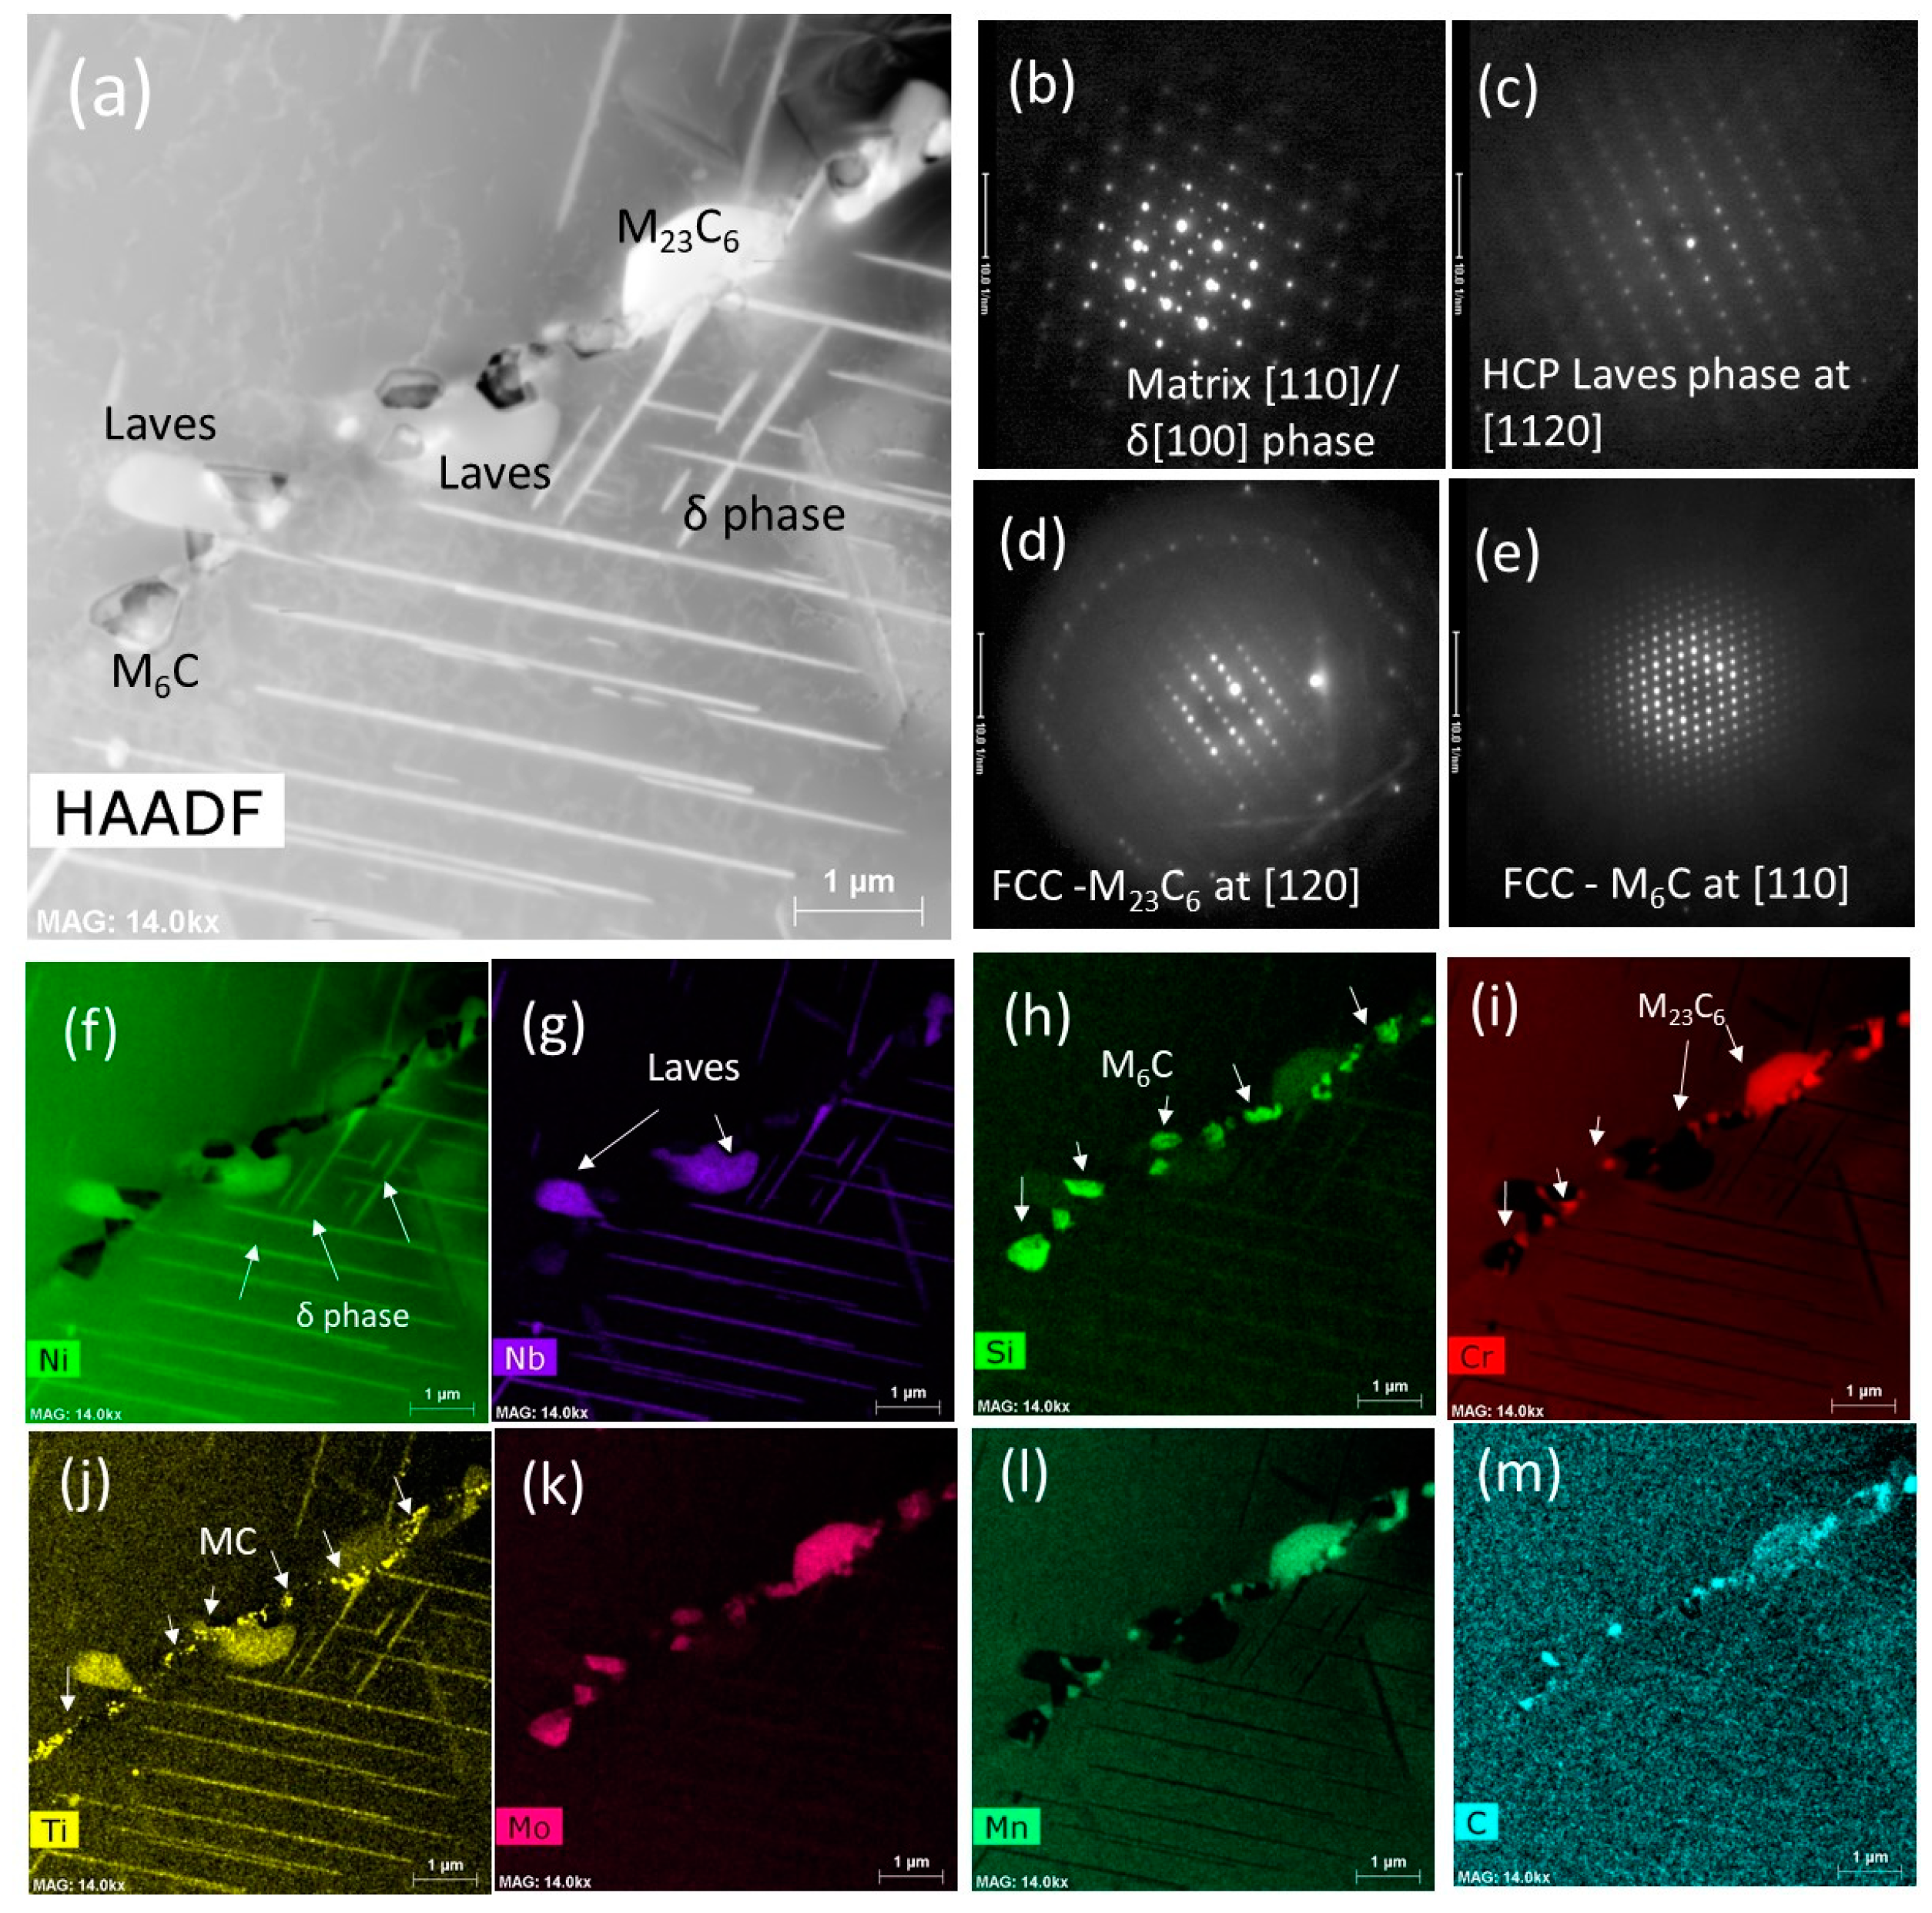
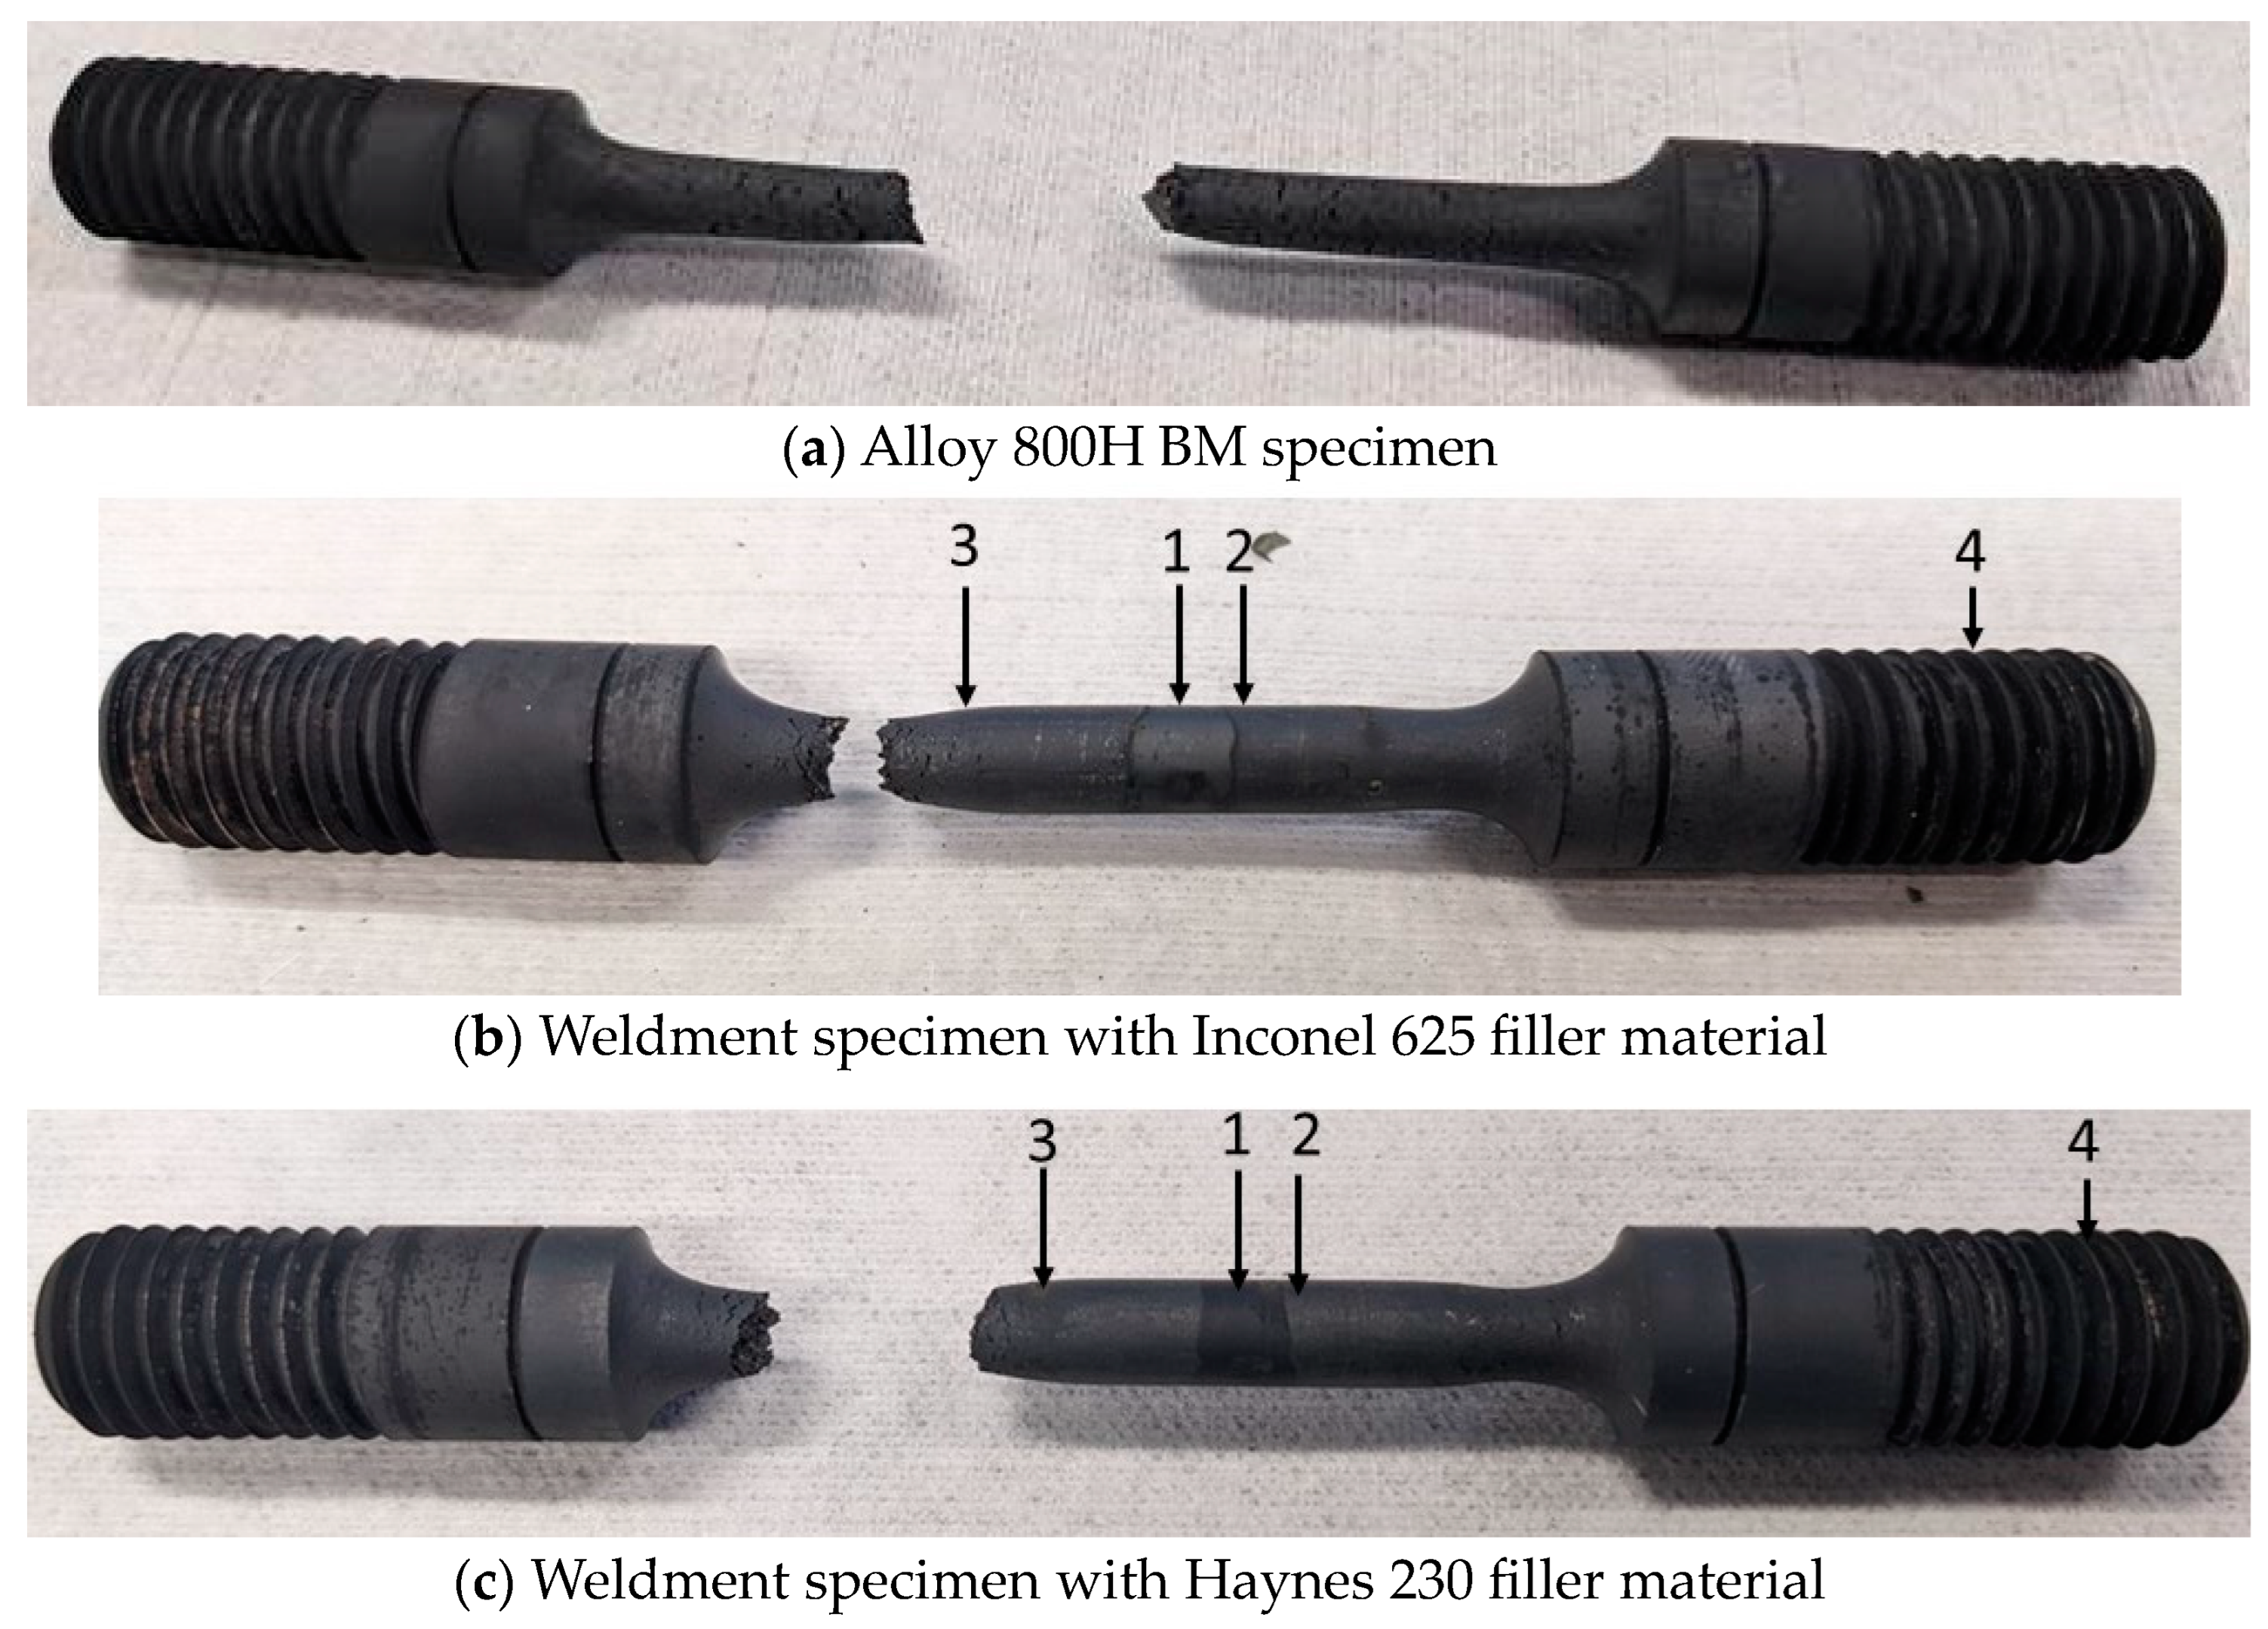
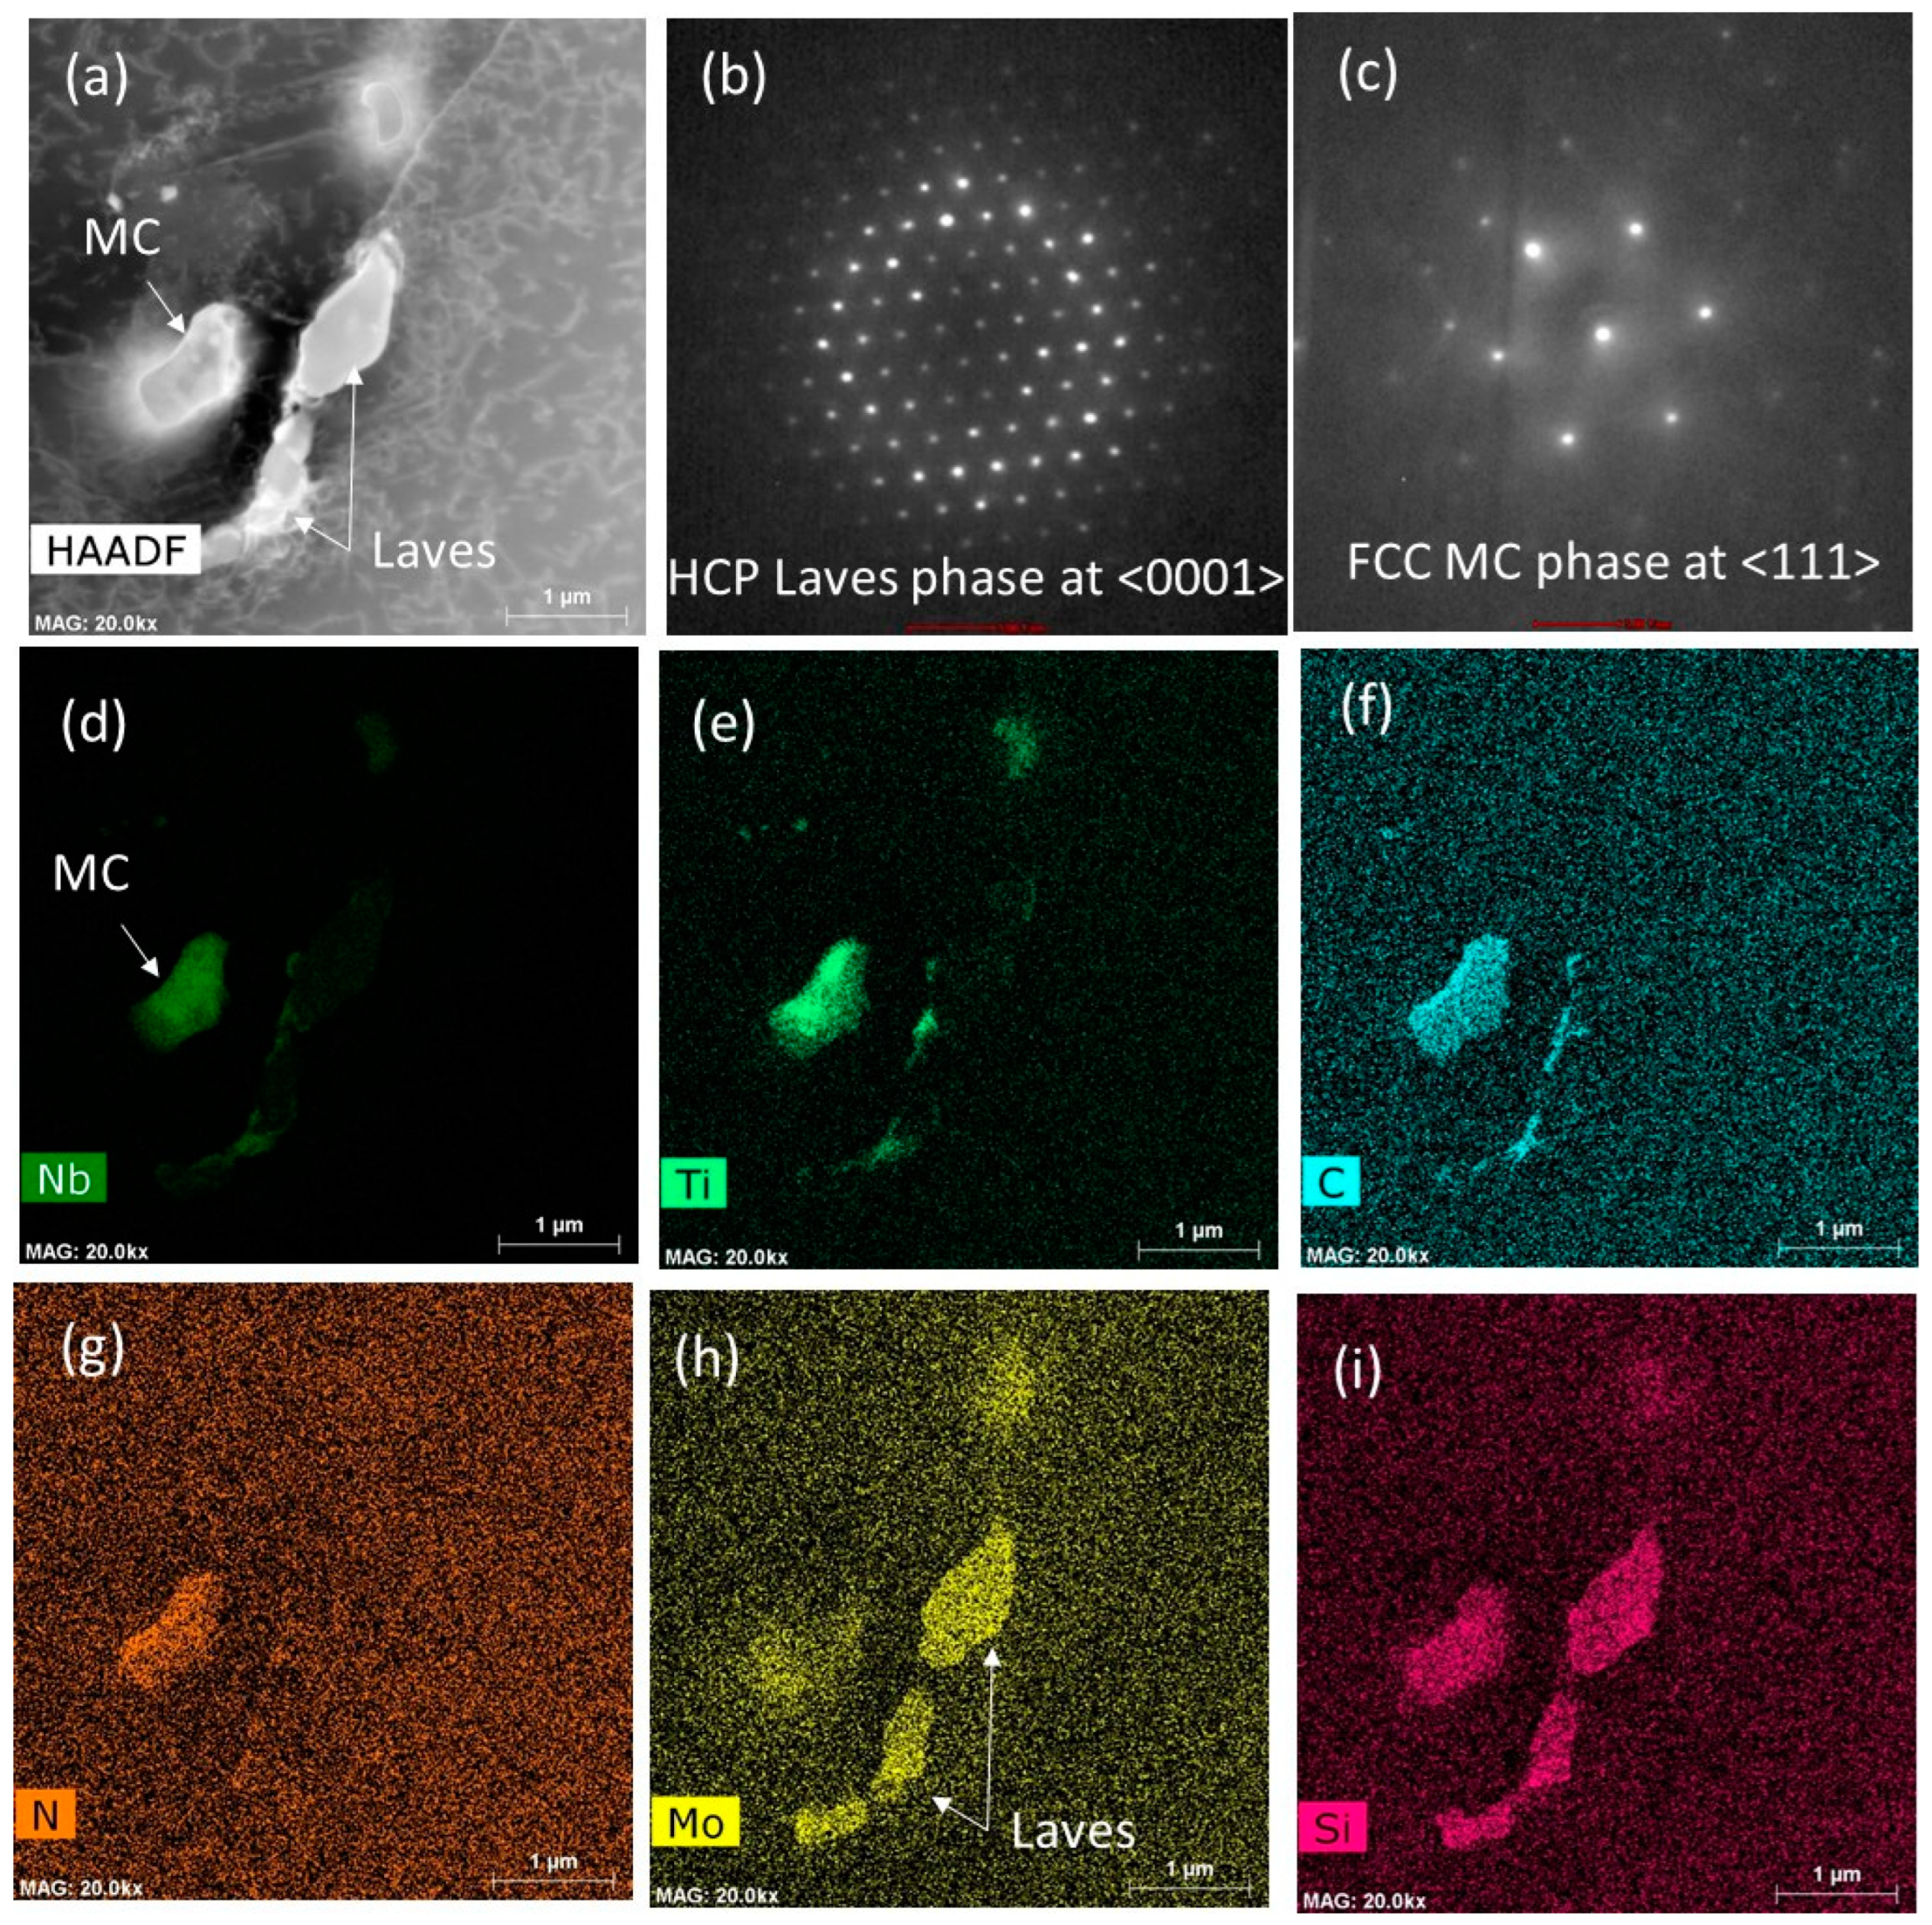
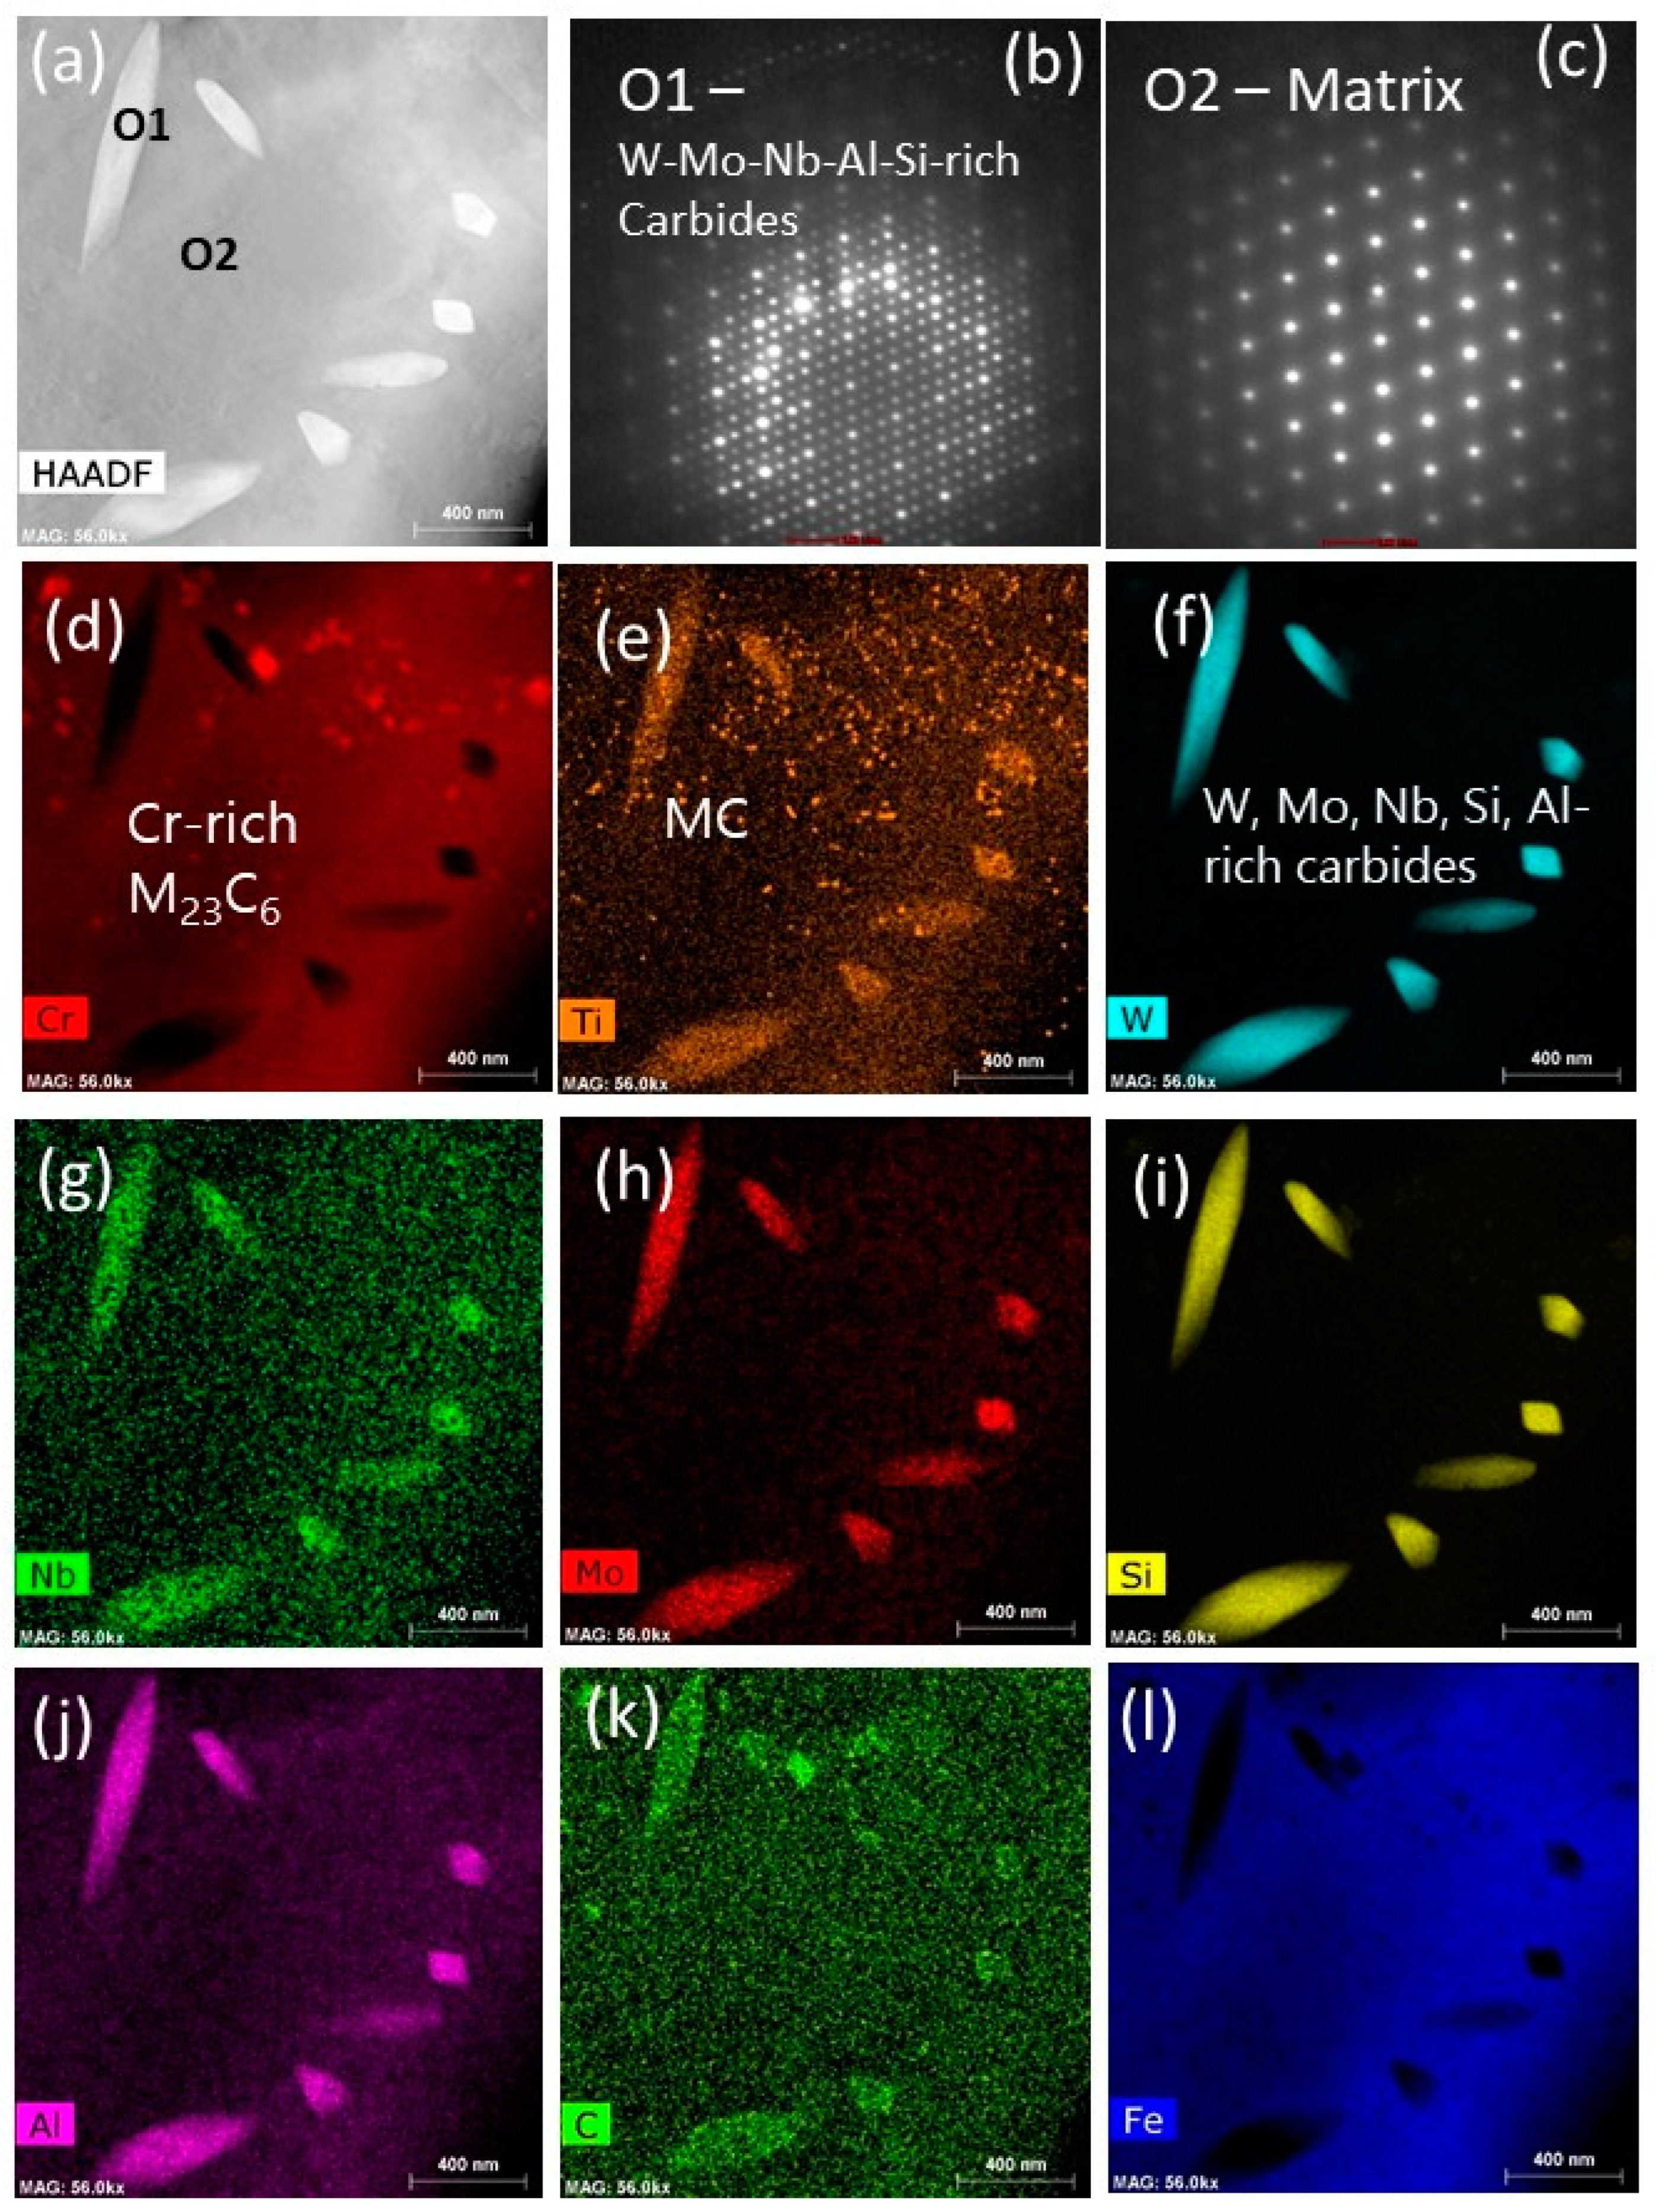
FZ of Inconel 625 and Haynes 230 Filler Specimens (Region 1 in Figure 6)
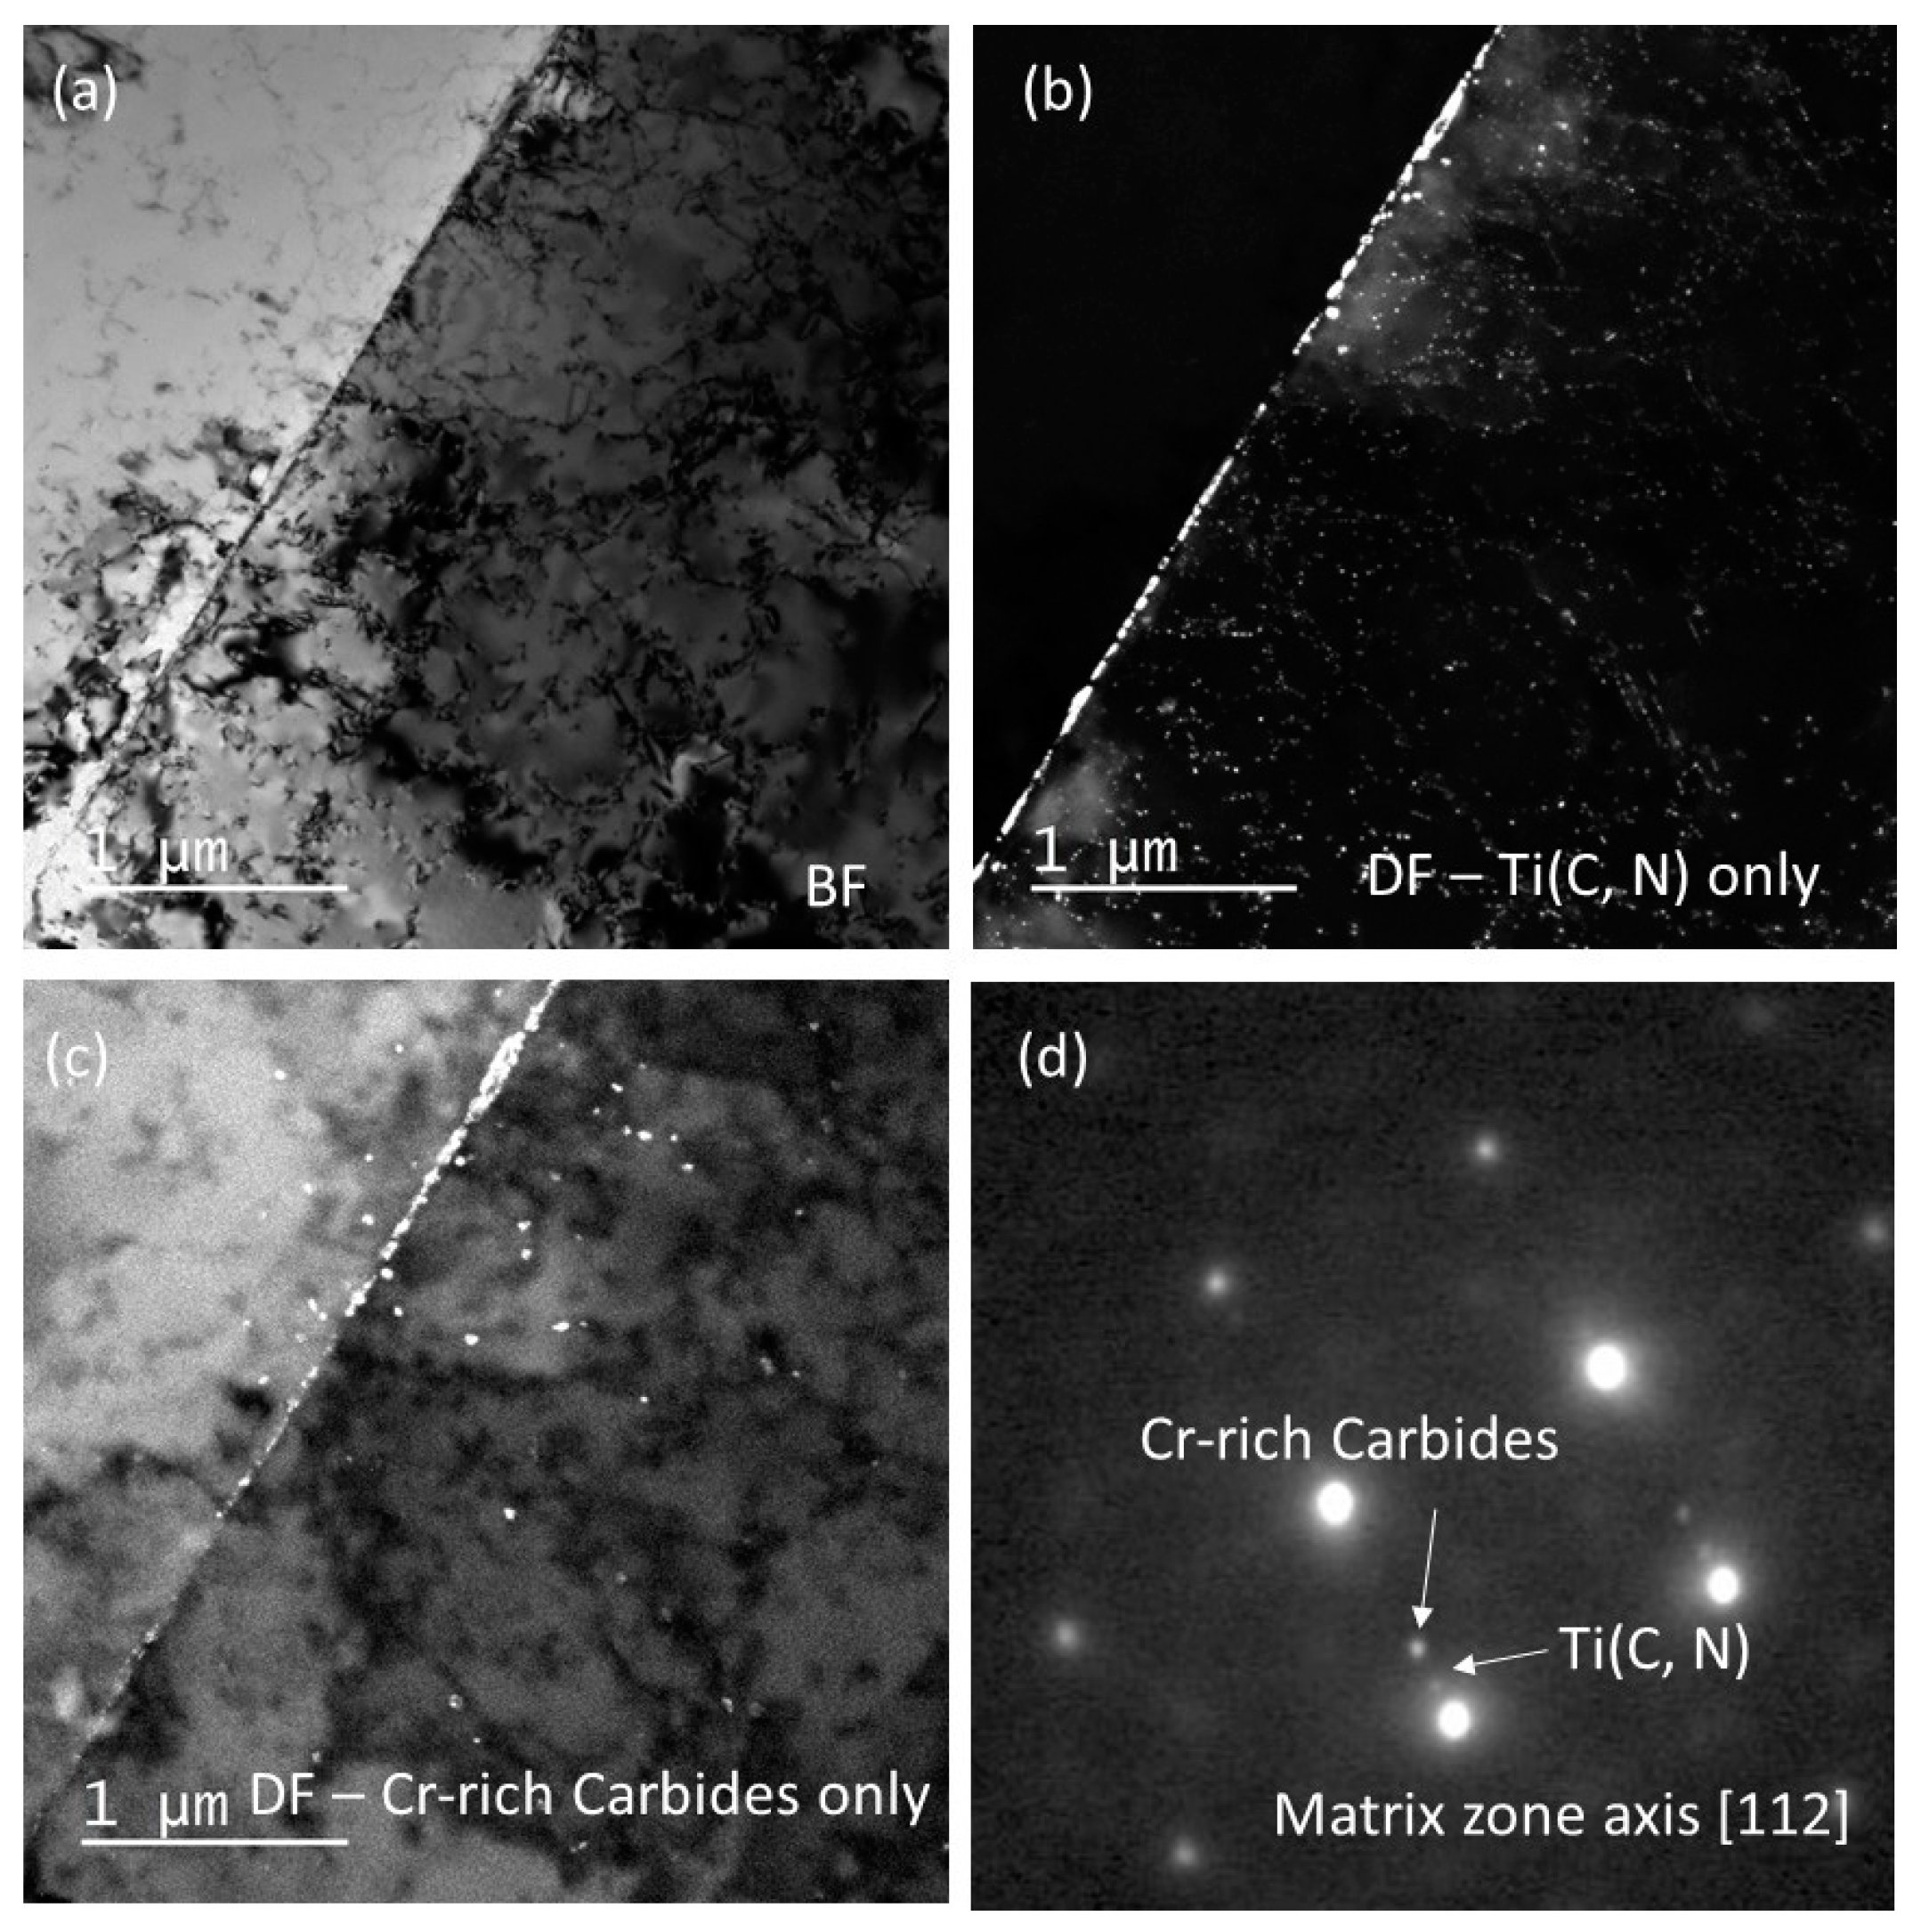
HAZ Adjacent to Fusion Boundary (Region 2 in Figure 6)
Base Metal Close to Rupture Surface (Region 3 in Figure 6)
High-Temperature Ageing Structure in Incoloy 800H (Region 4 in Figure 6)
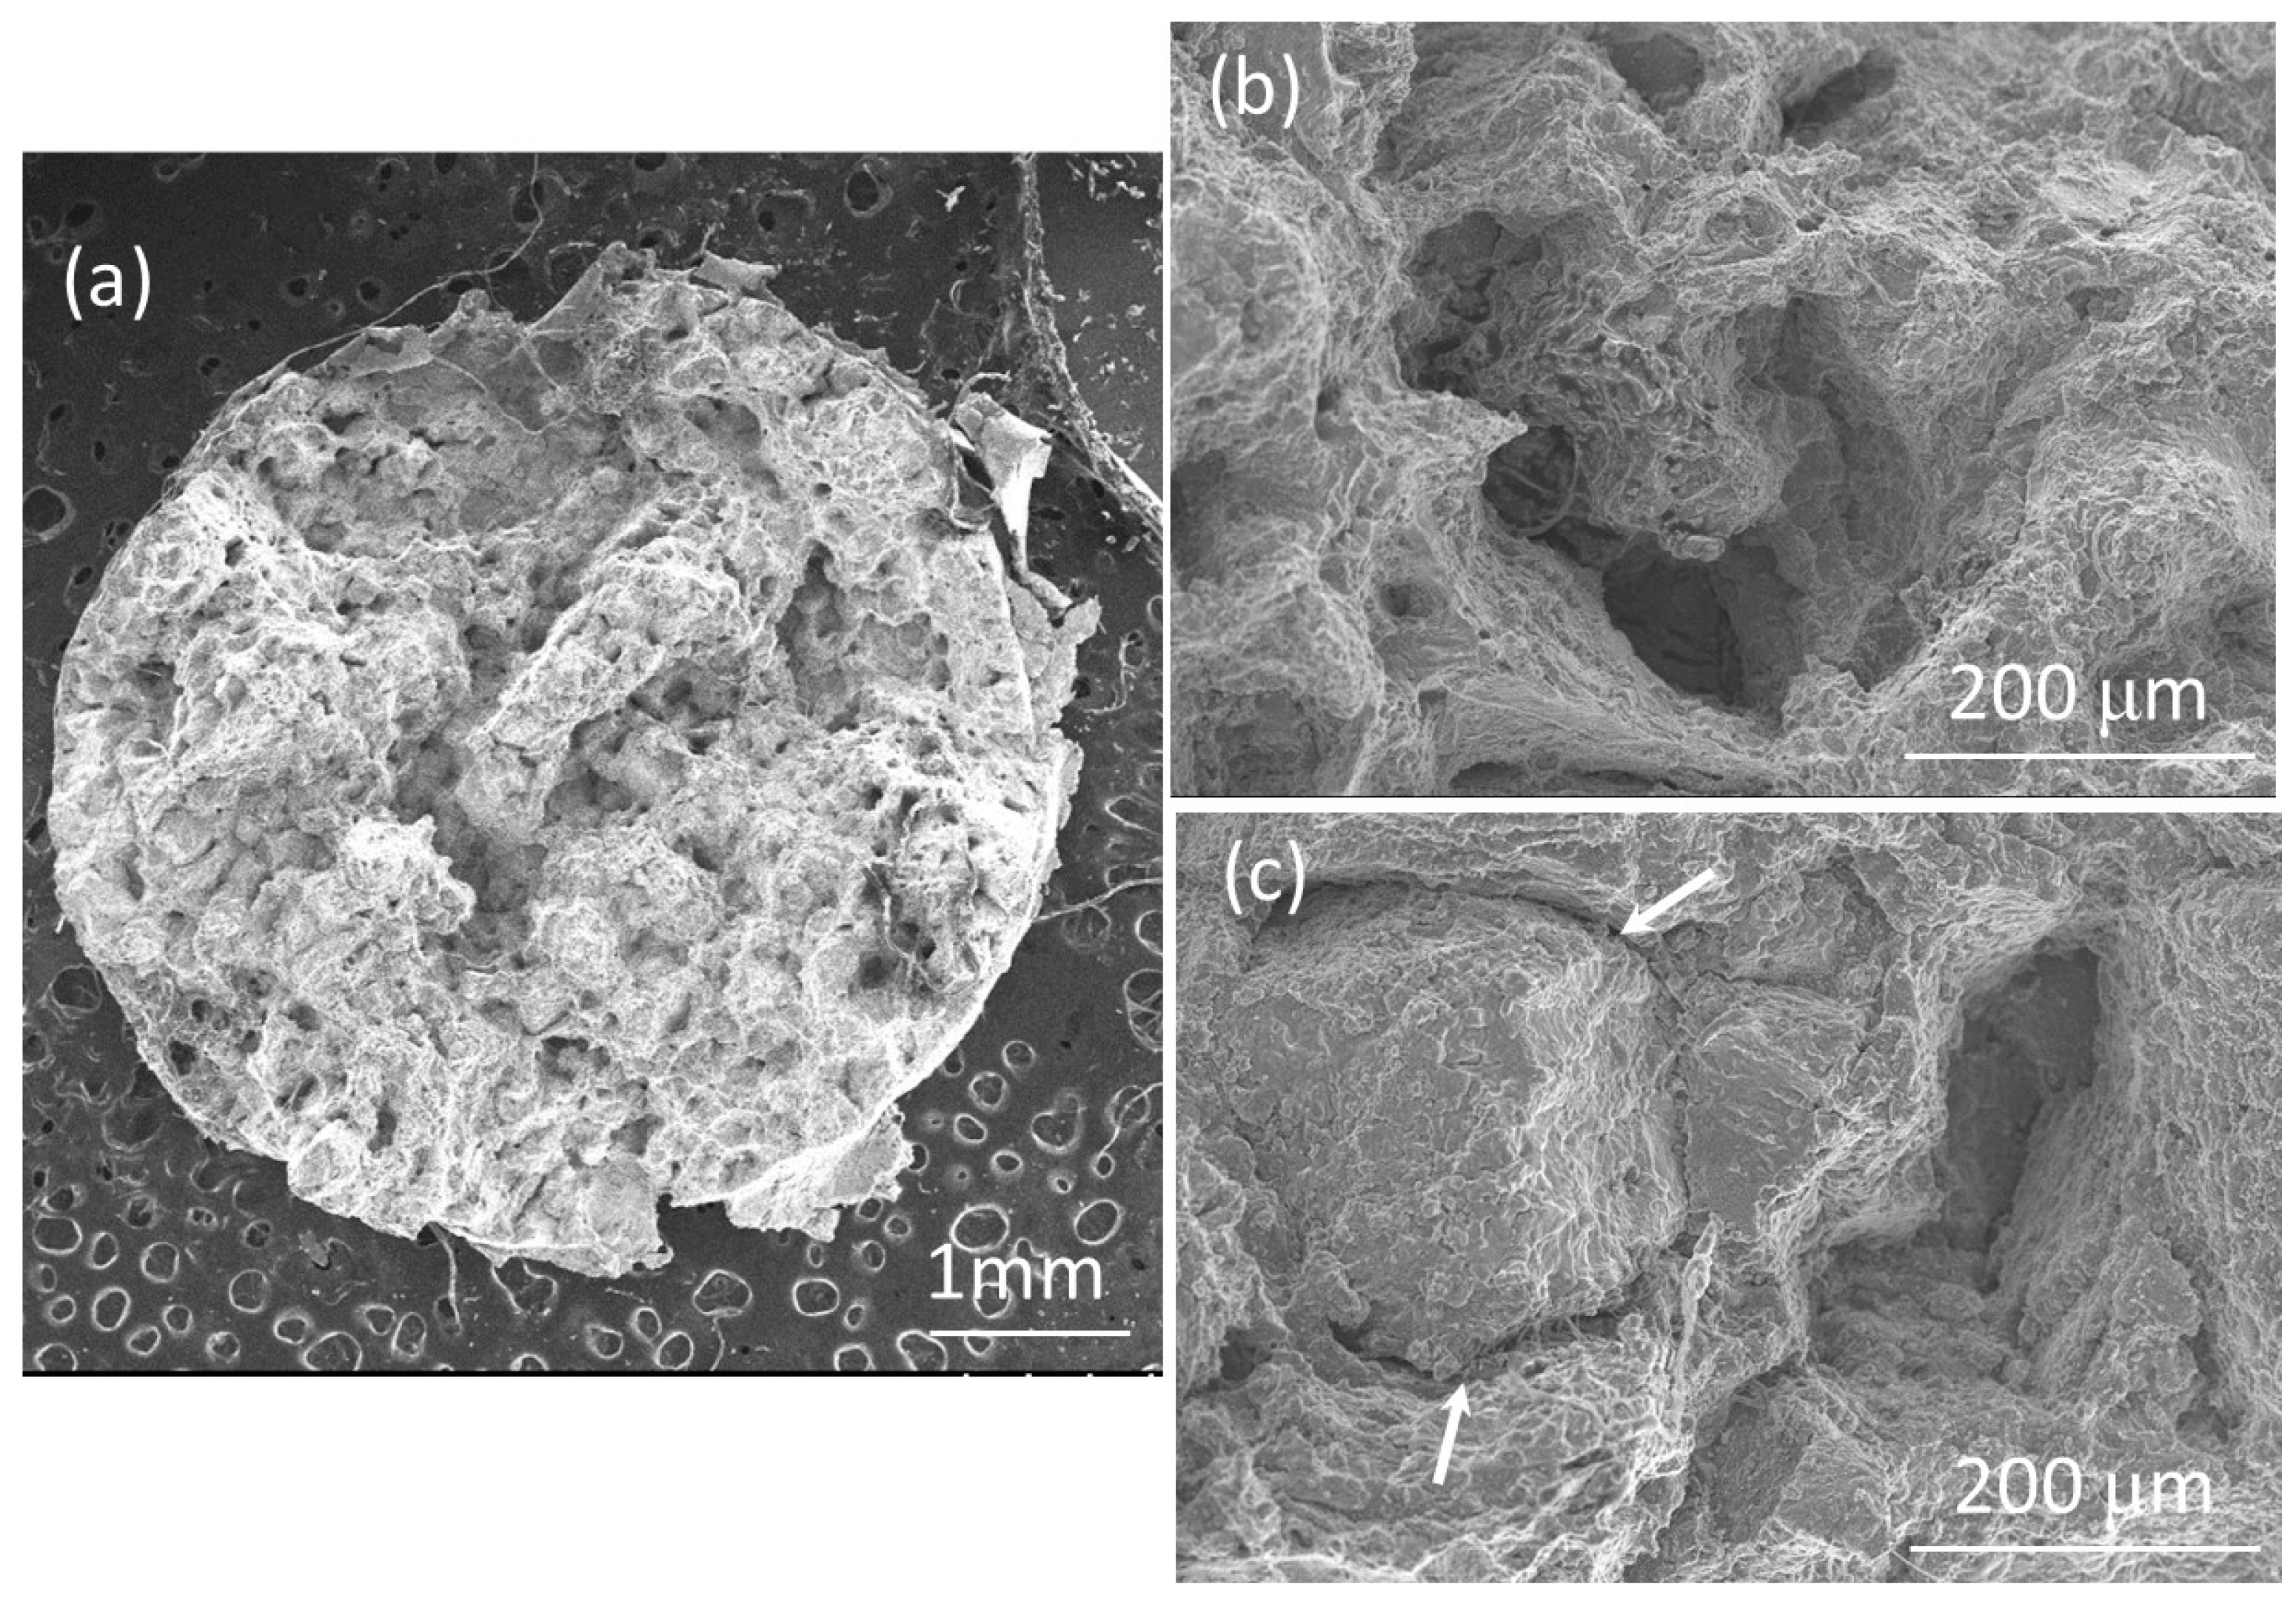
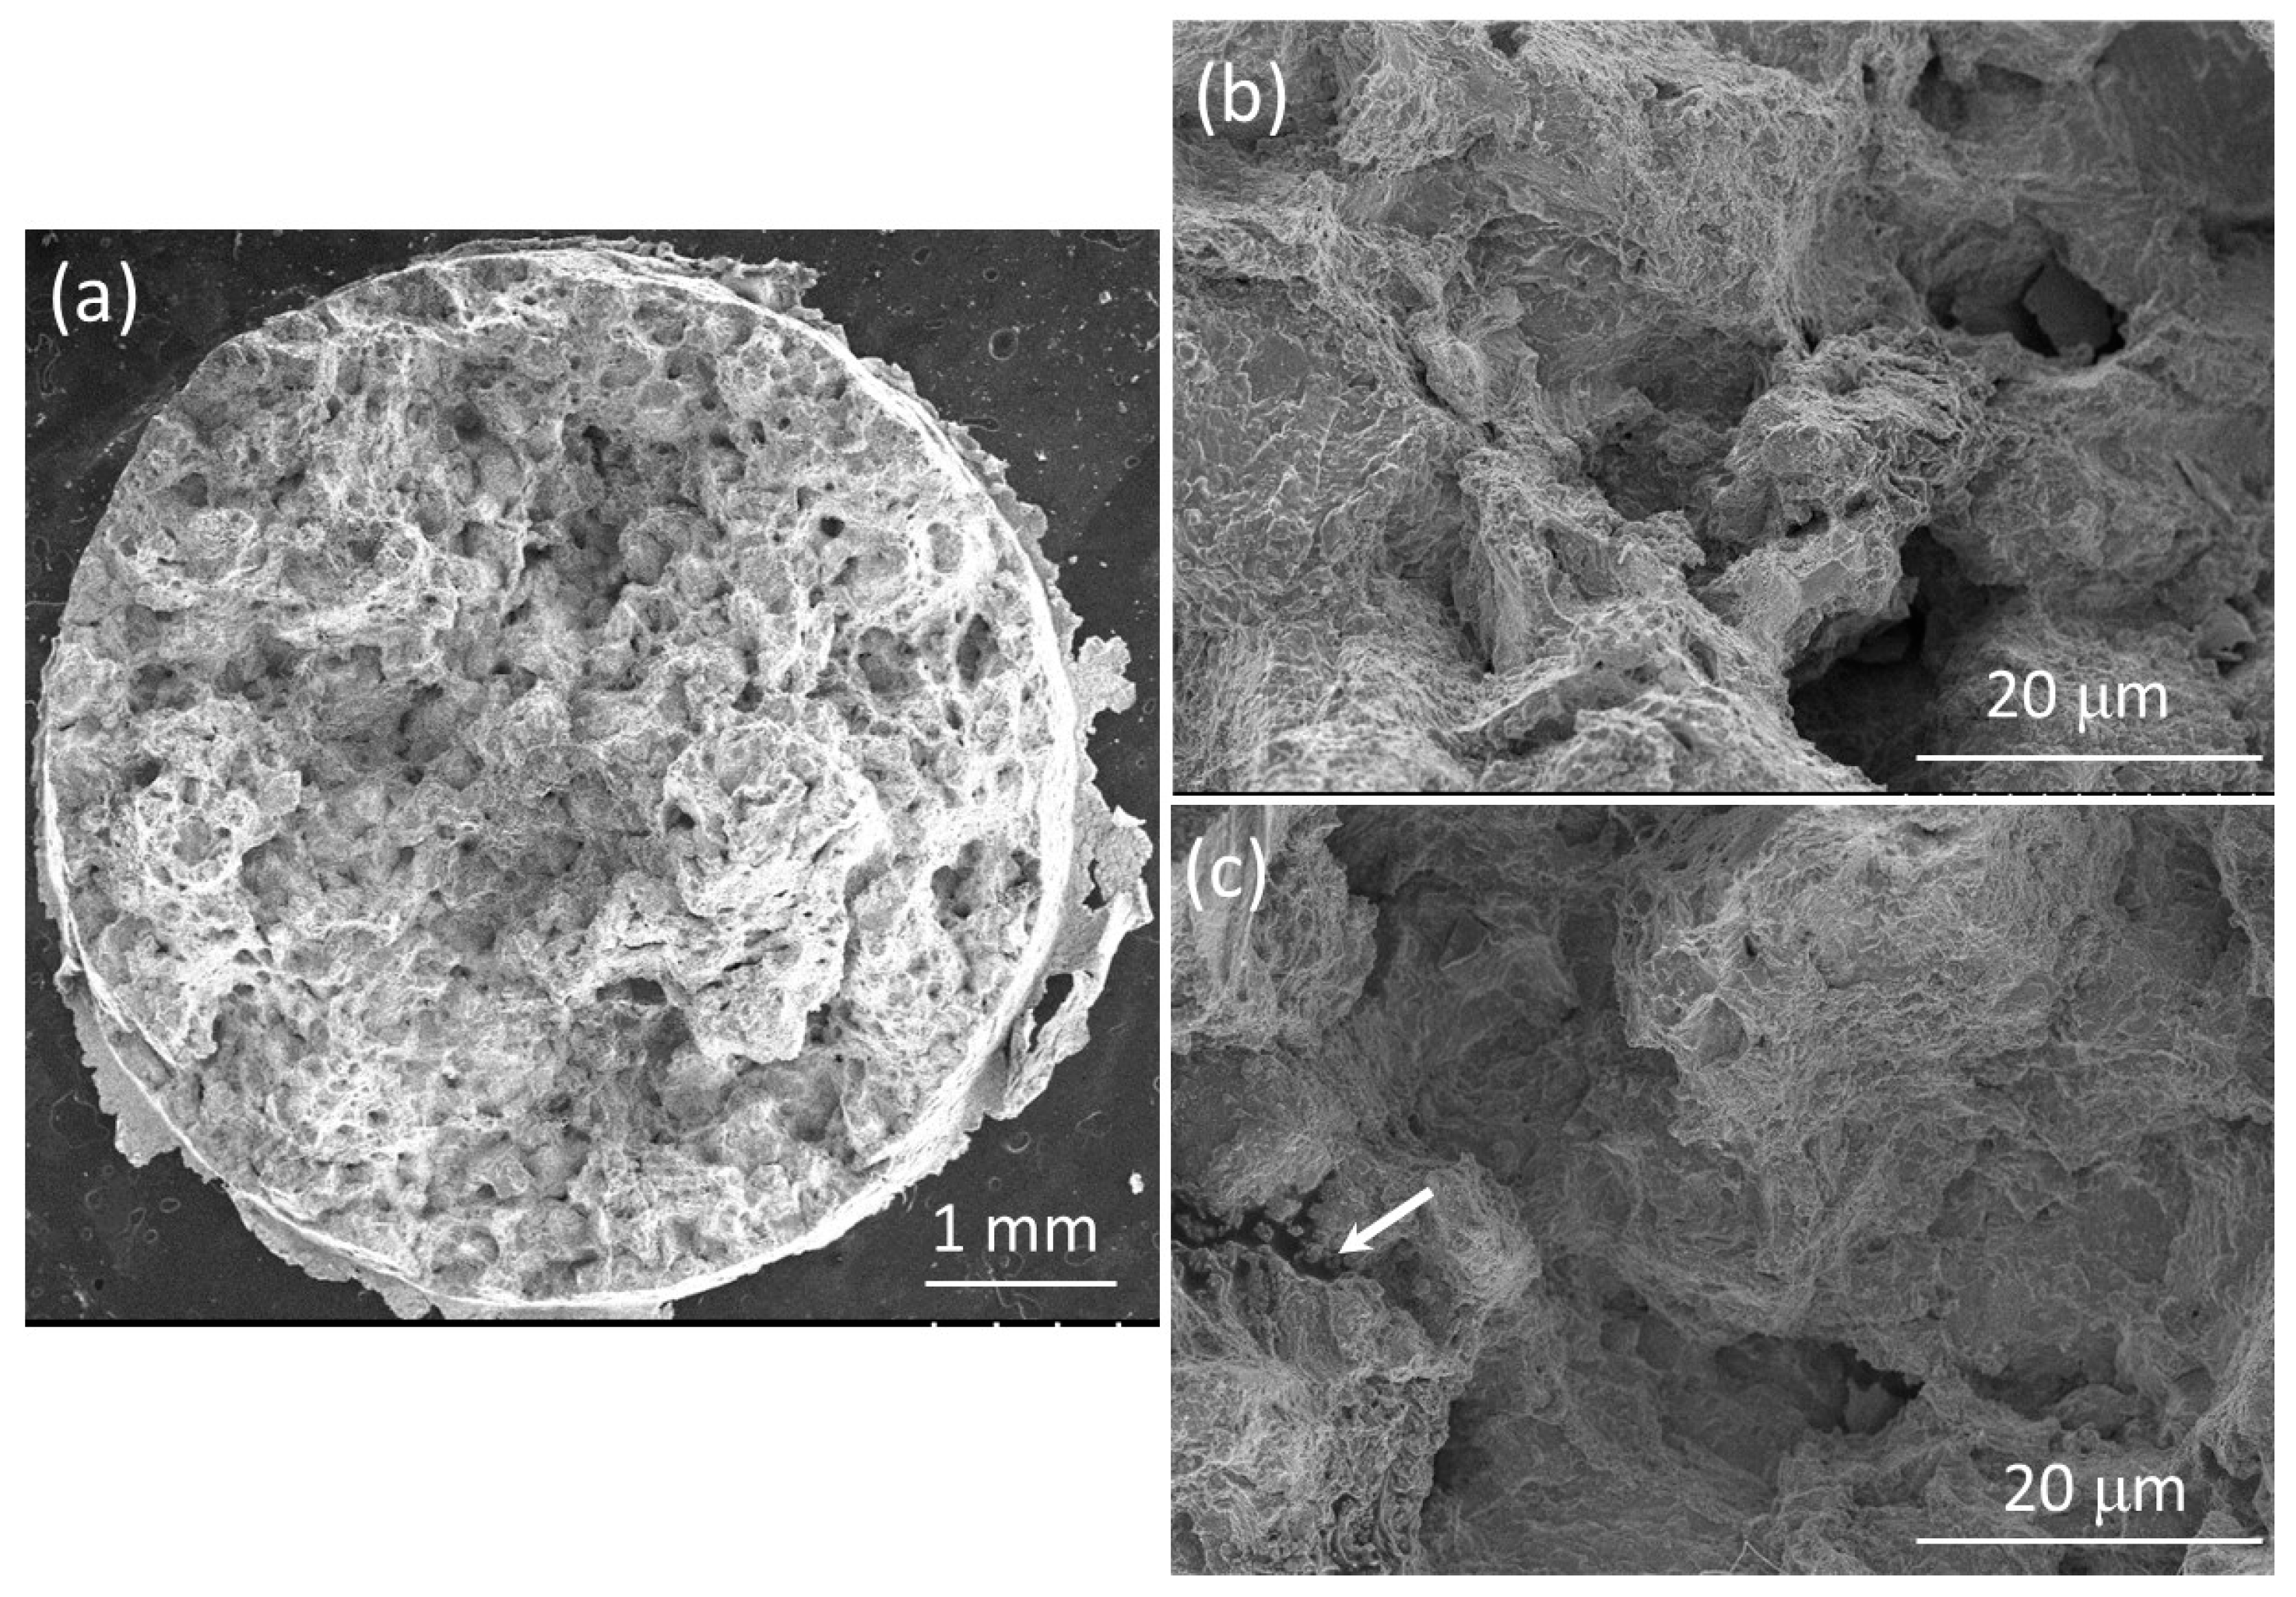
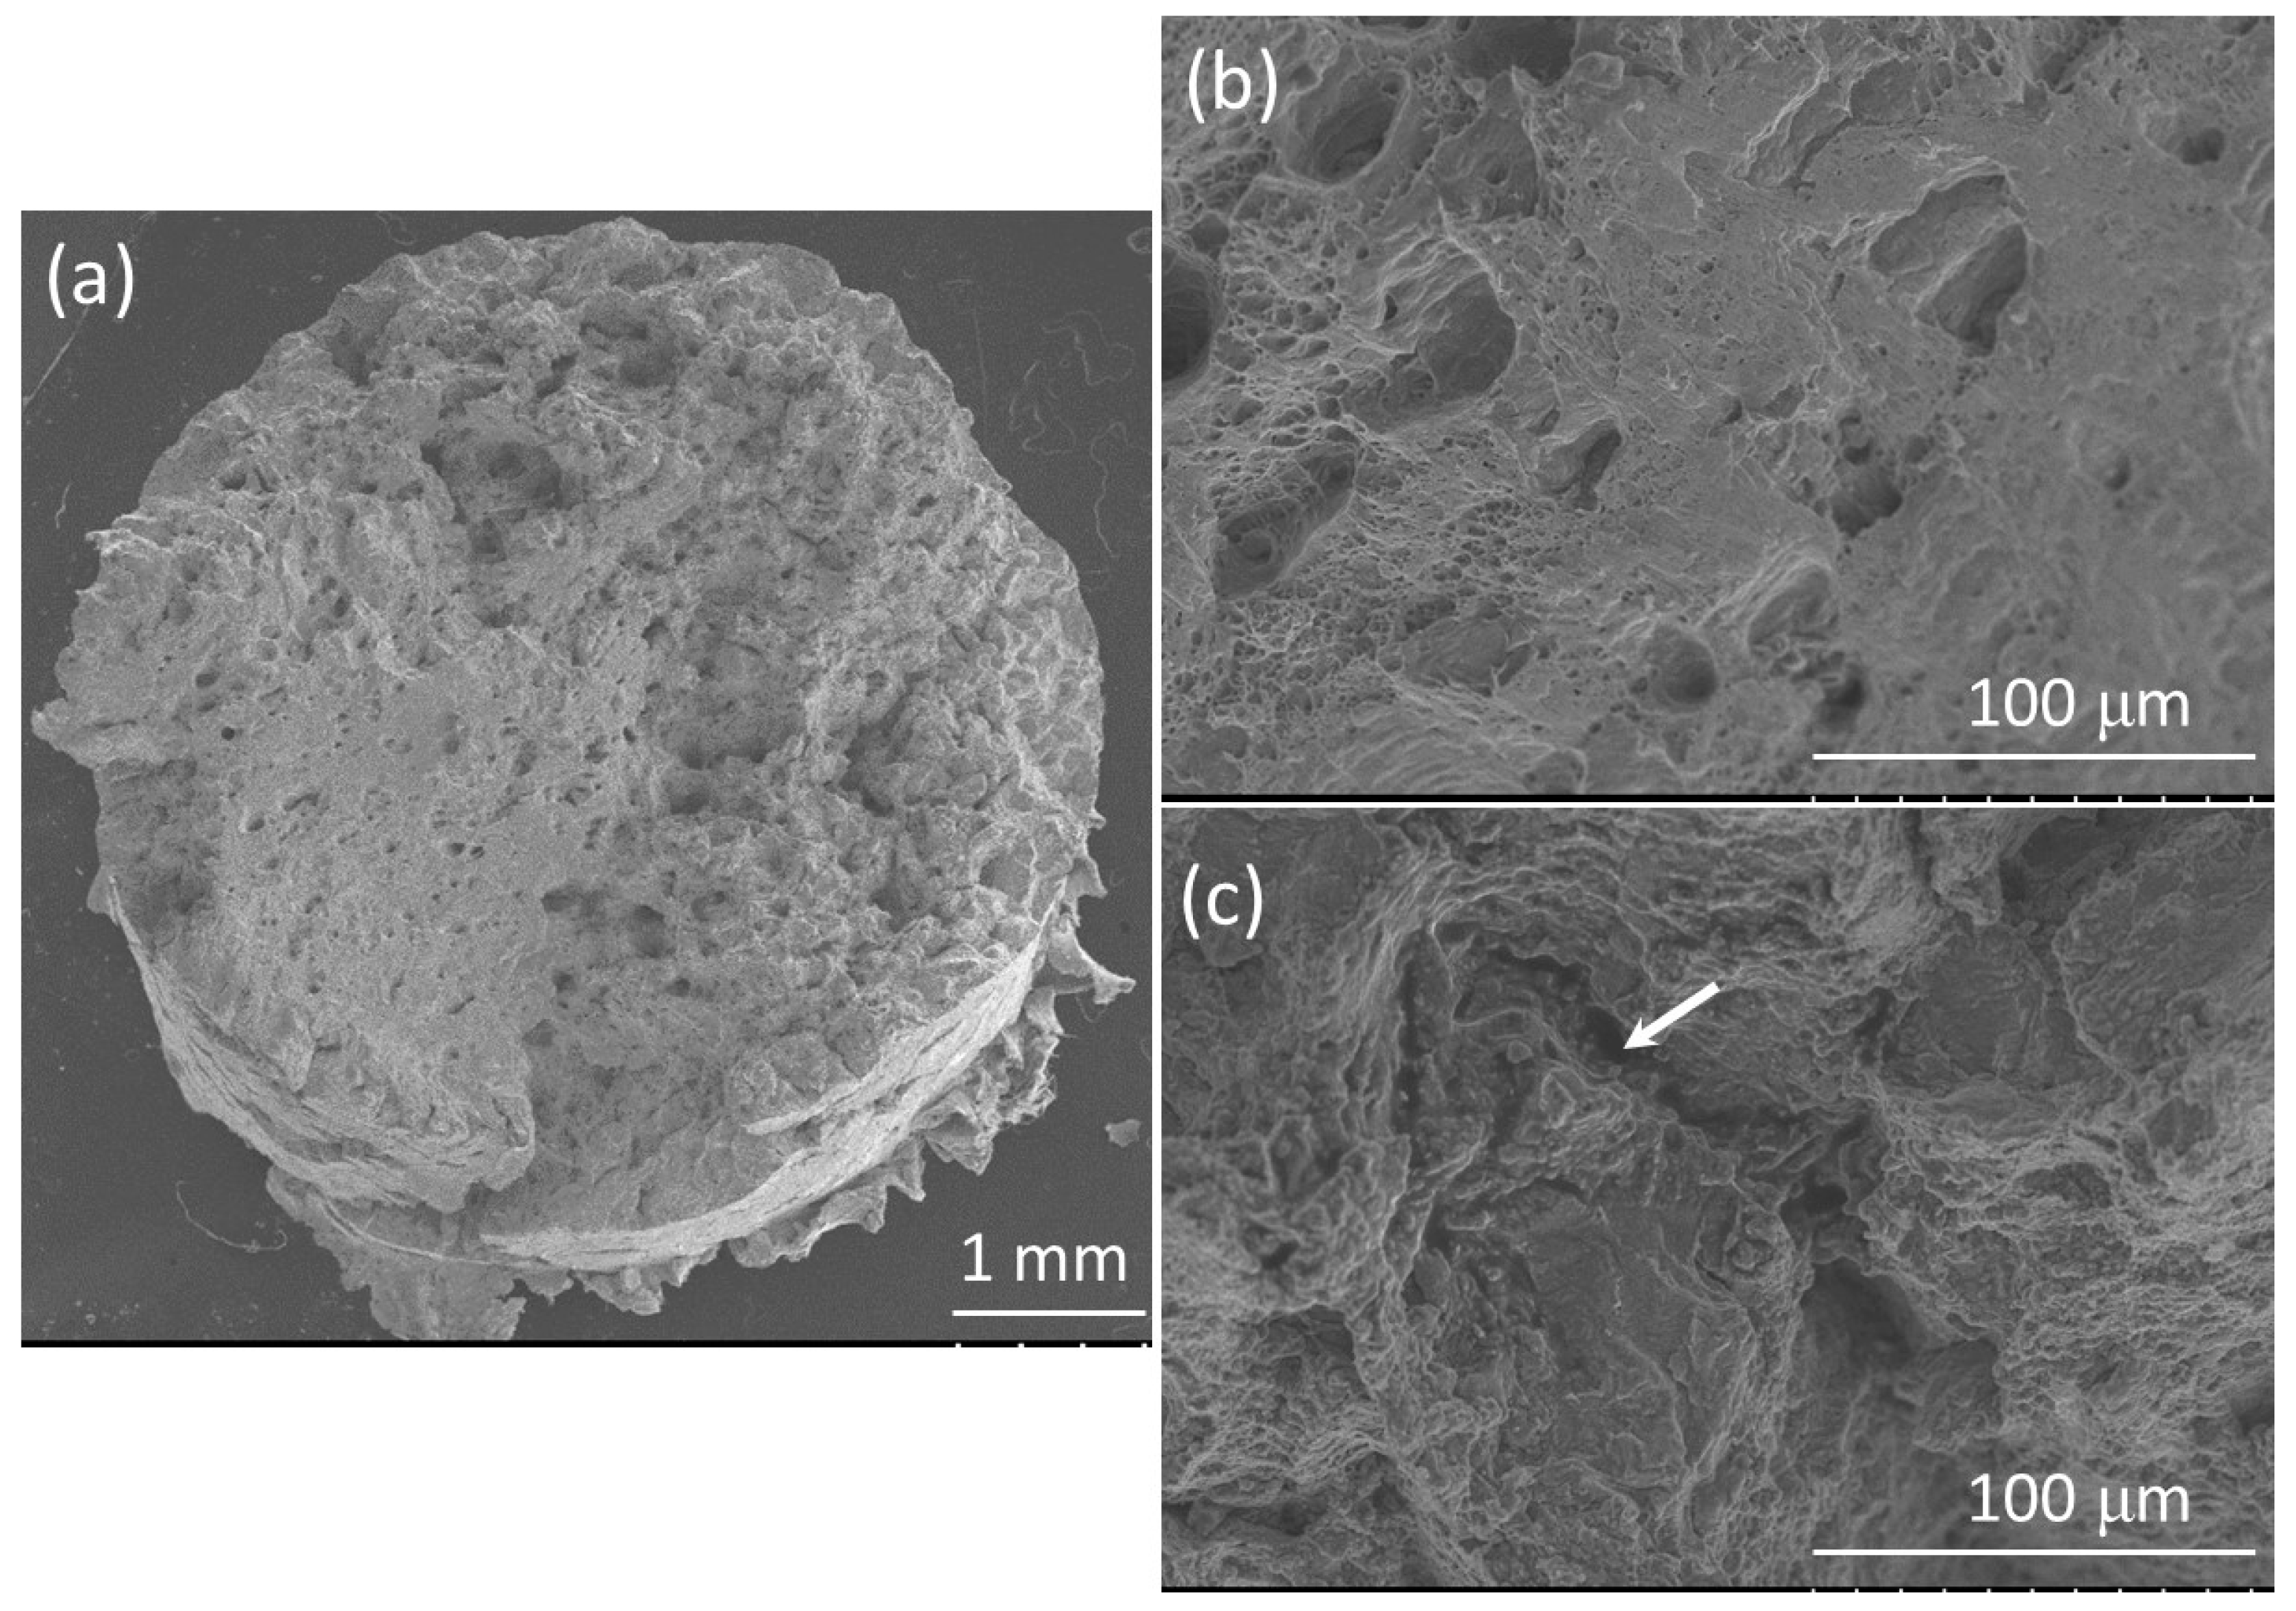
Fractography
4. Discussion
4.1. High-Temperature Creep Deformation and Mechanisms
4.2. Precipitate Evolution during High-Temperature Creep
5. Conclusions
- -
- High-temperature apparent tensile yield strength and creep resistance of Incoloy 800H welds at 80 MPa and 760 °C were significantly enhanced by the addition of Inconel 625 and Haynes 230 into the Alloy 800H weldments. Both of the weldments showed longer creep rupture time but lower rupture strain compared with the BM specimen.
- -
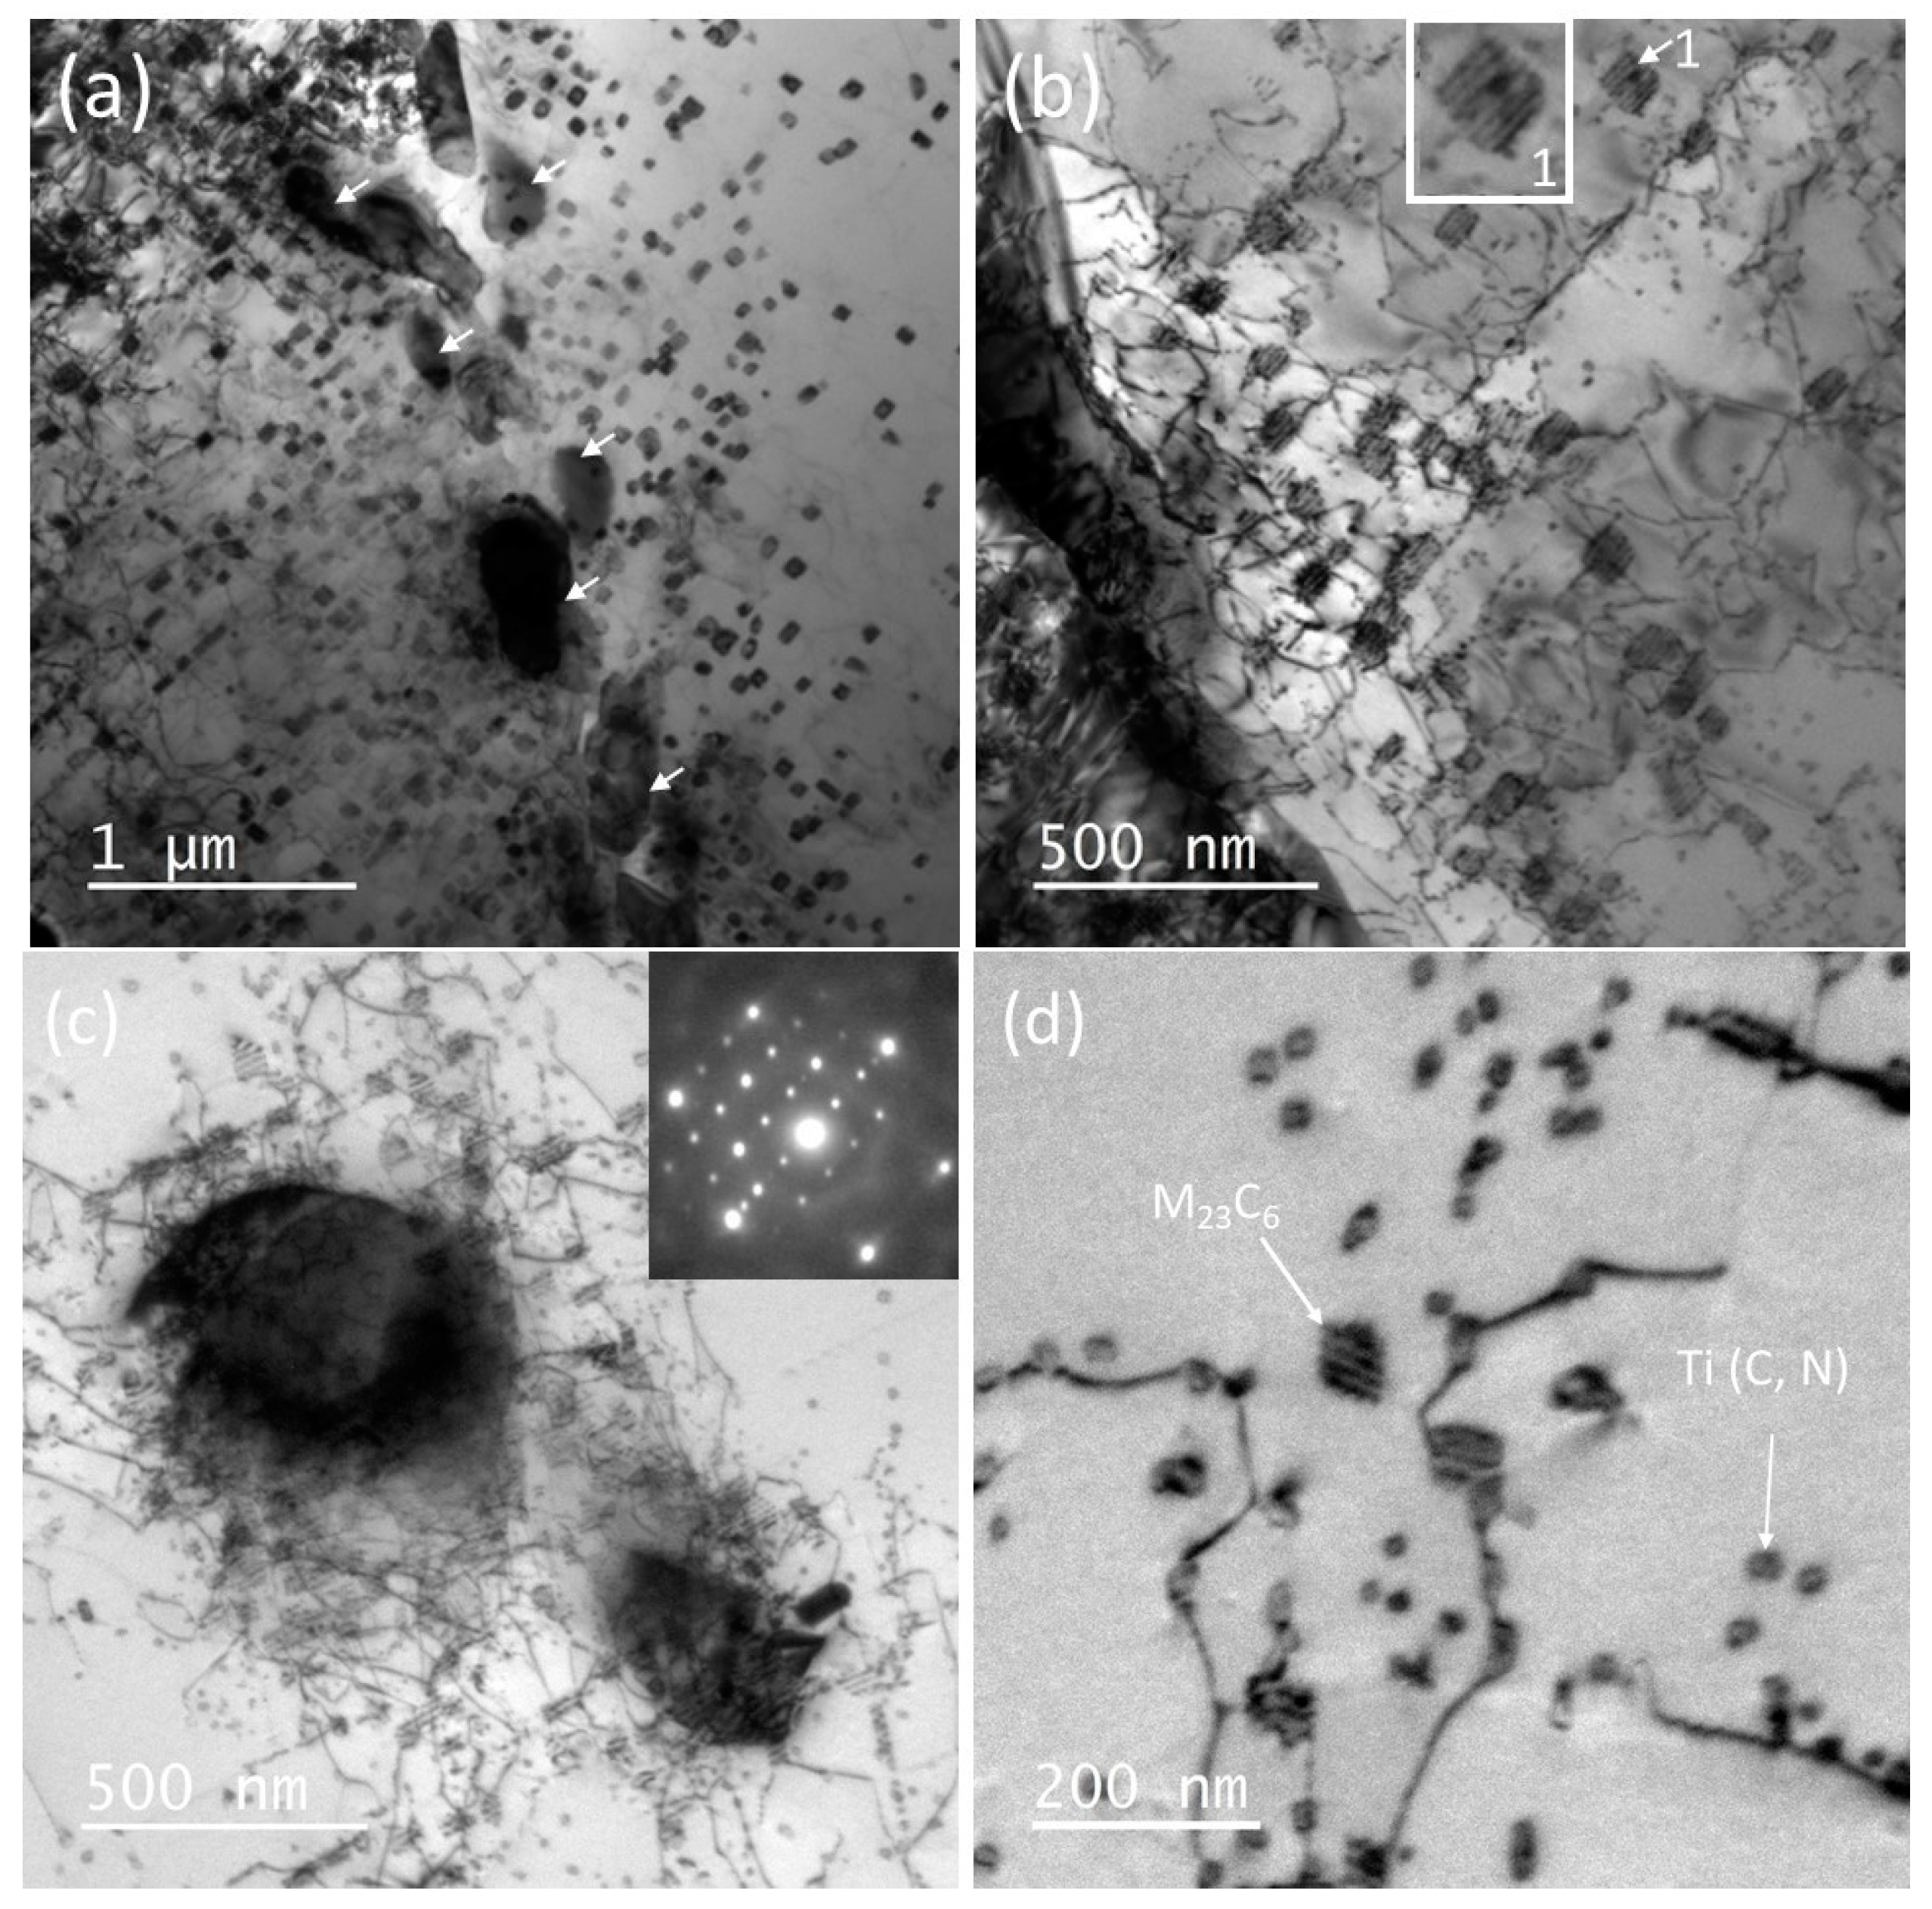
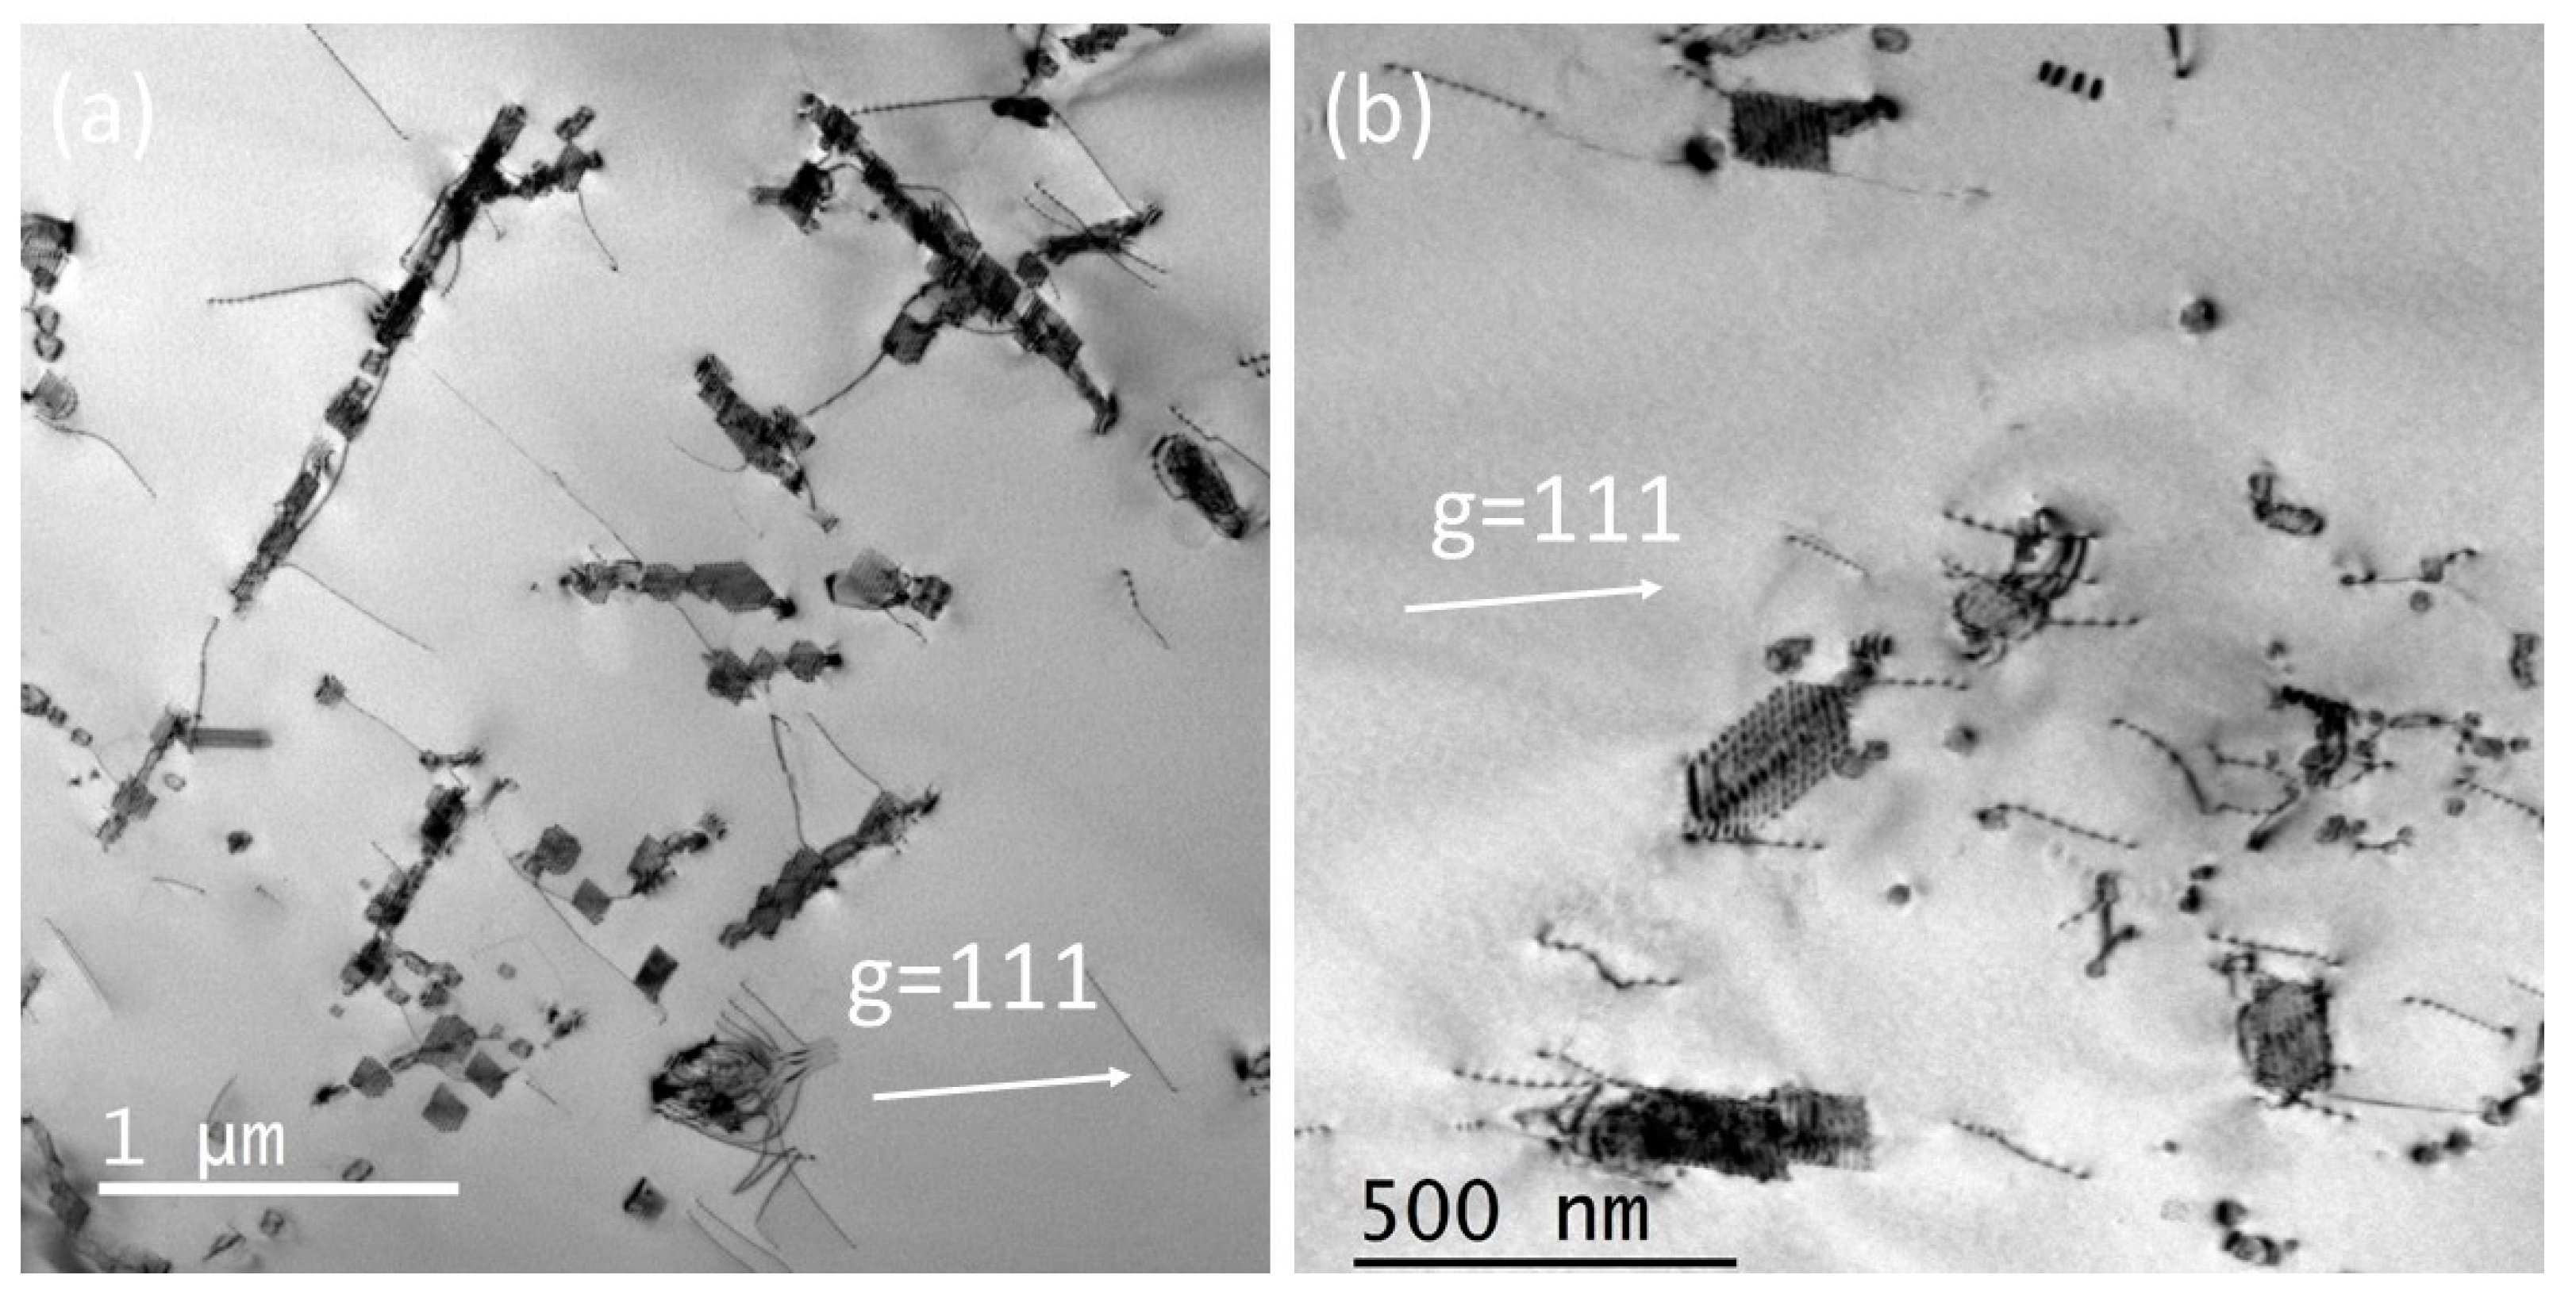
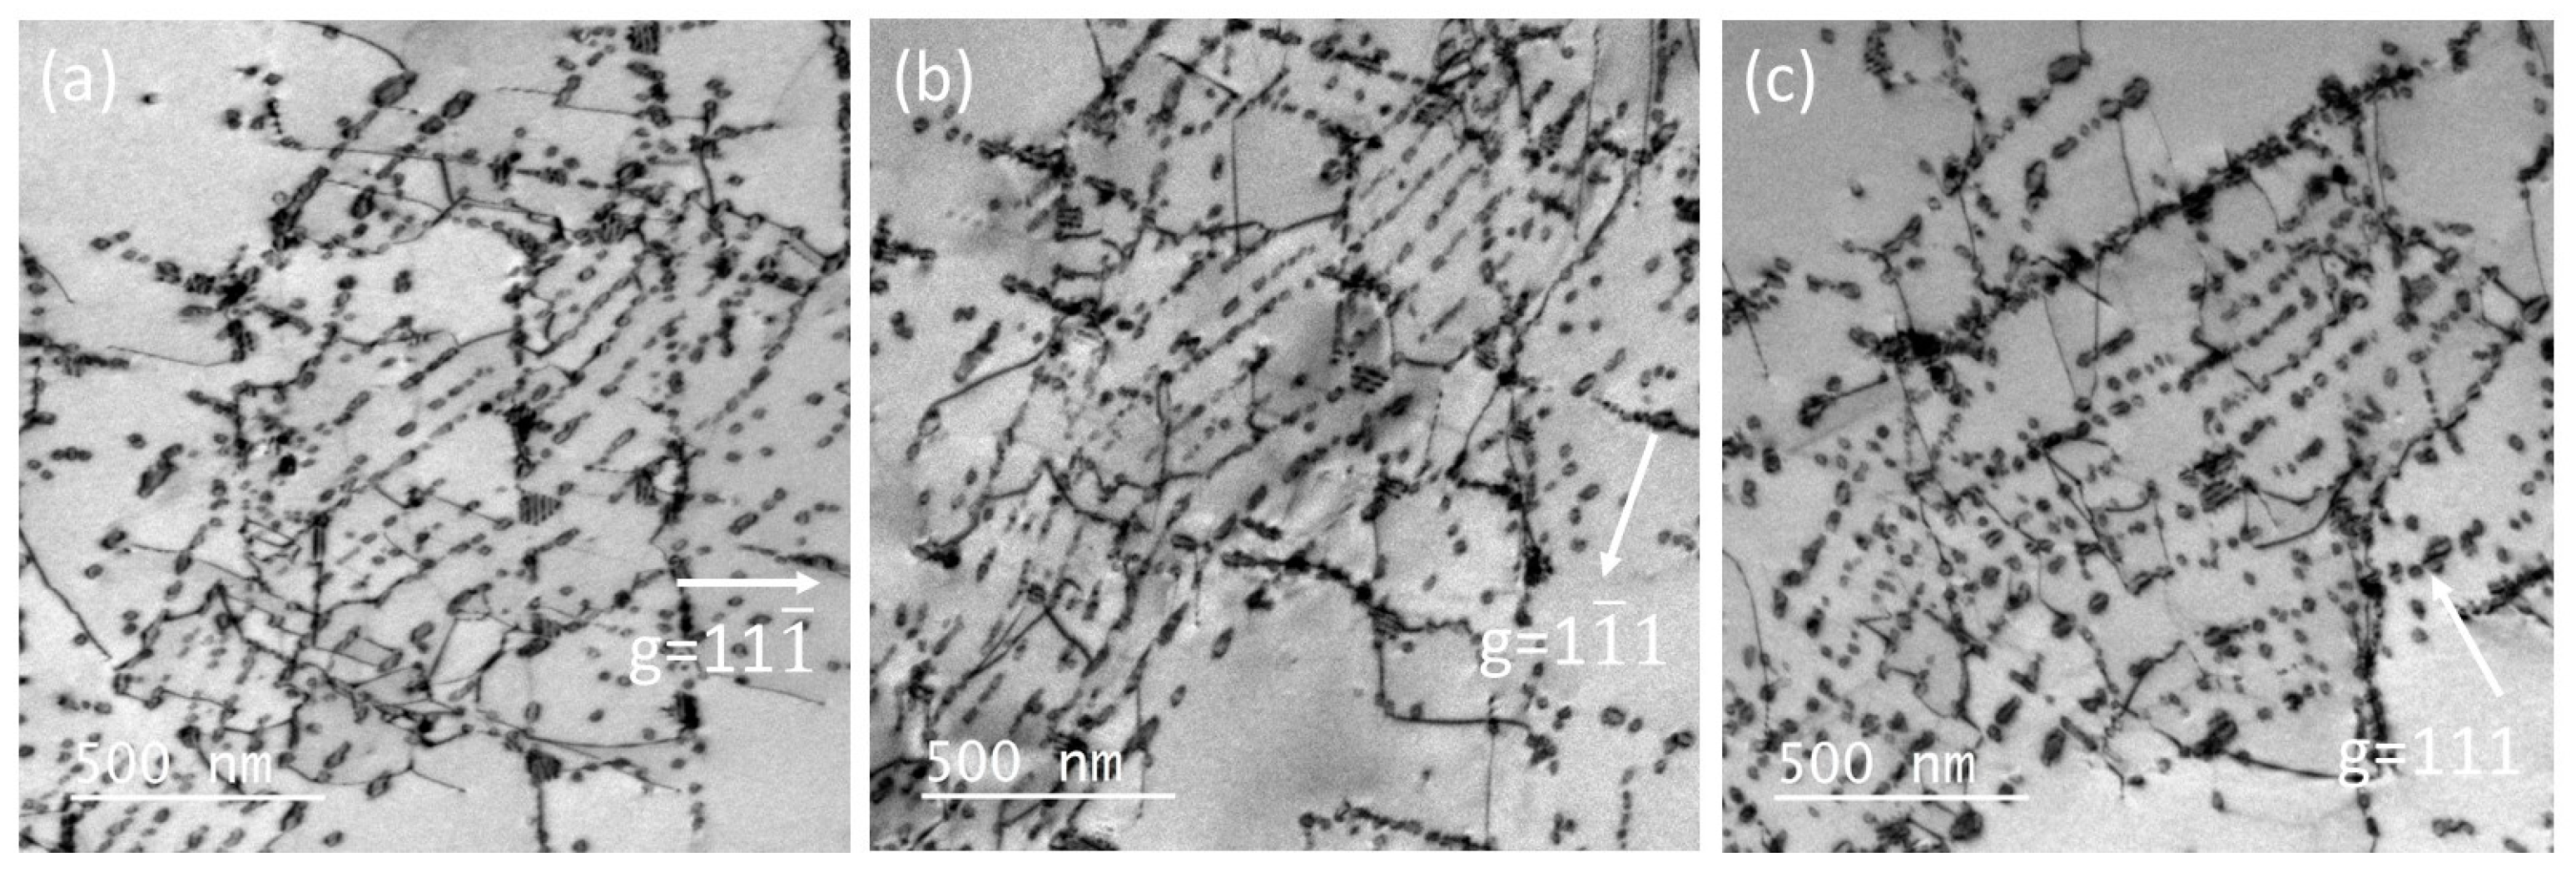
- Significant dislocation slip and interaction with precipitates were observed in the microstructure, indicating a high-temperature power-law creep mechanism. Dislocation bypassing through the Orowan mechanism accompanied by climb and cutting facilitated dislocation slips during high-temperature creep deformation.
- -
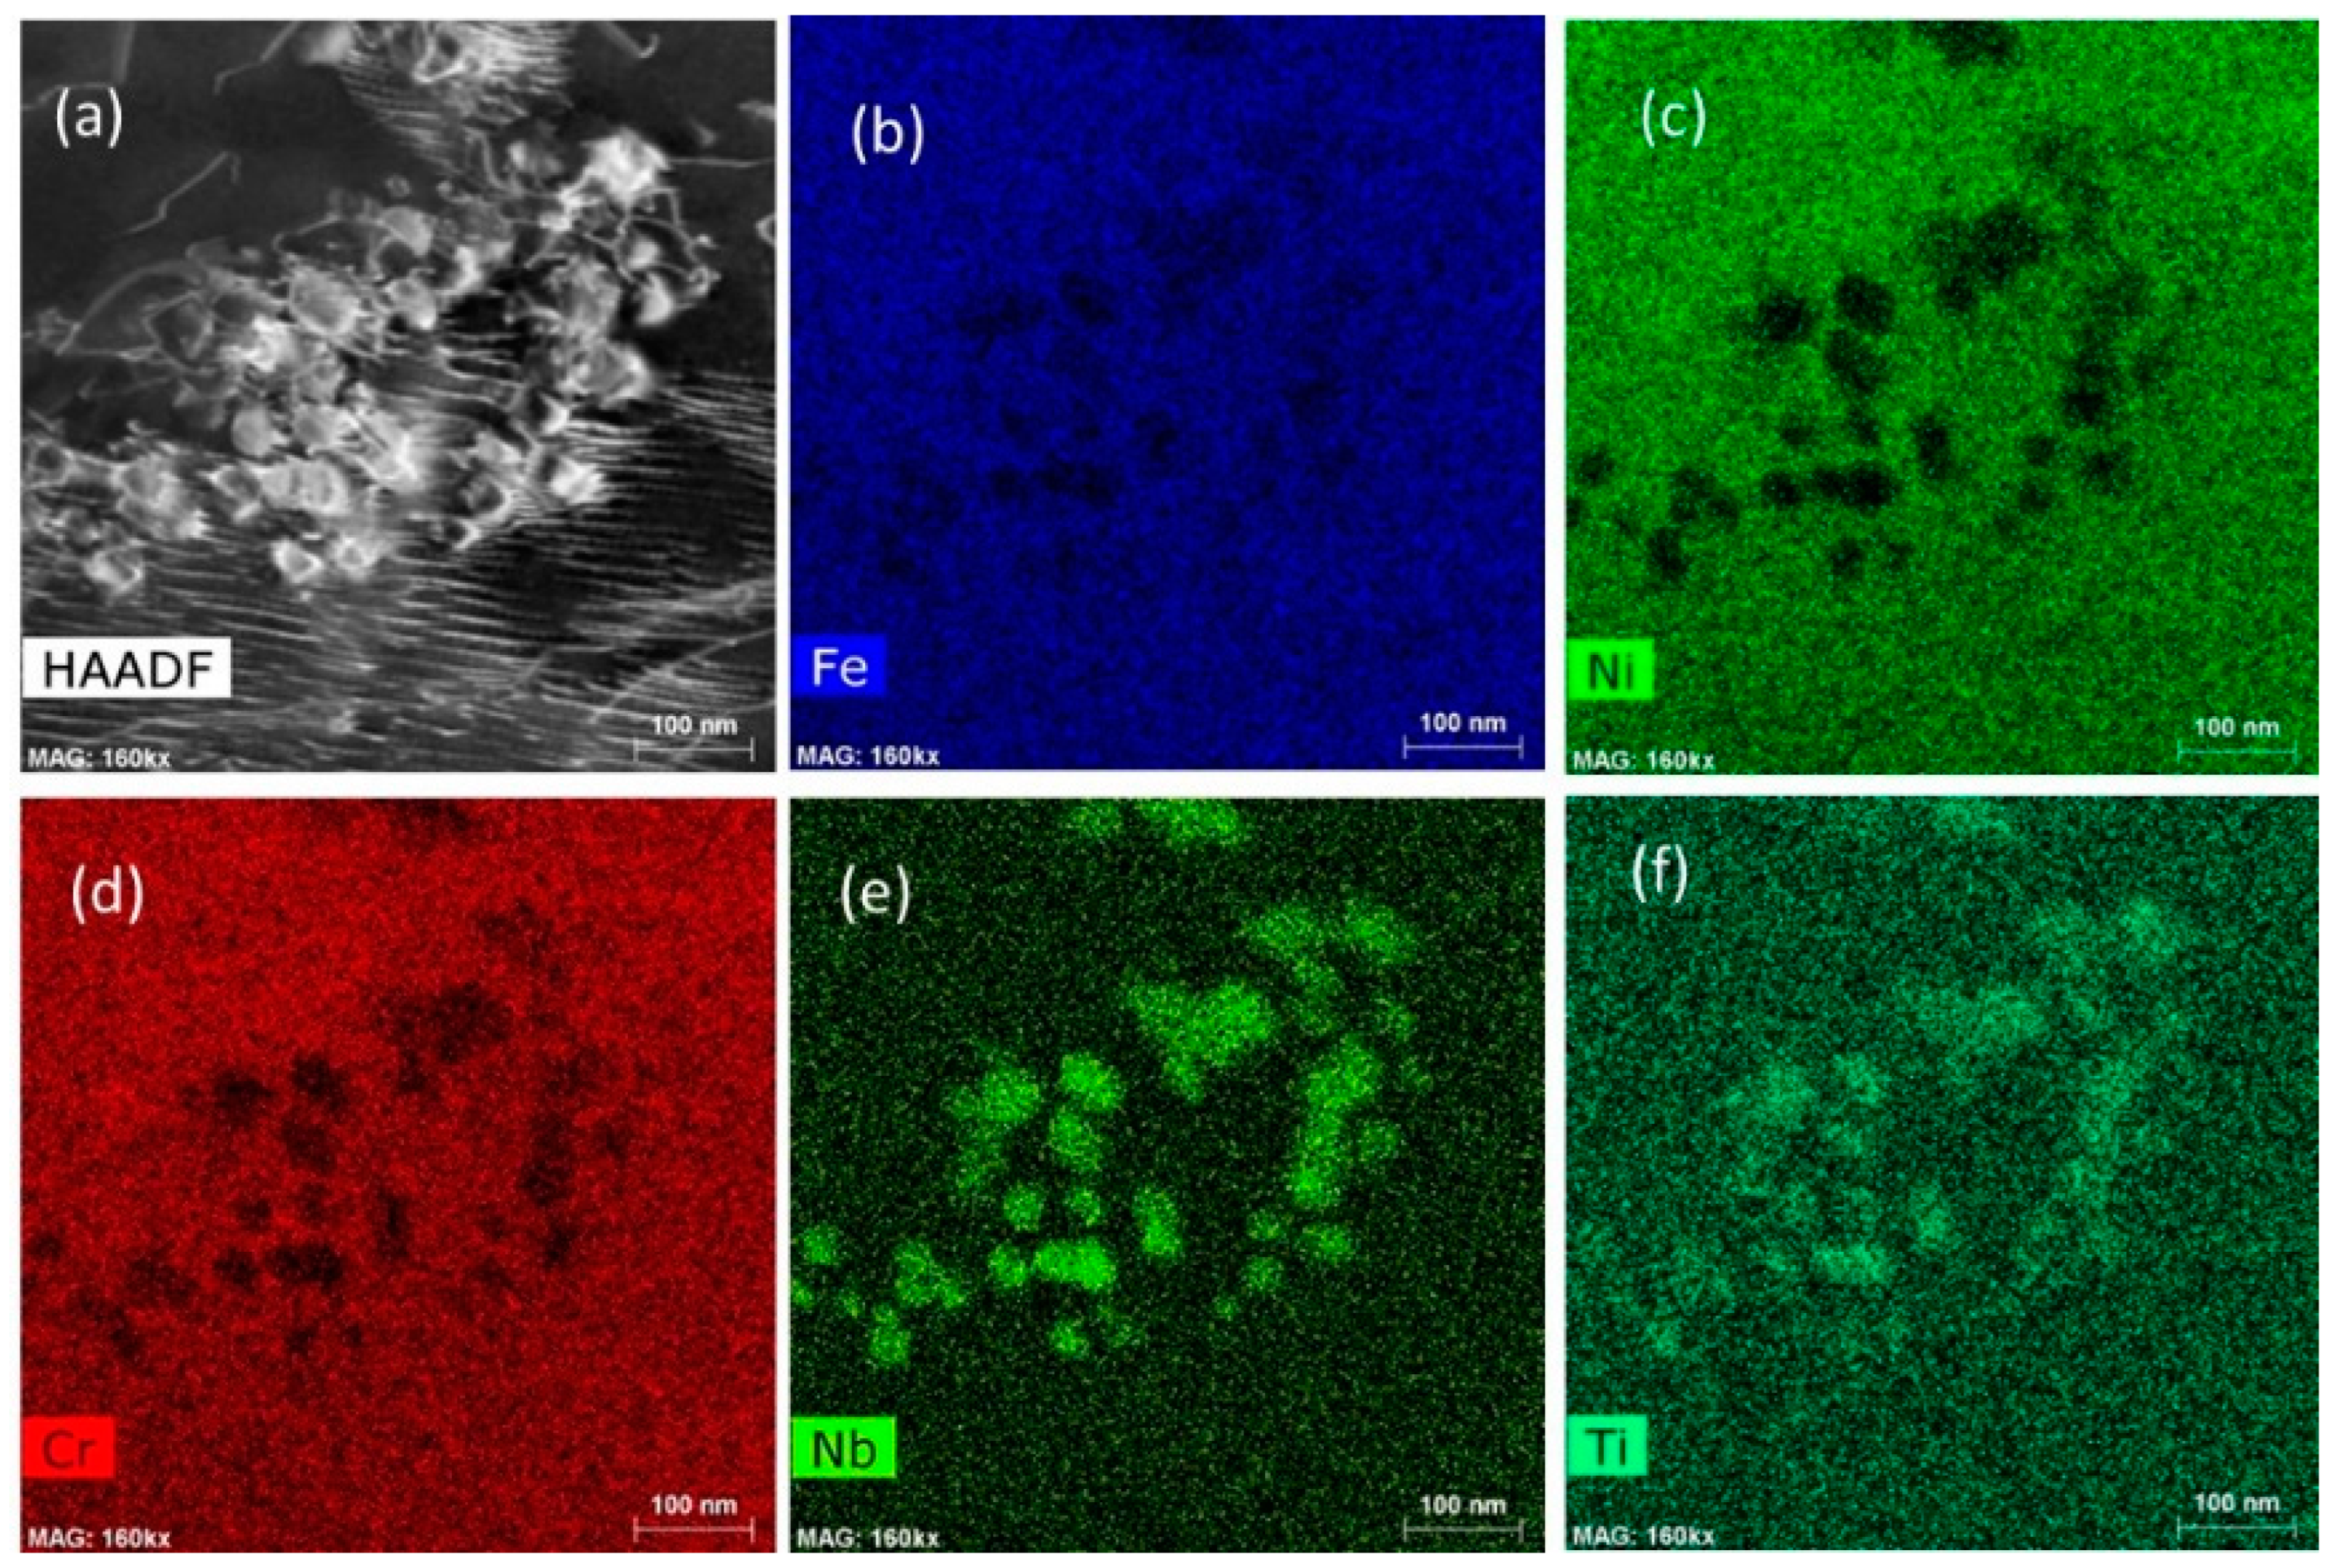
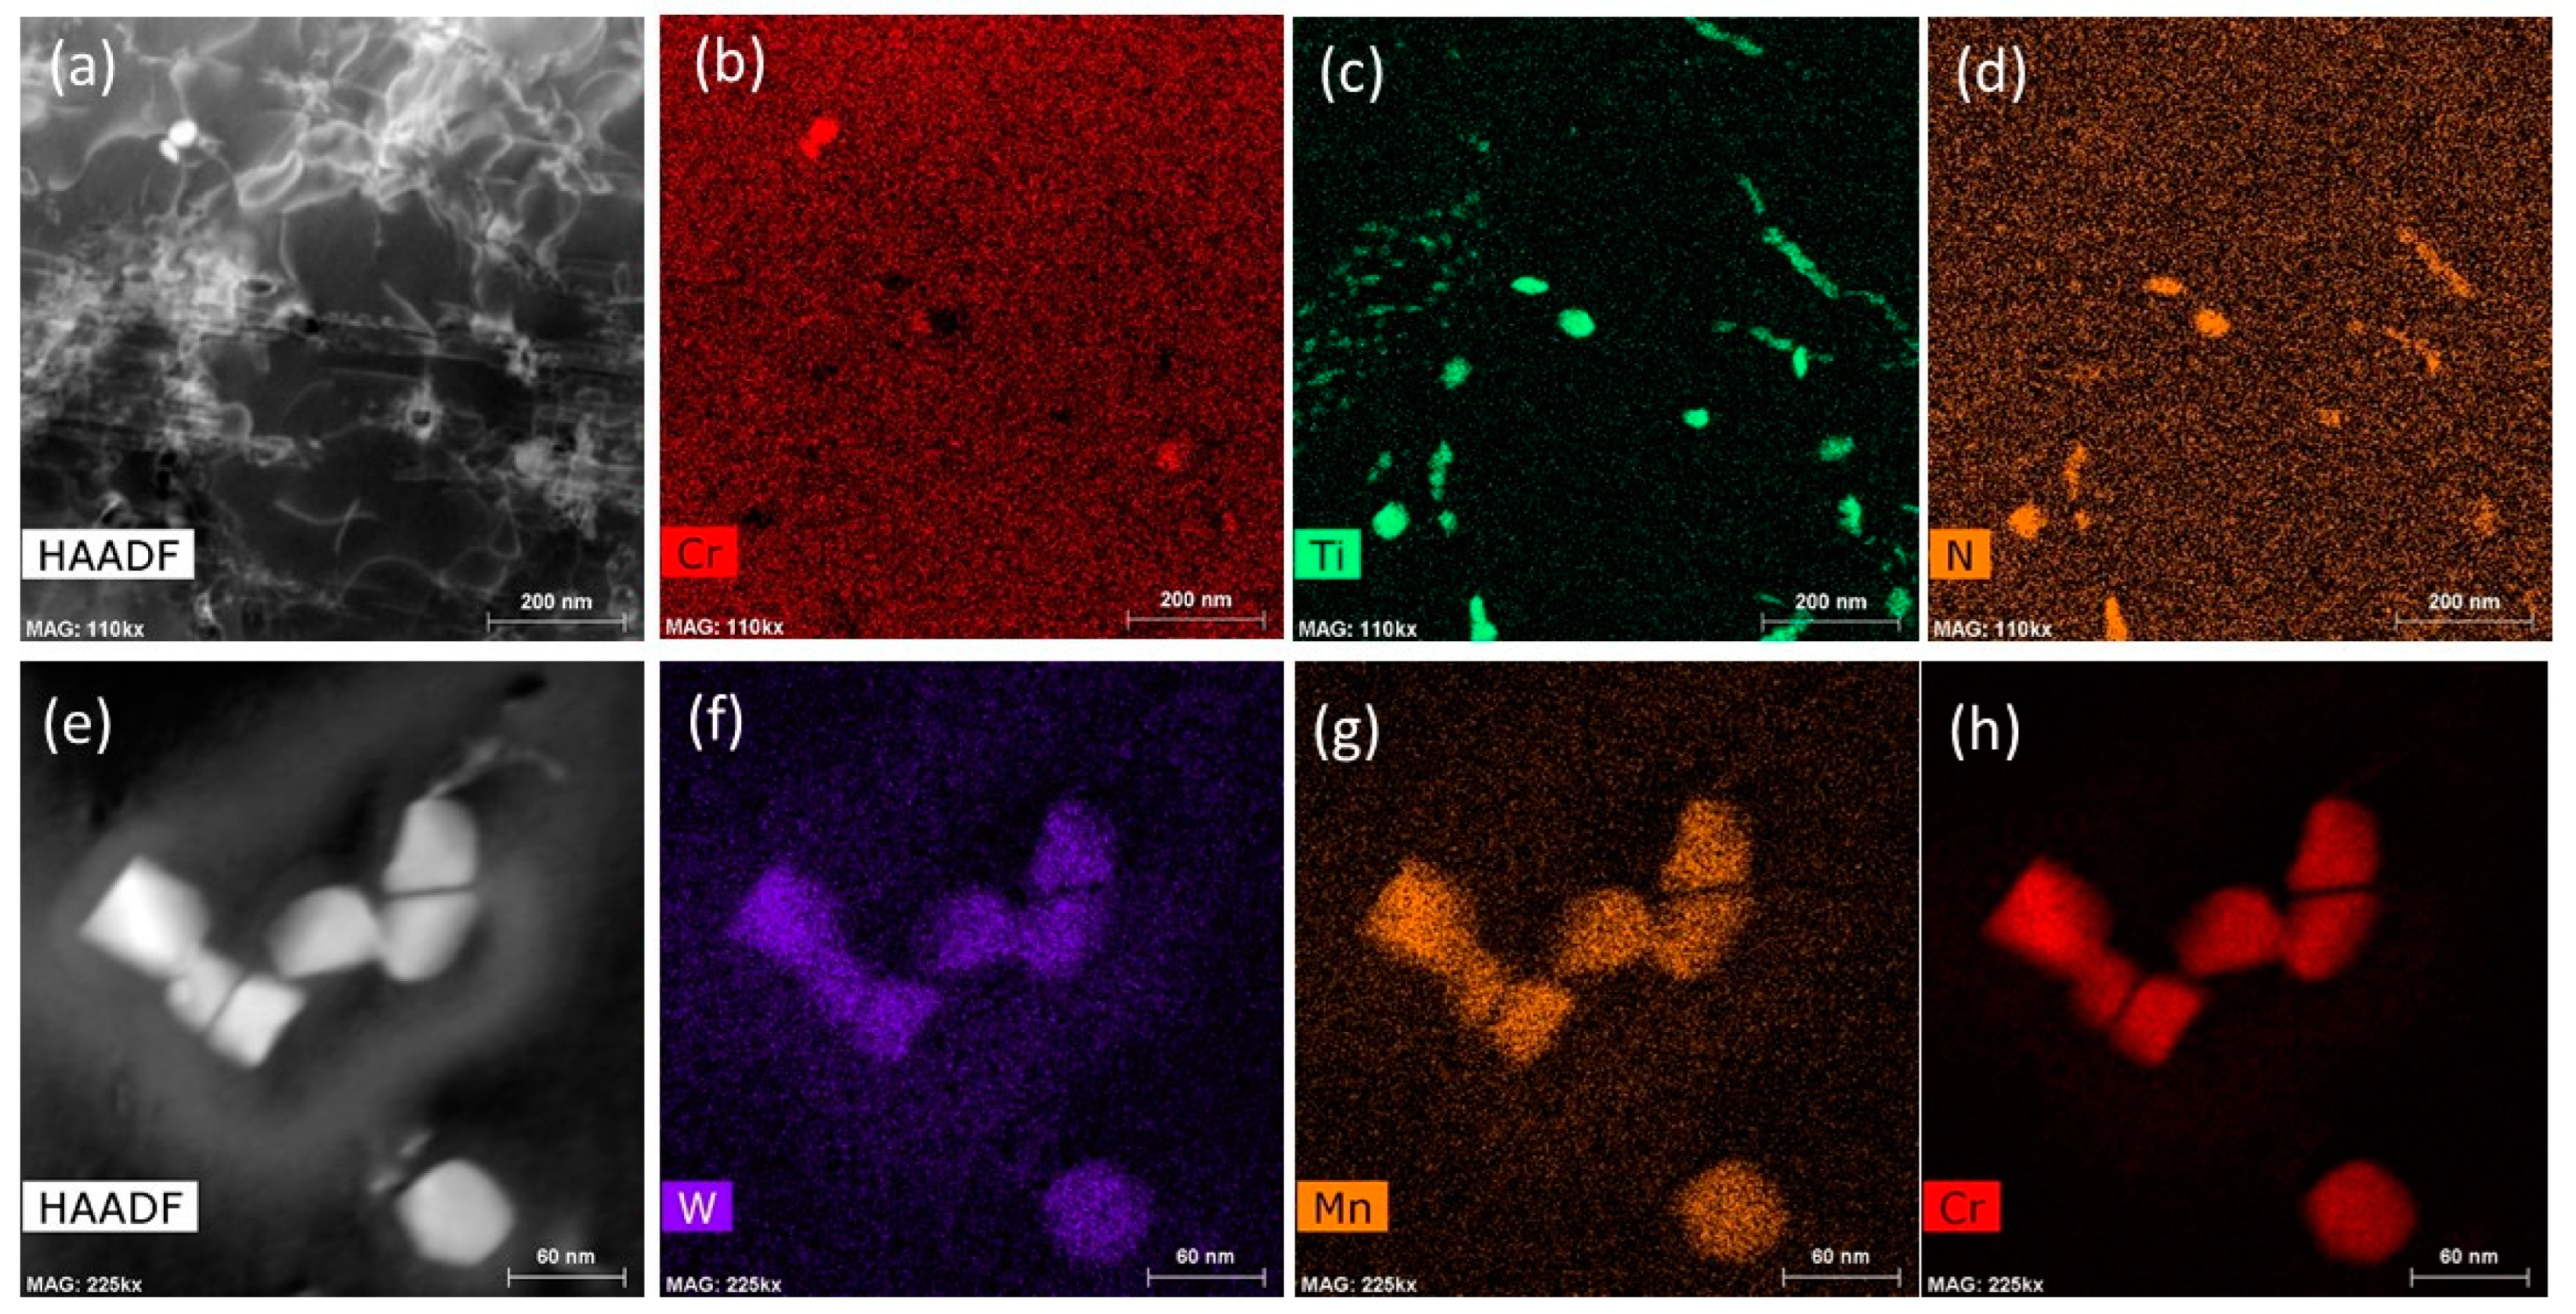
- Microstructural characterization revealed that extensive precipitation took place after the prolonged creep testing at high temperature. A large number of sub-micron-sized carbides (MC and M23C6) were observed in the microstructure of FZ, HAZ adjacent to the fusion boundary, and base metals under various conditions (as-received, as-welded, and creep-tested). The varied sizes and locations of the M23C6 and MC carbides suggest a complex microstructural evolution during the creep test.
- -
- The weldments with Inconel 625 filler material exhibited detrimental δ and Laves phases in the weld metal after the creep test. Although the failure occurred in the base metal rather than in the fusion zone under the current test conditions, the presence of these phases could cause potential crack initiation after prolonged high-temperature ageing.
- -
- The weldment with Haynes 230 filler material demonstrated superior phase stability and improved creep rupture properties compared to the one with Inconel 625 filler material. This suggests that Haynes 230 could be a promising filler material for further investigations into Alloy 800H applications.
Author Contributions
Funding
Informed Consent Statement
Data Availability Statement
Conflicts of Interest
References
- Ren, W.; Swindeman, R. Status of Alloy 800H in Considerations for the Gen IV Nuclear Energy Systems. J. Press. Vessel Technol. 2014, 136, 054001. [Google Scholar] [CrossRef]
- Natersan, K.; Purohit, A.; Tam, S.W. Materials Behavior in HTGR Environments, NUREG/CR-6824 ANL-02/37; Argonne National Laboratory: Lemont, IL, USA, 2003.
- Simon, P. NGNP High Temperature Materials White Paper. INL/EXT-09-17187; Idaho National Laboratory: Idaho Falls, ID, USA, 2010.
- BPVC.III.5; Rules for Construction of Nuclear Facility Components, Division 5 High Temperature Reactors. ASME: New York, NY, USA, 2019.
- Lindgren, J.R.; Thurgood, B.E.; Ryder, R.H.; Li, C.C. Mechanical Properties of Welds in Commercial Alloys for High-Temperature Gas-Cooled Reactor Components. Nucl. Technol. 1984, 66, 207–213. [Google Scholar] [CrossRef]
- Ren, W.; Totemeier, T.; Santella, M.; Battiste, R.; Clark, D.E. Status of Testing and Characterization of CMS Alloy 617 and Alloy 230, ORNL/TM-2006-547; Oak Ridge National Laboratory: Oak Ridge, TN, USA, 2006.
- York, J.W.; Flury, R.L. Assessment of Candidate Weld Metals for Joining Alloy 800, Sub 4308-2; Oak Ridge National Laboratory: Oak Ridge, TN, USA, 1976.
- Roach, D.B.; Vanecho, J.A. Creep Rupture Properties of HK-40 and Alloy 800 Weldments, Conference Paper. In Proceedings of the Corrosion/81, Toronto, ON, Canada, 6–10 April 1981; p. 238. [Google Scholar]
- Rupp, R.E.; Leung Sham, T. An Initial Assessment of the Creep-Rupture Strengths for Weldments with Alloy 800H Base Metal and Alloy 617 Filler Metal. In Proceedings of the ASME 2022, Pressure Vessels & Piping Conference (PVP 2022), Las Vegas, NV, USA, 17–22 July 2022. [Google Scholar]
- Tawancy, H.M.; Klarstrom, D.L.; Rothman, M.F. Development of a New Nickel-Base Superalloy. J. Met. 1984, 36, 58–62. [Google Scholar] [CrossRef]
- Hastuty, S.; Zacharias, P.; Awwaluddin, M.; Setiawan, P.H.; Siswanto, E.; Santoso, B.; Nugroho, A.; AbdulRani, A.M. Considerations of Material Selection for Control Rod Drive Mechanism of Reaktor Daya Eksperimental. J. Phys. Conf. Ser. 2019, 1198, 032010. [Google Scholar] [CrossRef]
- Kreitcberg, A.; Inaekyan, K.; Turenne, S.; Brailovski, V. Temperature- and Time-Dependent Mechanical Behavior of Post-Treated IN625 Alloy Processed by Laser Powder Bed Fusion. J. Manuf. Mater. Process. 2019, 3, 75. [Google Scholar] [CrossRef]
- Available online: https://www.haynesintl.com/alloys/alloy-portfolio_/High-temperature-Alloys/HAYNES-230-ALLOY/nominal-composition (accessed on 7 January 2024).
- Available online: https://www.specialmetals.com/documents/technical-bulletins/inconel/inconel-alloy-625.pdf (accessed on 12 January 2021).
- ASTM E139-11 (Reapproved 2018); Standard Test Methods for Conducting Creep, Creep-Rupture, and Stress-Rupture Tests of Metallic Materials. ASTM International: West Conshohocken, PA, USA, 2018.
- Booker, M.K. Analysis of the Creep Strain-Time Behaviour of Alloy 800, ORNL/TM-8449; Oak Ridge National Laboratory: Oak Ridge, TN, USA, 1983.
- Orowan, E. Zur Kristallplastizität. III. Z. Phys. 1934, 89, 634–659. [Google Scholar] [CrossRef]
- Beardsley, A.L.; Bishop, C.M.; Kral, M.V. A Deformation Mechanism Map for Incoloy 800H Optimized Using the Genetic Algorithm. Met. Mater. Trans. A 2019, 50, 4098–4110. [Google Scholar] [CrossRef]
- Bai, Z.; Fan, Y. Abnormal strain rate sensitivity driven by a unit dislocation-obstacle interaction in BCC Fe. Phys. Rev. Lett. 2018, 120, 125504. [Google Scholar] [CrossRef] [PubMed]
- Zhao, J.; Gong, J.; Saboo, A.; Dunand, D.C.; Olson, G.B. Dislocation-Based Modeling of Long-Term Creep Behaviors of Grade 91 Steels. Acta Mater. 2018, 149, 19–28. [Google Scholar] [CrossRef]
- Kabir, M.; Lau, T.T.; Rodney, D.; Yip, S.; Van Vliet, K.J. Predicting Dislocation Climb and Creep from Explicit Atomistic Details. Phys. Rev. Lett. 2010, 105, 095501. [Google Scholar] [CrossRef] [PubMed]
- Li, L.; Liu, F.; Tan, L.; Fang, Q.; Liaw, P.K.; Li, J. Uncertainty and statistics of dislocation precipitate interactions on creep resistance. Cell Rep. Phys. Sci. 2022, 3, 100704. [Google Scholar] [CrossRef]
- Callister, W.D., Jr. Materials Science and Engineering—An Introduction, 5th ed.; John Wiley&Sons, Inc.: Hoboken, NJ, USA, 1999. [Google Scholar]
- Spiradek, K.; Degischer, H.P.; Lahodny, H. Correlation between Microstructure and the Creep Behaviour at High Temperature of Alloy 800H. In Proceedings of the CONF-8806156: IAEA Specialists Meeting on High-Temperature Metallic Materials for Gas-cooled Reactors, Krakow, Poland, 20–23 June 1988; Available online: https://inis.iaea.org/collection/NCLCollectionStore/_Public/21/068/21068264.pdf?r=1&r=1 (accessed on 1 February 2020).
- Kassner, M.E.; Hayes, T.S. Creep Cavitation in Metals. Int. J. Plast. 2003, 19, 1715–1748. [Google Scholar] [CrossRef]
- Jang, C.; Lee, D.; Kim, D. Oxidation Behavior of Alloy 617 in Very High Temperature Air and Helium Environments. Int. J. Press. Vessel. Pip. 2008, 85, 368–377. [Google Scholar] [CrossRef]
- Floreen, S.; Fuchs, G.E.; Yang, W.J. The Metallurgy of Alloy 625. Available online: https://www.tms.org/superalloys/10.7449/1994/Superalloys_1994_13_37.pdf (accessed on 4 April 2022).
- DuPont, J.N.; Robino, C.V.; Marder, A.R. Solidification of Nb-Bearing Superalloys: Part II. Pseudo Ternary Solidification Surfaces. Metall. Mater. Trans. A 1998, 29, 2797–2806. [Google Scholar] [CrossRef]
- Cieslak, M.J.; Headley, T.J.; Kollie, T.; Romig, A.D. A Melting and Solidification Study of Alloy 625. Metall. Trans. A 1988, 19, 2319–2331. [Google Scholar] [CrossRef]


| Element | Fe | Ni | Cr | Mo | Nb | Co | Mn | C | Al | Ti | Si | B | W |
|---|---|---|---|---|---|---|---|---|---|---|---|---|---|
| AR Alloy 800H | 45.6 | 30.3 | 20.6 | 0.7 | - | 0.05 | 0.7 | 0.08 | 0.49 | 0.52 | 0.4 | - | - |
| Inconel 625 | <5.0 | >58.0 | 20.0 -23.0 | 8.0 -10.0 | 3.15 -4.15 | <1.00 | <0.50 | <0.10 | <0.40 | <0.40 | <0.50 | - | - |
| Haynes 230 | <3.0 | 57.0 Bal | 22.0 | 2.0 | <0.50 | <5.00 | 0.50 | 0.10 | 0.30 | <0.10 | 0.40 | <0.015 | 14.0 |
| Material | Minimum Strain Rate (h−1) | Strain at Rupture (%) | Time to Tertiary Stage (h), Tt | Time to Rupture (h), TR |
|---|---|---|---|---|
| Incoloy 800H BM | 10−4 | 44.96 | 60 | 467 |
| Weldment with Inconel 625 filler | 10−5 | 9.66 | 320 | 1091 |
| Weldment with Haynes 230 filler | 10−5 | 10.51 | 456 | 1643 |
Disclaimer/Publisher’s Note: The statements, opinions and data contained in all publications are solely those of the individual author(s) and contributor(s) and not of MDPI and/or the editor(s). MDPI and/or the editor(s) disclaim responsibility for any injury to people or property resulting from any ideas, methods, instructions or products referred to in the content. |
© 2024 by the authors. Licensee MDPI, Basel, Switzerland. This article is an open access article distributed under the terms and conditions of the Creative Commons Attribution (CC BY) license (https://creativecommons.org/licenses/by/4.0/).
Share and Cite
Li, W.; Xiao, L.; Walters, L.; Dong, Q.; Ienzi, M.; Sloan, R. High-Temperature Creep and Microstructure Evolution of Alloy 800H Weldments with Inconel 625 and Haynes 230 Filler Materials. Appl. Sci. 2024, 14, 1347. https://doi.org/10.3390/app14041347
Li W, Xiao L, Walters L, Dong Q, Ienzi M, Sloan R. High-Temperature Creep and Microstructure Evolution of Alloy 800H Weldments with Inconel 625 and Haynes 230 Filler Materials. Applied Sciences. 2024; 14(4):1347. https://doi.org/10.3390/app14041347
Chicago/Turabian StyleLi, Wenjing, Lin Xiao, Lori Walters, Qingshan Dong, Maurizio Ienzi, and Robyn Sloan. 2024. "High-Temperature Creep and Microstructure Evolution of Alloy 800H Weldments with Inconel 625 and Haynes 230 Filler Materials" Applied Sciences 14, no. 4: 1347. https://doi.org/10.3390/app14041347
APA StyleLi, W., Xiao, L., Walters, L., Dong, Q., Ienzi, M., & Sloan, R. (2024). High-Temperature Creep and Microstructure Evolution of Alloy 800H Weldments with Inconel 625 and Haynes 230 Filler Materials. Applied Sciences, 14(4), 1347. https://doi.org/10.3390/app14041347