1. Introduction
In the modern industrial field, operating efficiency and precision of different types of mechanical equipment are becoming more and more important, particularly those involving transmission systems. In this regard, the cycloidal reducer is widely used in different mechanical transmission systems because of its unique benefits of high load, high efficiency, compactness, low noise, and other qualities [
1]. Advanced mathematical models and computer simulation techniques are combined with mechanical analyses and tooth modifications to optimize the efficiency of cycloidal reducers. The newly designed two-stage cycloidal reducer has established an independent dynamic model, thereby verifying the dynamic balance and stability of the two-stage cycloidal reducer [
2]. A tooth contact analysis model was established using Hertz contact theory, and the transmission error and reduction ratio fluctuation were analyzed, providing a certain theoretical basis for optimizing motion loss and transmission efficiency in the future [
3,
4]. A meshing efficiency model of the cycloidal gear was established, and a theoretical efficiency formula was derived [
5,
6,
7,
8,
9]. By increasing the short amplitude coefficient, the transmission efficiency of the reducer was improved, and the design of the cycloidal gear was optimized. A new method was proposed for the blade design of the cycloidal plate gear [
10], and a new design was carried out for the structure of the cycloidal pinwheel reducer [
11], reducing its size and volume and exhibiting good dynamic balance characteristics. Meanwhile, some measurement methods [
12,
13,
14,
15] were proposed to meet the accuracy requirements for the cycloidal gear, which can reduce the errors in the manufacturing process and test more parameters of the cycloid reducer with high accuracy. The preceding studies provide a significant theoretical basis for optimum design and performance enhancement of cycloidal reducers. Compared with the traditional cycloidal reducer with four cycloid discs, the new cycloidal reducer with two cycloid discs is quite compact, with superior load distribution and dynamic balancing characteristics [
16]. The vibration effect of the cycloid speed reducer is reduced by using flexible pads [
17].
Optimization approaches aimed at minimizing size and maximizing efficiency [
18] to improve the entire mechanism or upgrading the cycloidal gear through a new profile design can also improve the performance of the cycloidal reducer. The analysis of the size and efficiency of cycloidal reducers [
19] contributes to investigating further research directions for cycloidal reducers. The analysis of the meshing efficiency of cycloidal gears [
20], as well as the analysis of the tooth contact and load distribution, and the consideration of the effect of tooth modification can help optimize the design of the cycloidal gears. In addition, the dynamic analysis should not be neglected when investigating cycloidal reducers. The dynamic analysis of reducers can verify whether the performance of the designed new reducer fulfills the expectation. At the same time, the dynamic analysis of various transmission designs can further verify whether the designed reducer is reasonable and can help investigate the next research direction. The cycloid disc is one of the main components of the cycloidal reducer, and it is also the most critical component. Under different meshing conditions, the dynamic analysis of the stress and strain of the cycloid disk [
21,
22] can determine what happens to the components in the cycloid disc during the motion process, which can help optimize the design of the cycloid disc. Additionally, a dynamic analysis with small tooth differences in the cycloidal reducer can also improve the shortcomings of the conventional design. On the other hand, measurements of the cycloid reducer can also provide useful data support for the direction of improvement. The cycloid reducer’s tooth profile error and correction are critical parameters that affect the cycloidal reducer, and the measurement of the whole tooth profile error through radial tracking mode in polar coordinates can reduce the influence of other errors on the correction of cycloidal gear. The centering angle error of the gear shaft plays a significant role in the measuring results of flank profile and tooth rail deviation in the precision measurement of the cycloidal gear tooth surface, and it can help increase the measuring precision of cycloidal gears by compensating the centering angle inaccuracy of the gear shaft contained in the measurement results. For manufacturing errors, digital measurement of cycloidal gear errors in production based on the gear measuring center can offer the foundation for precise assessment and efficient management of cycloidal gear-producing accuracy. In the current situation where there is no design standard or test platform verification method for cycloid reducers, the cycloid reducer integrated and separated test platform can test more performance characteristics with high precision and exhibit integrated test performance, which aids in defining the design standard for the cycloid reducer. Quasi-static analysis and tooth profile modification optimization, which are crucial components in the design of cycloidal reducers, seek to improve transmission accuracy, decrease noise, and increase operational life. The quasi-static force of the cycloid reducer is thoroughly examined in this paper. Quasi-static force is defined as the magnitude and change rule of the load applied to each component during cycloid reducer movement. It is possible to gain a deeper understanding of the cycloid reducer’s operating state under various working situations, to precisely estimate its performance and lifespan, and to provide the theoretical framework for the correction of tooth profile by analyzing the quasi-static force. In the quasi-static analysis, advanced mechanical models and calculation methods were utilized to conduct in-depth research on the load distribution and variation patterns of the cycloidal reducer under various operating conditions. This includes but is not limited to different types of loads, such as static load, dynamic load, impact load, and so on. At the same time, the influence of material properties, manufacturing errors, assembly errors, and other factors were also taken into account to realize a comprehensive and accurate analysis of quasi-static force. Moreover, the correction method of the tooth profile was also investigated. The tooth profile has a significant impact on the transmission efficiency, noise, vibration, and life of cycloidal reducers. Therefore, reasonable correction of tooth profile can not only reduce contact stress between gears and avoid tooth wear and fracture, but it can also improve gear meshing qualities, reduce vibration and noise, and increase transmission efficiency. In terms of tooth profile correction, modern manufacturing technology and data analysis were combined to study how to accurately control the generation and correction of tooth profiles. In addition, advanced calculation methods were used to assess the performance of the modified flank profile and optimize its design.
In conclusion, quasi-static analysis and tooth profile correction of cycloid reducers is a systematic and complex scientific problem that involves the knowledge of several disciplines, such as mechanics, manufacturing, and material science. Furthermore, this issue is motivated by demands from real-world application scenarios in addition to theoretical difficulties. The cycloid reducer is an important component in both scientific research and industrial production. As a result, the optimization and improvement regarding its performance directly affect the quality and efficiency of many industrial products. It is hoped that this study provides a more comprehensive and in-depth understanding of this issue and offers some references and insights to enhance the performance and lifespan of cycloidal reducers.
2. Profile Generation and Modification
2.1. Profile Generation
Cycloidal profile generation is introduced by establishing a coordinate system, defining the design parameters used for profile generation, and finally using coordinate conversion and the meshing equations of the gear principle to establish the parametric form of a standard profile.
2.1.1. The Coordinate System Parameter Settings
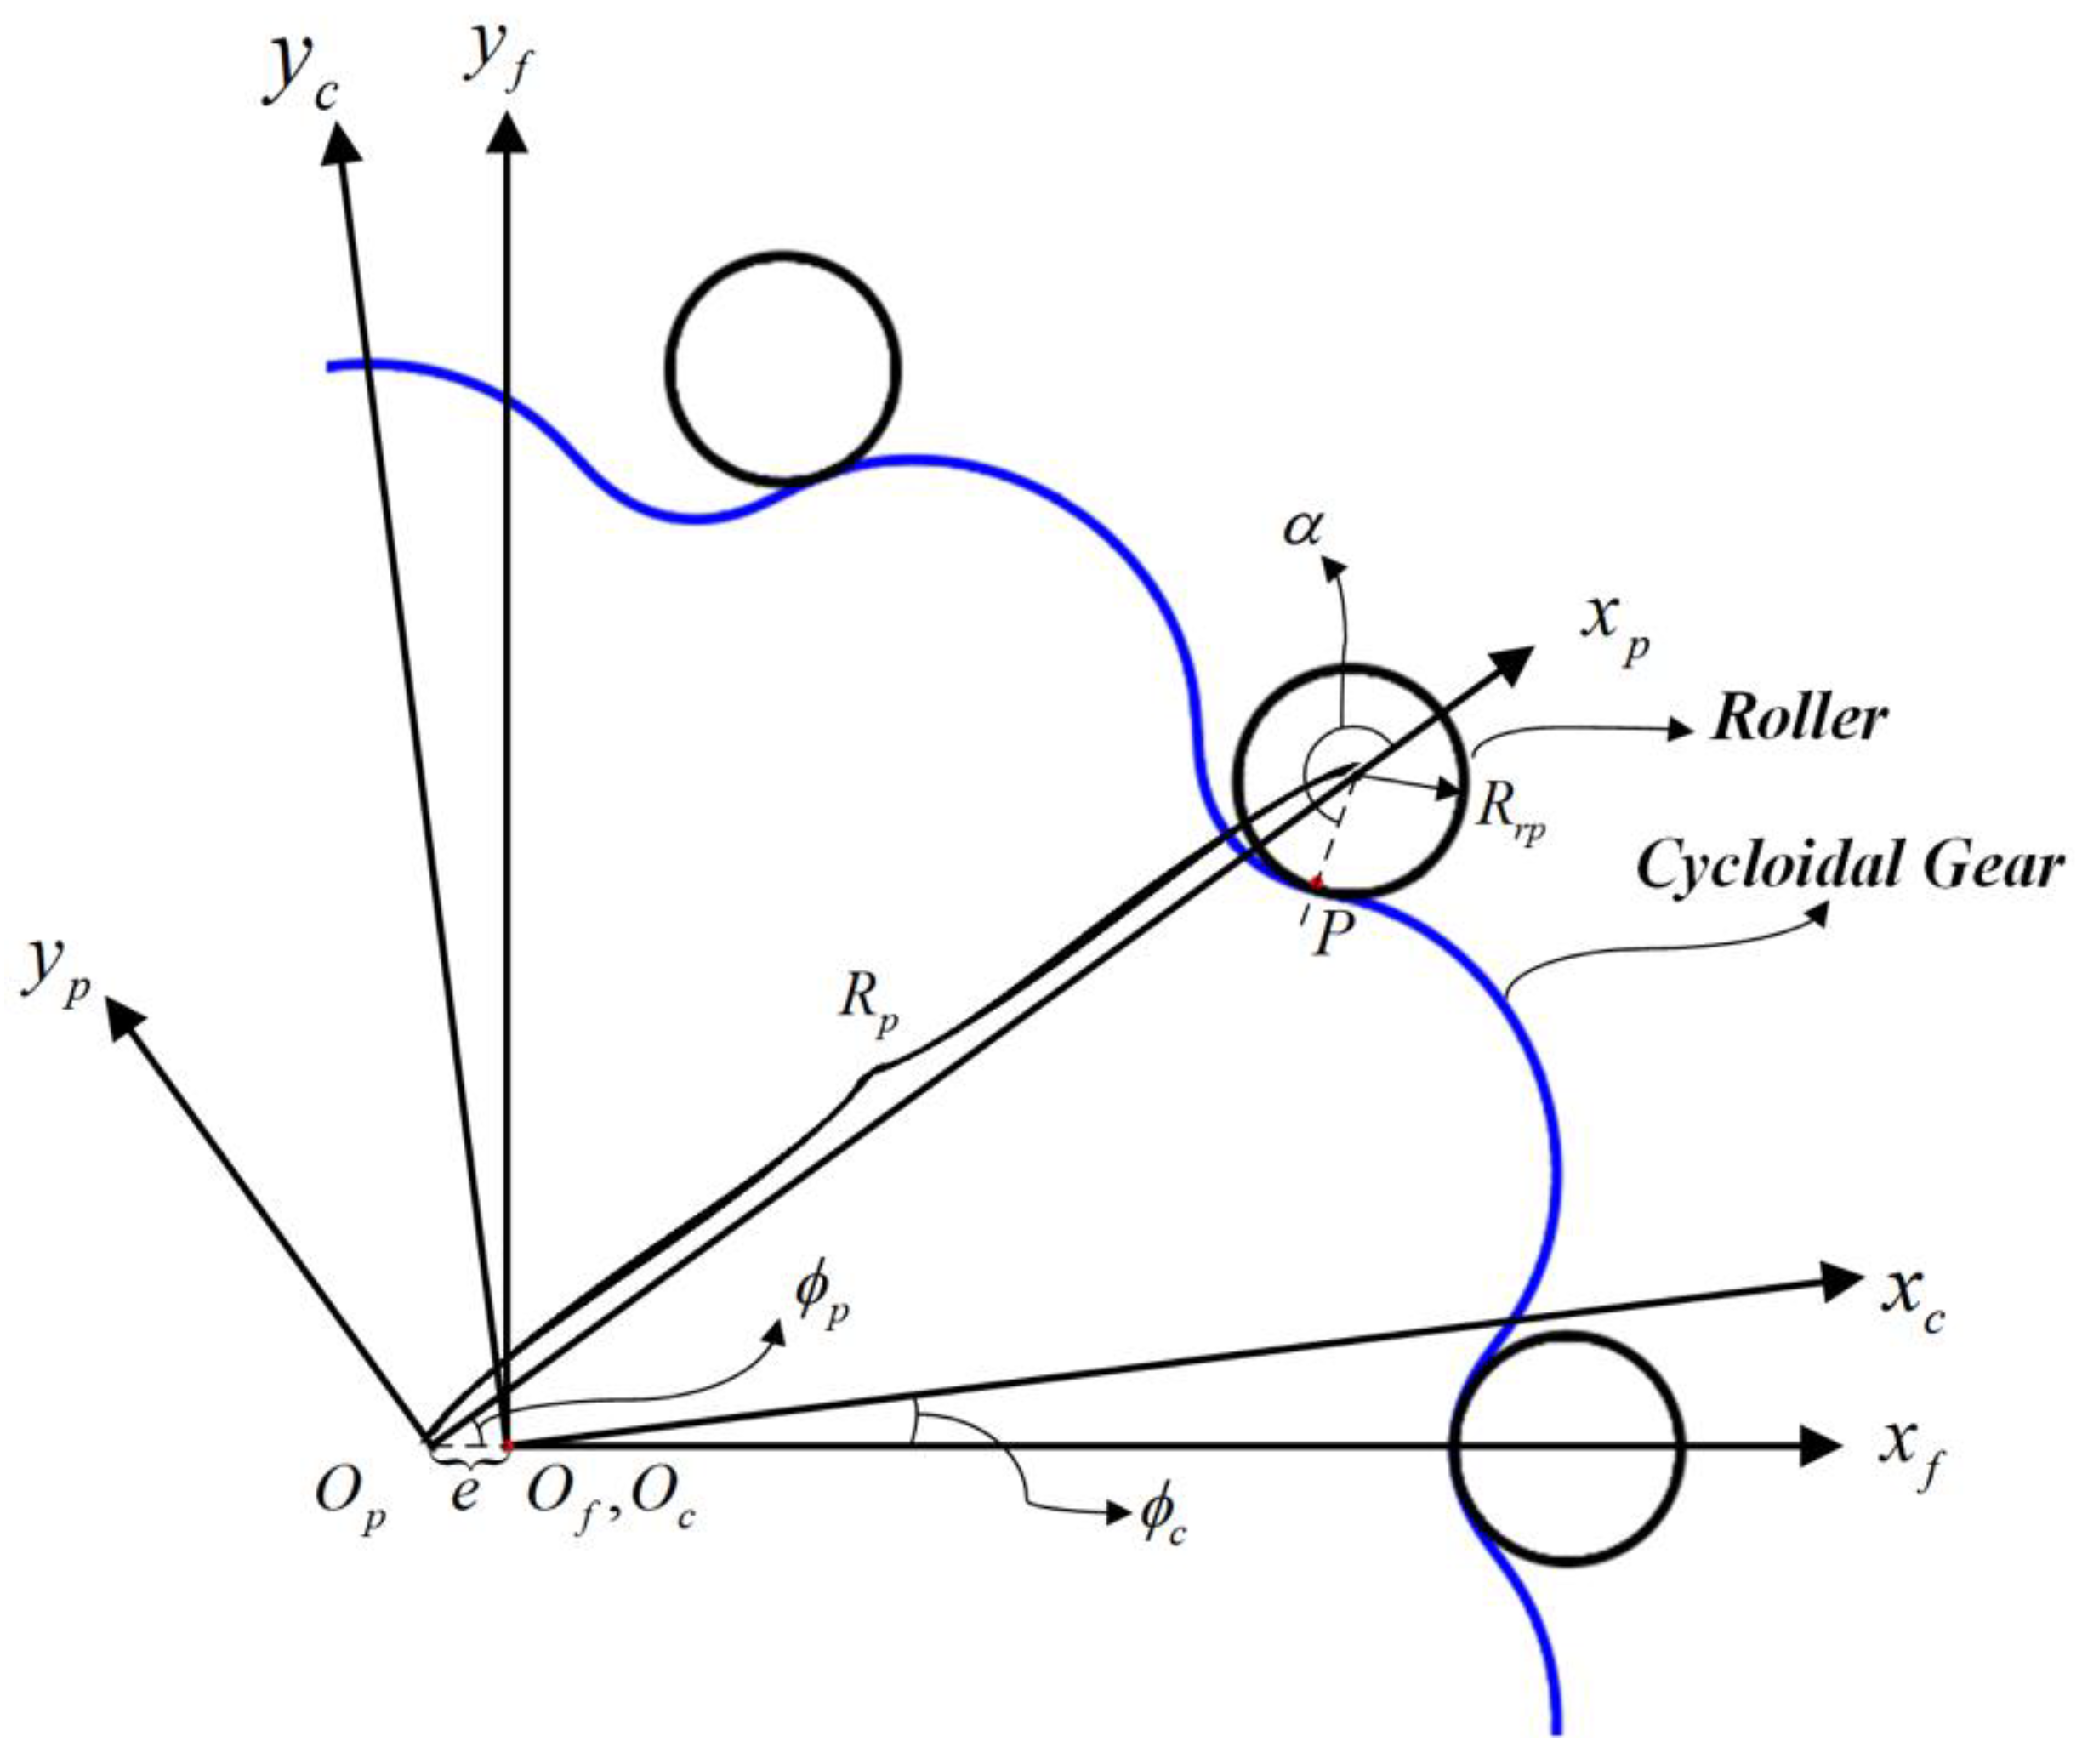
Firstly, the coordinate system for creating the tooth profile is built. As illustrated in
Figure 1,
,
, and
represent the coordinate frame attached to the rack, the roller, and the cycloidal disk, respectively.
coincides with
, while
is separated from
by an input crank eccentricity
. In the following figure,
stands for the rotational angle of
,
stands for the rotational angle of
,
stands for the roller center position,
stands for the radius of the roller,
represents the contact point between the roller and the cycloidal gear, and
represents the angular position parameter of point
on the roller.
2.1.2. The Meshing Equation
When a cycloid gear is in motion, the trajectory of the point
observed in the cycloidal gear coordinate frame
is a cycloid profile. Since the rollers always mesh with the cycloidal gears, Equation (1) still holds, where
stands for the tooth number of the cycloidal disk and
stands for the roller number.
The conversion of coordinate and the meshing formula can be used to obtain the contour formula of the cycloidal disk using gearing theory:
where
is the coordinate of
in
as shown in Equation (4),
represents the coordinate of
in
,
is the transformation matrix that converts from system
to system
as shown in Equation (5), and
stands for the unit normal vector of the
plane. After replacing
in the above equations and solving the mesh equations, Equations (6) and (7) are obtained.
, , , and are given values, then Equations (6) and (7) are utilized to generate the cycloidal flank profile.
2.2. Profile Modification
The errors occur during the manufacture of the components of a cycloidal gearbox, and if manufacturing errors are not taken into account, problems may arise in assembly. Therefore, in order to meet the needs of engineering applications and to compensate for these tolerances, the manufacture of cycloid gears was corrected for the cycloid tooth profile.
As can be seen from Equation (6), the cycloid disc profile equation has six parameters (). If the reduction ratio is determined when designing the cycloid gear, and cannot be changed, while is the input parameter for generating the cycloid profile; therefore, a total of three parameters, such as , and , were used as profile correction parameters. The parameters that may affect the profile are and since the eccentricity is modest and its error may be accounted for in and . In order to understand the actual effect of these parameters on the gearing accuracy, the profile modification was quantitatively studied based on single and composite conditions.
2.2.1. Single-Parameter Tooth Profile Modification
Example 1. Roller position modification.
In Example 1, the desired outcome can be achieved by adjusting a correction to the parameter in Equation (6). A positive value of () produces a profile with a tooth thickness greater than the standard tooth thickness, causing interference between the roller and the cycloidal gear. Conversely, a negative value of () produces a profile with a smaller tooth thickness, resulting in a gap between the roller and the cycloidal disk.
Example 2. Roller radius modification.
In Example 2, the desired outcome can be achieved by adjusting a correction to the parameter in Equation (6). Contrary to Example 1, produces a smaller profile while is likely to produce a larger profile.
2.2.2. Dual-Parameter Composite Profile Modification
To achieve a more optimal corrected tooth profile, both corrections,
and
, were incorporated into Equation (6). If using both corrections simultaneously, it is crucial to ensure that the corrected tooth profile is smaller, preventing any interference as shown in Equation (8), in which
denotes the necessary gap for lubrication and tolerance margins. Based on this condition, it is possible to obtain two potential combinations of tooth profile correction parameters, (
,
) and (
,
):
3. Quasi-Static Force Analysis
When a cycloid reducer is in operation, the cycloid gears are in contact with several rollers at the same time, which means that there are several rollers generating forces at the same time. Existing theoretical force analysis is performed on a cycloidal tooth profile that has not been modified, in which case the number of rollers subjected to the force is known. In the analytical determination of force interactions within modified cycloid gear profiles, the implementation of Hertzian contact theory facilitates the derivation of both the theoretical quantity of concurrently engaged teeth and their associated force values.
3.1. Tooth Contact Analysis
Hertzian contact theory is the theory of contact mechanics applicable to the analysis of non-adhesive contact; there are several assumptions in Hertzian contact theory:
- (1)
The strain is very small and within the elastic range of the contacting object.
- (2)
The contact surface of the contacting object is much smaller than the radius of the contacting object.
- (3)
The contacting surface is continuous.
- (4)
There is no friction on the contacting surface.
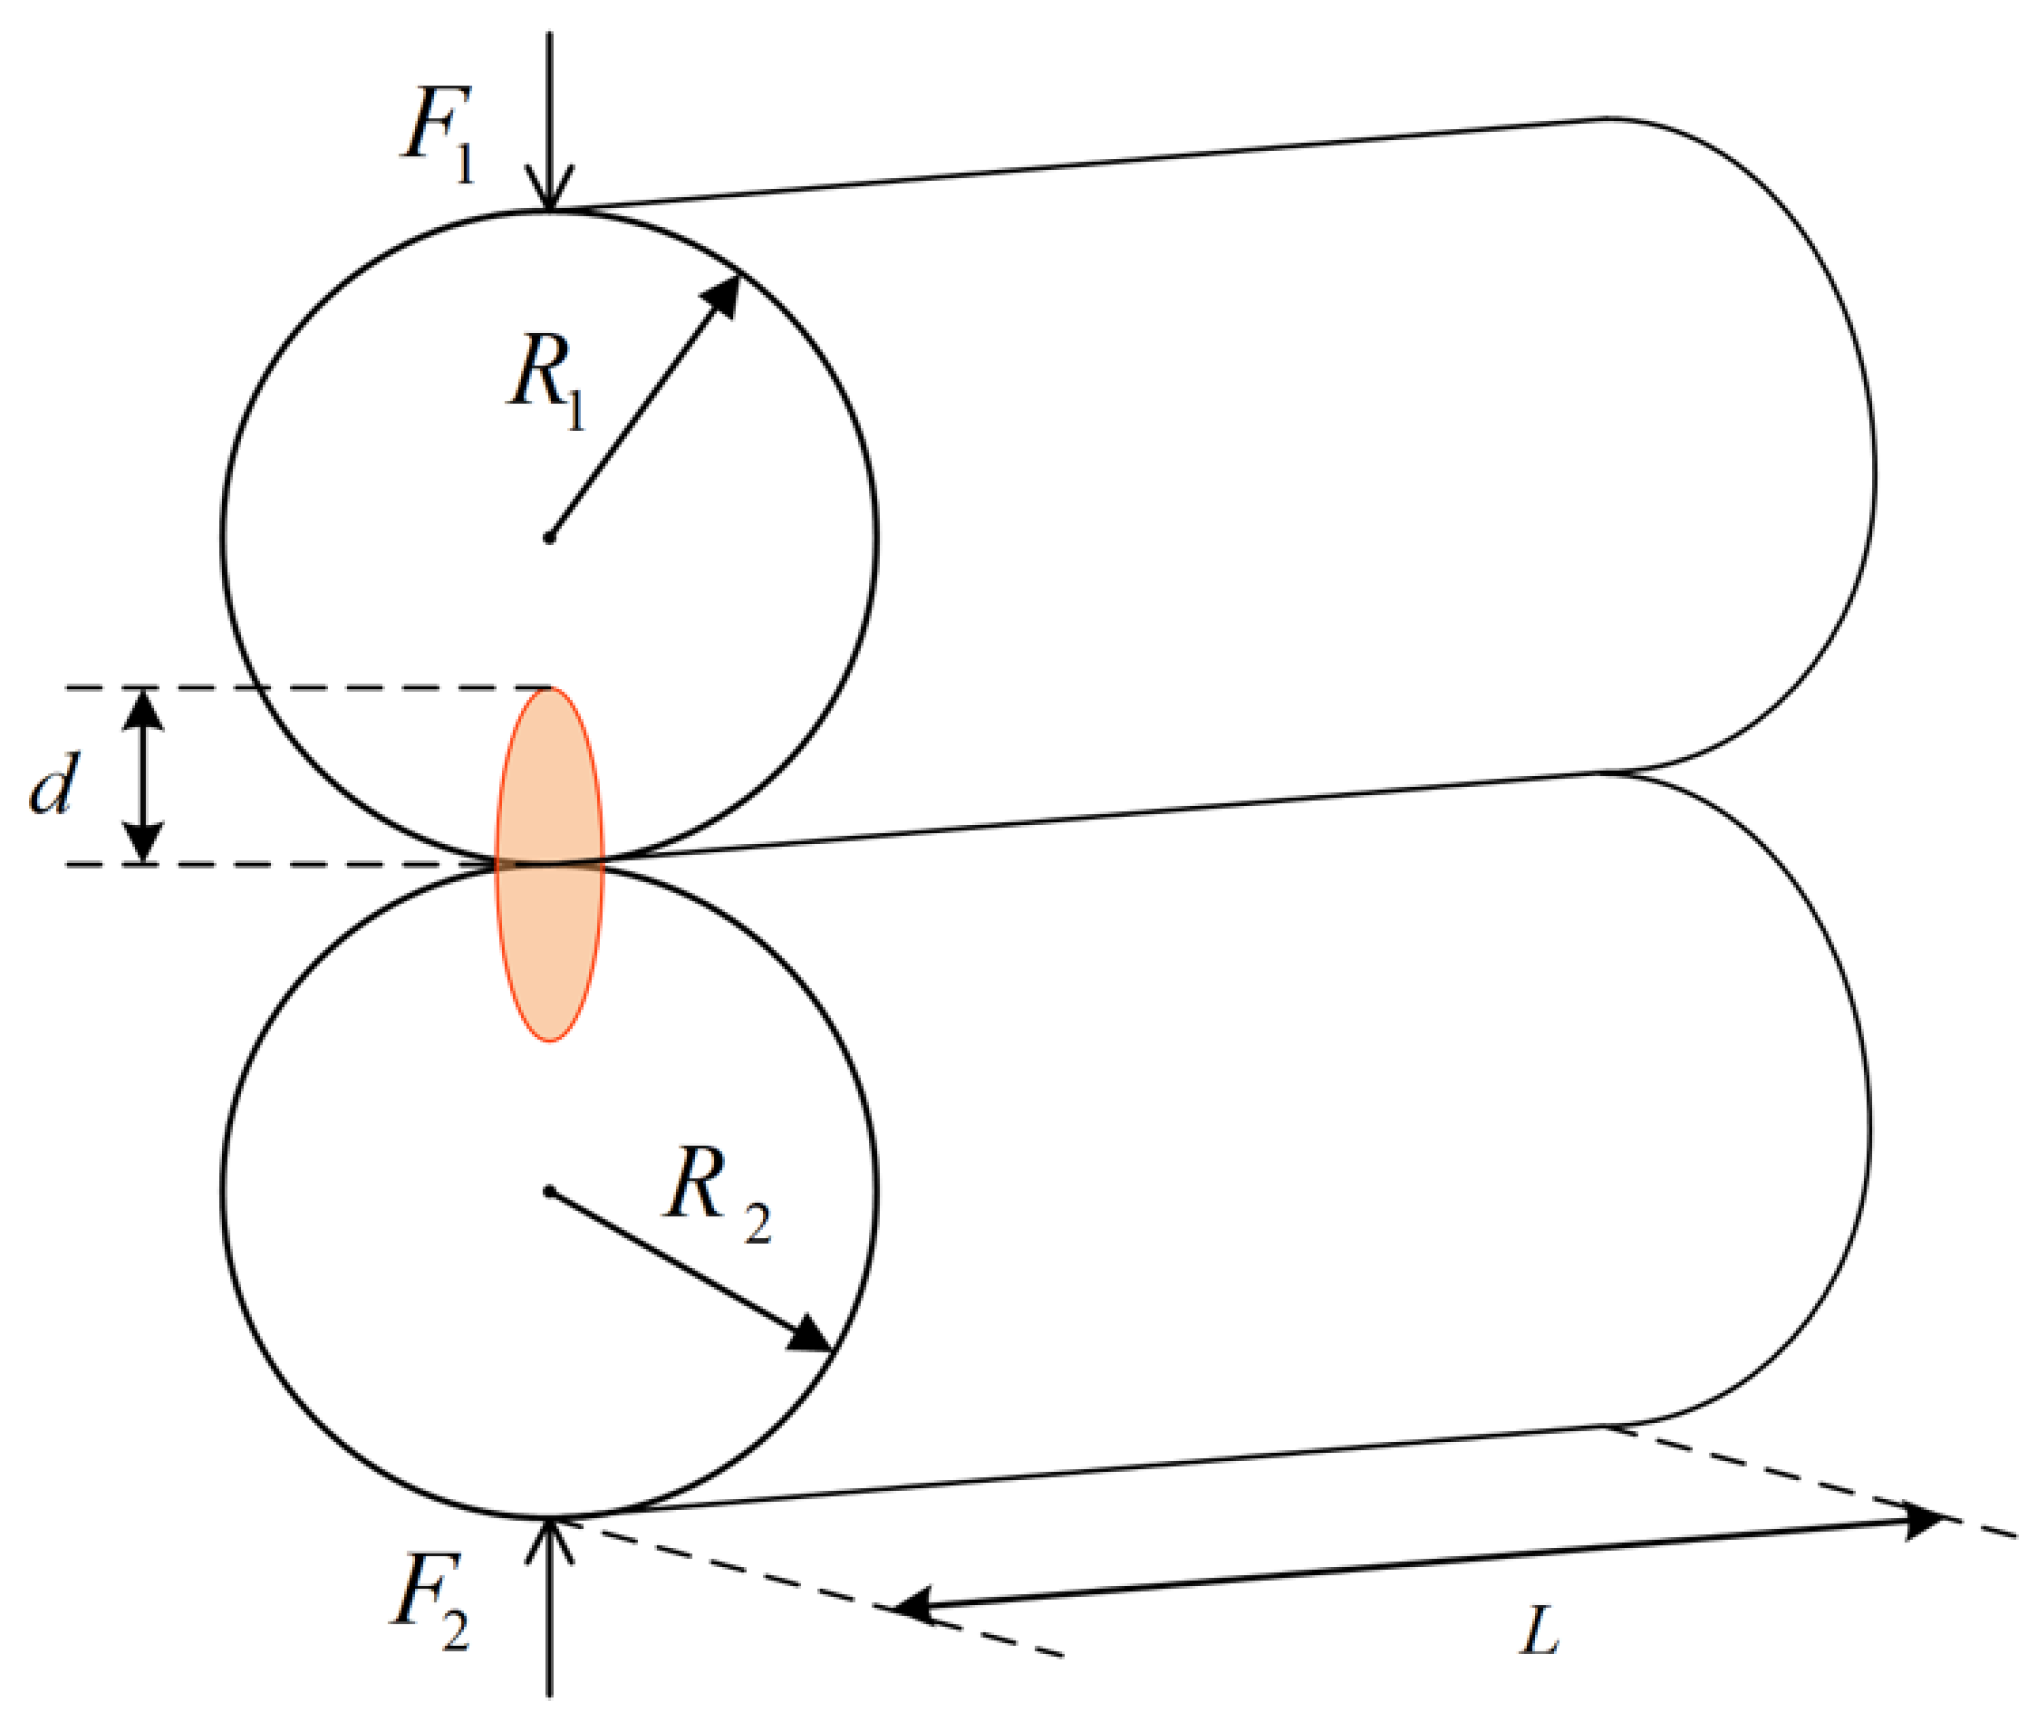
The contact between two cylindrical surfaces with parallel center axes is depicted in
Figure 2. According to the assumption of Hertz’s contact theory, it can be deduced that when two cylindrical surfaces with parallel central axes are in contact, the force is linearly proportional to the depth of the indentation, as shown in Equation (9):
where
is the depth of indentation at the point of contact,
denotes the cylinder’s length, and
corresponds to the equivalent elastic modulus. This modulus can be derived from Equation (10), where
and
are the elastic moduli of the materials for the two contact bodies, with
and
symbolizing their respective Poisson ratios.
Considering the continuous contact surfaces of both the roller and the cycloid gear, their interaction is conceptualized as a parallel cylindrical contact along the central axes in accordance with Hertzian theory, which provides the framework for force analysis between these components.
3.2. Force and Moment Equilibrium
During the operation of the cycloid gear reducer, force generation is confined to specific interactions between the cycloid gear and a limited set of engaged rollers and output pins, and the discriminant of this range is shown in Equation (11), where
is the input angle and, usually, each angle has one-half of the number of rollers and output pins in this range.
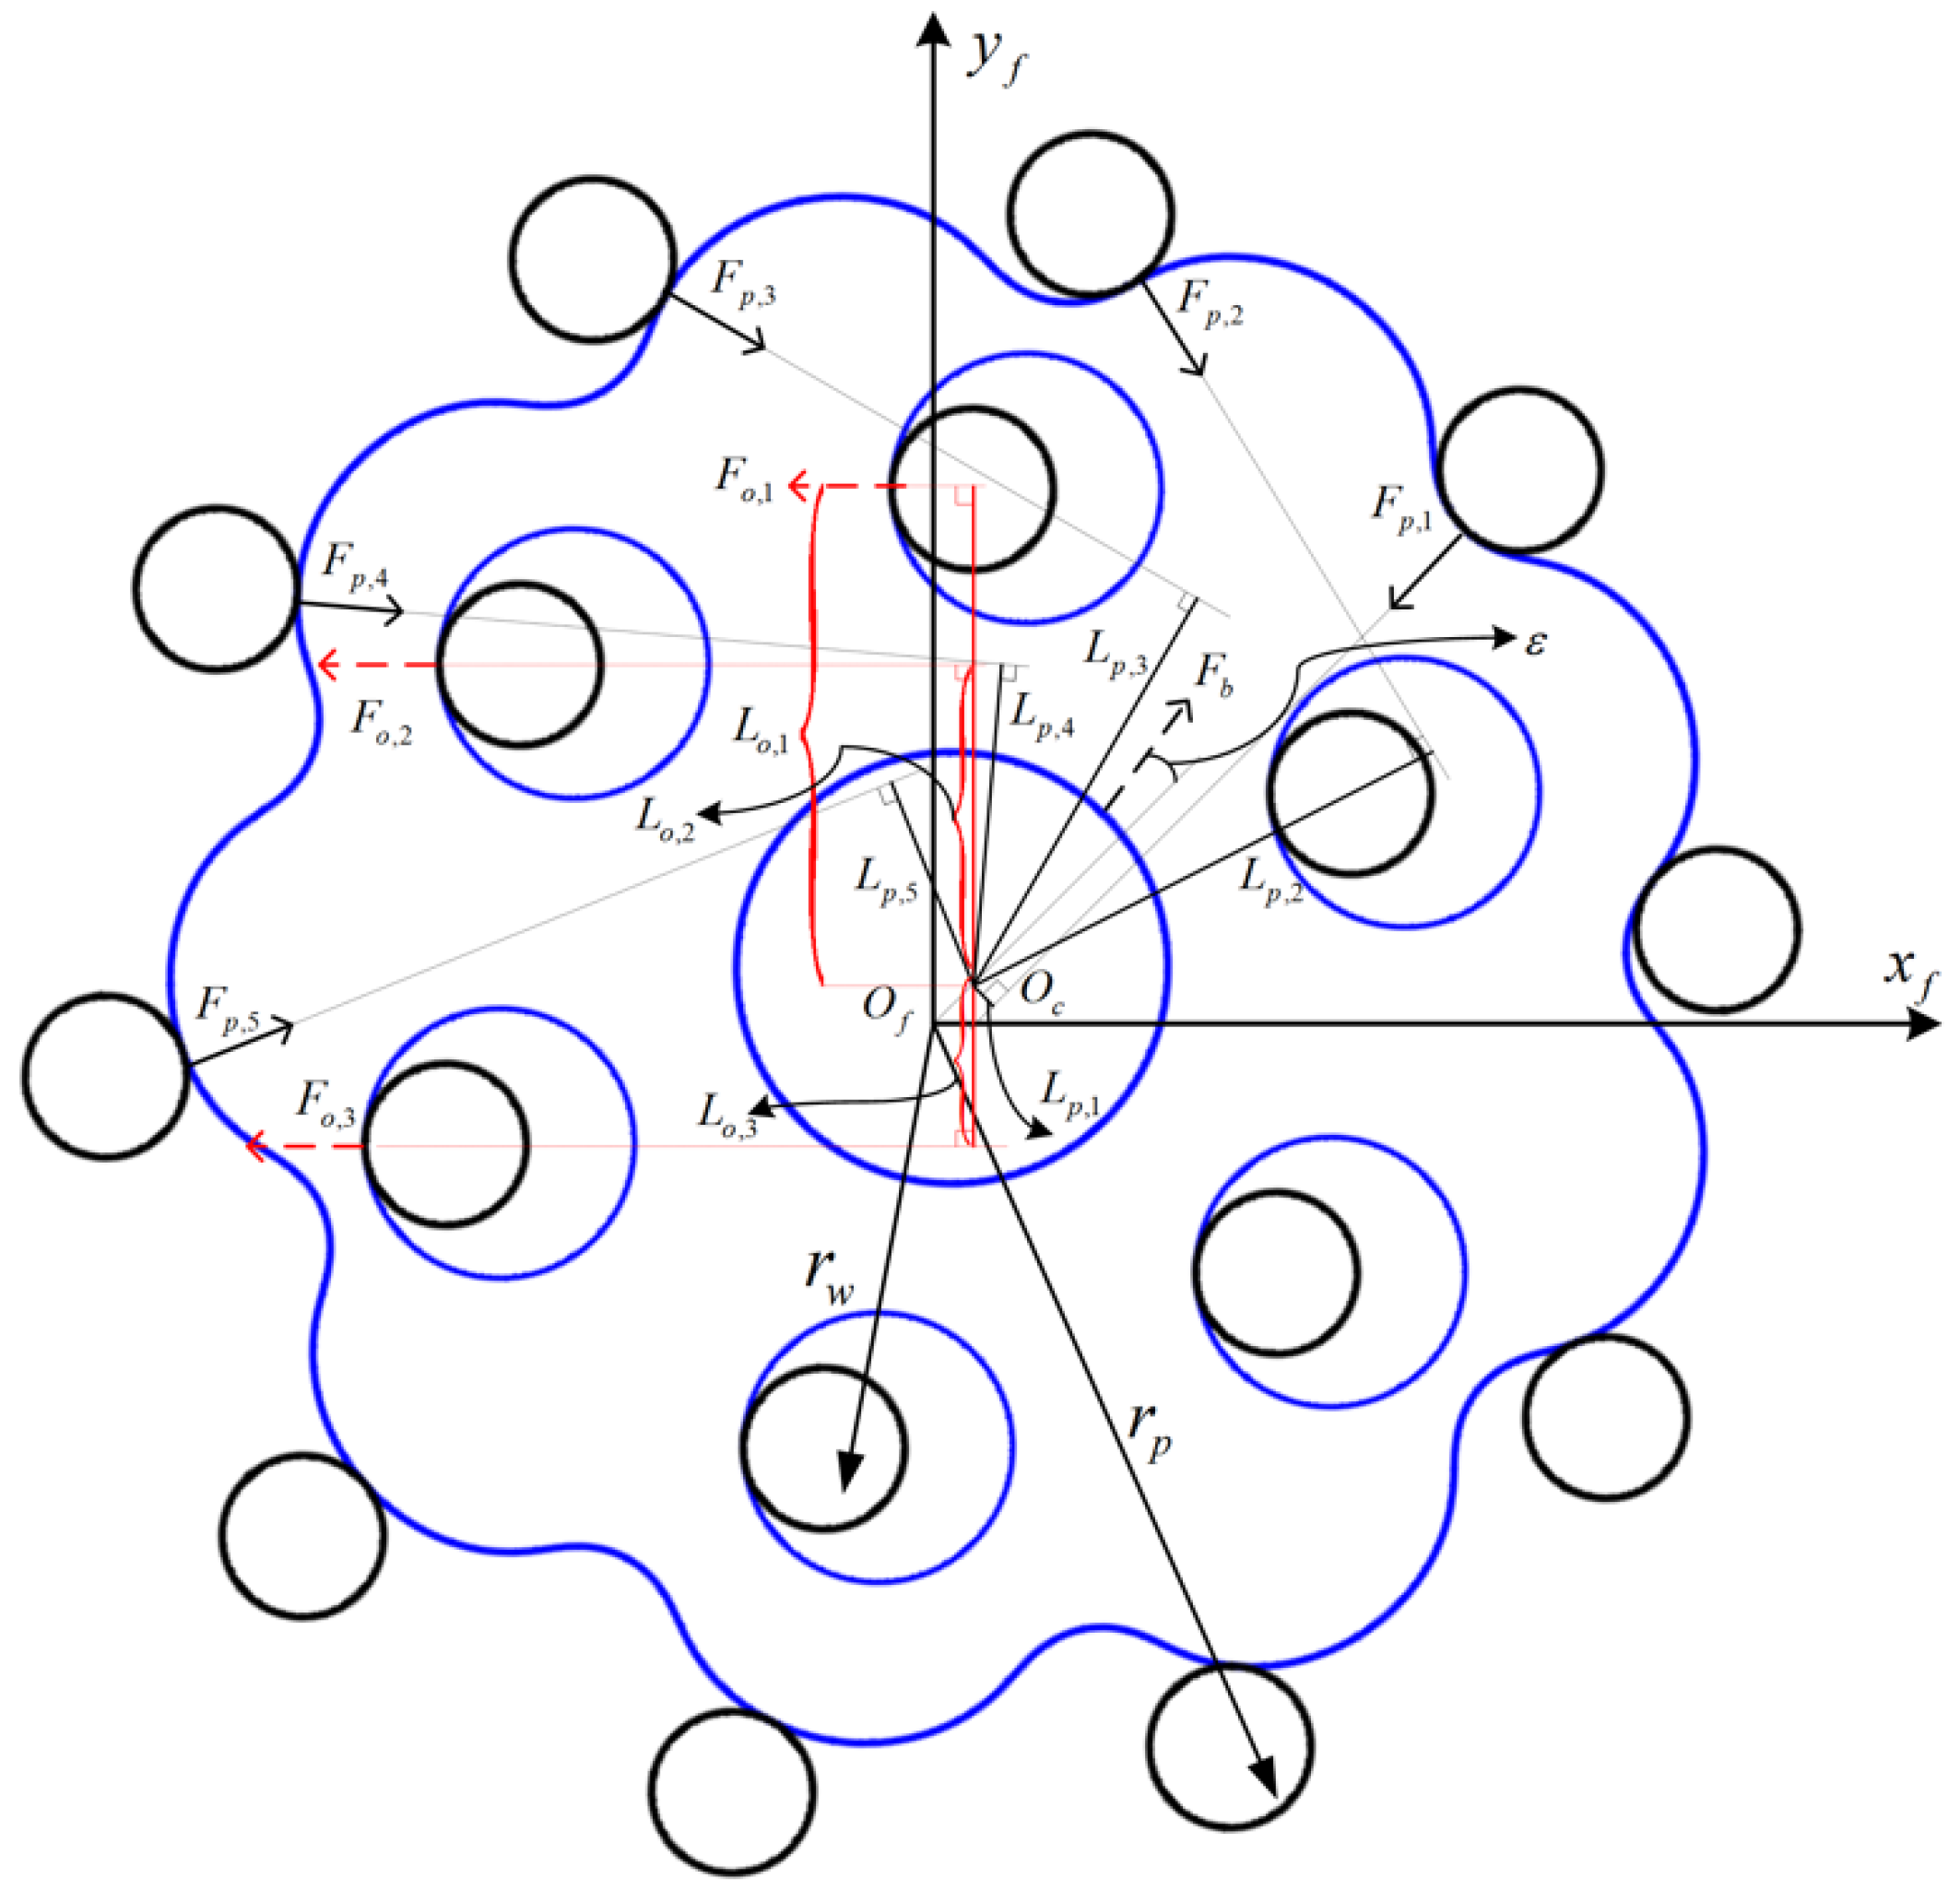
Figure 3 depicts a simplified depiction of the forces operating on the cycloid gear, where
is a fixed coordinate system,
represents the roller-generated force of
on the cycloidal gear, and
stands for the force arm length of the roller force of
.
is the output plunger pin force of
on the cycloid gear and
is the output plunger pin force of
.
is the input crank bearing force on the cycloid gear,
stands for the angle formed by the input crank bearing force and eccentricity’s direction,
is the radius of the output pin center pitch circle, and
represents the pitch circle’s radius around the roller center.
Upon achieving force balance on the cycloid gear, the force and moment are balanced in the
-axis and
-axis:
where
and
can be obtained from Equations (15) and (16), in which
is the angle between the two rollers,
is the angle between the two output pins, and
is the output angle.
The contact state between the roller and the cycloid gear is determined by Equation (17), where
is the change in output angle when the cycloid gear reaches force balance and
is the value of the roller backlash of the roller of
as shown in
Figure 4.
The following two possible cases exist:
Case (a). ,
In this case, the change in the output angle adequately compensates for roller back-lash, facilitating contact between the cycloid gear and the roller, while the calculated function value is subsequently expressed as the indentation depth.
Case (b). ,
In this case, roller backlash remains, preventing contact between the cycloidal gear and the roller.
The number of uncertainties can be reduced to , , , and , which can be calculated with the help of a Matlab programming solution.
4. Results and Discussion
The bearing force distribution, needle tooth force, and loaded transmission error of the cycloidal gear pair were generated by the aforementioned computation model.
Table 1 shows the fundamental design parameters assuming that the gear pair’s material characteristics are the same, Poisson’s ratio is 0.3, and Young’s modulus is 206 GPa.
From the results of the force analysis, it was found that the angular displacement and reduction ratio after flank profile modification are in error from the theoretical values when it is in operation. In this work, the design is optimized for the maximum reduction ratio error of in the motion state, and the design variables are the toothing trimming parameters and . The combinations of the tooth profile correction parameters are used for the two combinations previously mentioned: (, ) and (,). The optimization tool used is the Matlab built-in optimization function fmincon.
4.1. Objective Function
When the reduction ratio of a speed reducer is not constant, the amplitude of the oscillation of the reduction ratio affects the degree of change in the output speed. If this degree of change can be reduced so that the reduction ratio tends to a certain value, the output of the cycloidal reducer can be made closer to equal speed. In this work, the objective function is set to be the maximum reduction ratio error of
in the motion state, the variation within the highest and lowest values of the speed ratio error, as shown in Equation (18) and
Figure 5.
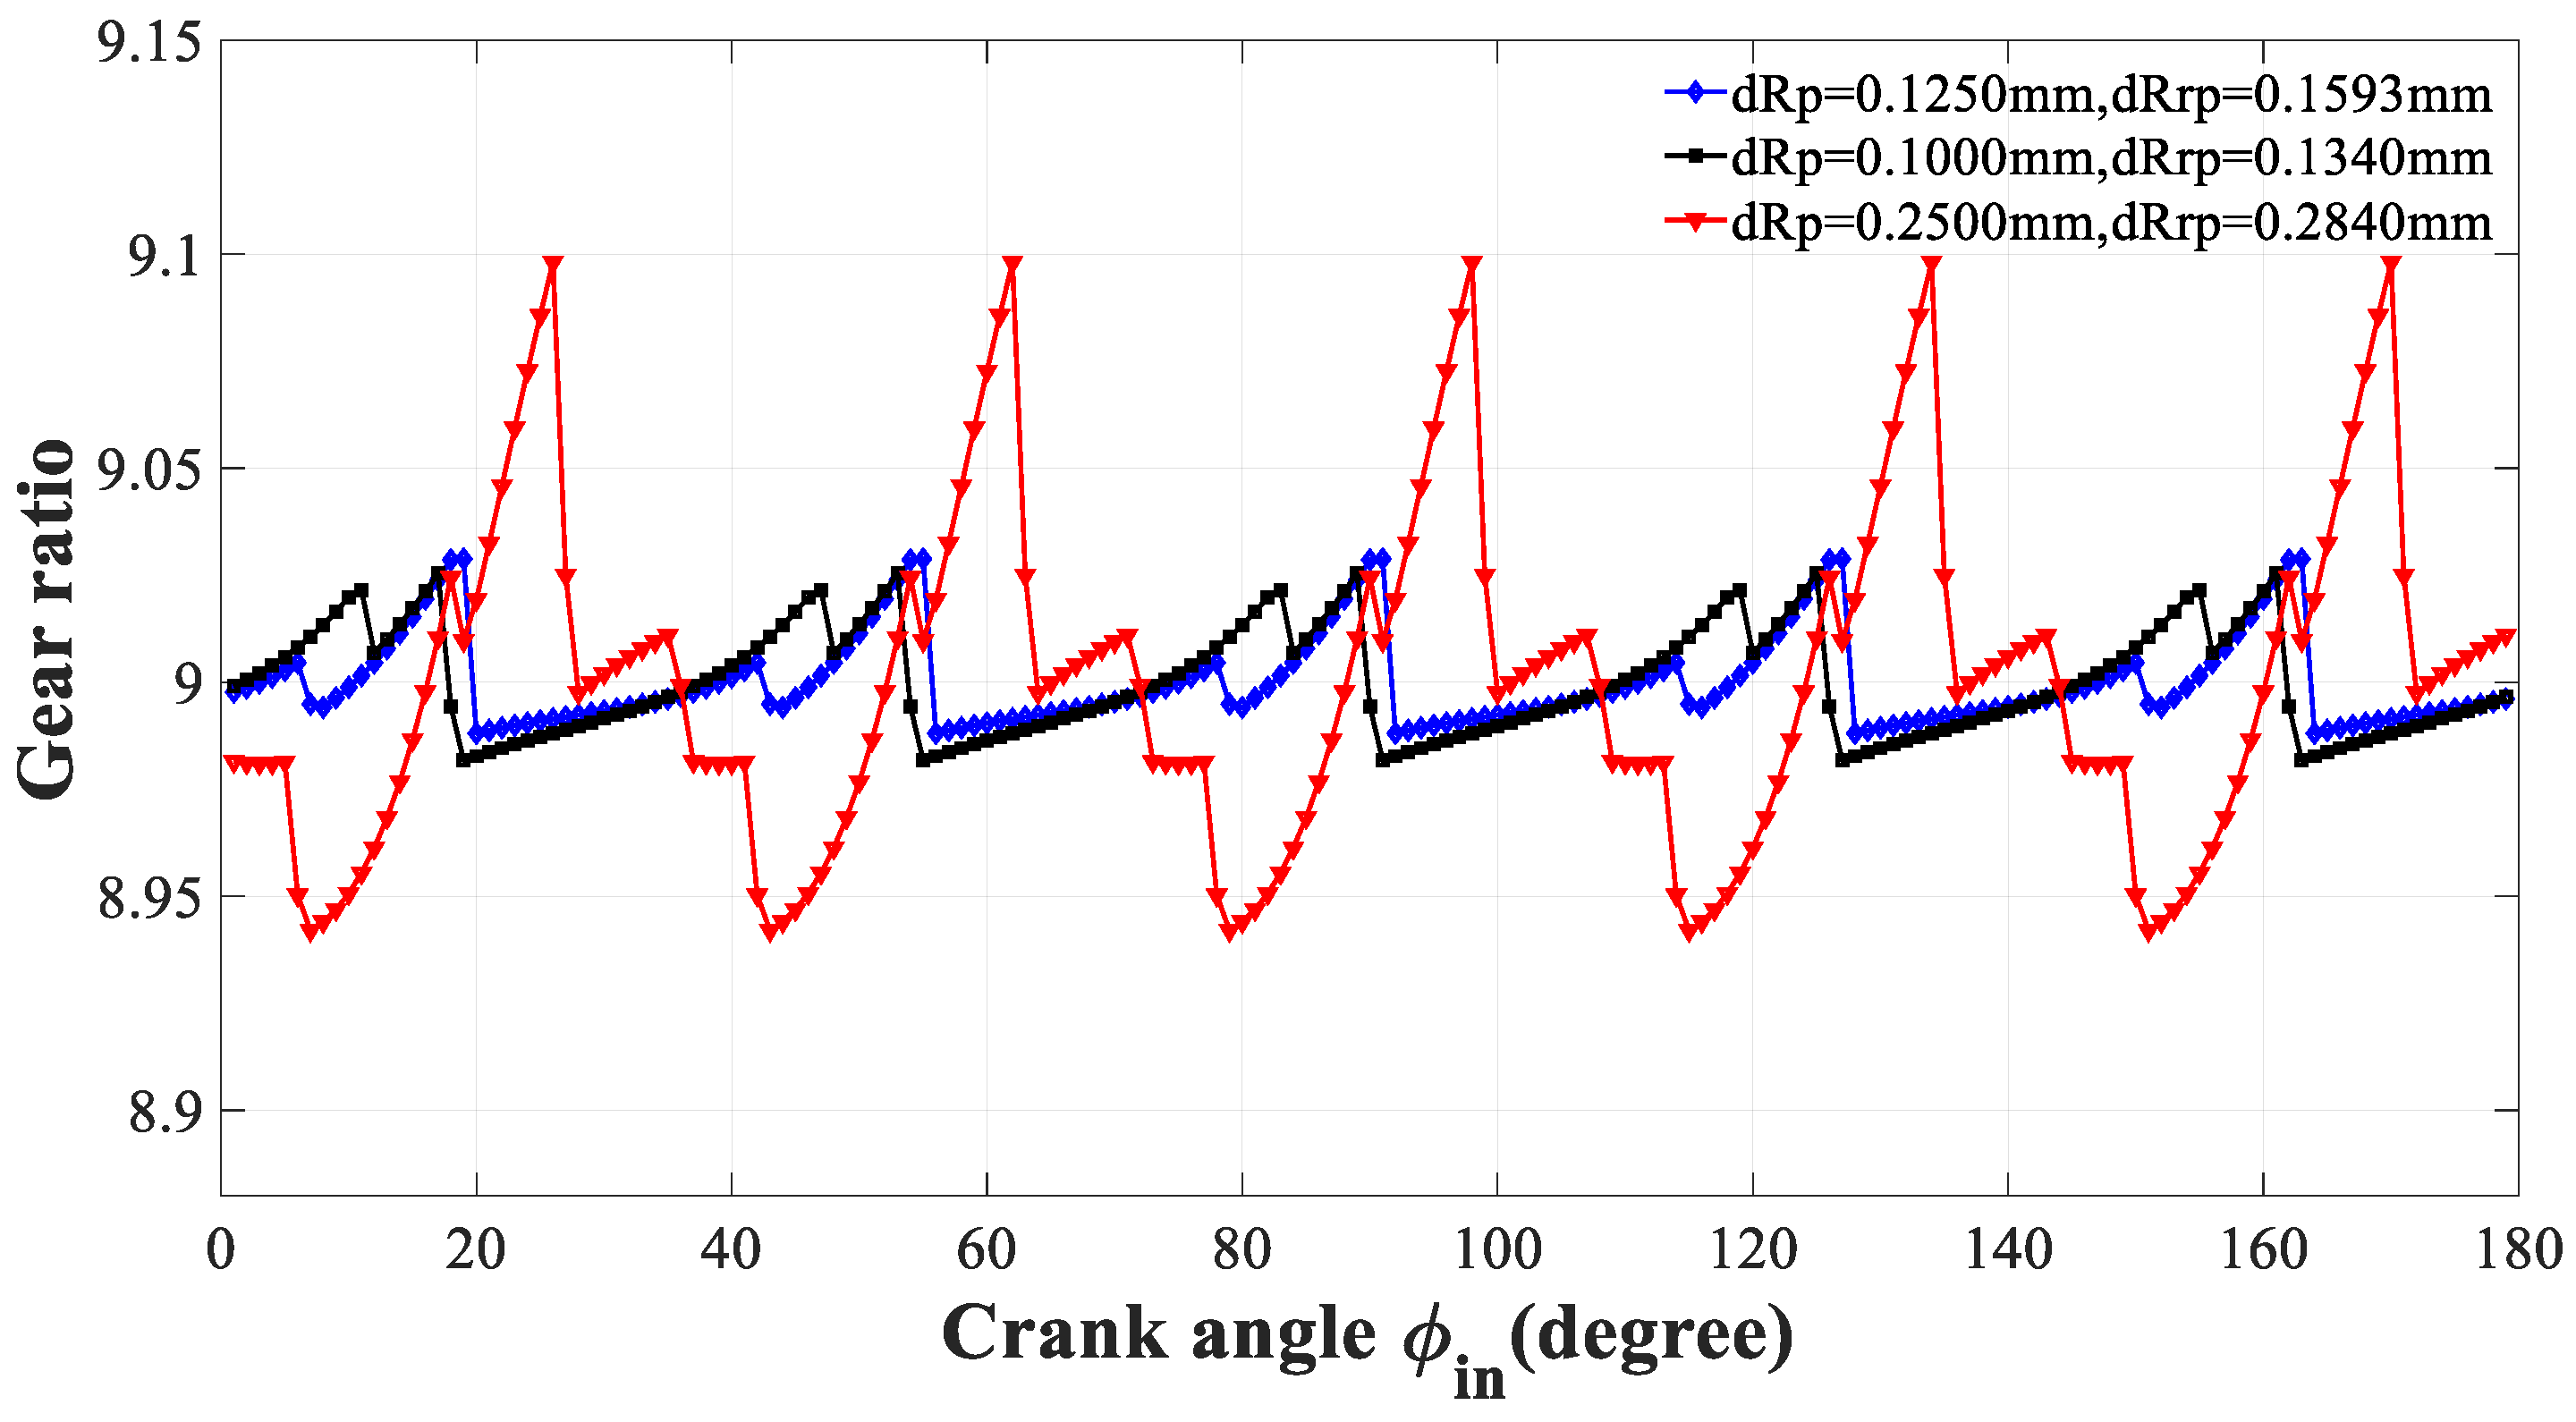
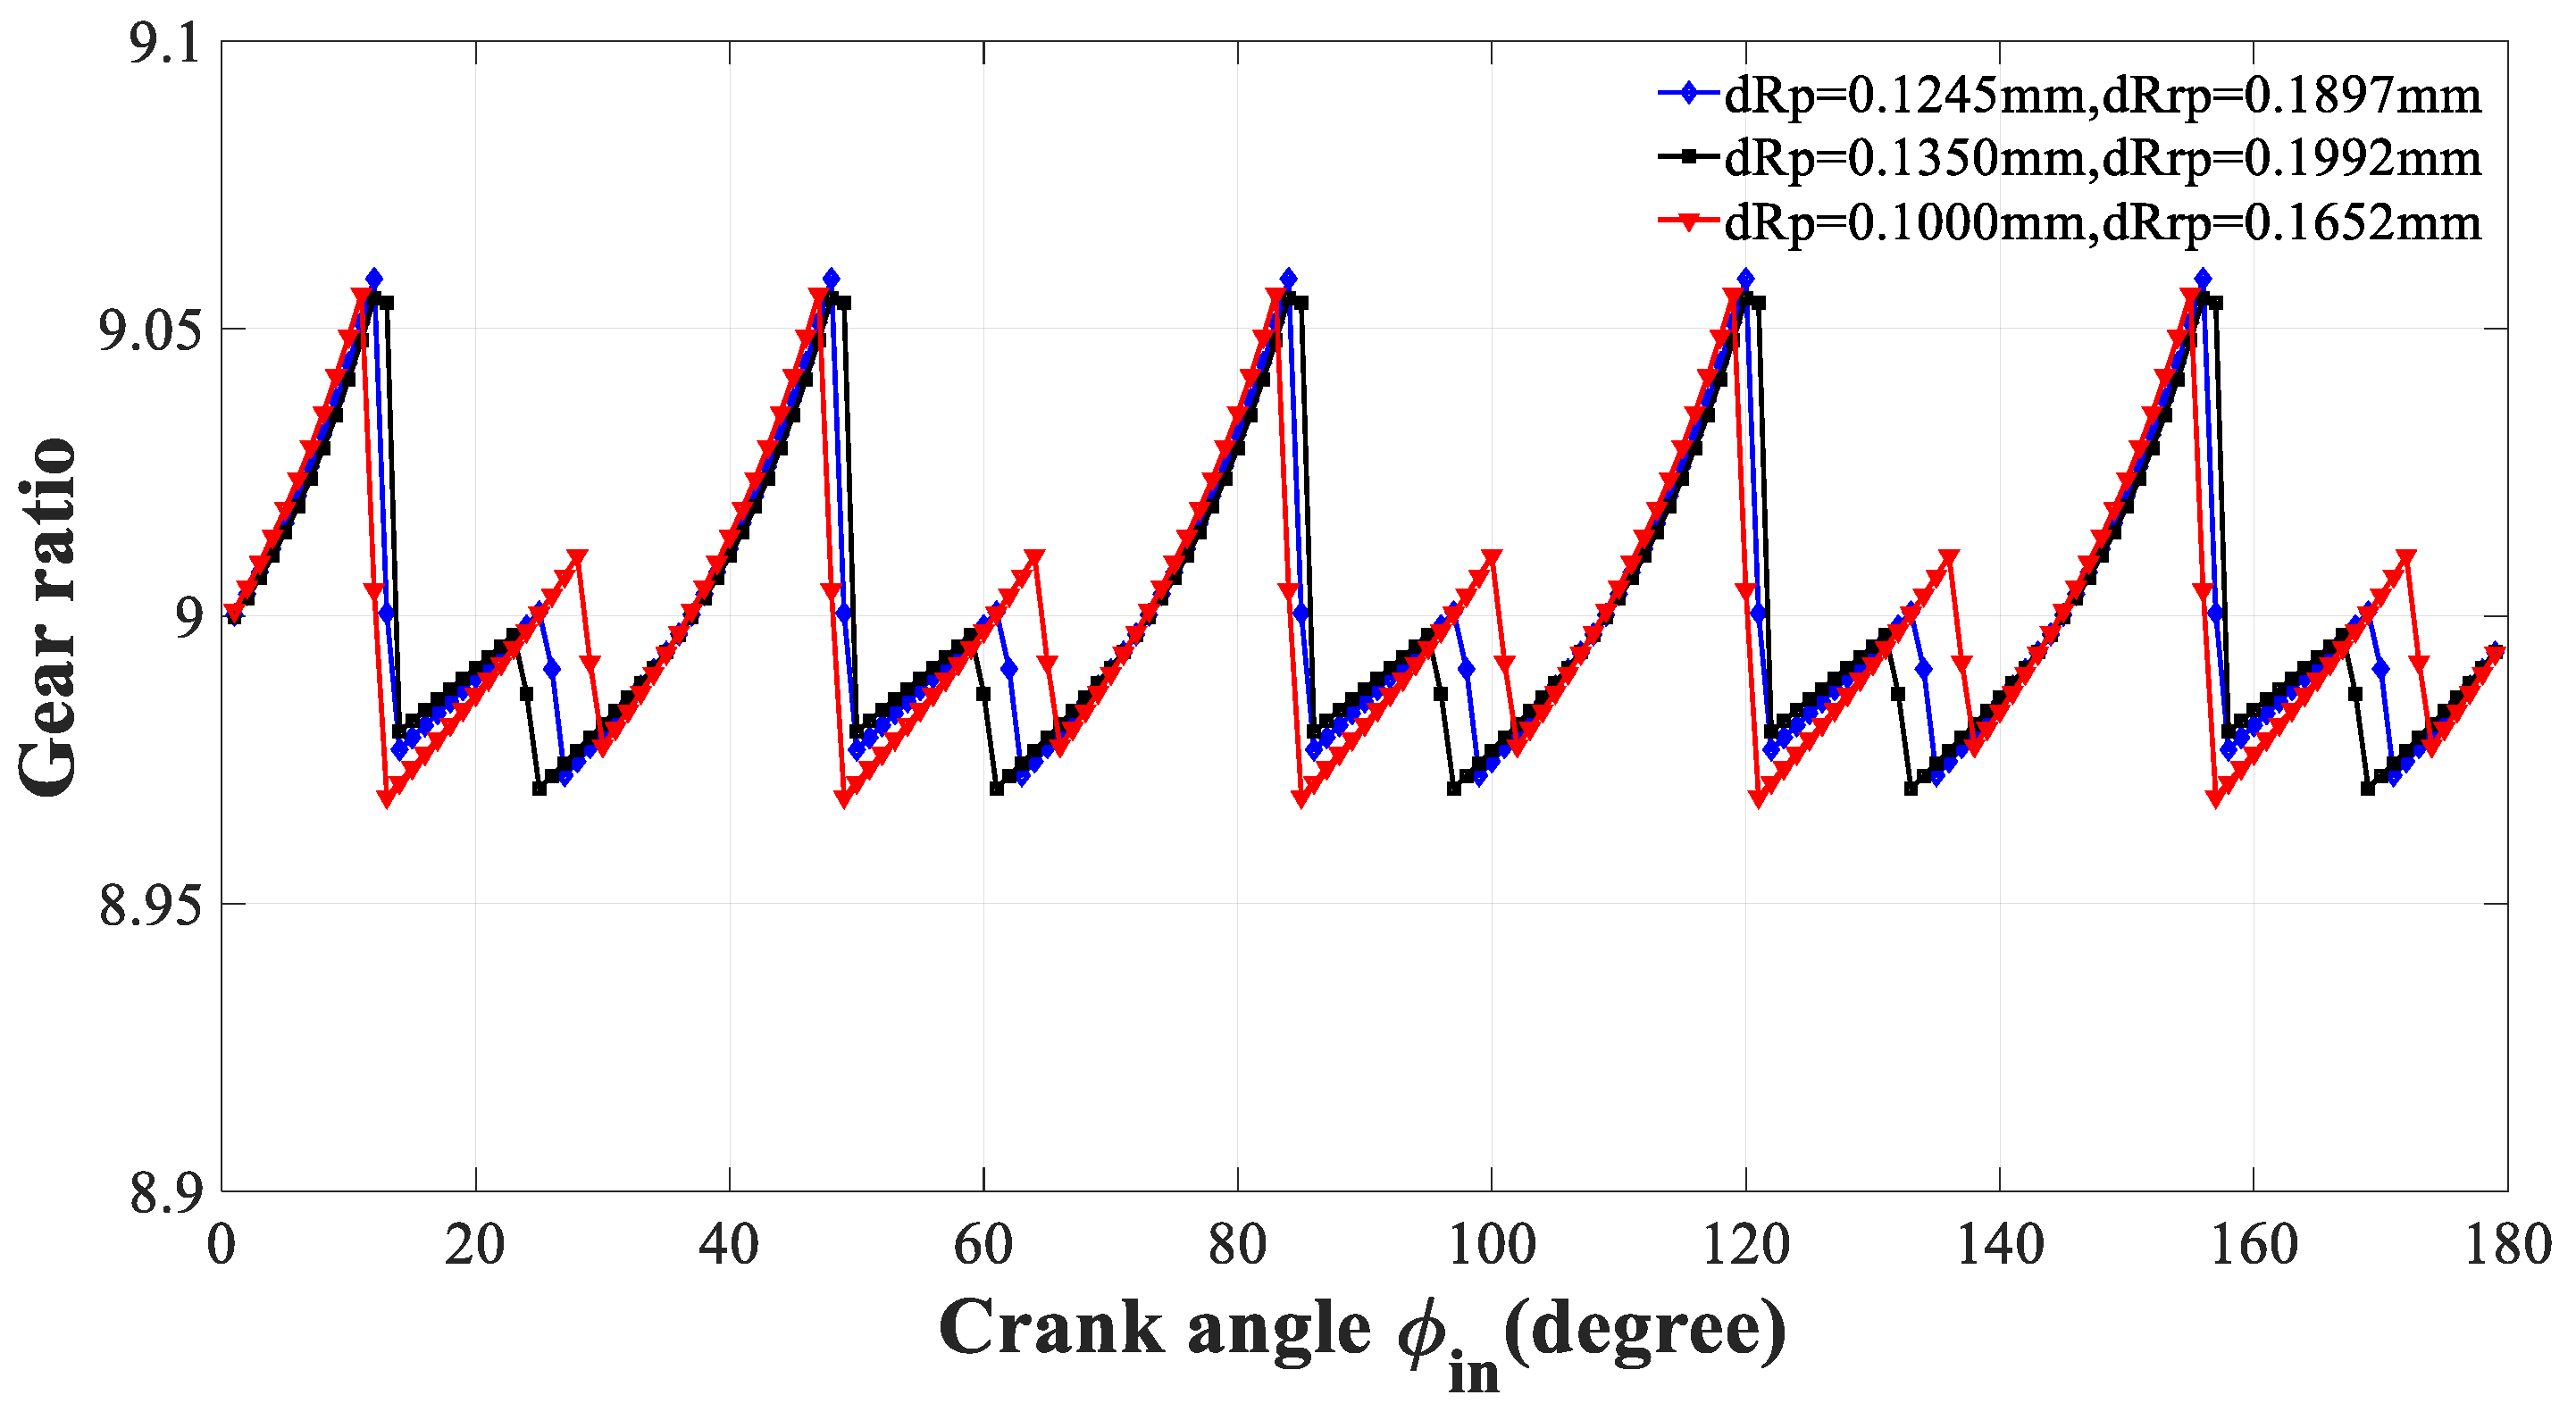
Under the optimization of transmission ratio fluctuations, the three sets of transmission ratio comparison charts were obtained under different modification amounts. Among them,
is the optimal amount of repair. From
Figure 6, it can be seen that the blue curve (the best) has the smallest range of transmission ratio fluctuations and exhibits periodicity. The transmission ratio is around 9. It was expected that this result would produce a more stable output speed.
Similarly, the transmission error fluctuation of the blue curve (the best) is also the smallest and exhibits a periodic pattern as shown in
Figure 7.
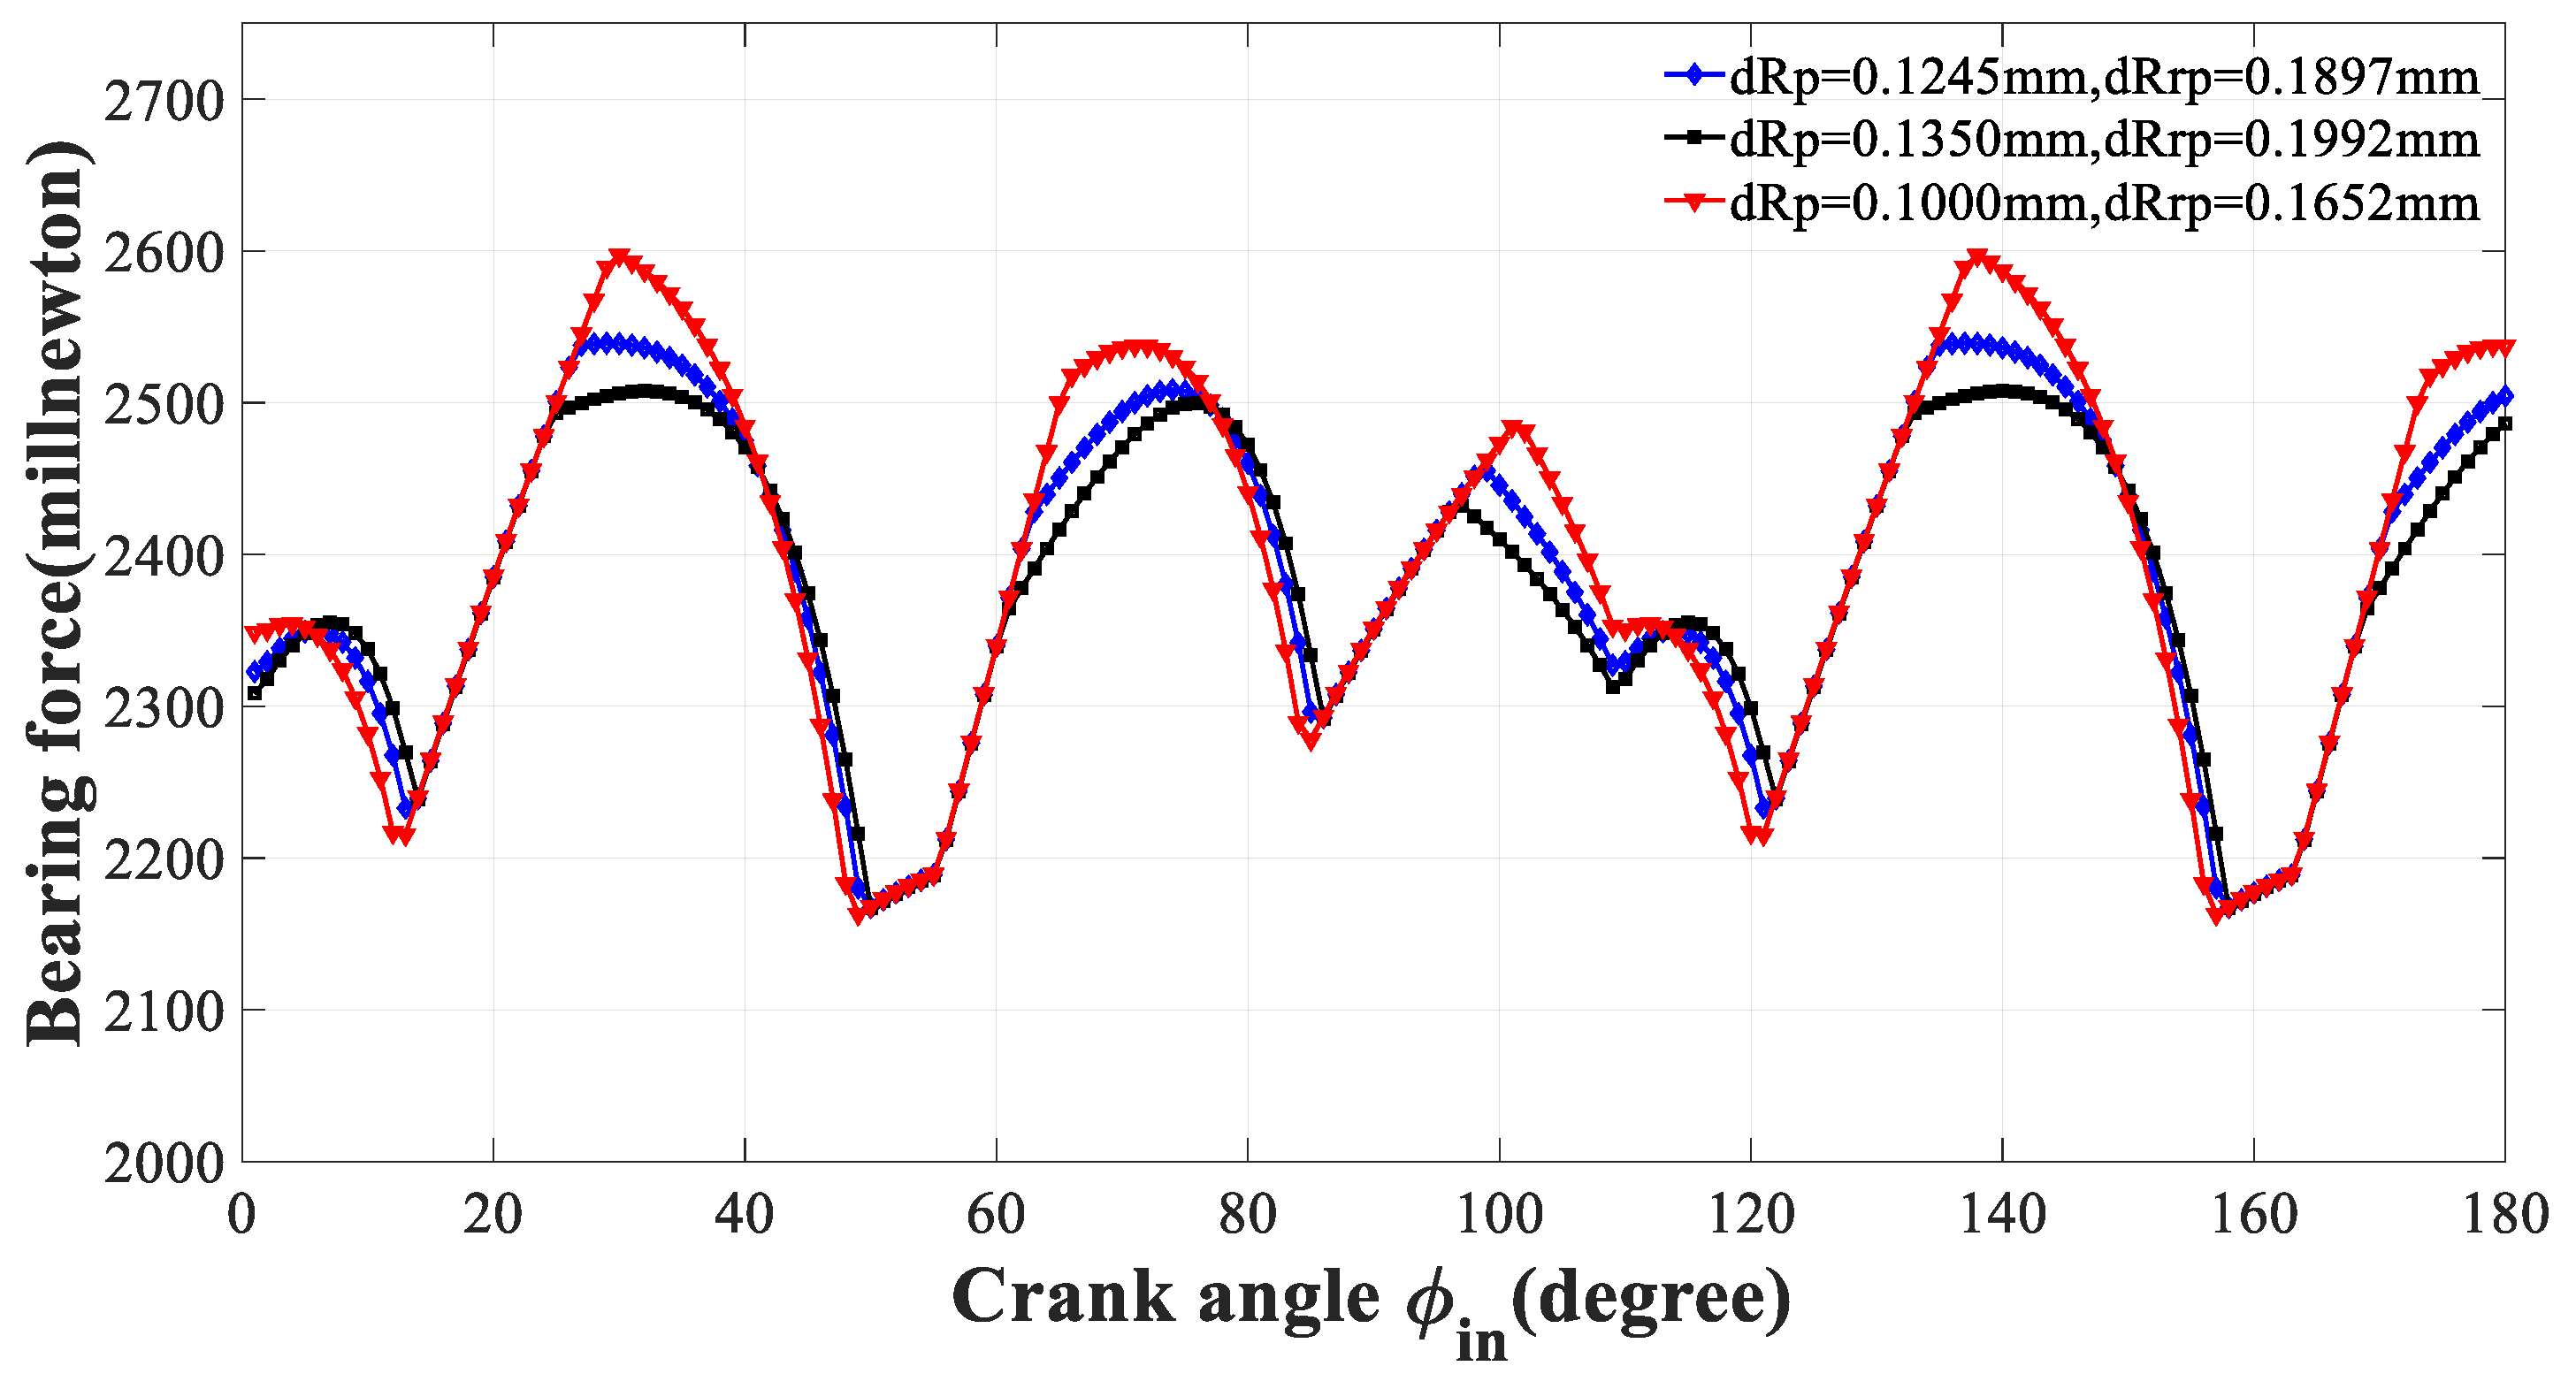
The blue curve shows the changes in bearing force under different crankshaft input angles; the maximum bearing force is significantly reduced compared with the other two groups (the black curve and the red curve) as expressed in
Figure 8. Its fluctuation range is also relatively reasonable, exhibiting periodic fluctuations.
The action range of the blue curve needle tooth force is larger than that of the black curve, indicating an increase in contact ratio. Moreover, the maximum needle tooth force on the blue curve is slightly smaller than that on the black curve as expressed in
Figure 9.
Due to the fact that the change in the force acting on the needle teeth does not affect the force exerted on the output pin, the force exerted on the output pin remains basically unchanged as shown in the following
Figure 10.
4.2. Boundary Conditions
In this work, the absolute value range of both
and
is set within 0 mm and 0.5 mm, as shown in Equations (19) and (20).
Equation (8) must be satisfied when both
and
profile parameters are used and
is set to 0.015 mm. The larger the backlash produced by the combination of profile amounts, the larger the backlash of the cycloidal gears and the rollers, and the more likely it is that there will be only a single tooth in contact; therefore, the upper limit of the backlash for this task is set to 0.5 mm. The condition is shown in Equation (21).
In this work, the optimization is made for the reduction ratio error by using combinations of previously mentioned tooth correction parameters, respectively. Conclusions are obtained by comparing the initial estimates with the results of the optimized design for the angular displacement error , reduction ratio error , average reduction ratio error , maximum roller force , maximum output roller force , and maximum bearing force .
4.3. Optimization Results of Positive Combined Modification
In this combination, the objective function can be changed to Equation (22) while the initial estimates of
and
are, respectively, set to 0.135 mm and 0.150 mm. The objective function is set to represent the maximum loaded transmission error of
in the motion state, the variation between the maximum and minimum values of loaded transmission error, as depicted in Equation (22).
The following figures show the comparison chart of different transmission performances under the condition of optimized transmission error fluctuation. The comparison of gear ratios under optimized transmission error fluctuations for three modification types is presented in
Figure 11. From the graph, it can be seen that the trend of curve changes for the three different types of modifications is basically consistent. The transmission ratio varies around 9. In addition, the gear ratio fluctuation of the blue curve (optimal modification amount) is also the smallest, compared with the other two curves. As shown in
Figure 12, the comparison curves of loaded transmission errors under three types of modification quantities are expressed, and as the modification amount increases, the loaded transmission error decreases continuously. Moreover, as the input angle of the crankshaft changes, the three curves also exhibit periodic and regular changes. As the amount of modification increases, the amplitude of the bearing force decreases as shown in
Figure 13. The blue curve of the bearing force changes more smoothly. The three curves all have needle tooth force starting from the 97th tooth, and the trend of change is basically the same. The needle tooth forces gradually increase, then slightly decrease, and finally gradually decrease to 0. By the 158th tooth, there is basically no needle tooth force as shown in
Figure 14.
4.4. Optimization Results of Negative Combined Modification
In this combination, the objective function can be changed to Equation (23) while the initial estimates of
and
are, respectively, set to −0.15 mm and −0.135 mm.
The figures below show a comparison chart of different transmission performances under the condition of optimizing transmission error fluctuation (negative and negative modification). As shown in
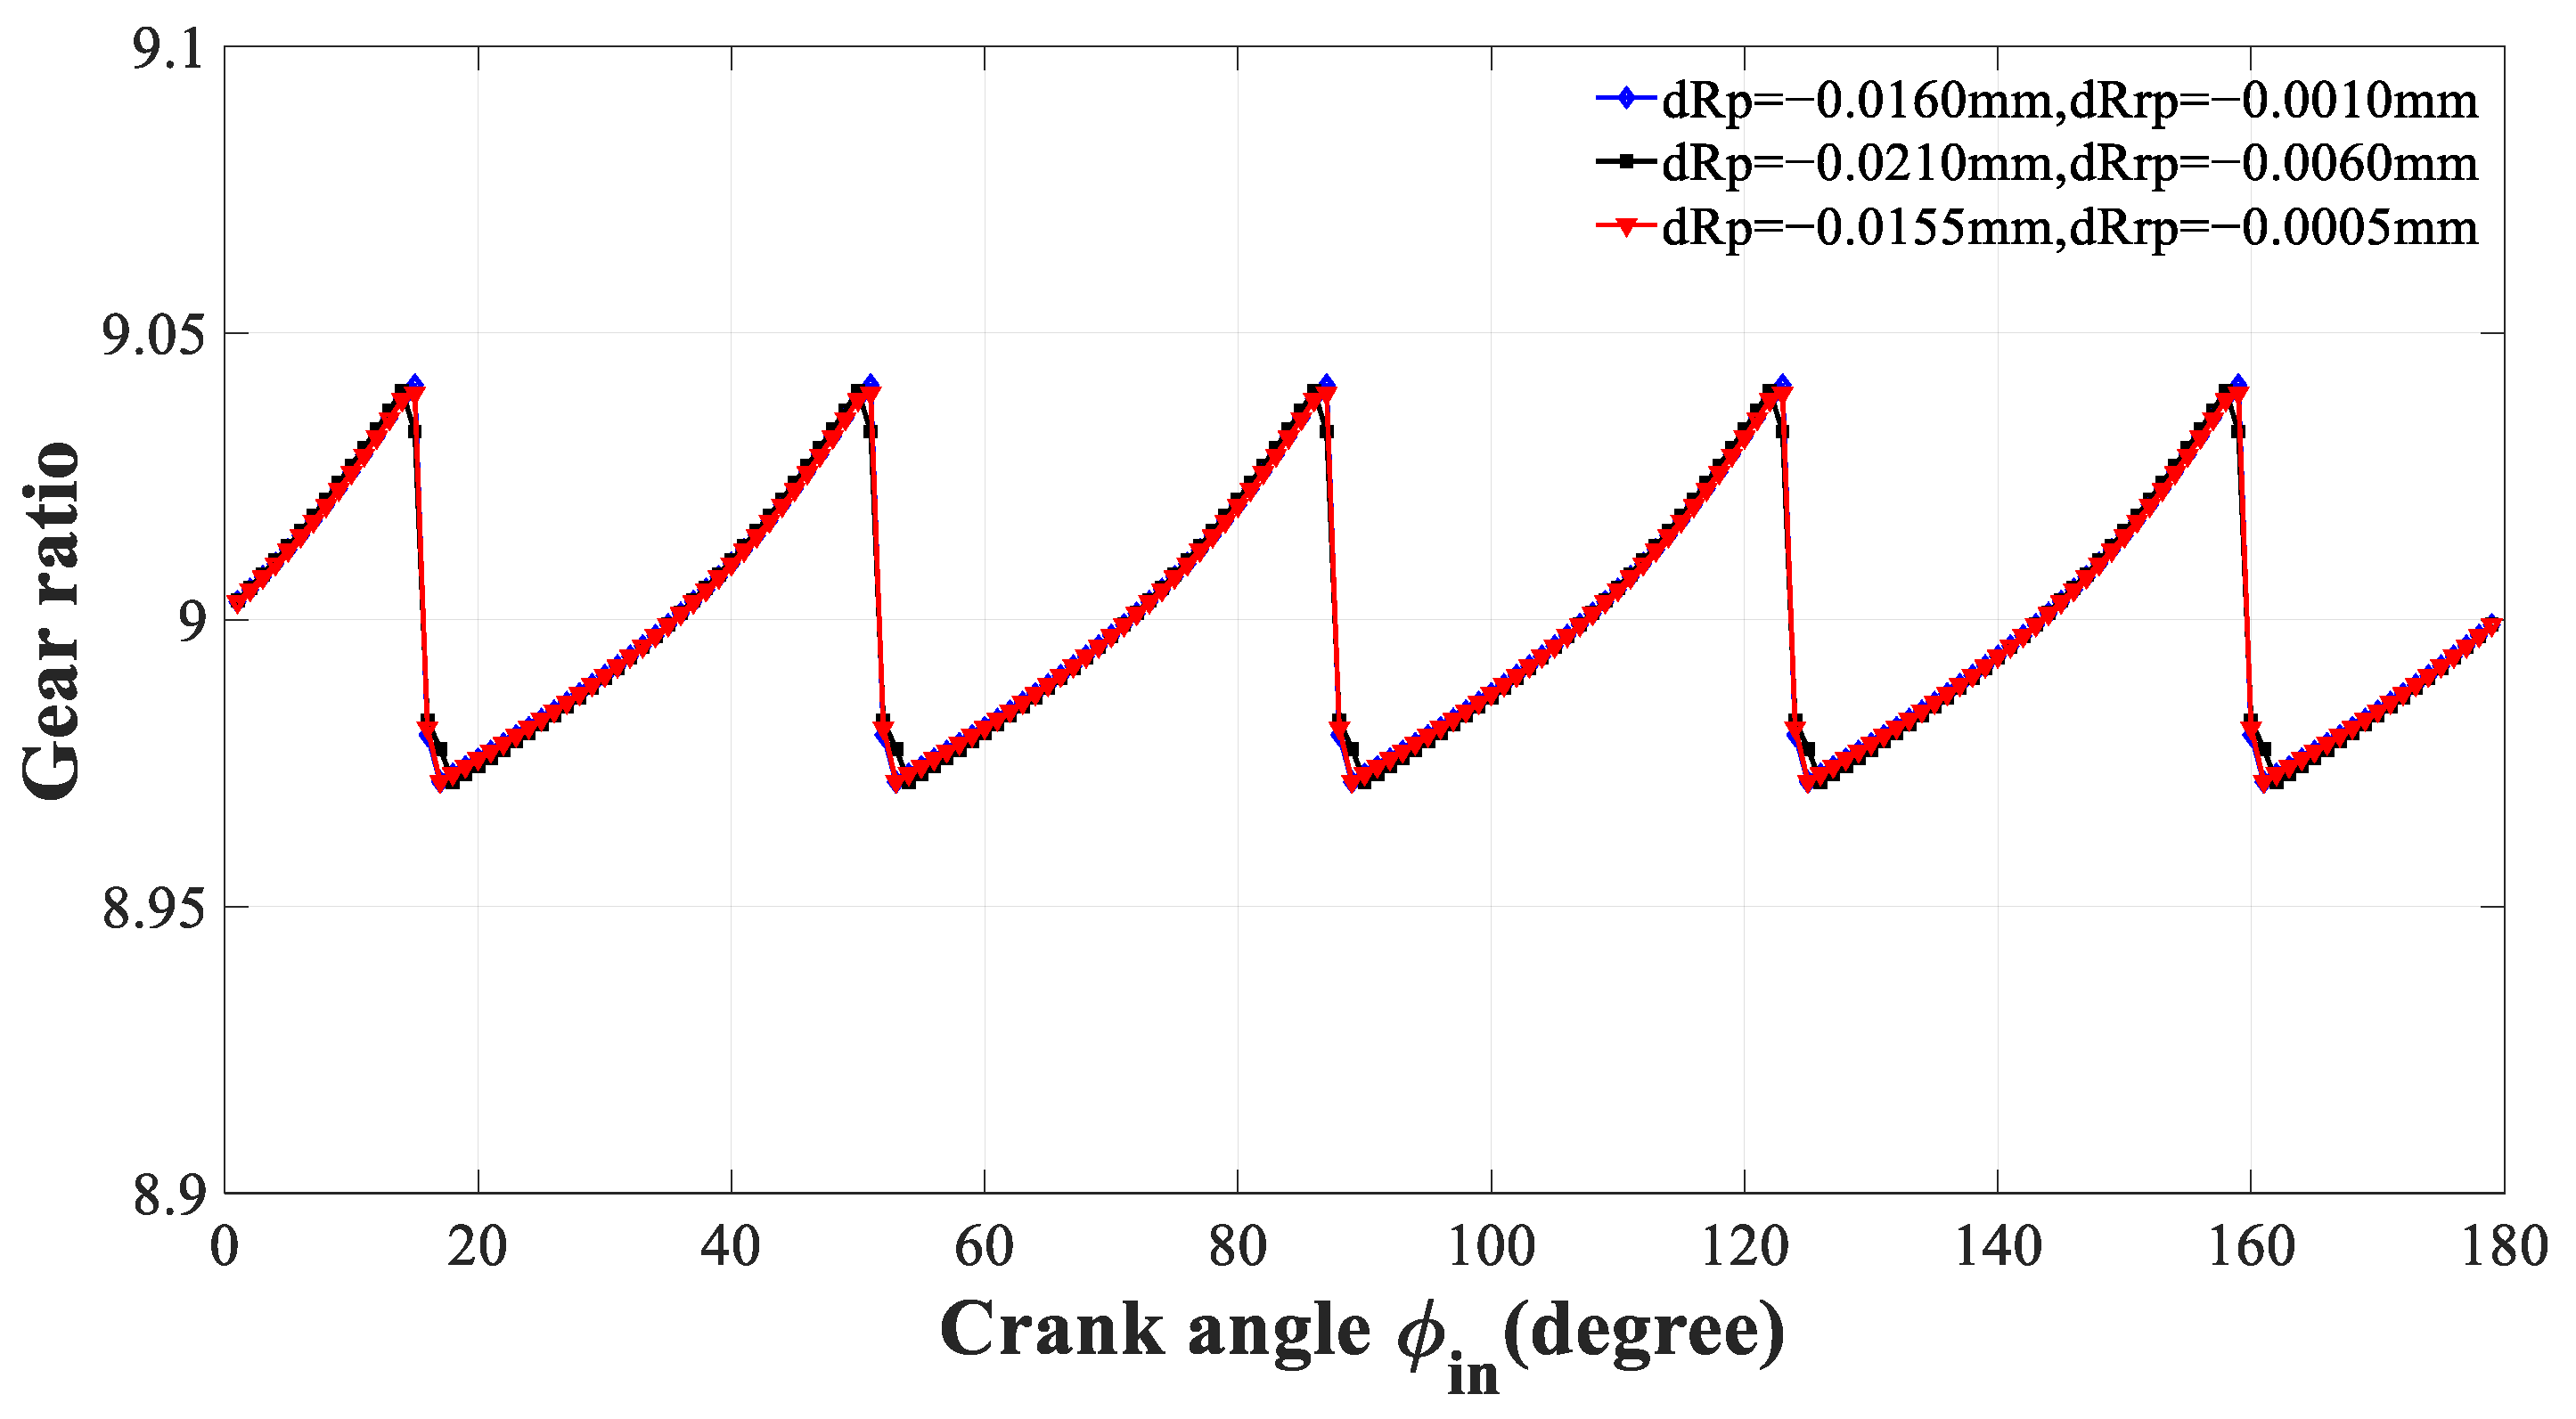
Figure 15, with the increasing modification amount, the loaded transmission error decreases. As the input angle of the crankshaft continuously changes, the loaded transmission error shows a trend of variation similar to a sine curve. The blue curve represents the change in loaded transmission error corresponding to the optimal modification amount. In
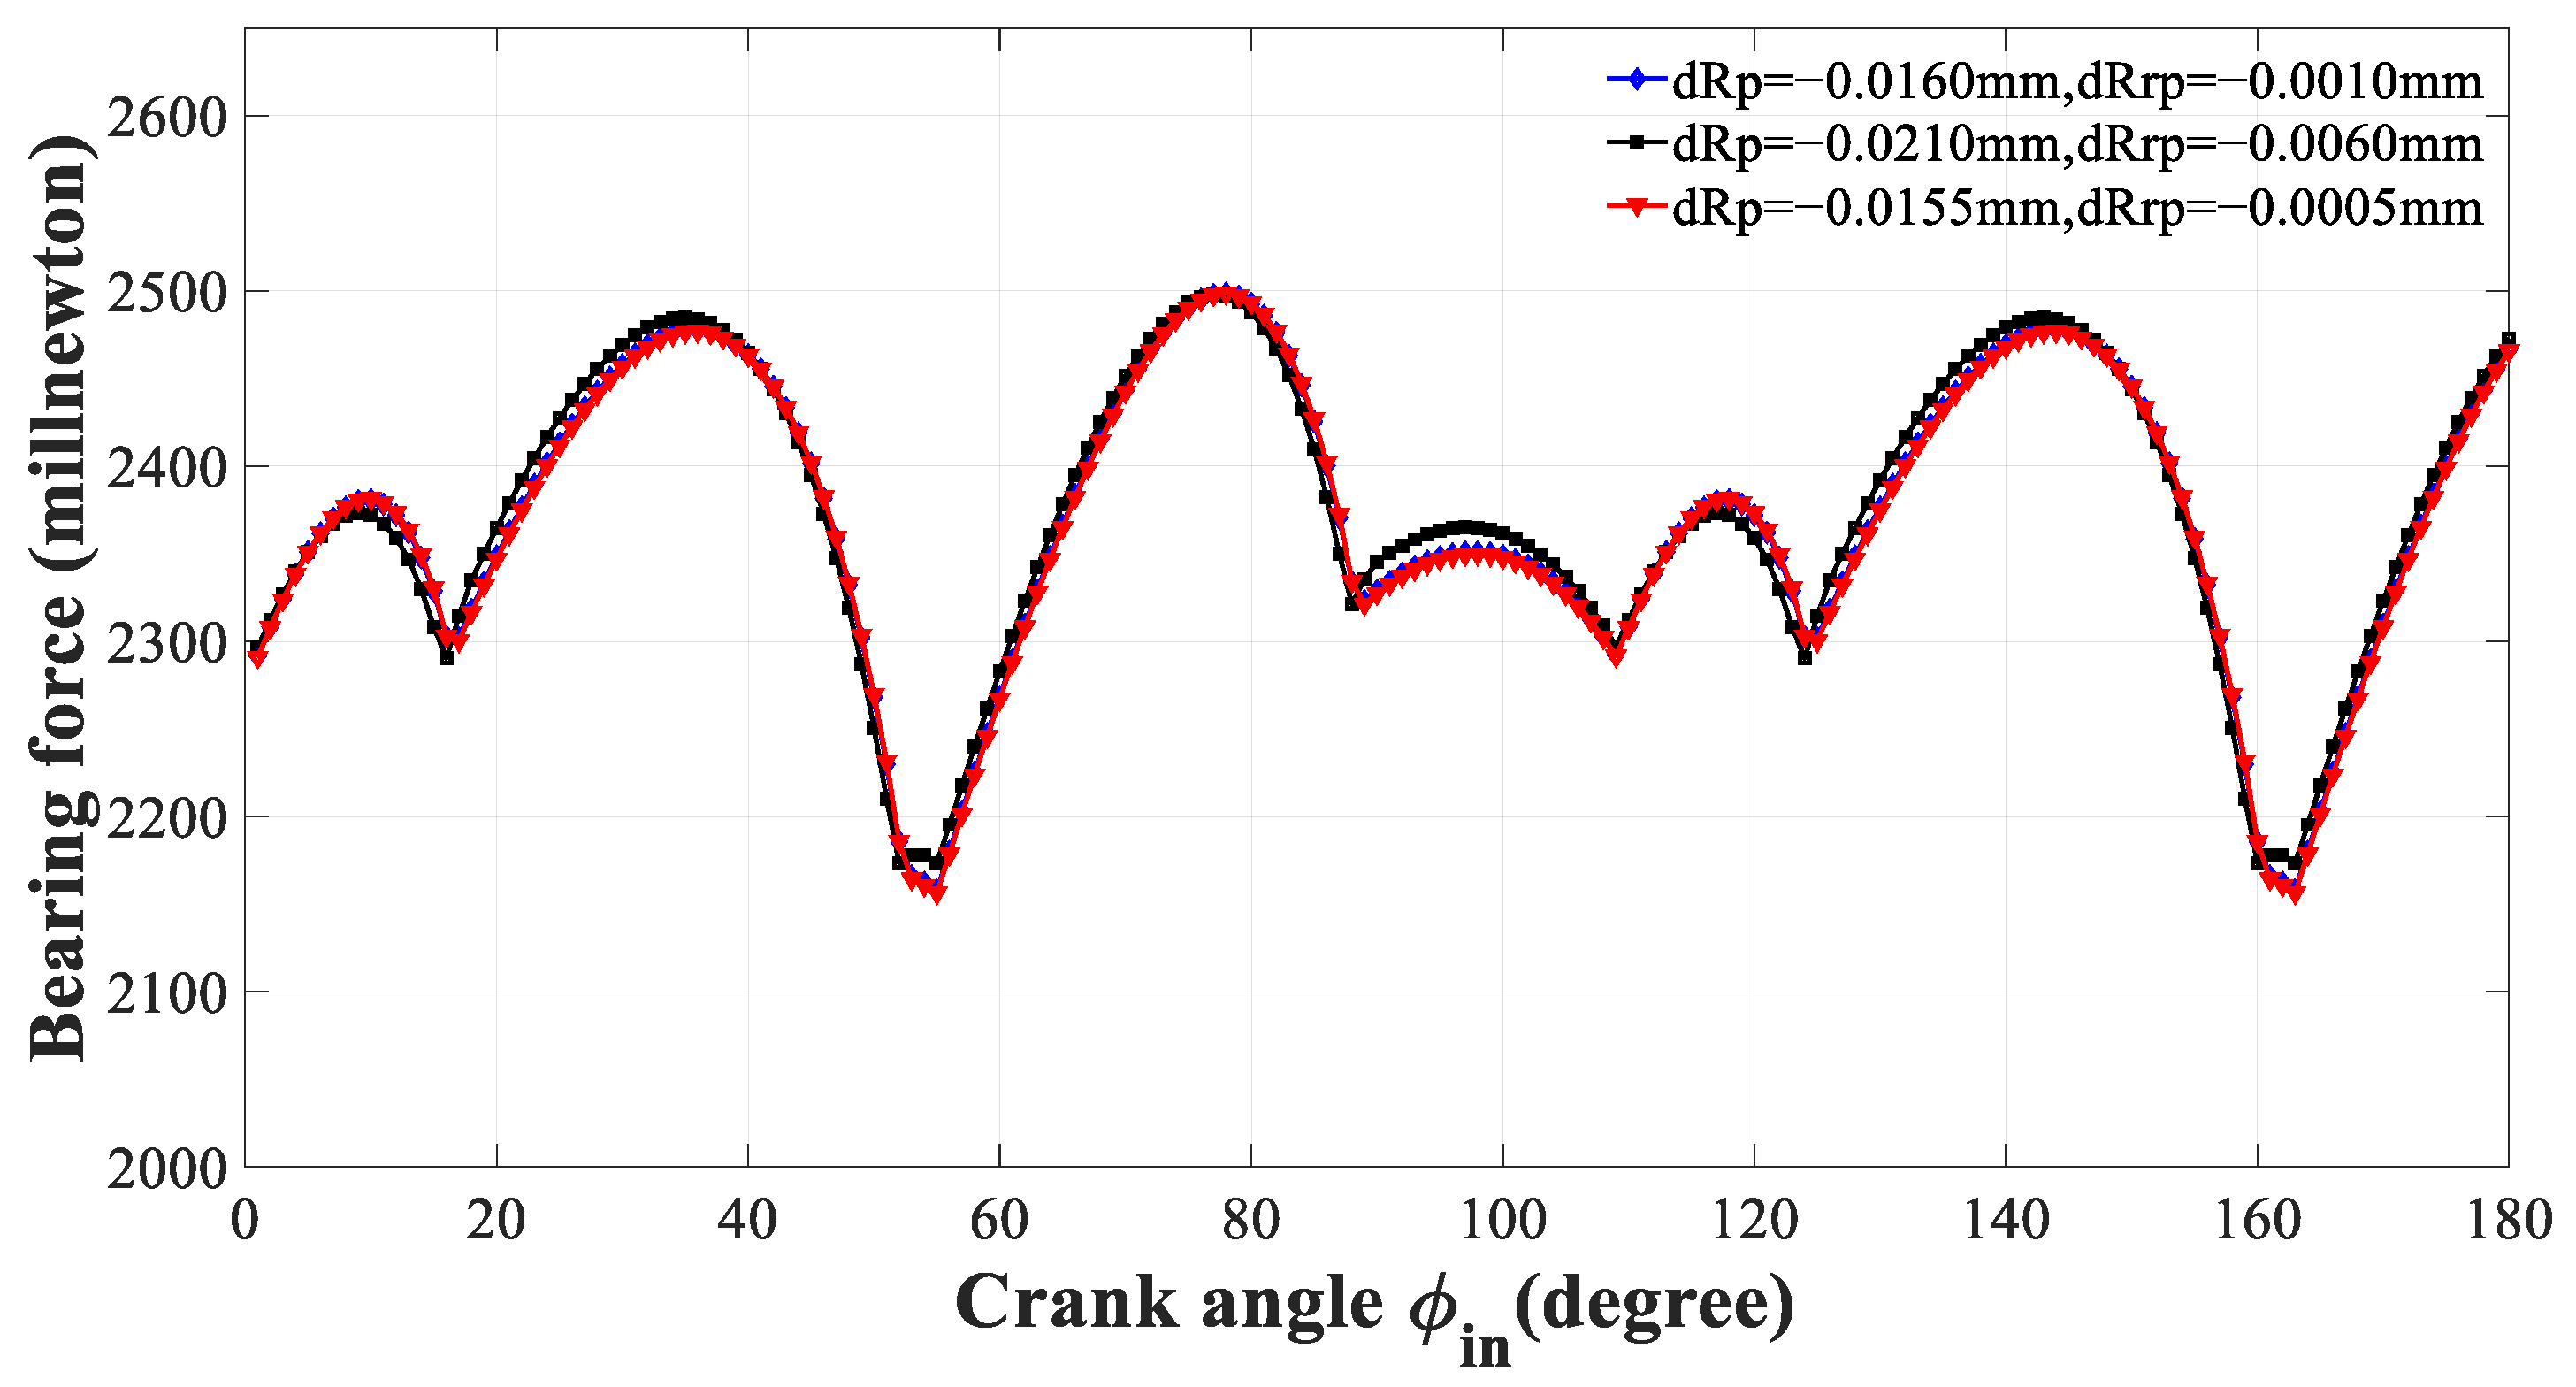
Figure 16, in terms of transmission ratio, the changing trends of the three curves are not significantly different. The transmission ratio basically fluctuates between 8.95 and 9.05 and shows periodic changes. The maximum bearing force can reach 2.5 N as expressed in
Figure 17, and the maximum bearing force on the blue curve is the smallest among these three curves. The trend of change in other aspects is basically consistent. The range of needle tooth force under different modification amounts is not significantly different. There is the needle tooth force between the 90th and 160th needle teeth, and the trend of change is that the needle tooth forces increase to the maximum value of the needle tooth force first and then decrease to 0 N as expressed in
Figure 18.
5. Conclusions
In this paper, the process of generating cycloidal tooth profiles is introduced, and the tooth surface contact analysis and load-bearing tooth surface contact analysis on cycloidal gear pairs are conducted. Finally, the objective function was minimized by optimizing the parameters. In the process of studying transmission performance, the most important thing is to find the optimal displacement tooth profile modification amount and equidistant tooth profile modification amount . The comparison chart of transmission performance under various modification quantities shows the trend of various performance changes with changes in some modification quantities. Through force analysis, the forces acting on the needle teeth and bearings under different modification conditions can be obtained. The optimization design of tooth profile modification and transmission ratio optimization fluctuation for cycloidal reducers directly affects the magnitude of output torque and output stability. Therefore, determining the appropriate displacement tooth profile modification amount and equidistant tooth profile modification amount to reduce transmission ratio fluctuation is crucial for the design of cycloidal reducers, which can provide certain guiding opinions for future industrial applications.
However, there are still many areas for further in-depth research on force analysis and tooth profile optimization improvement in cycloidal reducers. In the future research process, the authors will continue to conduct further research and analysis on force analysis and tooth profile optimization improvement in cycloidal reducers.


