Abstract
At present, catch statistics in the pelagic fishery industry rely mainly on manual counting methods. However, this method suffers from low statistical accuracy and insufficient timeliness. An automatic tuna counting approach based on ByteTrack and YOLOv7-Tuna is presented in this research. The method selects YOLOv7 as the base model, adopts DySnakeConv to obtain more temporal features, combines it with CoordConv to enhance the location-awareness ability of the model, and introduces DyHead to suppress the interference of complex backgrounds. The experimental results show that YOLOv7-Tuna outperforms YOLOv7 in terms of precision by 5.2%, recall by 3.1%, mAP@0.5 by 0.5%, and mAP@0.5:0.95 by 10%. Furthermore, the ByteTrack algorithm was employed to achieve real-time tracking of targets, with specific counting areas added. The results indicate that the counting error of this method decreased to 3.1%. It can effectively accomplish automatic counting tasks for tuna, providing a new solution for the automatic quantification of catch in the offshore fishing industry.
1. Introduction
The tuna fishing industry occupies an extremely important position in global offshore fisheries due to its high efficiency and productivity characteristics. With the establishment of regional fisheries management organizations and the decline of tuna resources, the exploitation of high seas fisheries resources is subject to increasingly stringent regulation and control [1]. Therefore, the orderly and efficient development of tuna fisheries resources has become a focal issue of concern for participants from various countries. Accurate capture data statistics aid fisheries managers in comprehensively understanding fishing activities, enabling the formulation of scientifically sound management measures, thus achieving sustainable development of the fisheries industry. However, human observers struggle to maintain the accuracy of statistical data during sustained, high-intensity work. Additionally, tuna longline fishing vessels typically operate continuously at sea for over a year, leading to significant deficiencies in the timeliness of fishing logs [2]. Therefore, to enhance the accuracy and timeliness of statistical data, this paper employs deep learning-based object detection techniques along with target tracking and counting methods to achieve real-time monitoring of fishing data.
In this paper, a target detection algorithm based on improved YOLOv7 is proposed. Firstly, to address the temporal characteristics of the dataset in this study, we introduce the temporal dynamic convolution DySnakeConv into the backbone network. This enables better extraction of temporal features from the data, thereby enhancing detection performance. Secondly, integrating CoordConv into the head network incorporates coordinate information into the convolutional neural network, enabling the network to better perceive the spatial information of the input data and enhancing the model’s generalization ability. Furthermore, to address the issue of complex backgrounds in tuna detection, the dynamic detection head, DyHead, is introduced, enabling the model to focus attention and suppress background interference. As a result, YOLOv7-Tuna achieves improved detection accuracy. Additionally, improvements were made to the ByteTrack algorithm by adding designated counting areas, which enhanced the accuracy of tuna counting.
The structure of this paper is as follows. Section 2 discusses the current research status of fish identification and target tracking counting. Section 3 provides a comprehensive introduction to the improved YOLOv7 algorithm and the enhanced ByteTrack algorithm. Section 4 describes the tuna dataset, experimental setup, and analysis of experimental results. Section 5 provides a summary of the research findings of this study.
2. Related Work
In recent years, the rapid development of deep learning technology has brought new opportunities for fish identification. Deep convolutional neural networks (CNNs) and other deep learning models have achieved breakthroughs in tasks such as image classification and object detection, providing powerful tools for fish identification. Researchers have proposed various CNN-based methods for fish identification. Iqbal et al. proposed a simplified deep neural network based on AlexNet for fish species identification, achieving an accuracy of 90.48% [3]. Cai et al. proposed replacing the backbone network of YOLOv3 with the lightweight ModelNetV1 to achieve fast detection of fish species [4]. Chen et al. proposed optimizing the VGG16 network model using transfer learning, achieving a final accuracy of 97.66% [5]. Li et al. compared the AlexNet [6], GoogLeNet [7], ResNet [8], and DenseNet [9] models to explore the optimal network architecture. Ultimately, they found that DenseNet performed the best for fish species identification tasks, achieving accuracy and recall rates of 99.21% and 96.77%, respectively [10]. Muksi et al. proposed two underwater fish identification models, YOLO-Fish-1 and YOLO-Fish-2. YOLO-Fish-1 enhances YOLOv3 by fixing the upsampling stride issue, while YOLO-Fish-2 further improves the model by incorporating spatial pyramid pooling into the first model. The final average precisions of YOLO-Fish-1 and YOLO-Fish-2 in fish detection tasks are 76.56% and 75.70%, respectively, markedly superior to the unimproved YOLOv3 [11]. Ayuningtias et al. proposed the use of YOLOv5 for the identification of yellowfin tuna, mackerel tuna, and skipjack tuna. The recognition achieved accuracy, precision, and recall rates of 98.1%, 93.9%, and 96%, respectively [12]. These studies collectively demonstrate the excellent capabilities of convolutional neural networks in fish identification tasks. However, the aforementioned methods exhibit insufficient generalization ability when dealing with complex background environments, necessitating further enhancement in the discriminative power between foreground and background.
Building upon fish identification research, some scholars have further pursued studies focused on fish object tracking and counting, offering methods for automated fish data collection. Albuquerque et al. proposed a fish counting method that combines spot detection with Gaussian mixture, incorporating a counting line design. Fish are counted when they linger for a certain duration along the counting line, and Kalman filtering is employed to mitigate duplicate counting [13]. Tseng et al. utilized Mask R-CNN for fish detection and subsequently employed time and distance threshold methods to determine the quantity of fish [14]. Yu et al. proposed a deep learning network model based on multiple modules and attention mechanisms. The model comprises feature extraction, attention, and density map estimation modules, achieving counting of cultured fish species [15]. Kibet et al. utilized the YOLOv3 and DeepSort algorithms to track abalone in a conveyor belt system, achieving automated abalone counting. The highest accuracy achieved in the test videos was 94.4% [16]. Zhang et al. proposed a fish automatic counting method based on a hybrid neural network model, utilizing the Multi-column Convolutional Neural Network (MCNN) as the frontend and the Dilated Convolutional Neural Network (DCNN) as the backend [17]. Qian et al. proposed using the YOLOv5 algorithm to detect zebrafish and employed the ByteTrack algorithm to associate high-score and low-score bounding boxes separately to address tracking errors caused by occlusion [18]. While the above methods have achieved automatic counting of fish, they are prone to target loss when encountering occlusion and irregular motion of the targets, leading to counting deviations. Liu et al. proposed an online multi-fish tracking model called FishTrack, which utilizes a pyramid vision transformer as the backbone network to extract multi-level features. They designed an encoder to encode the historical information of fish positions and employed an autoregressive approach to automatically update spatiotemporal information. Finally, parallel dual decoders were used to decode the motion and appearance features of fish. Finally, on the multi-fish tracking dataset, the HOTA reached 71.4%, and the MOTA reached 94.8%, addressing the issue of tracking accuracy decline caused by foam occlusion and fish deformation [19]. However, due to its high computational load, it is not suitable for use on mobile devices. Therefore, further research is needed to develop methods that are suitable for mobile devices and capable of recognizing and automatically counting multiple fish species.
3. Research Methods
3.1. The Network Structure of YOLOv7-Tuna
YOLOv7-Tuna is an enhanced network based on YOLOv7 [20], as illustrated in Figure 1, consisting of a backbone network and a head. During data input, the model performs Mosaic data augmentation [21] and adaptively adjusts the images to 3 channels, with a size of 640 × 640 feature maps. The backbone network is responsible for feature extraction of tuna. The head network utilizes three layers of feature maps of different sizes output from the backbone network. These feature maps are fused to produce three detection layers, each tailored to detect small, medium, and large objects, respectively, in descending order of scale. The final output includes confidence scores for the tuna class and the positions of anchor boxes.
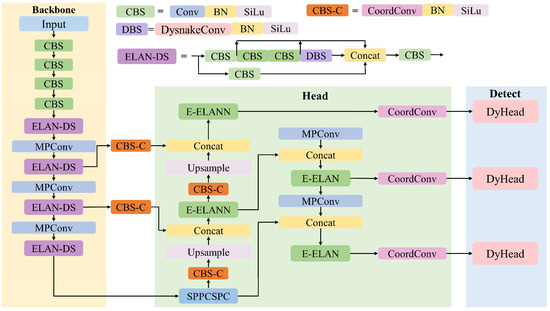
Figure 1.
Architecture of YOLOv7-Tuna network.
3.1.1. ELAN-DS Module
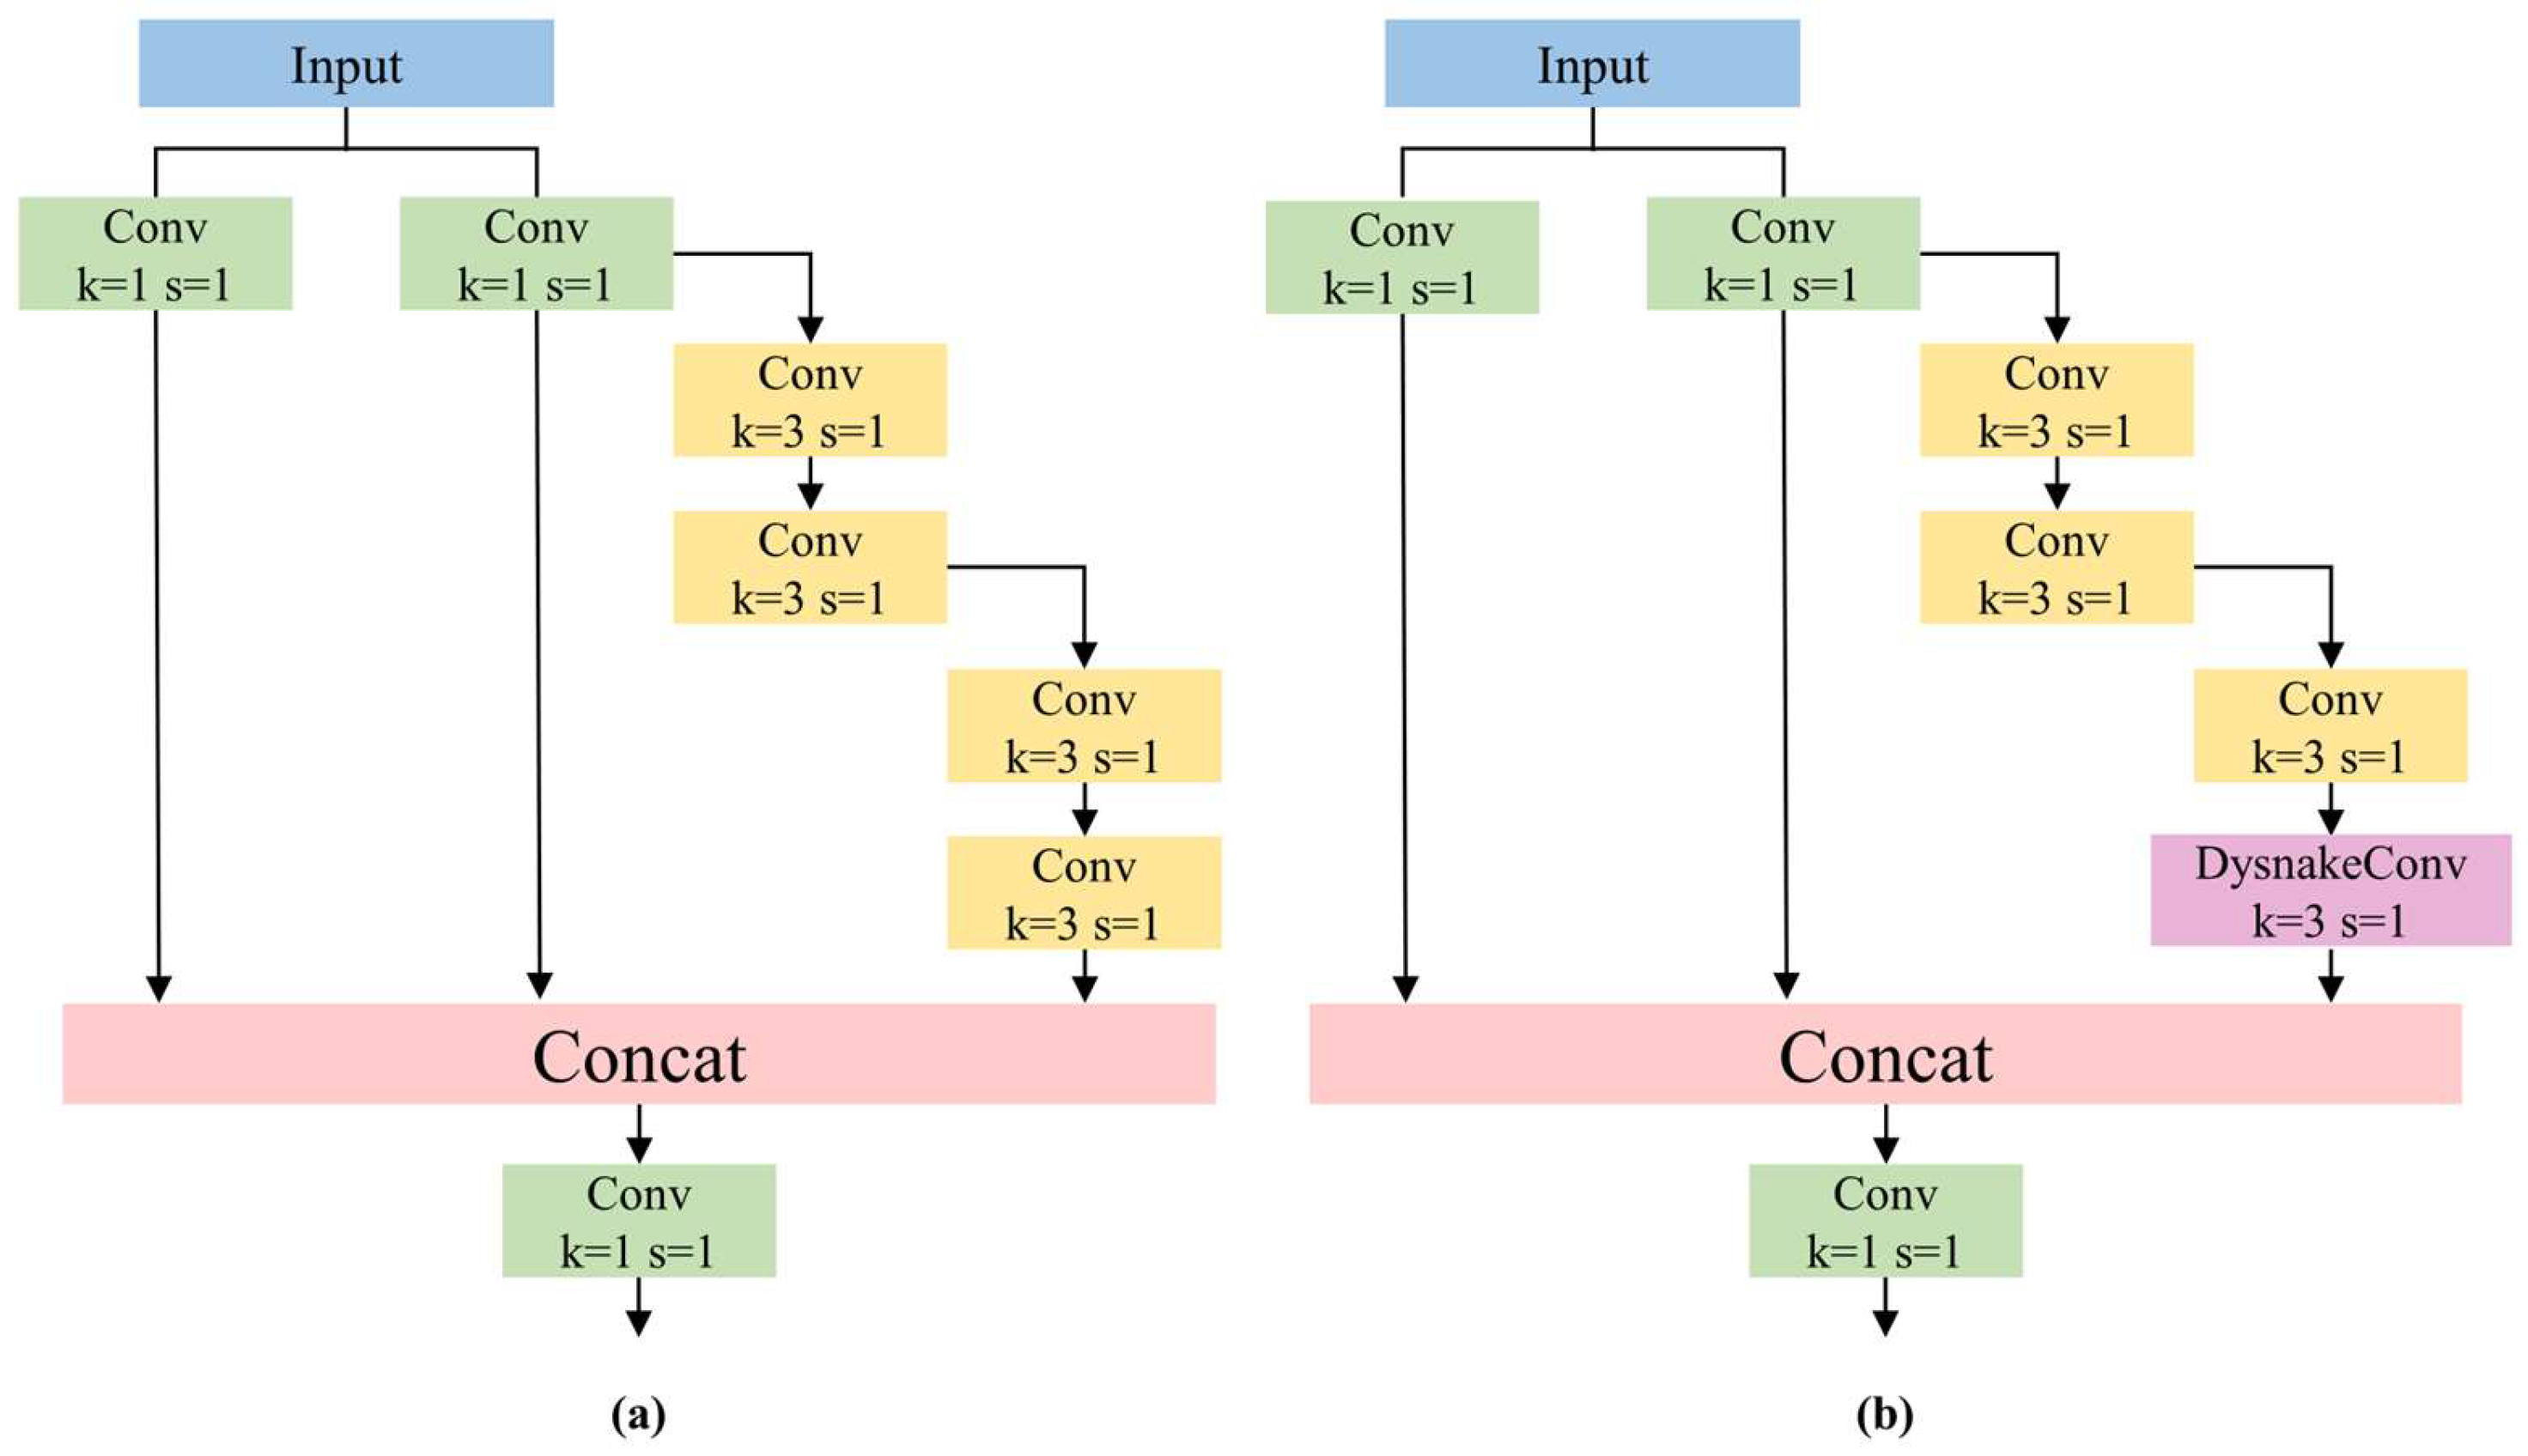
DySnakeConv (Dynamic Snake Convolution) is designed to process data with periodic and temporal characteristics [22]. DySnakeConv employs dynamic, deformable convolution kernels to learn feature representations of input data, enabling the network to better capture temporal information present in the input data and adapt to variations in features across different time points or periods. This facilitates more effective feature extraction of targets. Since the tuna dataset in this study is obtained by extracting frames from monitoring videos of tuna fishing, it possesses evident temporal characteristics. Therefore, DySnakeConv is suitable for the dataset under investigation in this paper. Within the backbone network, the incorporation of DySnakeConv is achieved by embedding it within the Efficient Layer Aggregation Network (ELAN), resulting in the ELAN-DS module.
As depicted in Figure 2, ELAN-DS replaces the final 3 × 3 convolution layer in ELAN with DySnakeConv, maintaining the same kernel size. Due to the deformable nature of DySnakeConv, which adjusts based on the shape and boundary information of the target, our proposed ELAN-DS can better adapt to the varying shapes of tuna during the fishing process.

Figure 2.
(a) ELAN module. (b) ELAN-DS module.
3.1.2. CBS-C Module
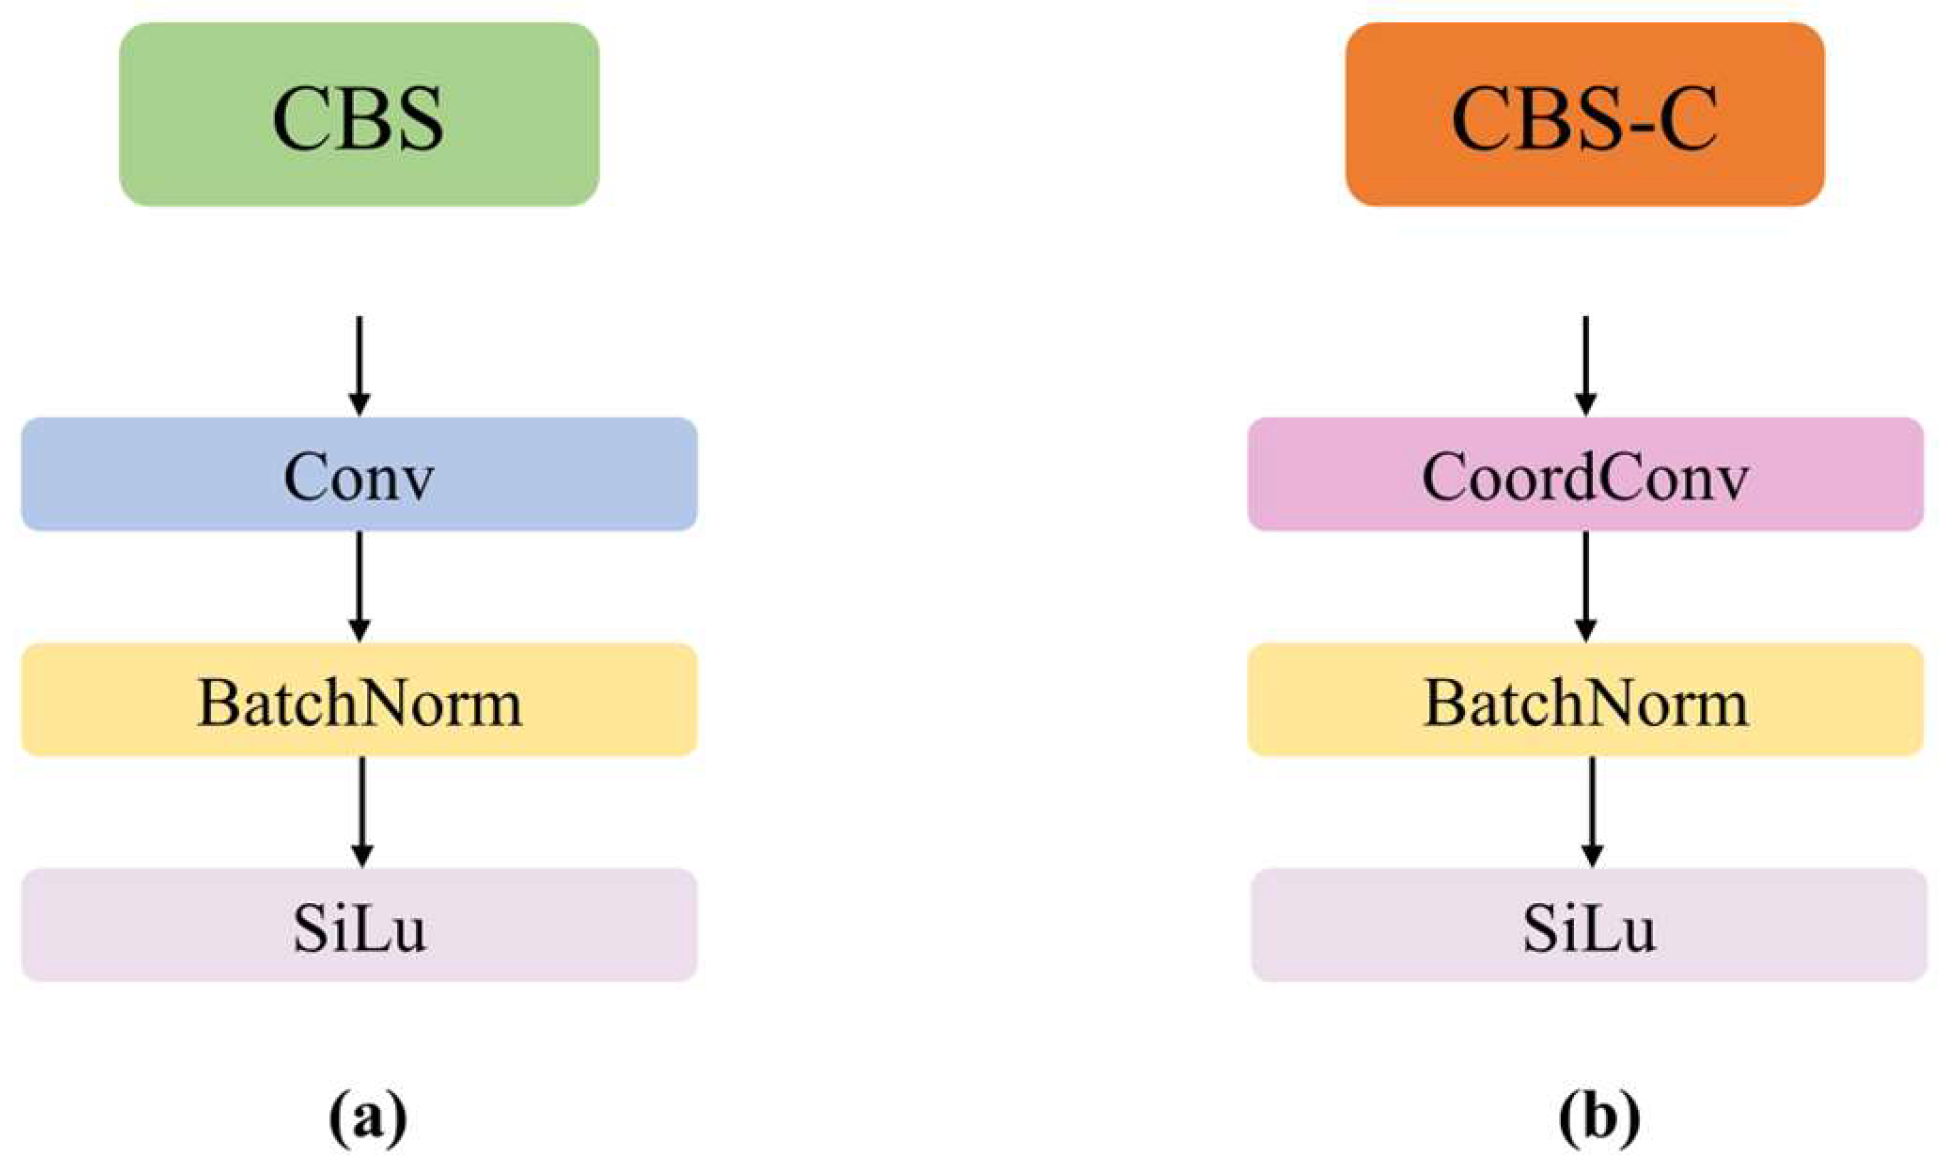
To enhance the detection accuracy of the model, the CoordConv [23] is introduced into the head network. Firstly, the 1 × 1 convolution within the CBS module is replaced with CoordConv to implement the CBS-C module, as illustrated in Figure 3. Secondly, the RepConv [24] in the three target detection heads is replaced with CoordConv to enhance the spatial positional awareness of the target detection heads.

Figure 3.
(a) CBS module. (b) CBS-C module.
The structure of CoordConv is depicted in Figure 4. Figure 4a illustrates traditional convolution, where H, W, and C denote the height, width, and channels of the traditional convolution, respectively, which are mapped to H′, W′, and C′. Figure 4b represents CoordConv, which achieves mapping by incorporating additional channels containing coordinate information. One channel is used to represent the i coordinate, and another channel is used to represent the j coordinate. Concretely, the i-coordinate channel is an rank-1 matrix with its first row filled with 0’s, its second row with 1’s, its third with 2’s, etc. The j-coordinate channel is similar, but with columns filled in with constant values instead of rows. Additionally, a linear transformation is applied to the i and j coordinates, normalizing them within the range of [−1, 1]. For two-dimensional convolution, the two coordinates (i, j) can represent any input pixel.
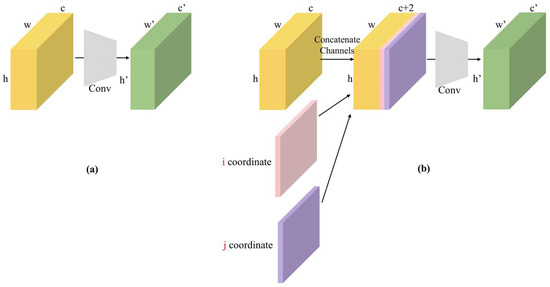
Figure 4.
(a) Convolutional layer. (b) CoordConv layer. The red part of the figure indicates i, j coordinates.
The introduction of coordinate information into the input feature map implies that each pixel contains its coordinates relative to the center of the image. By introducing coordinate information, CoordConv can provide the network with additional spatial positional information, thereby enhancing the network’s spatial structural awareness. Traditional convolutional layers treat features at different positions equally, whereas CoordConv adjusts the weights of the convolutional kernels based on the coordinates of the pixels. This enhances the network’s ability to perceive positional information, aiding in learning more generalizable feature representations. Therefore, our proposed CBS-C module enhances the network’s spatial awareness and ability to handle positional information, resulting in improved accuracy in predicting target positions and shapes, as well as enhancing the network’s ability to learn generalized features.
3.1.3. Detection Head
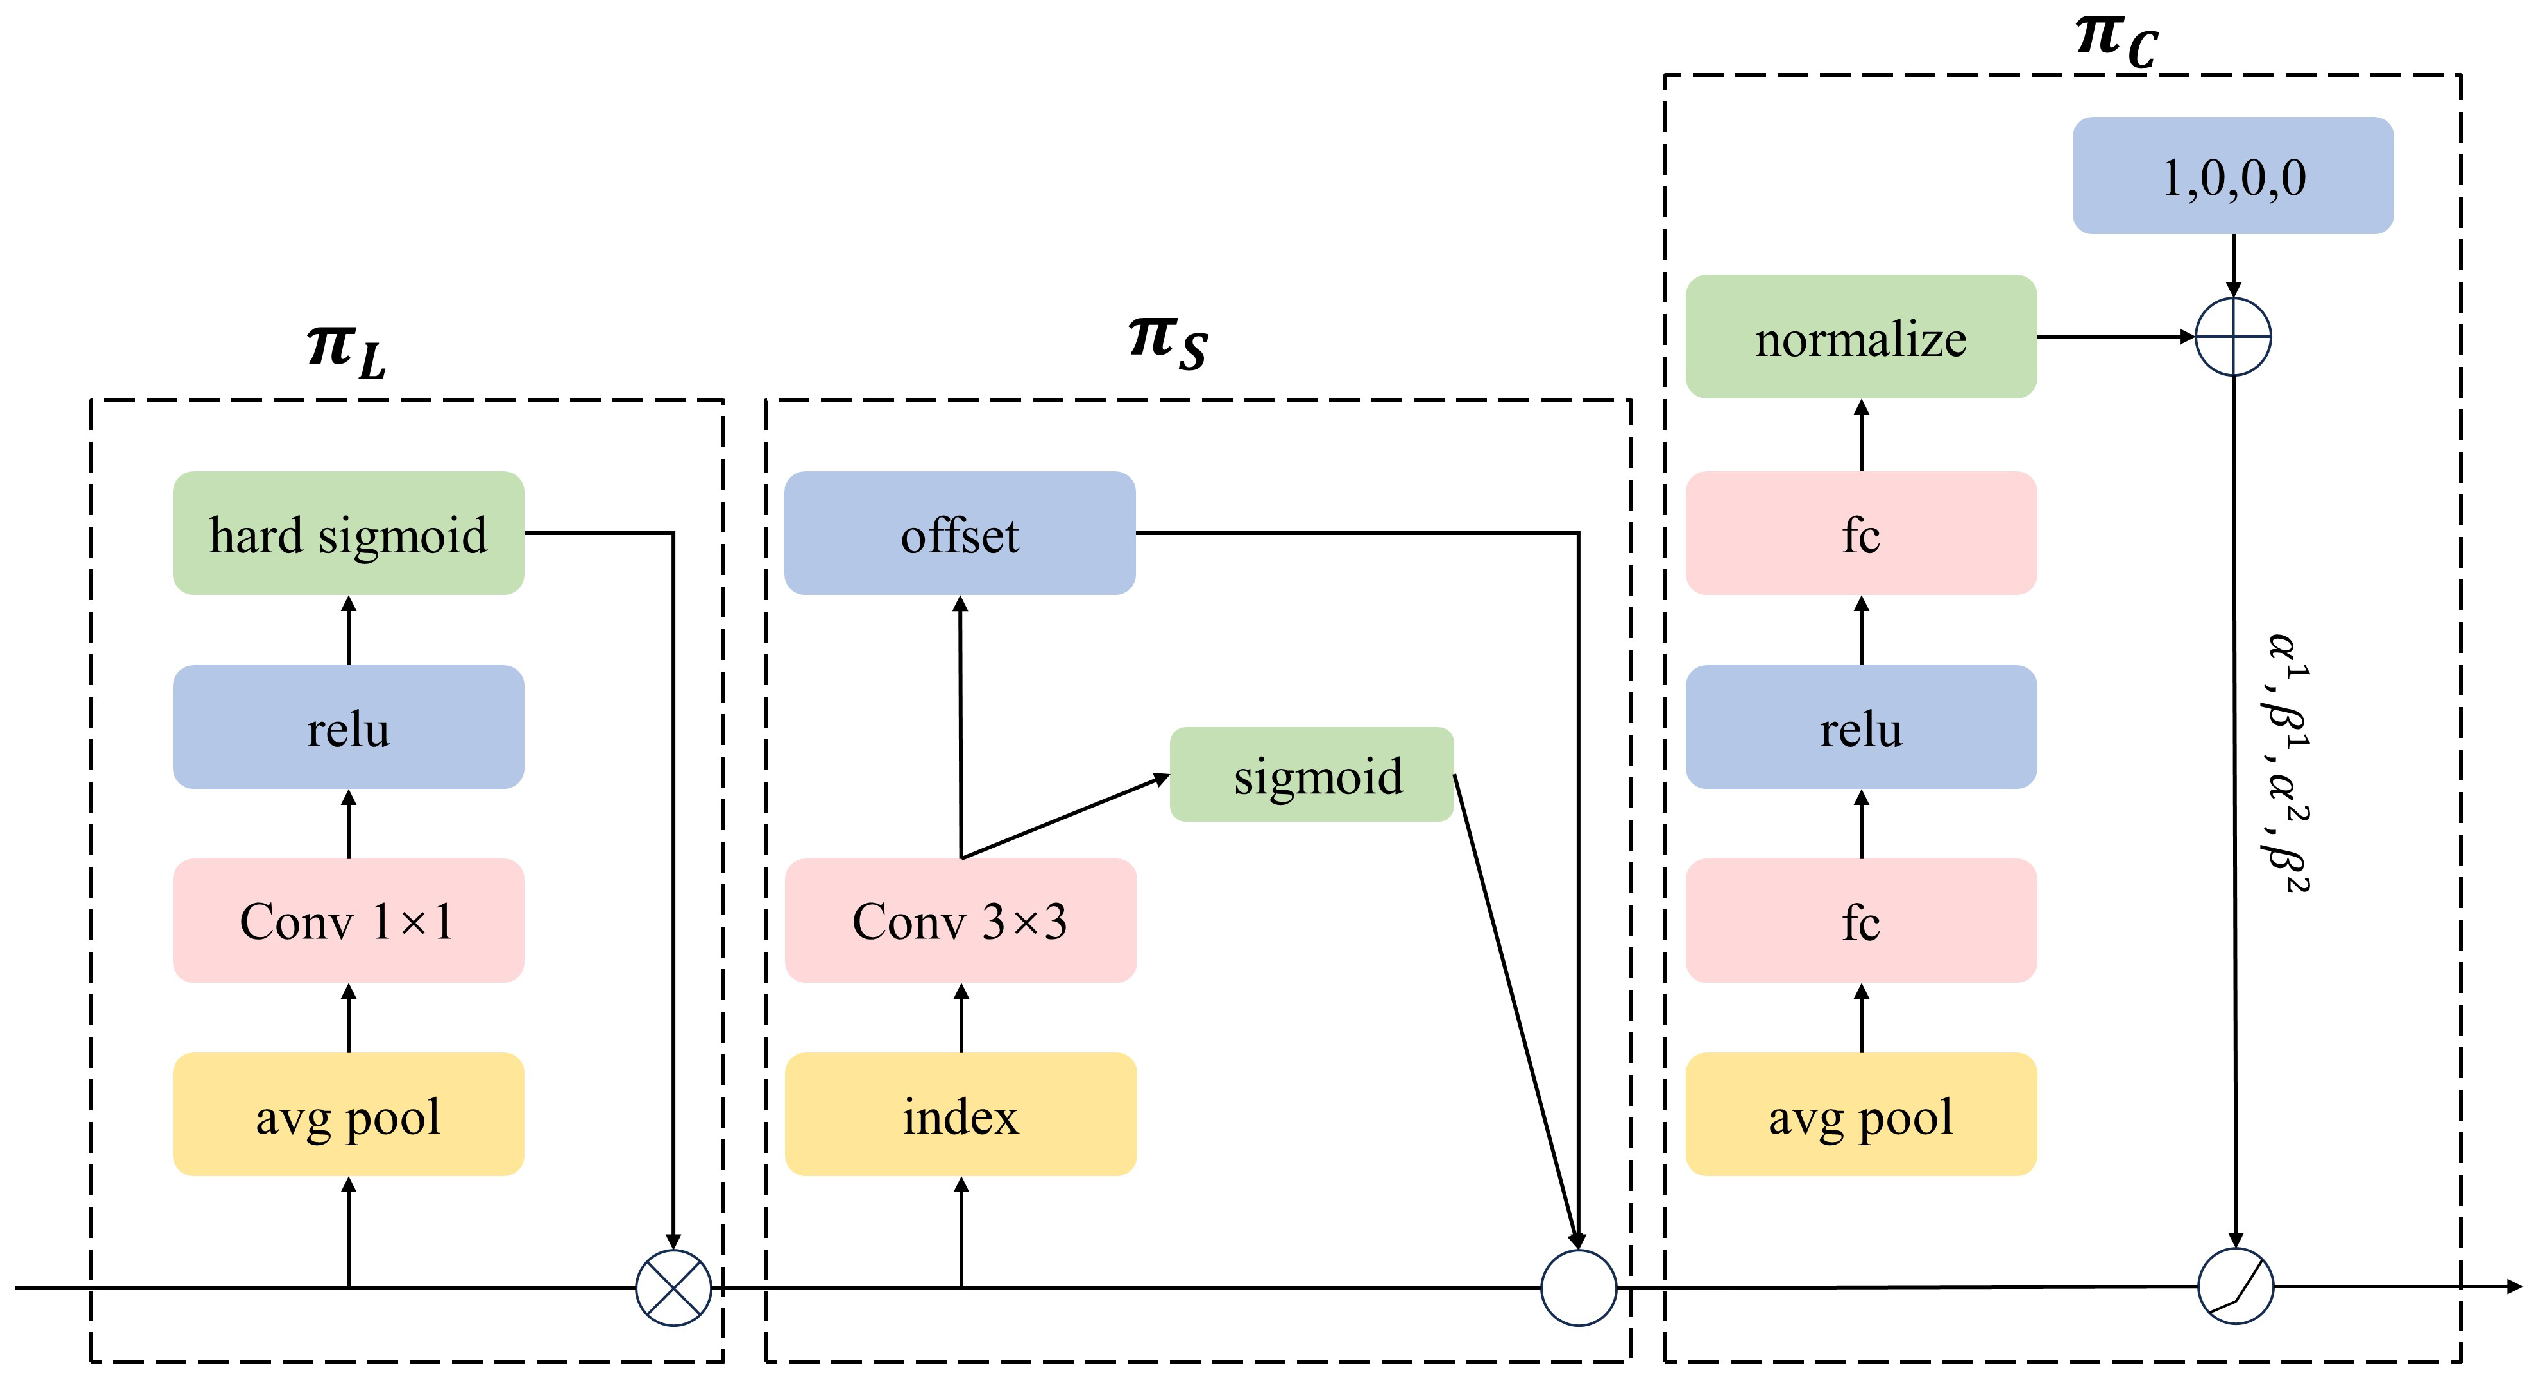
Addressing the complexity of background in the tuna dataset used in this study, and aiming to further enhance the detection performance of YOLOv7-Tuna in complex background scenarios, this paper introduces the dynamic detection head DyHead (Dynamic Head) into the target detection head [25]. DyHead unifies scale-aware attention, spatial-aware attention, and task-aware attention through attention mechanisms. This aids the model in focusing attention on regions of interest, suppressing attention on the background.
In the detection layer, given a three-dimensional feature tensor, the formula is shown in Equation (1):
where F represents an input 3D tensor L × S × C. , and respectively denote the scale-aware attention module, spatial-aware attention module, and task-aware attention module. The structure of DyHead is illustrated in Figure 5.
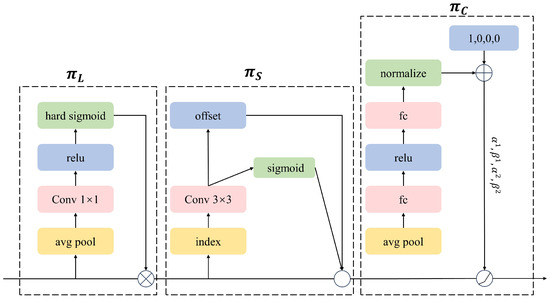
Figure 5.
DyHead Structure.
3.2. Tuna Target Tracking Counting Based on ByteTrack Algorithm
3.2.1. ByteTrack Algorithm
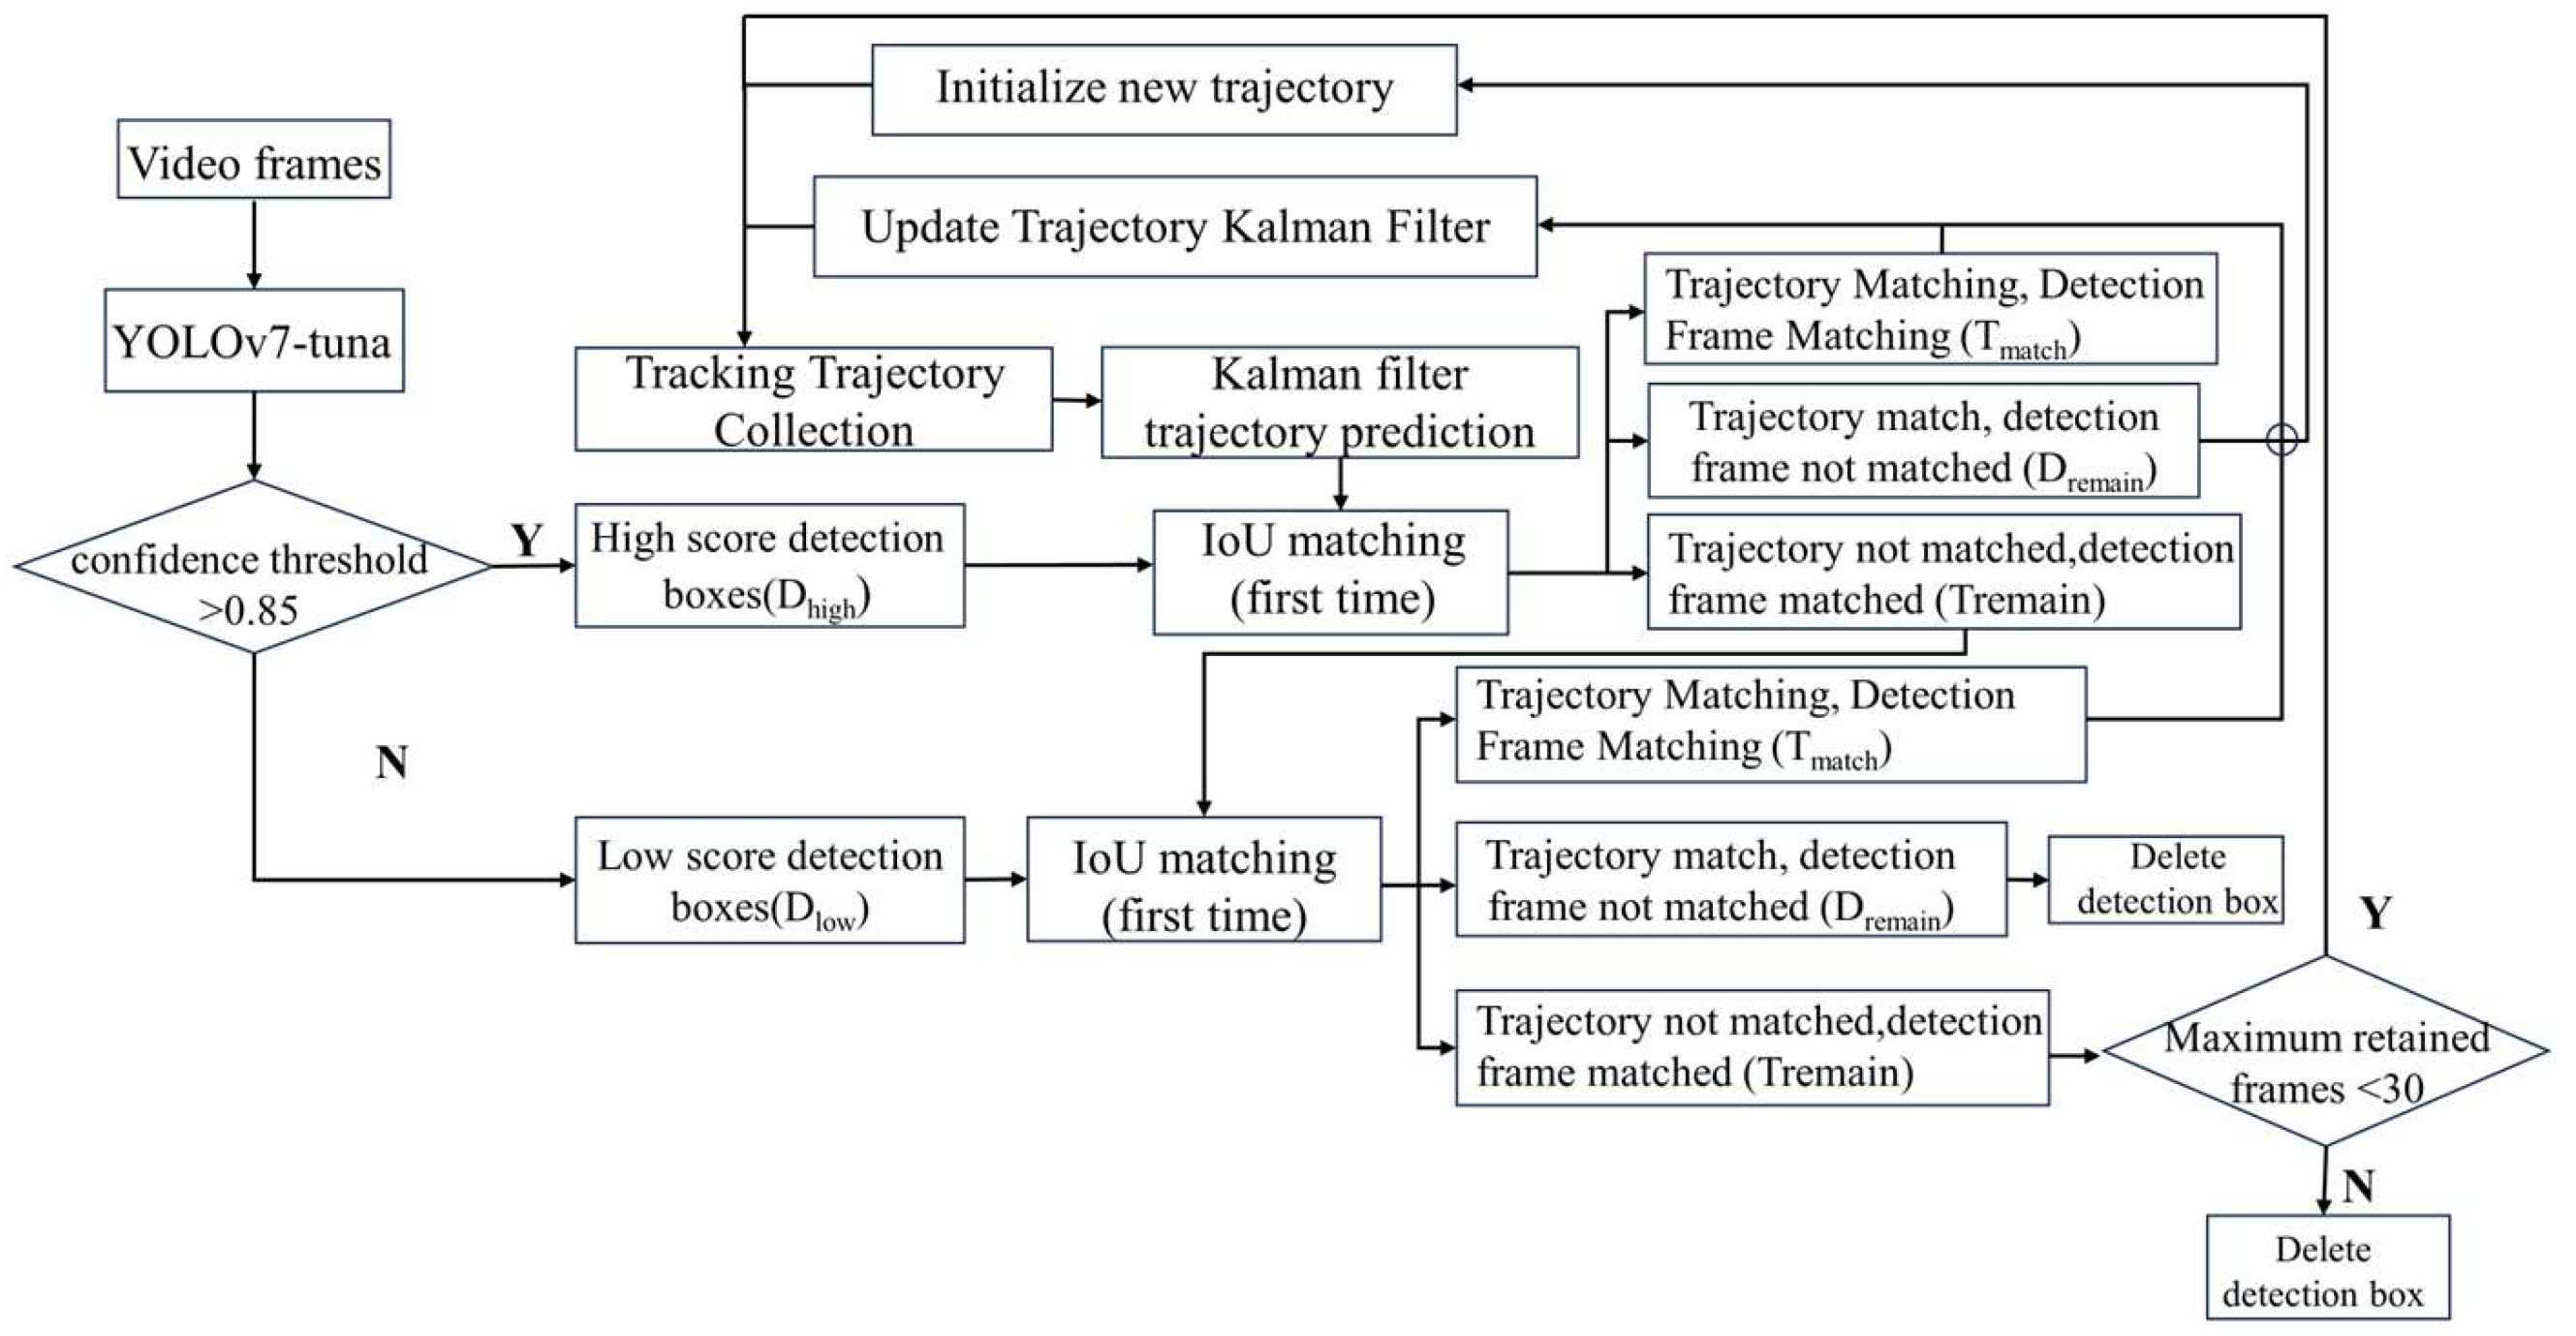
The ByteTrack [26] multi-object tracking algorithm utilizes Kalman filtering to predict the trajectories from the current frame to the next frame. It then uses the intersection over union (IoU) between the predicted bounding boxes and the detected bounding boxes as the similarity measure for a two-step matching process. The matching is performed using the Hungarian algorithm. The detailed workflow of the ByteTrack multi-object tracking algorithm is illustrated in Figure 6. First, based on the detection results, all detected bounding boxes are divided into high-score detection boxes (D_high) and low-score detection boxes (D_low). In the first matching step, the high-score detection boxes are matched with the previous tracking trajectories. During the second tracking process, the low-score detection boxes are matched with the remaining unmatched tracking trajectories (T_remain). Tracking trajectories that remain unmatched after both steps are retained for 30 frames. Finally, new tracking trajectories are created for the high-score detection boxes (D_remain) that do not match any existing trajectories.
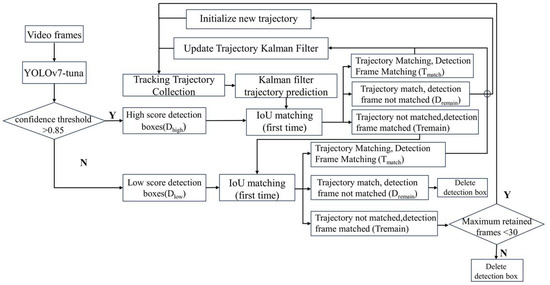
Figure 6.
Flowchart of ByteTrack algorithm.
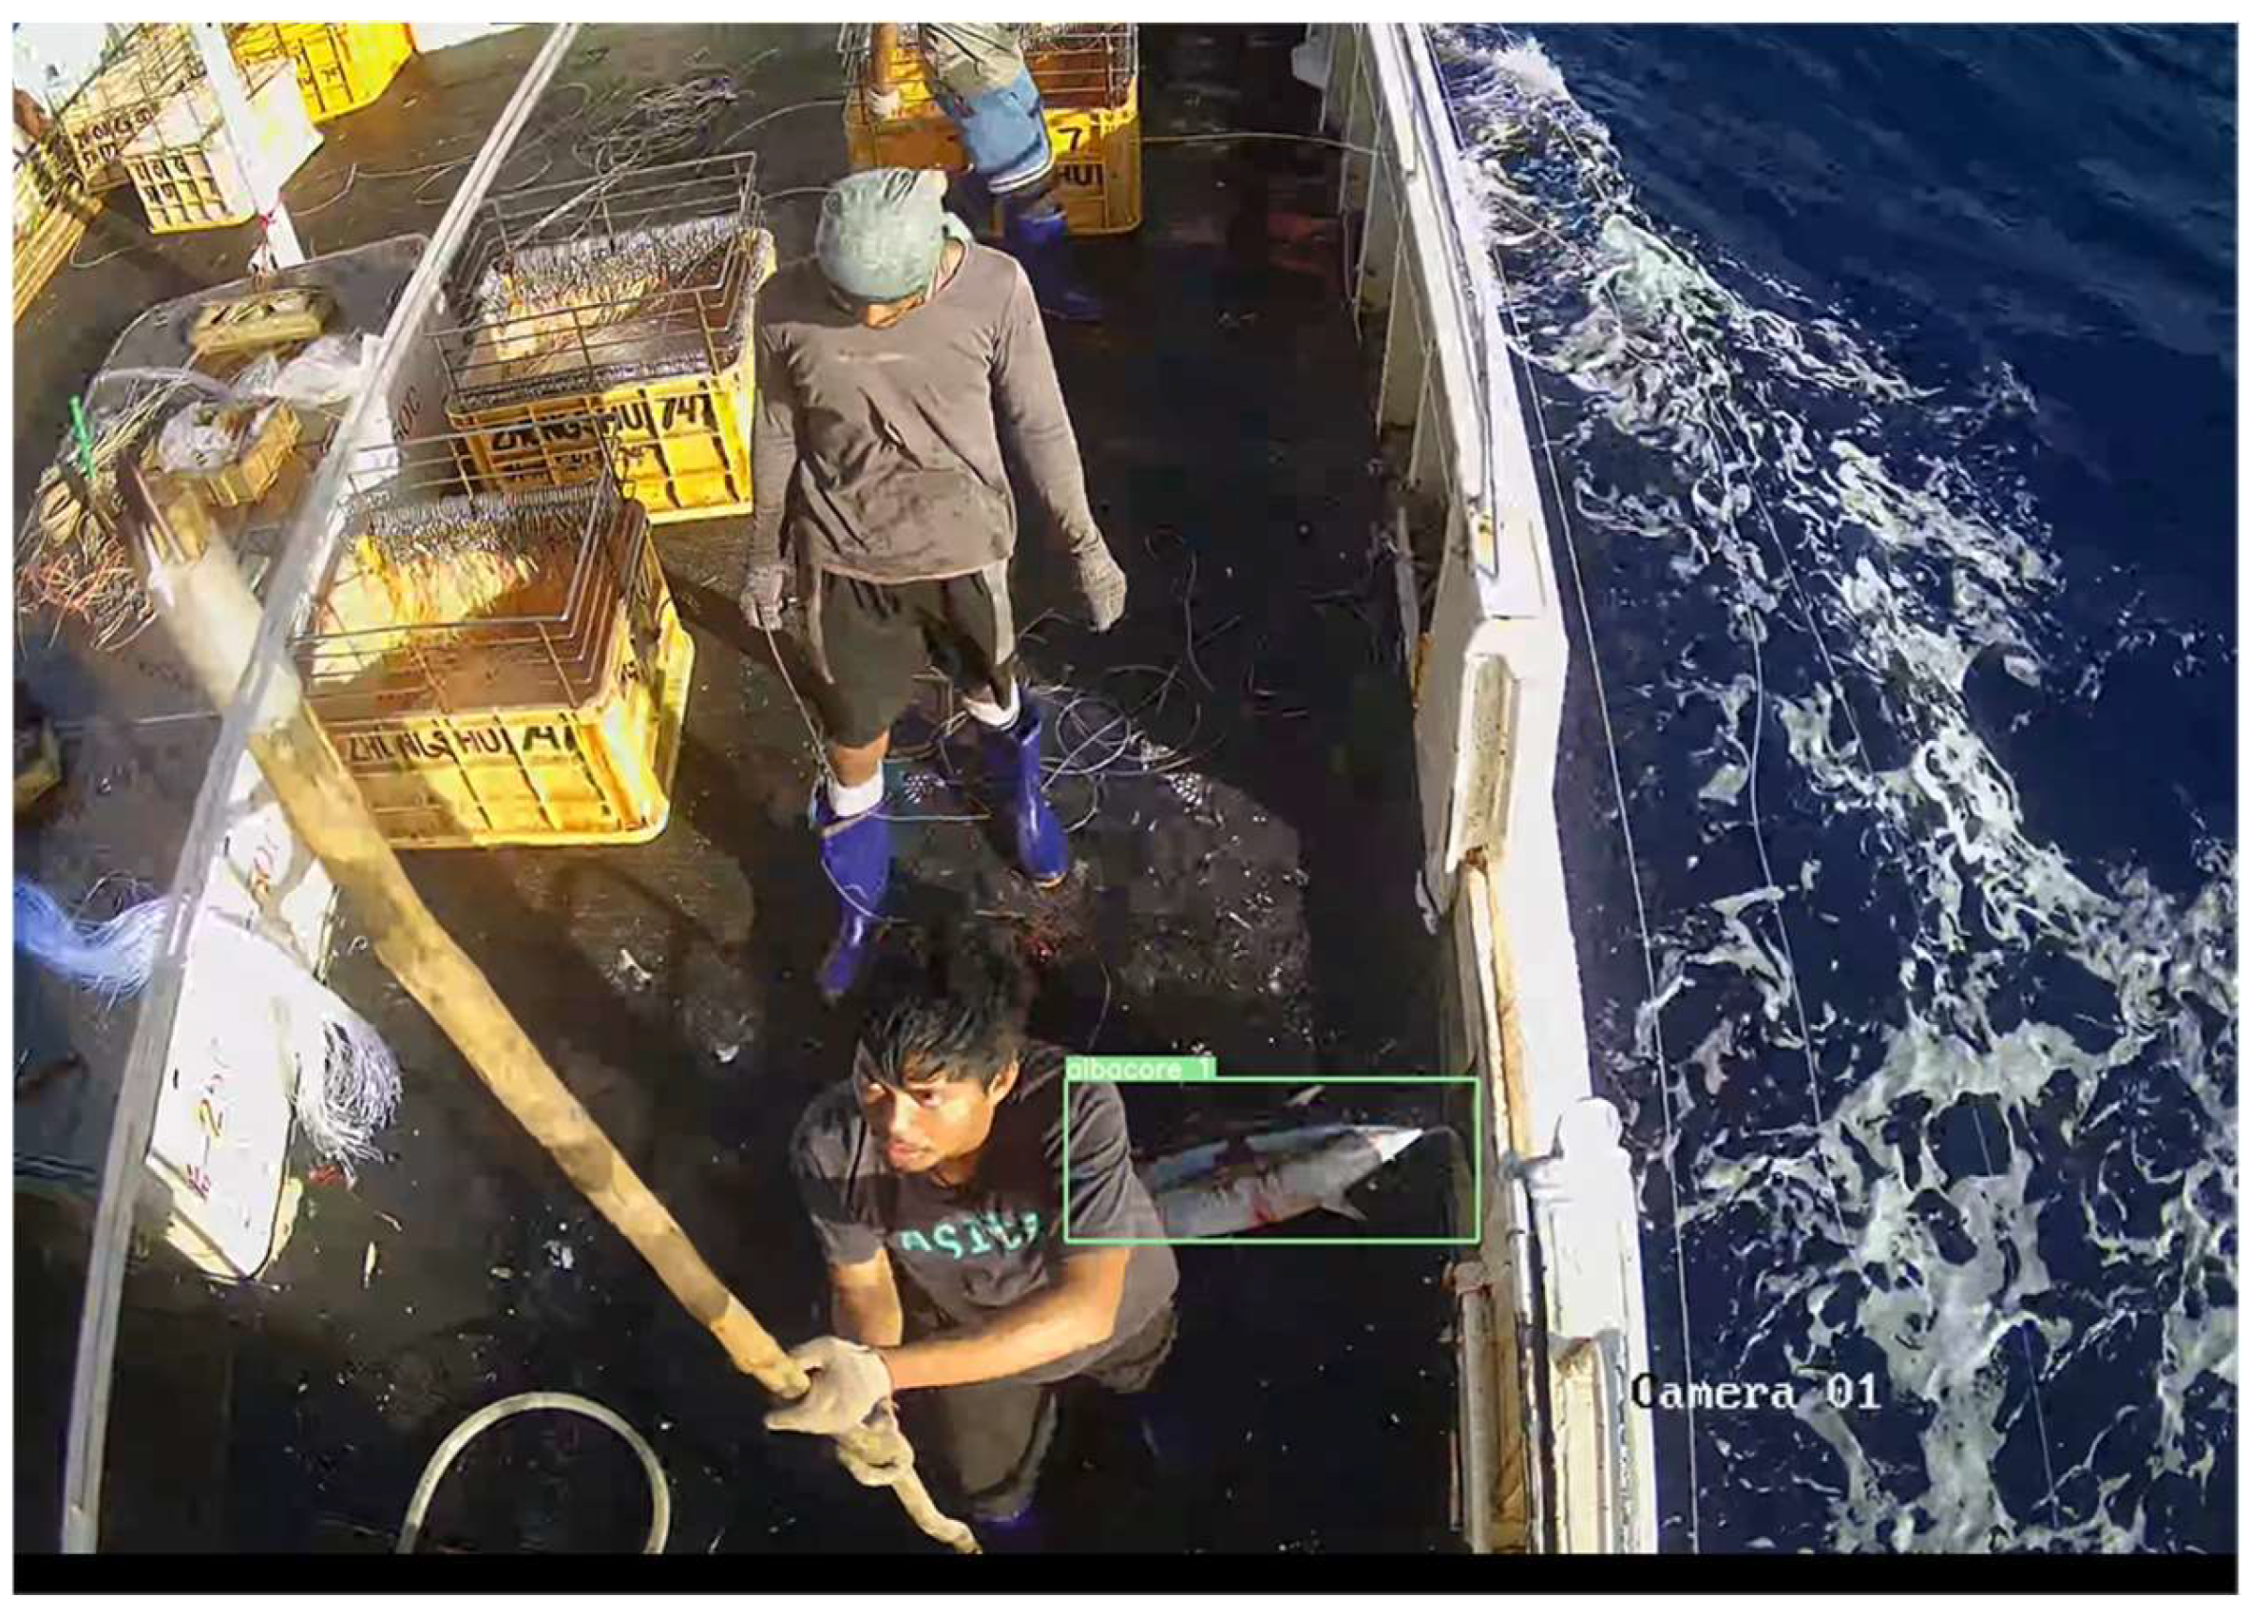
During tuna longline fishing, branch lines with hooks need to be detached from the main line. When a tuna is caught on a branch line hook, workers hang the branch line on the rail next to the water gate. Subsequently, each tuna is individually hooked and brought onto the deck through the water gate using hooks. When the tuna is hauled from the water surface onto the deck, an ID is assigned to the detected tuna. A number in the upper-left corner of each bounding box is used to identify the unique target ID. In subsequent frames, if the ID does not switch, the tracking is considered effective until the tuna disappears from the field of view. The results of target tracking are shown in Figure 7, where the upper-left corner of the tuna detection box displays the species and count of the tuna.
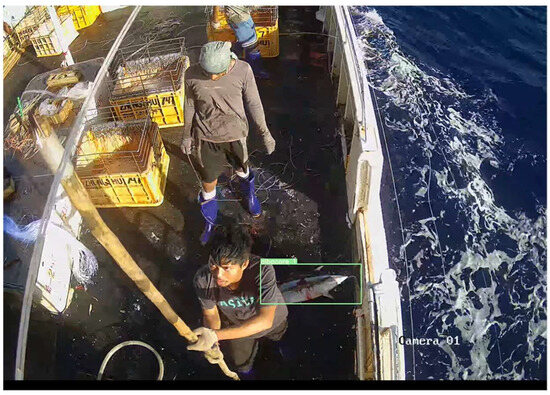
Figure 7.
Example of target tracking results. The green box is the current target detection box, type albacore and number 1.
3.2.2. Area-Specific Tracking Counting Method
When using ByteTrack for tuna target tracking, the final count is affected by overestimation due to occlusion by crew movements and the back-and-forth jumping of tuna on the deck. Therefore, all tuna IDs generated by the ByteTrack algorithm are not directly used as the statistical value for the total count of tuna.
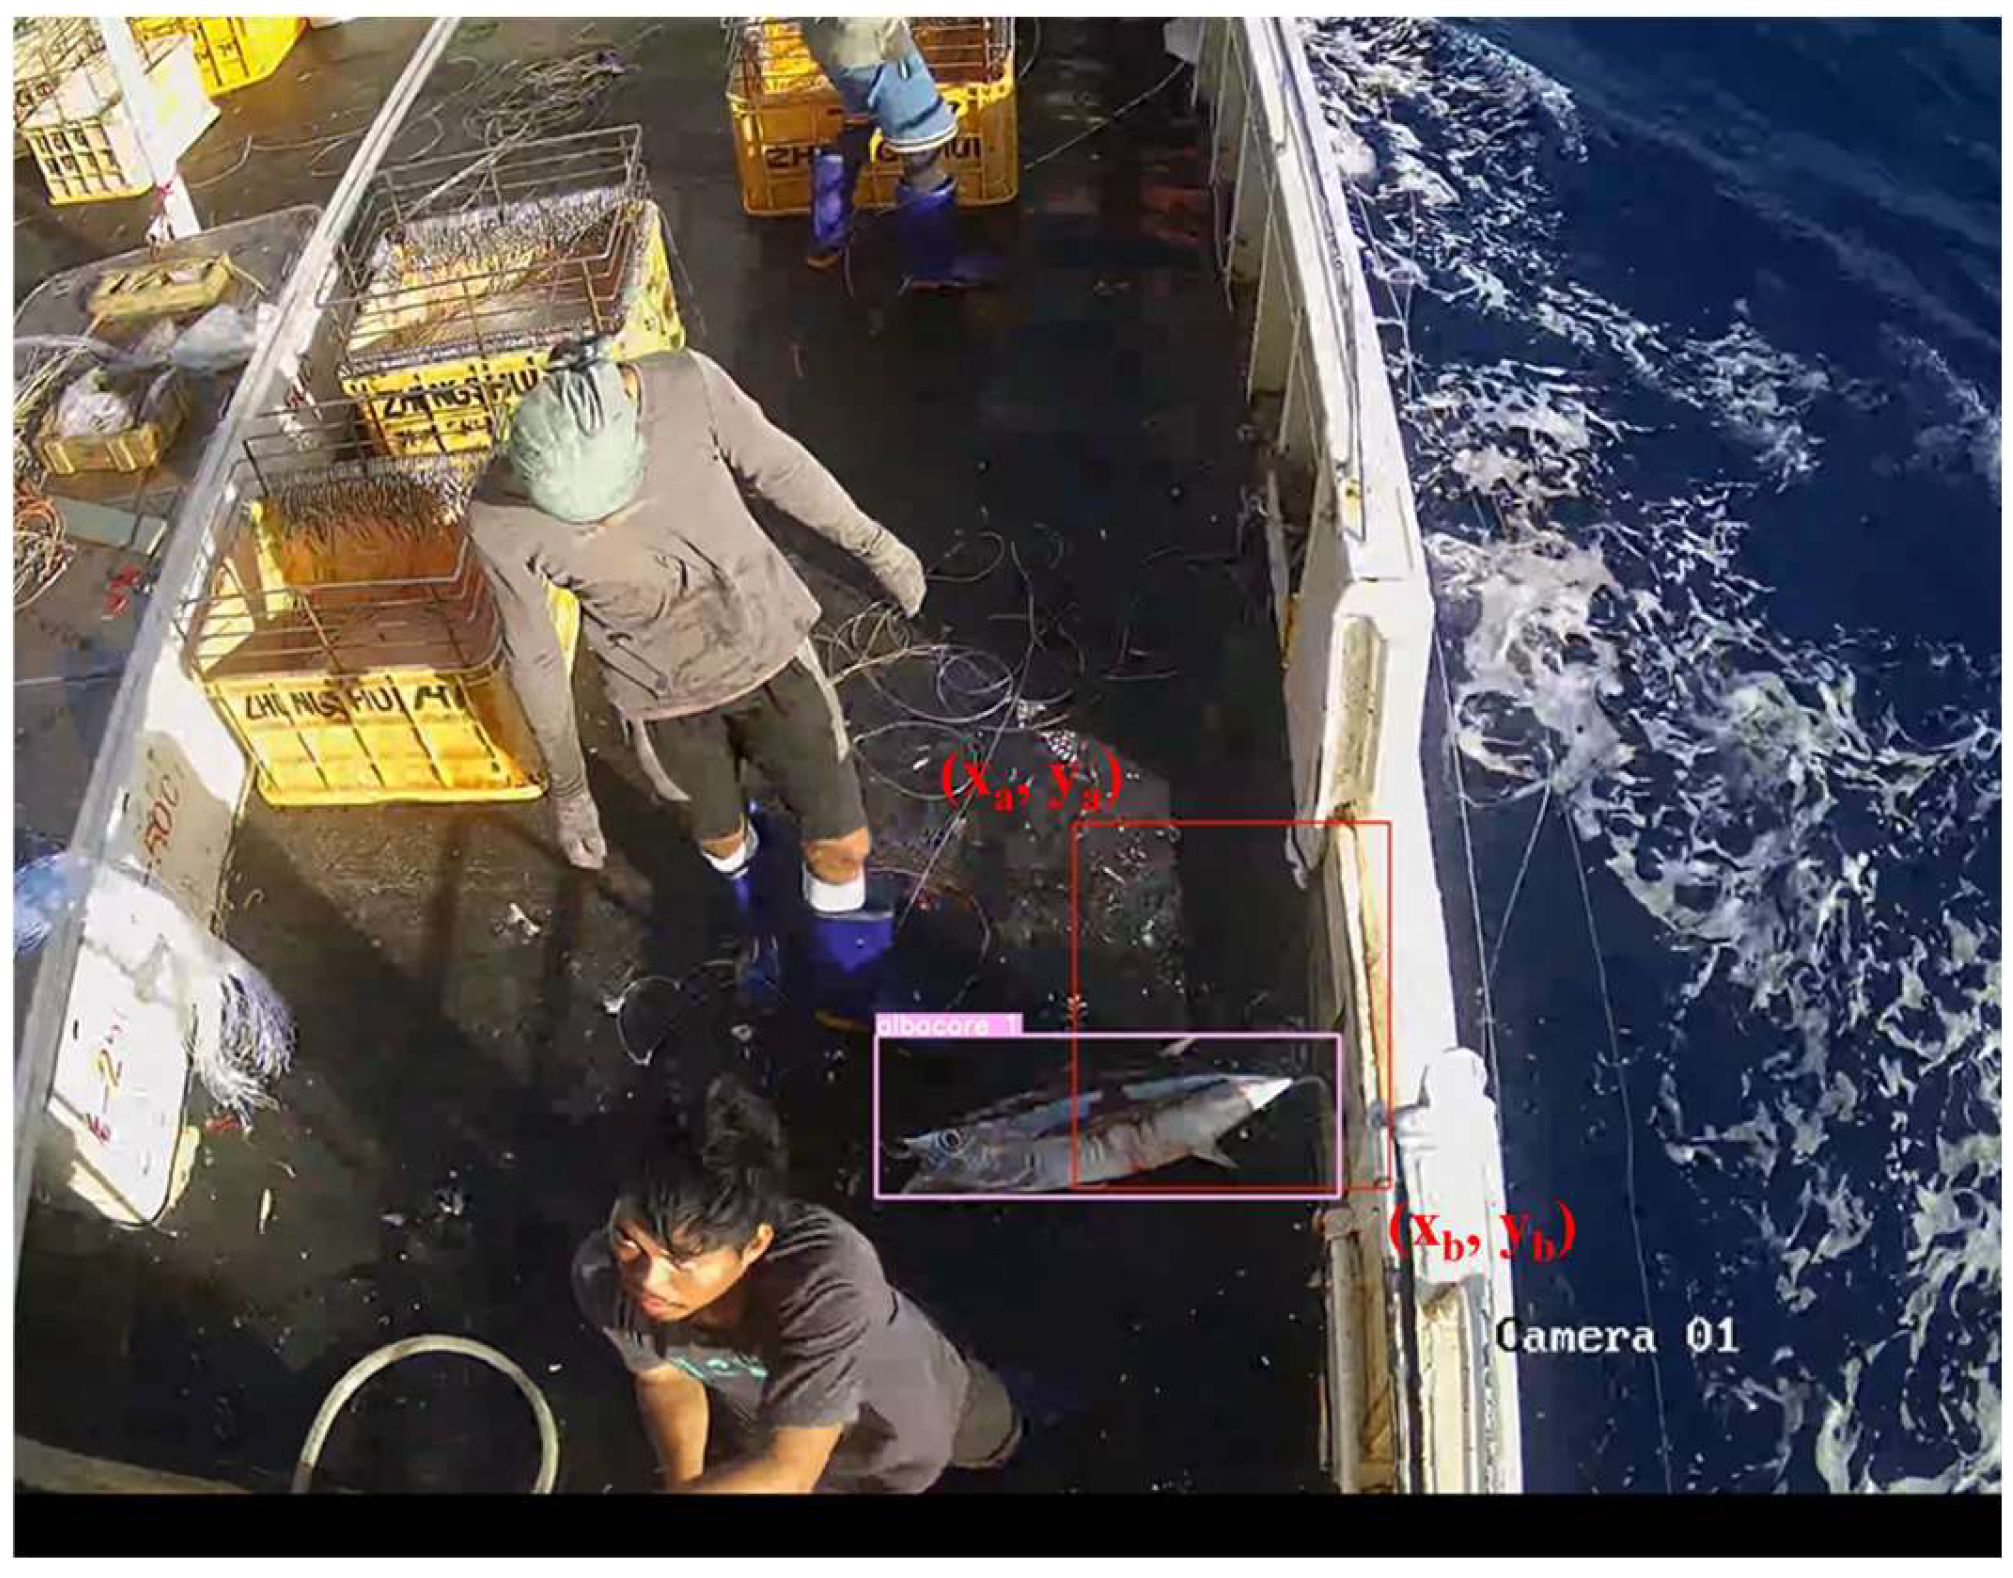
To address the issue of duplicate counting mentioned above, a specific area tracking counting method has been devised. As shown in Figure 8, at the entry point where a tuna is captured and enters the fishing vessel, a rectangular box defined by the coordinates of its top-left corner and bottom-right corner is utilized to delineate the specific counting area. The dimensions of this rectangular box are 365 × 430. The counting results are displayed in the top-left corner of the video.
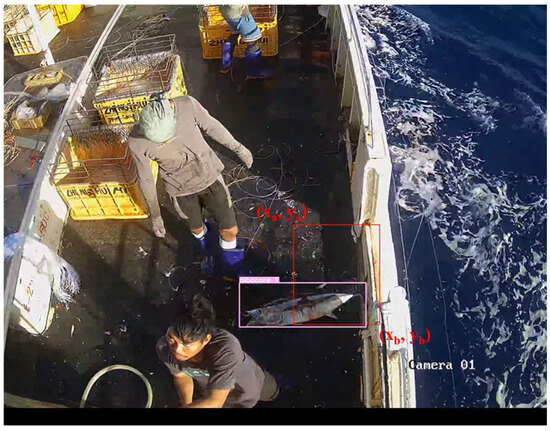
Figure 8.
Specific tracking count areas for tuna. The box is the current target detection box, type albacore and number 1.
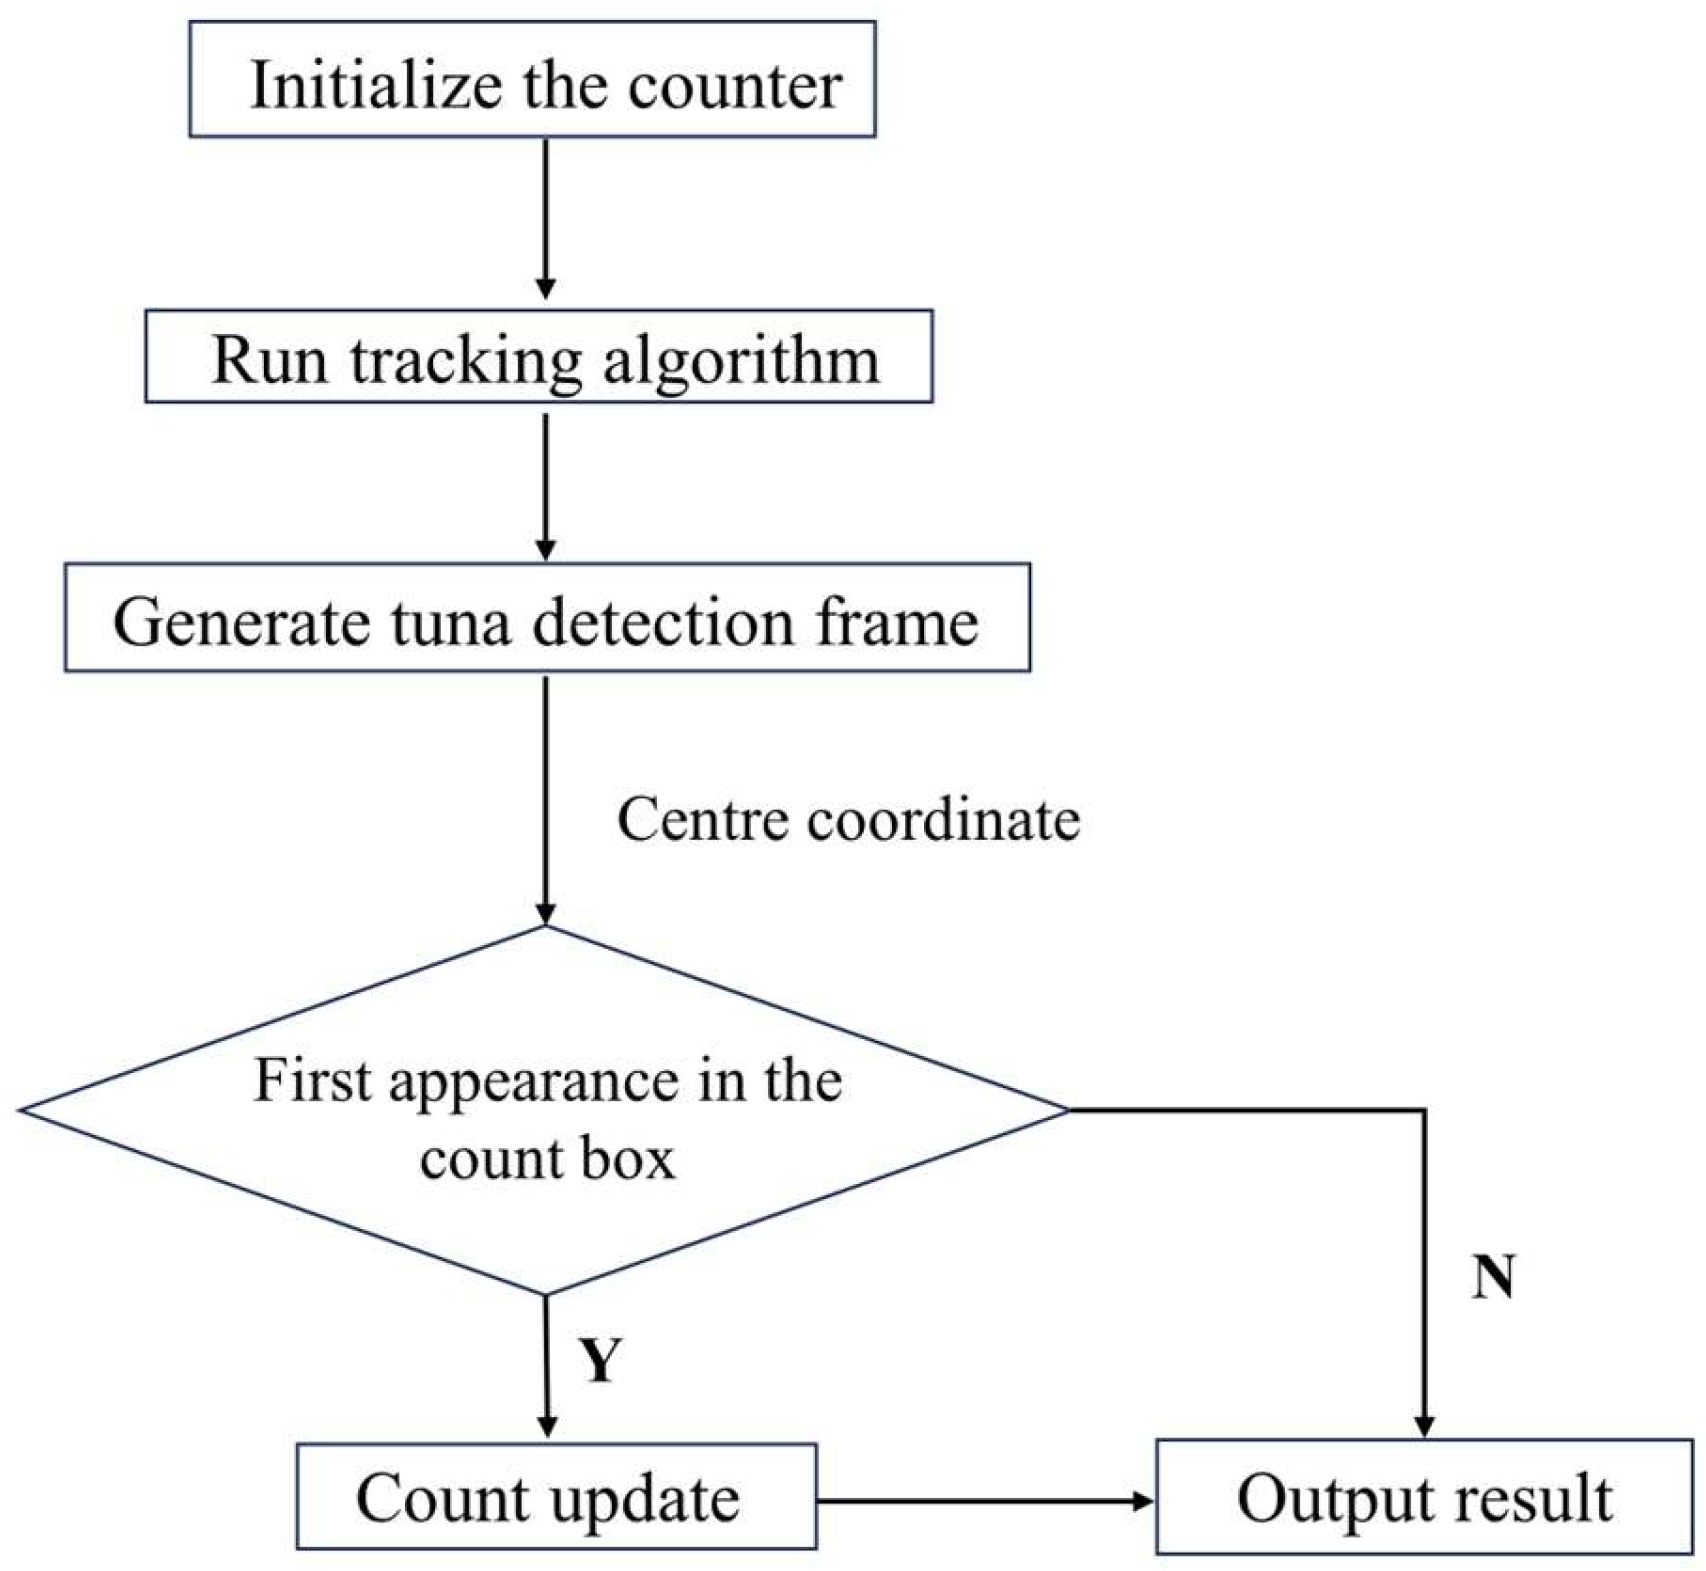
The process of the specific area tracking and counting method is shown in Figure 9. The specific area tracking counting method begins by initializing the counter. Then, the tracking algorithm is executed to obtain the detection boxes of tuna. Subsequently, the count is updated based on the first appearance of the center coordinates of the tuna detection boxes within the specific area. The addition of this specific area effectively mitigates the impact of target occlusion and irregular movements, reducing the issue of repetitive counting.
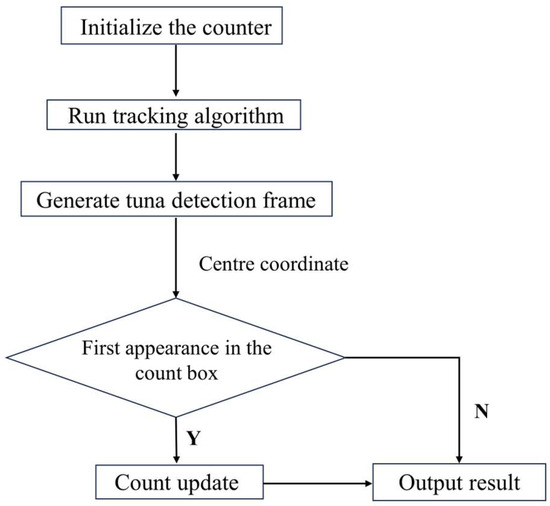
Figure 9.
Flowchart of the region-specific tracking and counting method.
Given the minimal worker activity near the water gate, incorporating a specific area counting method in this location can effectively reduce the problem of target occlusion. Additionally, since tuna exhibit less erratic movement in the area near the water gate before entering the deck, incorporating a specific area counting method in this location can further reduce the issue of double counting.
4. Experiment and Results
4.1. Dataset and Evaluation Metrics Introduction
4.1.1. Dataset Introduction
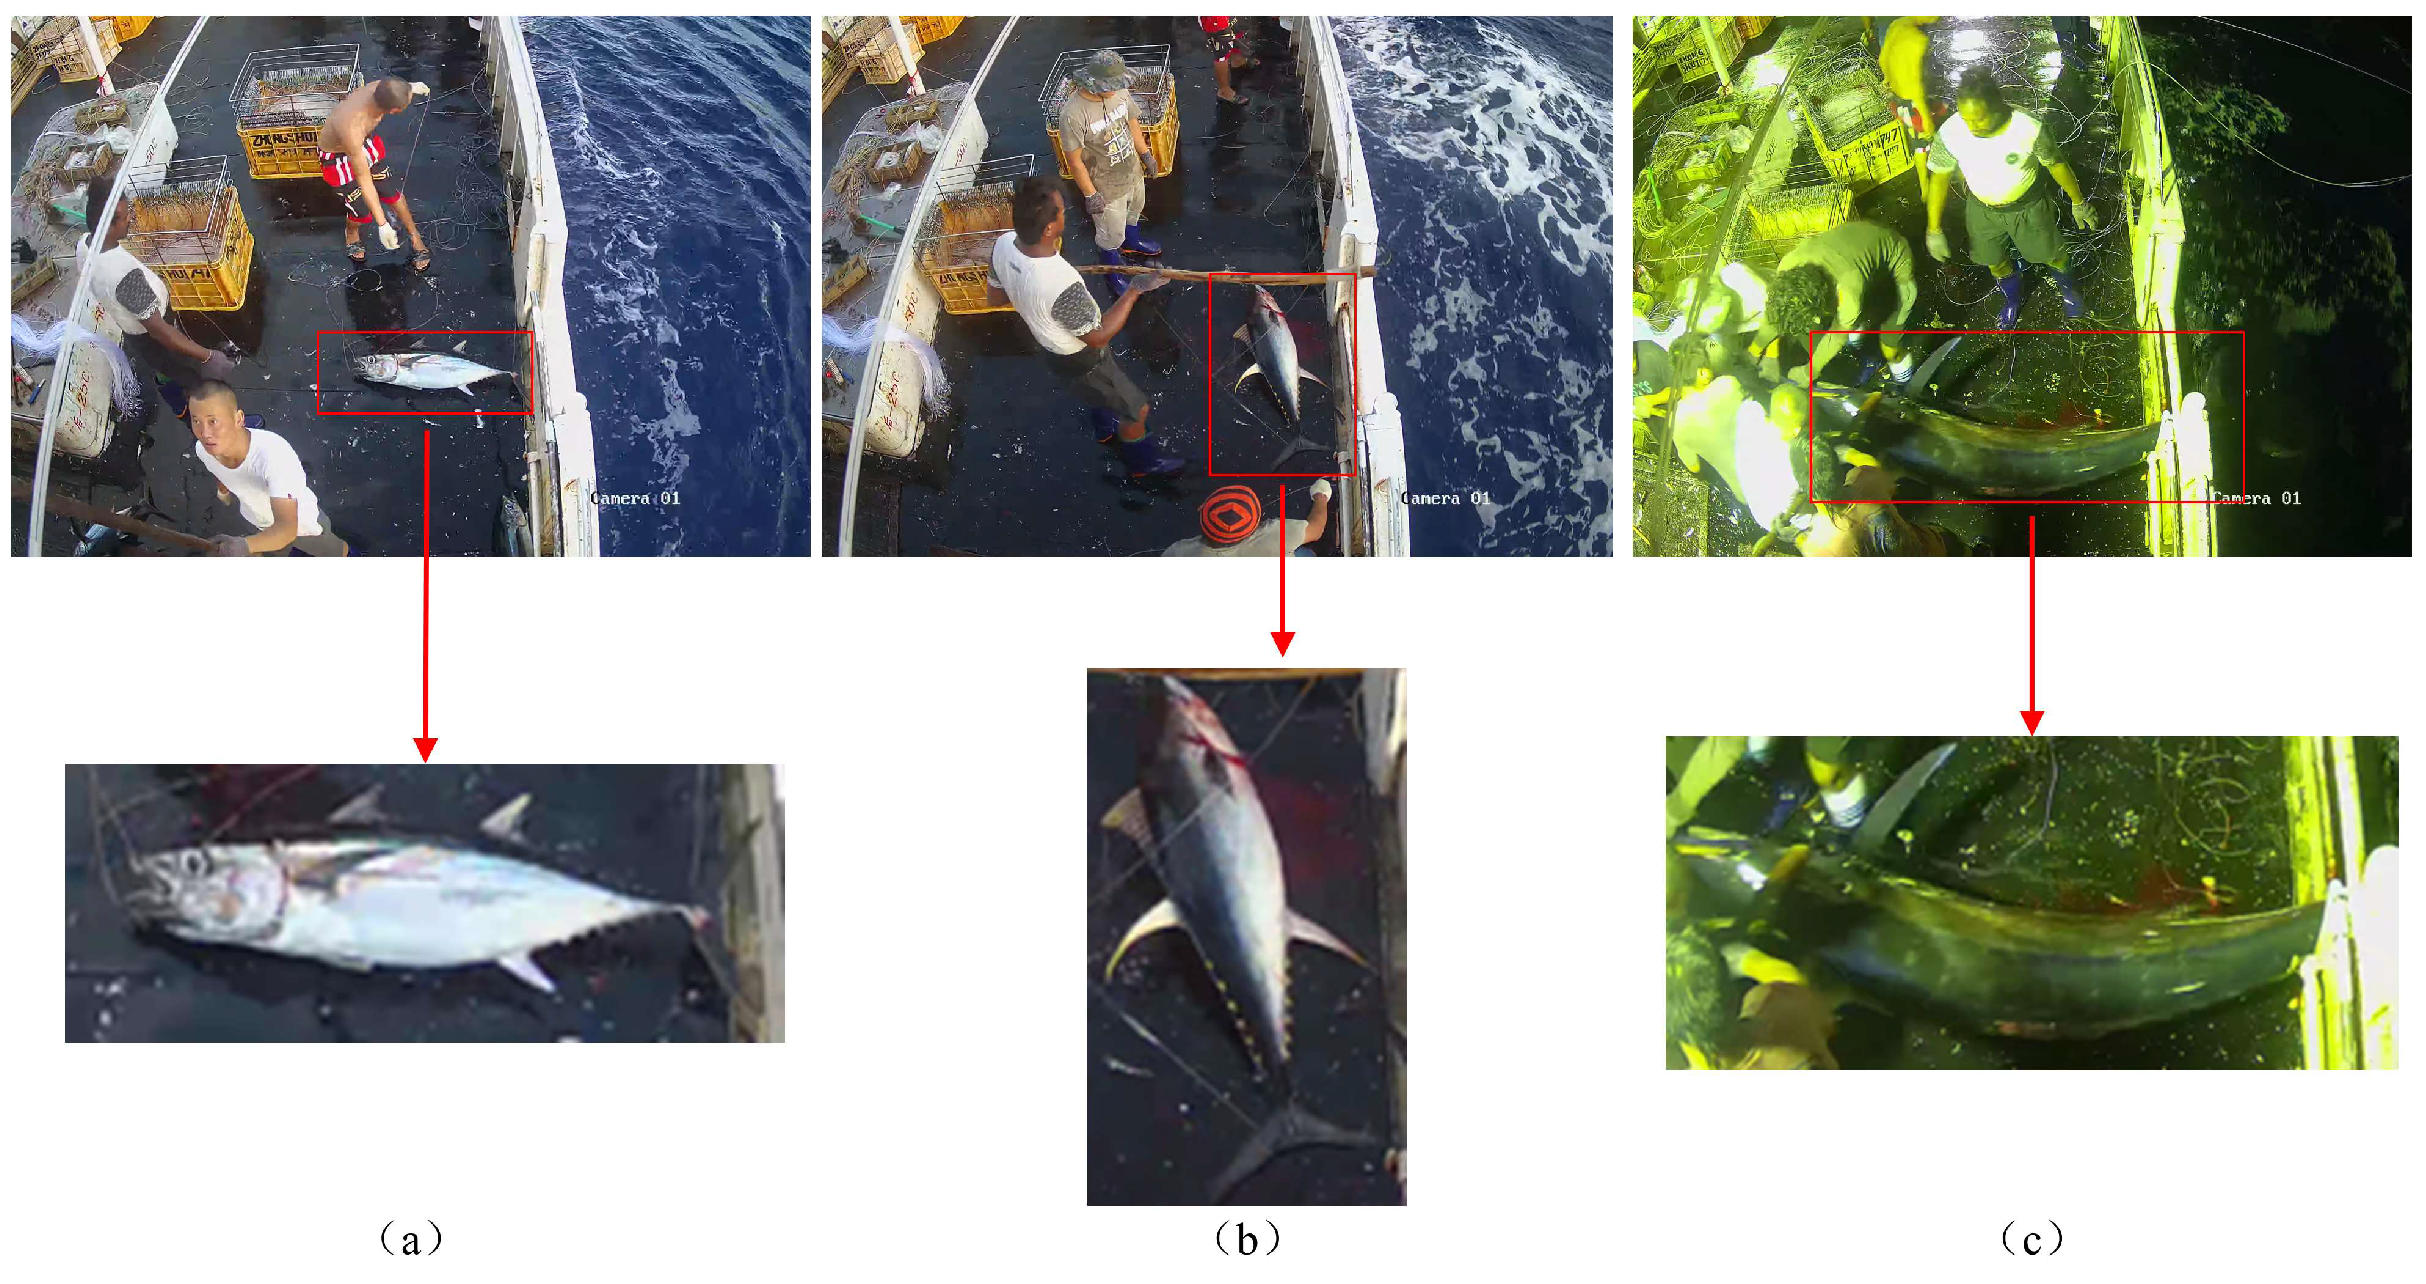
The dataset used in this study was obtained from monitoring videos of tuna longline fishing vessels operated by CNFC Overseas Fisheries Co., Ltd. in the South Pacific. A total of 952 images with a resolution of 2560 pixels × 1920 pixels were extracted. Among these images, 319 were captured during daytime and 633 during nighttime. They were divided into training, validation, and test sets in a ratio of 6:2:2. After annotating the images using LabelImg software, TXT files were generated containing the class labels and corresponding bounding box coordinates for the foreground objects. The categories for tuna include three species: Yellowfin Tuna, Bigeye Tuna, and Skipjack Tuna, as shown in Figure 10.

Figure 10.
Diagram of tuna species. The figures (a–c) respectively represent the Atlantic bluefin tuna, the yellowfin tuna, and the blackfin tuna.
4.1.2. Experimental Setup
All experiments in this study were conducted on the Ubuntu operating system, utilizing an RTX 4090 GPU. The development environment consisted of Python 3.8, CUDA version 11.3, and PyTorch version 1.10.0. To ensure the accuracy of the experiments, this paper uniformly sets the hyperparameters used for training as follows: The weight decay coefficient is set to 0.0005, and the learning rate is set to 0.01, the batch size is set to 16, and the number of training epochs is set to 300.
4.1.3. Evaluation Metrics
This study employs standard deep learning evaluation metrics: accuracy, recall, and precision. To elucidate these metrics, we define key terms: False Positive (FP) refers to instances that are actually negative samples but are erroneously classified as positive samples; False Negative (FN) refers to instances that are actually positive samples but are erroneously classified as negative samples; True Positive (TP) represents instances that are actually positive samples and are correctly classified as positive samples.
Precision is the ratio of the number of samples correctly predicted by the model to be in a particular category to the total number of samples predicted by the model to be in that category:
Recall is the proportion of positive samples correctly predicted by the model among all results predicted as positive in the validation set:
Average Precision (AP) is a comprehensive evaluation of a model’s prediction accuracy and recall across different categories. It assesses the overall performance of an algorithm by computing the average precision across different categories. Firstly, for each category, the detection results are sorted based on their confidence scores. By calculating the precision–recall curve, the average precision (AP) for that category is obtained. Subsequently, the average precision for all categories is summed up and divided by the number of categories to derive the mean Average Precision (mAP). mAP@0.5 denotes the mean average precision when the Intersection over Union (IoU) threshold is set to 0.5. mAP@0.5:0.95 represents the average precision across the confidence score thresholds, ranging from 0.5 to 0.95 for the detection results.
In the equation, represents the number of categories, and denotes the average precision of the i-th category.
4.2. Analysis of Experimental Results
4.2.1. Efficiency on the Depth of DyHead
We evaluate the efficiency of the dynamic detection head by controlling the depth (number of blocks). As shown in Table 1, we varied the number of DyHead blocks used (e.g., 1, 2, 3, 4 blocks) and compared their performance with computational costs.

Table 1.
Efficiency on the depth of DyHead.
From Table 1, it can be observed that as the number of DyHead blocks used increases, the computational cost of the model also gradually increases, while the precision of the model gradually decreases. The model’s recall rate peaks at 98.9% when using 2 blocks, and is slightly lower than this when using 3 or 1 block. The model’s mAP@0.5 remains similar across the four conditions, with the highest mAP@0.5 value of 98.7% observed when using 1 block. The model achieves the highest mAP@0.5:0.95 of 67.7% when using 3 blocks. However, this is accompanied by a significant difference in precision compared to when using 1 block. Therefore, overall, the efficiency of the dynamic detection head is highest when using one DyHead module, resulting in optimal model performance.
4.2.2. Ablation Experiment
To validate the effectiveness of the improvements to YOLOv7, the following ablation experiments were designed: maintaining consistent training parameters and data for each model, DySnakeConv convolution, CoordConv, and the dynamic detection head DyHead were gradually incorporated into the YOLOv7 model. Models were then trained individually for comparison, as outlined in Table 2.
Table 2.
Ablation Experiment.
Through the analysis of Table 2, the following conclusions can be drawn:
- Adding DySnakeConv, CoordConv, and DyHead to the YOLOv7 model resulted in YOLOv7-Tuna. Compared to the original YOLOv7, the precision increased from 91.1% to 96.3%, marking a 5.2% improvement; The recall rate increased from 95.8% to 98.9%, marking a 3.1% improvement; The mAP@0.5 increased from 98% to 98.5%, representing a 0.5% improvement; The mAP@0.5:0.95 increased from 58.5% to 68.5%, marking a 10% improvement. Therefore, YOLOv7-Tuna demonstrates improvements across all metrics, validating the effectiveness of the proposed algorithm in this study.
- The models with DySnakeConv, CoordConv, and DyHead added individually show improvements over the original YOLOv7 in various metrics, including precision, recall, mAP@0.5, and mAP@0.5:0.95. Furthermore, by comparing the enhancement effects of the three models, it can be observed that the model with DySnakeConv added exhibits the highest improvement in recall rate, increasing from 95.8% to 99%, marking a 3.2% improvement; The model with CoordConv added shows the most notable improvement in precision, increasing from 91.1% to 95.9%, marking a 4.8% improvement. The model with DyHead added exhibits the best performance in terms of mAP@0.5, increasing from 98% to 98.7%, marking a 0.7% improvement. Therefore, the three modules added in this study effectively enhance the performance of YOLOv7, each demonstrating advantages in three different aspects. This confirms the effectiveness of the added modules in this study.
In summary, the modules added in this study effectively enhance the performance of the YOLOv7 model, with each module exhibiting its own advantages in three distinct aspects. The algorithm proposed in this paper, YOLOv7-Tuna, integrates the advantages of the three modules, resulting in superior overall performance. Compared to the original YOLOv7 model, the precision increased by 5.2%, the recall rate increased by 3.1%, mAP@0.5 increased by 0.5%, and mAP@0.5:0.95 increased by 10%. Experimental results indicate that YOLOv7-Tuna achieved a significant improvement in accuracy compared to the original model, enabling better tuna identification and thereby enhancing the accuracy of tuna counting.
4.2.3. Contrast Experiment
To further validate the reliability of the YOLOv7-Tuna model for tuna detection, we conducted comparative experiments with Faster-RCNN and YOLOv5, popular current object detection algorithms. The experimental results are shown in Table 3, and the performance advantages of YOLOv7-Tuna can be concluded in comparison with these algorithms.
Table 3.
Algorithm Comparison.
Comparing the detection performance with Faster R-CNN, YOLOv5, and YOLOv7, it can be observed that YOLOv7-Tuna excels in precision, recall, and mAP@0.5 across all aspects. In terms of precision, it surpasses Faster R-CNN by 14.7%, which is 5.6% higher than YOLOv5, and 5.2% higher than YOLOv7. In terms of recall, it is 15.5% higher than Faster R-CNN, 3.7% higher than YOLOv5, and 3.1% higher than YOLOv7. In terms of mAP@0.5, it is 11.8% higher than Faster R-CNN, 0.4% higher than YOLOv5, and 0.5% higher than YOLOv7. Therefore, compared to other object detection algorithms, YOLOv7-Tuna exhibits significant advantages in terms of precision, recall, and mAP, leading to a noticeable improvement in the accuracy of tuna detection.
4.2.4. Counting Method Comparison Experiment
To verify the effectiveness of the counting method proposed in this paper, we compared the experimental results before and after the addition of the specific region counting method. The experiments kept the detection model consistent and utilized the same dataset for training. The dataset contains 32 instances of tuna. All training parameters were set identically. The experimental results are presented in Table 4.
Table 4.
Counting methods comparison.
Firstly, let us analyze the impact of different detection models on the counting results. The data in rows ①③⑤ and ②④⑥ indicate that the performance of the detection models also has a significant impact on the counting results. YOLOv7-Tuna demonstrates superior detection performance compared to YOLOv5 and YOLOv7. Moreover, when utilizing the same ByteTrack algorithm, it also achieves better counting results.
Next, to demonstrate the effectiveness of the specific area counting method added in this study, the comparison between rows ① ②, ③ ④, as well as ⑤ ⑥ in the table reveals that maintaining the detection algorithm constant while incorporating the specific area counting method yields superior counting results. The improvement addresses both the undercounting caused by occlusion issues and the overcounting resulting from the tuna’s resistance movements. The counting error has been reduced to 3.1%, and the total erroneous count has been effectively decreased.
The experimental results indicate that the detection model proposed in this study performs optimally, resulting in more accurate counting. It is suitable for automating the task of quantifying catch in tuna longline fishing.
4.2.5. Target Tracking Algorithm Comparison Experiment
In order to verify the effectiveness of the ByteSort target tracking algorithm, the DeepSort target tracking algorithm is selected for the same experiment in this paper, and the experimental comparison results are shown in Table 5.
Table 5.
Target Tracking Algorithm Comparison.
It can be similarly concluded from Table 5 that the counting error can be effectively reduced by using our proposed region-specific counting method, proving the effectiveness of our proposed YOLOv7-Tuna algorithm. And by comparing the results in Table 4 and Table 5, it can be seen that the counting error is smaller using the ByteTrack target tracking algorithm. It is worth mentioning that after using our proposed tracking region-specific counting method as well as the YOLOv7-Tuna algorithm, the counting error is similarly reduced to 3.1%, proving the effectiveness of our proposed method.
4.2.6. Model Validation
To understand the classification accuracy and counting performance of the proposed counting algorithm, a segment of daytime fishing video and a segment of nighttime fishing video were selected for video detection and counting. The results are shown in Table 6, where “day” and “night” represent the fishing time of tuna during the day and night, respectively.
Table 6.
Tuna Counting Experiment.
From Table 6, it can be observed that the counting accuracy has reached 96.4%. One albacore tuna caught during daytime fishing was accidentally released back into the sea, resulting in its being counted twice. Due to poor visibility at night, one yellowfin tuna caught during nighttime fishing was incorrectly classified as an albacore tuna. The results indicate that the model proposed in this study is capable of effectively counting multiple categories of tuna.
5. Conclusions
This study aims to enhance the accuracy of tuna detection and achieve automated statistical analysis of tuna catch quantities. To achieve this goal, a method for automated tuna detection and counting based on YOLOv7-Tuna and incorporating a specific region counting technique into ByteTrack is proposed. To address the characteristics of the tuna dataset, the YOLOv7 model is augmented with DySnakeConv, CoordConv, and DyHead modules. This augmentation enhances the model’s ability to extract temporal features, perceive spatial positions, and suppress complex backgrounds, thereby improving its accuracy. Furthermore, the inclusion of a specific region counting method effectively addresses issues such as occlusion and irregular movements during tuna counting. This method reduces counting errors and enables the possibility of automated statistical analysis of tuna catch quantities.
Author Contributions
Conceptualization, Y.L. and L.S.; methodology, Y.L. and L.S.; software, L.S., J.L. and Y.C.; validation, Y.L.; writing—original draft preparation, L.S.; writing—review and editing, Y.L., L.S., J.L. and Y.C.; project administration, Y.L.; funding acquisition, Y.L. All authors have read and agreed to the published version of the manuscript.
Funding
This research was funded by National Key Research and Development Program for the 14th Five-Year Plan. (Grant No.2023YFD2401301 and No.2023YFD2401305).
Institutional Review Board Statement
Not applicable.
Informed Consent Statement
Not applicable.
Data Availability Statement
The data presented in this study are available on request from the corresponding author. The Tuna datasets are not publicly available due to the data being part of ongoing research.
Acknowledgments
The authors would like to express their gratitude for the support of the Fishery Engineering and Equipment Innovation Team of Shanghai High-level Local University.
Conflicts of Interest
The authors declare no conflicts of interest.
References
- Cremers, K.; Wright, G.; Rochette, J. Strengthening monitoring, control and surveillance of human activities in marine areas beyond national jurisdiction: Challenges and opportunities for an international legally binding instrument. Mar. Policy 2020, 122, 103976. [Google Scholar] [CrossRef]
- Heidrich, K.N.; Juan-Jordá, M.J.; Murua, H.; Thompson, C.D.; Meeuwig, J.J.; Zeller, D. Assessing progress in data reporting by tuna Regional Fisheries Management Organizations. Fish Fish. 2022, 23, 1264–1281. [Google Scholar] [CrossRef]
- Iqbal, M.A.; Wang, Z.; Ali, Z.A.; Riaz, S. Automatic fish species classification using deep convolutional neural networks. Wirel. Pers. Commun. 2021, 116, 1043–1053. [Google Scholar] [CrossRef]
- Cai, K.; Miao, X.; Wang, W.; Pang, H.; Liu, Y.; Song, J. A modified YOLOv3 model for fish detection based on MobileNetv1 as backbone. Aquac. Eng. 2020, 91, 102117. [Google Scholar] [CrossRef]
- Yingyi, C.; Chuanyang, G.; Yeqi, L. Fish identification method based on FTVGG16 convolutional neural network. Trans. Chin. Soc. Agric. Mach. 2019, 50, 223–231. [Google Scholar]
- Krizhevsky, A.; Sutskever, I.; Hinton, G.E. ImageNet classification with deep convolutional neural networks. Commun. ACM 2017, 60, 84–90. [Google Scholar] [CrossRef]
- Szegedy, C.; Liu, W.; Jia, Y.; Sermanet, P.; Reed, S.; Anguelov, D.; Erhan, D.; Vanhoucke, V.; Rabinovich, A. Going deeper with convolutions. In Proceedings of the IEEE Conference on Computer Vision and Pattern Recognition, Boston, MA, USA, 8–10 June 2015; pp. 1–9. [Google Scholar]
- He, K.; Zhang, X.; Ren, S.; Sun, J. Deep residual learning for image recognition. In Proceedings of the IEEE Conference on Computer Vision and Pattern Recognition, Las Vegas, NV, USA, 27–30 June 2016; pp. 770–778. [Google Scholar]
- Huang, G.; Liu, Z.; Van Der Maaten, L.; Weinberger, K.Q. Densely connected convolutional networks. In Proceedings of the IEEE Conference on Computer Vision and Pattern Recognition, Honolulu, HI, USA, 21–26 July 2017; pp. 4700–4708. [Google Scholar]
- Shaobo, L.; Ling, Y.; Huihui, Y.; Yingyi, C. Underwater Fish Species Identification Model and Real-Time Identification System. Smart Agric. 2022, 4, 130. [Google Scholar] [CrossRef]
- Al Muksit, A.; Hasan, F.; Emon, M.F.H.B.; Haque, M.R.; Anwary, A.R.; Shatabda, S. YOLO-Fish: A robust fish detection model to detect fish in realistic underwater environment. Ecol. Inform. 2022, 72, 101847. [Google Scholar] [CrossRef]
- Ayuningtias, I.; Jaya, I.; Iqbal, M. Identification of yellowfin tuna (Thunnus albacares), mackerel tuna (Euthynnus affinis), and skipjack tuna (Katsuwonus pelamis) using deep learning. In Proceedings of the Earth and Environmental Science, Bogor, Indonesia, 24–25 August 2021; p. 012009. [Google Scholar]
- Albuquerque, P.L.F.; Garcia, V.; Junior, A.d.S.O.; Lewandowski, T.; Detweiler, C.; Gonçalves, A.B.; Costa, C.S.; Naka, M.H.; Pistori, H. Automatic live fingerlings counting using computer vision. Comput. Electron. Agric. 2019, 167, 105015. [Google Scholar] [CrossRef]
- Tseng, C.-H.; Kuo, Y.-F. Detecting and counting harvested fish and identifying fish types in electronic monitoring system videos using deep convolutional neural networks. ICES J. Mar. Sci. 2020, 77, 1367–1378. [Google Scholar] [CrossRef]
- Yu, X.; Wang, Y.; An, D.; Wei, Y. Counting method for cultured fishes based on multi-modules and attention mechanism. Aquac. Eng. 2022, 96, 102215. [Google Scholar] [CrossRef]
- Kibet, D.; Shin, J.-H. Counting Abalone with High Precision Using YOLOv3 and DeepSORT. Processes 2023, 11, 2351. [Google Scholar] [CrossRef]
- Zhang, S.; Yang, X.; Wang, Y.; Zhao, Z.; Liu, J.; Liu, Y.; Sun, C.; Zhou, C. Automatic fish population counting by machine vision and a hybrid deep neural network model. Animals 2020, 10, 364. [Google Scholar] [CrossRef] [PubMed]
- Qian, Z.-M.; Chen, X.; Jiang, H. Fish tracking based on YOLO and ByteTrack. In Proceedings of the 16th International Congress on Image and Signal Processing, BioMedical Engineering and Informatics (CISP-BMEI), Taizhou, China, 28–30 October 2023; pp. 1–5. [Google Scholar]
- Liu, Y.; Li, B.; Zhou, X.; Li, D.; Duan, Q. FishTrack: Multi-object tracking method for fish using spatiotemporal information fusion. Expert Syst. Appl. 2024, 238, 122194. [Google Scholar] [CrossRef]
- Wang, C.-Y.; Bochkovskiy, A.; Liao, H.-Y.M. YOLOv7: Trainable bag-of-freebies sets new state-of-the-art for real-time object detectors. In Proceedings of the IEEE/CVF Conference on Computer Vision and Pattern Recognition, Vancouver, BC, Canada, 18–22 June 2023; pp. 7464–7475. [Google Scholar]
- Wu, D.; Jiang, S.; Zhao, E.; Liu, Y.; Zhu, H.; Wang, W.; Wang, R. Detection of Camellia oleifera fruit in complex scenes by using YOLOv7 and data augmentation. Appl. Sci. 2022, 12, 11318. [Google Scholar] [CrossRef]
- Qi, Y.; He, Y.; Qi, X.; Zhang, Y.; Yang, G. Dynamic snake convolution based on topological geometric constraints for tubular structure segmentation. In Proceedings of the IEEE/CVF International Conference on Computer Vision, Paris, France, 1–6 October 2023; pp. 6070–6079. [Google Scholar]
- Liu, R.; Lehman, J.; Molino, P.; Petroski Such, F.; Frank, E.; Sergeev, A.; Yosinski, J. An intriguing failing of convolutional neural networks and the coordconv solution. In Proceedings of the Neural Information Processing Systems, Montreal, QC, Canada, 2–8 December 2018. [Google Scholar]
- Ding, X.; Zhang, X.; Ma, N.; Han, J.; Ding, G.; Sun, J. Repvgg: Making vgg-style convnets great again. In Proceedings of the IEEE/CVF Conference on Computer Vision and Pattern Recognition, Nashville, TN, USA, 20–25 June 2021; pp. 13733–13742. [Google Scholar]
- Dai, X.; Chen, Y.; Xiao, B.; Chen, D.; Liu, M.; Yuan, L.; Zhang, L. Dynamic head: Unifying object detection heads with attentions. In Proceedings of the IEEE/CVF Conference on Computer Vision and Pattern Recognition, Nashville, TN, USA, 20–25 June 2021; pp. 7373–7382. [Google Scholar]
- Zhang, Y.; Sun, P.; Jiang, Y.; Yu, D.; Weng, F.; Yuan, Z.; Luo, P.; Liu, W.; Wang, X. Bytetrack: Multi-object tracking by associating every detection box. In Proceedings of the European Conference on Computer Vision, Tel Aviv, Israel, 23–27 October 2022; pp. 1–21. [Google Scholar]


Disclaimer/Publisher’s Note: The statements, opinions and data contained in all publications are solely those of the individual author(s) and contributor(s) and not of MDPI and/or the editor(s). MDPI and/or the editor(s) disclaim responsibility for any injury to people or property resulting from any ideas, methods, instructions or products referred to in the content. |
© 2024 by the authors. Licensee MDPI, Basel, Switzerland. This article is an open access article distributed under the terms and conditions of the Creative Commons Attribution (CC BY) license (https://creativecommons.org/licenses/by/4.0/).