Article

Electrophoretic Protein Deposition as a Tool for In Situ Co-Crosslinking Enzyme Immobilization: An Electrochemical/Quartz Crystal Microbalance Study

Dipartimento di Scienze, Università Degli Studi Della Basilicata, Via Dell’ateneo Lucano 10, 85100 Potenza, Italy
*
Author to whom correspondence should be addressed.
Appl. Sci. 2024, 14(1), 212; https://doi.org/10.3390/app14010212
Submission received: 30 November 2023 / Revised: 13 December 2023 / Accepted: 21 December 2023 / Published: 26 December 2023

Abstract

:
Electrophoretic deposition is a powerful tool for depositing materials onto a substrate by using an electric field; its application in biotechnological areas, namely, electrophoretic protein deposition (EPD), is the most promising for, e.g., fabricating novel amperometric biosensors. Unfortunately, EPD suffers from several drawbacks due to coupled parasite electrochemical processes damaging the deposit; moreover, the nature of the deposition process, the deposit, and its stability are still controversial and unknown. The present research presents a deep investigation of the EPD processes conducted by using several electroanalytical techniques and an electrochemical quartz crystal microbalance (EQCM); notably, EPD was used here as a novel tool for performing an electrophoretically assisted, classical enzyme immobilization technique like co-crosslinking, thus permitting the immobilization of the desired protein in situ, i.e., exclusively onto the deposition electrode. An electrochemical study permitted the acquisition of useful insights about electrophoresis processes as well as solvent discharge and gas evolution at the deposition electrode; further, the use of appropriate current or potential pulse sequences, as investigated and improved in this study, together with fine-tuned chemical conditions, allowed the optimization of this novel EPD approach. Moreover, an EQCM study gave useful insights into the kinetics of the process, permitting a quantitative estimate of the deposit.

1. Introduction

Electrophoretic deposition (ED) is a remarkable approach used in materials science and engineering to deposit and pattern materials onto a substrate by using an electric field. Essentially, ED is based on the principle of electrophoresis, i.e., the movement of charged particles (ions or surface-charged colloids) in a liquid medium (typically a solution) under the influence of an electric field. In fact, when an electric field is established in the medium by applying a potential difference to a couple of electrodes (usually made of a conductive material like metal, with one electrode acting as a substrate), the charged particles in solution are attracted to the oppositely charged electrode and start to deposit onto its surface, leading to their deposition on the chosen substrate (see Figure 1). The physical/chemical properties (e.g., pH and ionic strength) of the liquid medium employed, influencing the net charge of the ions/particles and their mobilities, are expected to control the deposition process: nevertheless, this process can also be easily controlled by adjusting simple parameters such as the applied voltage and the deposition time. More notably, ED is a powerful technique because it allows for the precise spatial control of the deposition process as well as the deposit thickness and permits one to coat virtually any complexly shaped substrates.
Even if ED has been employed in a multitude of scientific and industrial applications (e.g., electronics and ceramic and metal coating), its application in medical and biotechnological areas is the most fascinating and promising. Indeed, ED has proved useful and powerful with regard to the ceramic coating of dental implants; the deposition of biological macromolecules, proteins, enzymes, cells, and drugs; and the production of novel biomaterials [1,2,3,4,5,6]. In particular, the ability of ED to deposit proteins and enzymes, i.e., so-called electrophoretic protein deposition (EPD), is particularly attractive for the novel fabrication of immobilized enzyme electrodes, i.e., amperometric biosensors. While conventional enzyme immobilization procedures using cast or discrete membranes are limited to two-dimensional electrodes with simple geometries and require several steps for biosensor fabrication, EPD has several advantages over conventional methods, like allowing the one-step fabrication of a sensing device, facilitating the precise spatial control of enzyme deposition, and the ability to easily manufacture multienzyme structures. Using this powerful but simple technique, several amperometric glucose [7,8,9,10,11,12,13], sarcosine [14], lactose [15], and glutamate [16] biosensors have been proposed; EPD has also permitted the immobilization of other enzymes such as catalase [17] and horseradish peroxidase [18,19] for hydrogen peroxide sensing as well as laccase [20] for the amperometric detection of phenolic compounds.
Unfortunately, in EPD, as well as in ED, electrophoresis is always coupled with electrolysis at the electrode/solution interphase, so electrochemical reactions, e.g., solvent discharge, are usually combined with target deposition. As in the case of electroplating, where hydrogen evolution at the electrode counteracts metal deposition [21], the high applied potentials or currents required for electrophoresis entail mainly water discharge (i.e., oxygen evolution for anodic deposition), pH changes, and ohmic heating at the electrode interface, which severely contrast with enzyme deposition and its activity [13]. In fact, galvanostatic [7,8,9,10], potentiostatic [12,18,20], alternating current [13], and pulse [11,14,22] techniques have been investigated for reducing these adverse effects while optimizing enzyme deposition: accordingly, the use of EPD for biosensor fabrication requires the careful study of the electrical perturbation to be used for promoting suitable electrophoresis and hence deposition of the enzyme molecules, minimizing the undesired but inevitable side effects of water electrolysis. Furthermore, it is worth noting that the deposition process and the nature of the deposit are still not well explained [11], complicating the effectiveness of the EPD approach. Even if electrosorption, multilayer adsorption, and electrocoagulation are sometimes employed, a few studies [22,23] apparently show that the significant pH decrease at the electrode/solution interphase occurring due to water electrolysis is responsible for enzyme precipitation and deposition. Anyway, since low pH values and precipitation essentially signify the denaturation of the enzyme, it is unclear how a denatured enzyme, as declared, can be used as an effective sensing element in biosensors. Not less importantly, a fully compact deposit of a pure enzyme is expected to limit biosensor performance (e.g., induce a poor linear range) due to the low permeability/high activity of the immobilized enzyme. Therefore, a different deposition approach should be explored to allow for the efficient use of EPD in biosensor fabrication.
Conventional enzyme immobilization usually relies on the use of, e.g., suitable chemical reactions that transform soluble enzyme molecules in insoluble enzyme aggregates firmly attached to the desired support [24,25]. For fabricating amperometric enzyme electrodes, enzyme crosslinking and co-crosslinking [24,25] have turned out to be quite popular thanks to the simplicity of the approach, the high stability of the immobilized enzyme, and the ability to obtain a thin enzyme membrane strongly adherent (tight) to the electrode surface and mechanically very stable even in stirred and flowing solutions. As an example, in our laboratory, enzyme co-crosslinking with bovine serum albumin proved successful in fabricating glucose-oxidase- [26], choline-oxidase- and acetylcholine- esterase- [27,28], and lysine-oxidase [29,30,31]-based amperometric biosensors. Unfortunately, as already pointed out above, this enzyme immobilization procedure, however powerful, requires careful casting of the crosslinking solution onto the electrode surface, and for this reason, it is limited to macroscopic electrodes with simple geometries. Surely, this limitation could be overcome if enzyme co-crosslinking could be electrochemically assisted so as to induce crosslinking only and exclusively on the electrode surface, without requiring any manual casting of the enzyme-crosslinking solution.
In the present paper, an original method, namely, electrophoretic-protein-deposition-assisted in situ co-crosslinking enzyme immobilization, was investigated in depth. In this approach, EPD was performed in a solution containing the enzyme of interest, an inert protein like bovine serum albumin with glutaraldehyde as a crosslinker, at concentration levels low enough to kinetically decelerate the co-crosslinking process. When polarization occurs at the electrodes, the concentrations of both proteins greatly increase at the electrode/solution interface due to their electrophoretic movements, thus starting co-crosslinking in situ, exclusively on the electrode surface (see Figure 1). This novel method assured the accurate spatial control of the deposition process while using a classical enzyme immobilization methodology, regardless of the shape of the deposition electrode. The latter permitted the production of a stable and highly active layer of immobilized enzyme molecules, while simple parameters such as the applied voltage or current and the deposition time could control and change its thickness. As a matter of fact, this approach was already explored in the past for the fabrication of a glucose and sarcosine biosensor [14], but, unfortunately, its application was limited to simple galvanostatic deposition techniques and biosensor characterization, without any investigation of the deposition process. In contrast, in this study, a careful selection of the chemical conditions for effective in situ enzyme co-crosslinking was performed; moreover, several electrical perturbations were investigated to minimize any side effects due to electrode polarization (vide ante) while increasing the quality of the deposit. Finally, a quartz crystal microbalance study permitted us to study the growth of the enzyme deposit on the electrode surface, gave us useful insights about the kinetics depending on the nature of the electrical perturbation applied at the deposition electrode, and confirmed the nature of the enzyme deposition process.

2. Materials and Methods

2.1. Materials

Glucose oxidase (EC 1.1.3.4., type VIIS, from Aspergillus niger, 162 units/mg solid), bovine serum albumin (fraction V), and glutaraldehyde (grade II, 25% aqueous solution) were purchased from Sigma (Sigma Chemical Co., St. Louis, MO, USA) and used without further purification. Further details can be found in the relevant section of the Supplementary Materials.

2.2. Apparatus

EPD and electrochemical experiments were carried out using an AMEL (Milan, Italy) mod. 466 polarographic analyzer coupled with a Linseis (Linseis GmbH, Selb, Germany) LY 18100 X-Y chart recorder. For pulsed EPD techniques, an EG&G PAR (EG&G Princeton Applied Research, Princeton, NJ, USA) model 263A or an EG&G PAR model 273 potentiostat/galvanostat was used; potentiostat control and data acquisition for both potentiostats/galvanostats were accomplished using a desktop computer running the M270/250 electrochemical research software (EG&G) version 4.23 or version 3.0, respectively. The electrochemical cell used for EPD experiments was a conventional three-electrode system with a Pt rod as a counter electrode and an Ag/AgCl, KCl sat. reference electrode, while the working electrode acting as a substrate for EPD was a platinum disk (polycrystalline 99.95%, 3.0 mm diameter, Goodfellow, Cambridge, England) embedded in a glass body; the working and counter electrodes were assembled so that they faced each other to develop a uniform electrical field around the working electrode. Electrode pretreatment procedure can be found in the relevant section of Supplementary Materials.
Electrochemical quartz crystal microbalance (EQCM) experiments were performed with a mod. QCA917 SEIKO EG&G system coupled with a mod. 263A EG&G PAR potentiostat/galvanostat, both controlled using a desktop computer running Model 270/250 electrochemical research software version 4.23 (EG&G). AT-cut 9 MHz platinum-plated (with a geometrical area of the electrode surface of 0.2 cm2) quartz crystals (EG&G) were used, mounted on a Well-Type all-Teflon electrochemical cell (SEIKO EG&G) with a platinum wire counter electrode and an Ag/AgCl/KCl sat. reference electrode. A single quartz crystal was used for each experiment; these crystals were used as received. Electrochemical determination of the electrode area yielded a value of 0.202 ± 0.002 cm2 (n = 5) obtained by using potassium ferricyanide electrochemistry in 1 mM of potassium nitrate (a diffusion coefficient of 7.19 × 10⁻⁶ cm2 s−1 was used for ferricyanide [32]). Silver electrodeposition experiments [33] showed frequency changes that were linear at up to a 20 µg mass increase, with a sensitivity of 10.7 +/− 0.3 × 10⁸ Hz g−1 (n = 3), as calculated using Sauerbrey’s equation.

2.3. Electrophoretic Protein Deposition Procedure

EPD experiments were typically performed by immersing the electrodes in a phosphate buffer solution (pH 7, I 0.1 M) containing appropriate quantities of proteins and crosslinker. Unless otherwise stated, glucose oxidase was used at 0.5% w/v, bovine serum albumin was used at 1% w/v, and glutaraldehyde was used at 2.5% v/v. In these chemical conditions, the deposition electrode used was the anode working electrode of the cell; even if the convention about electrochemistry states that anodic currents are negative, for simplicity, all the current values for EPD experiments were reported as their positive values.
All EPD, electrochemical, and EQCM experiments were performed at room temperature.

3. Results and Discussion

3.1. Optimization of Chemical Conditions for EPD and Co-Crosslinking

As pointed out in Section 1, only charged particles can migrate under an electrical field in EPD and then be deposited onto the target electrode. Glucose oxidase (GOD) and bovine serum albumin (BSA) have isoelectric points at pH 4.3 and 4.7, respectively [10], so they are positively charged in an acidic solution while being negatively charged in neutral and alkaline solutions. Since low pH values significantly reduce the GOD activity and induce the denaturation of both proteins, EPD was performed in neutral solutions (i.e., a phosphate buffer at pH 7, I 0.1 M), so both proteins were expected to be in their negatively charged forms and be attracted by the anode of EPD cell.
Crosslinking [24,25] is a conventional method for enzyme immobilization able to produce insoluble polymeric structures of enzyme molecules covalently linked by a crosslinking agent. By using, e.g., glutaraldehyde (GLU) as a bifunctional crosslinker, both aldehyde groups react with primary amino group residues of proteins, initially creating Schiff bases, followed by the formation of stable secondary amine linkages. The kinetics and the degree of crosslinking are usually controlled by the concentration of both glutaraldehyde and enzyme, reaction time, pH, and temperature: usually, higher concentrations of protein and crosslinker result in stronger crosslinking, which adversely affects the catalytic activity of the immobilized structure due to enzyme crowding. For this reason, co-crosslinking [24,25], i.e., inert protein-assisted enzyme crosslinking, was preferred; indeed, the use of an inert protein like BSA significantly reduces the crowding of GOD, resulting in a immobilized structure with sufficient catalytic activity. Typical co-crosslinking chemical conditions were already studied and optimized elsewhere, e.g., for GOD [26], by varying enzyme, BSA, and GLU concentrations as well as buffer type and pH. Anyway, the aim of the present research was to drastically slow down the kinetics of the co-crosslinking reaction in the bath solution to avoid any gelation process in the cell while inducing co-crosslinking exclusively on the electrode surface during the EPD process. With this aim in mind, a carefully study showed that it is more effective to reduce the concentrations of both proteins than the concentration of the crosslinker agent; in fact, reducing the GLU concentration to 0.5 ÷ 1% v/v, to avoid any co-crosslinking in the solution, did not lead to any deposition, even if, for example, the protein concentration was higher than 10% w/v. Typically, a GOD concentration of 0.5% w/v, a BSA concentration of 1% w/v, and a GLU concentration of 2.5% v/v in phosphate buffer at pH 7, I 0.1 M, guaranteed the absence of any gelation processes in the cell for as long as several hours but permitted in situ co-crosslinking of GOD and BSA under suitable EPD conditions (vide infra). It is worth noting that a buffer with high ionic strength was preferred due to its influence on the size of the diffusion layer (i.e., the electrical double layer) surrounding the protein molecules; in fact, as Scheme S1 shows, higher ionic strengths, reducing the size of the diffusion layer, permit fewer retardation effects on the electrophoretic mobilities of proteins and constitute a proper approach for molecules in the co-crosslinking reaction.

3.2. Galvanostatic and Potentiostatic Deposition

In an initial series of experiments, the electrophoretic deposition and in situ co-crosslinking of GOD and BSA onto the electrode surface were investigated at a constant current, which was ensured using the galvanostatic technique. The chemical conditions were those already optimized above, while several constant current densities, in the range of 0.5 ÷ 3 mA/cm2, were investigated for protein deposition. In this context, Figure S1 shows the relevant chronopotentiometric curves observed in these experiments, while Figure 2 shows the potential attained at the deposition electrode for each performed constant-current experiment.
In all cases, notable dioxygen evolution at the deposition electrode was evident, while a foamy coating was observed only at the higher applied current densities; unfortunately, in the latter conditions, the degree of dioxygen bubbling was so strong that it quickly removed any newly formed coating. Indeed, as reported in Figure 2, for each applied current, the potential at the deposition electrode quickly reached values high enough, even at the lowest current densities, to promote water oxidation and dioxygen bubbling, ruining any protein deposition. These findings strictly correspond with similar side effects observed in metal electroplating [21] and agree with those already pointed out elsewhere [17]; it is worth noting that the use of the galvanostatic deposition technique has already been attempted for EPD deposition [7,8,9,10], but these side effects were unexpected and have never been reported.
Similar results were observed even for potentiostatic (i.e., constant potential) deposition experiments (not shown here), so the constant current and potential deposition approaches were abandoned.

3.3. Galvanodynamic Deposition

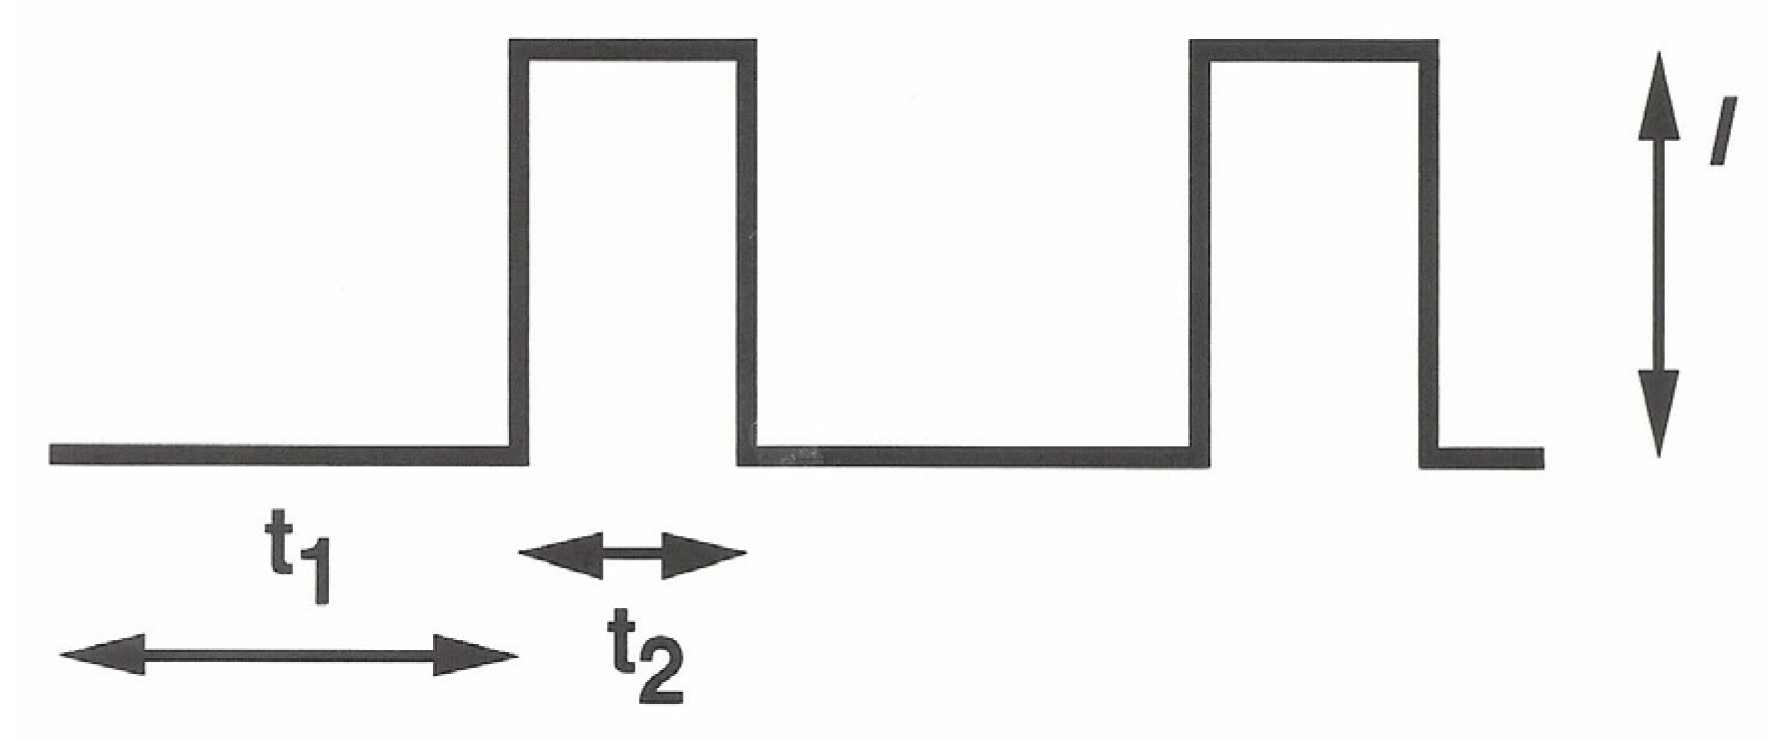
As the previous experiments show, EPD should be efficiently promoted by applying high current (or potential) values at the deposition electrode while minimizing the concurrent and undesired solvent discharge causing gas bubbling on top of it. Operating under the hypothesis that the kinetics of the two concurrent processes were almost different, a galvanodynamic electrophoretic deposition technique was investigated. In this approach, a pulsed current sequence (see Scheme 1) was applied at the deposition electrode while varying the maximal current I and the pulse duty cycle by varying t1 and t2.
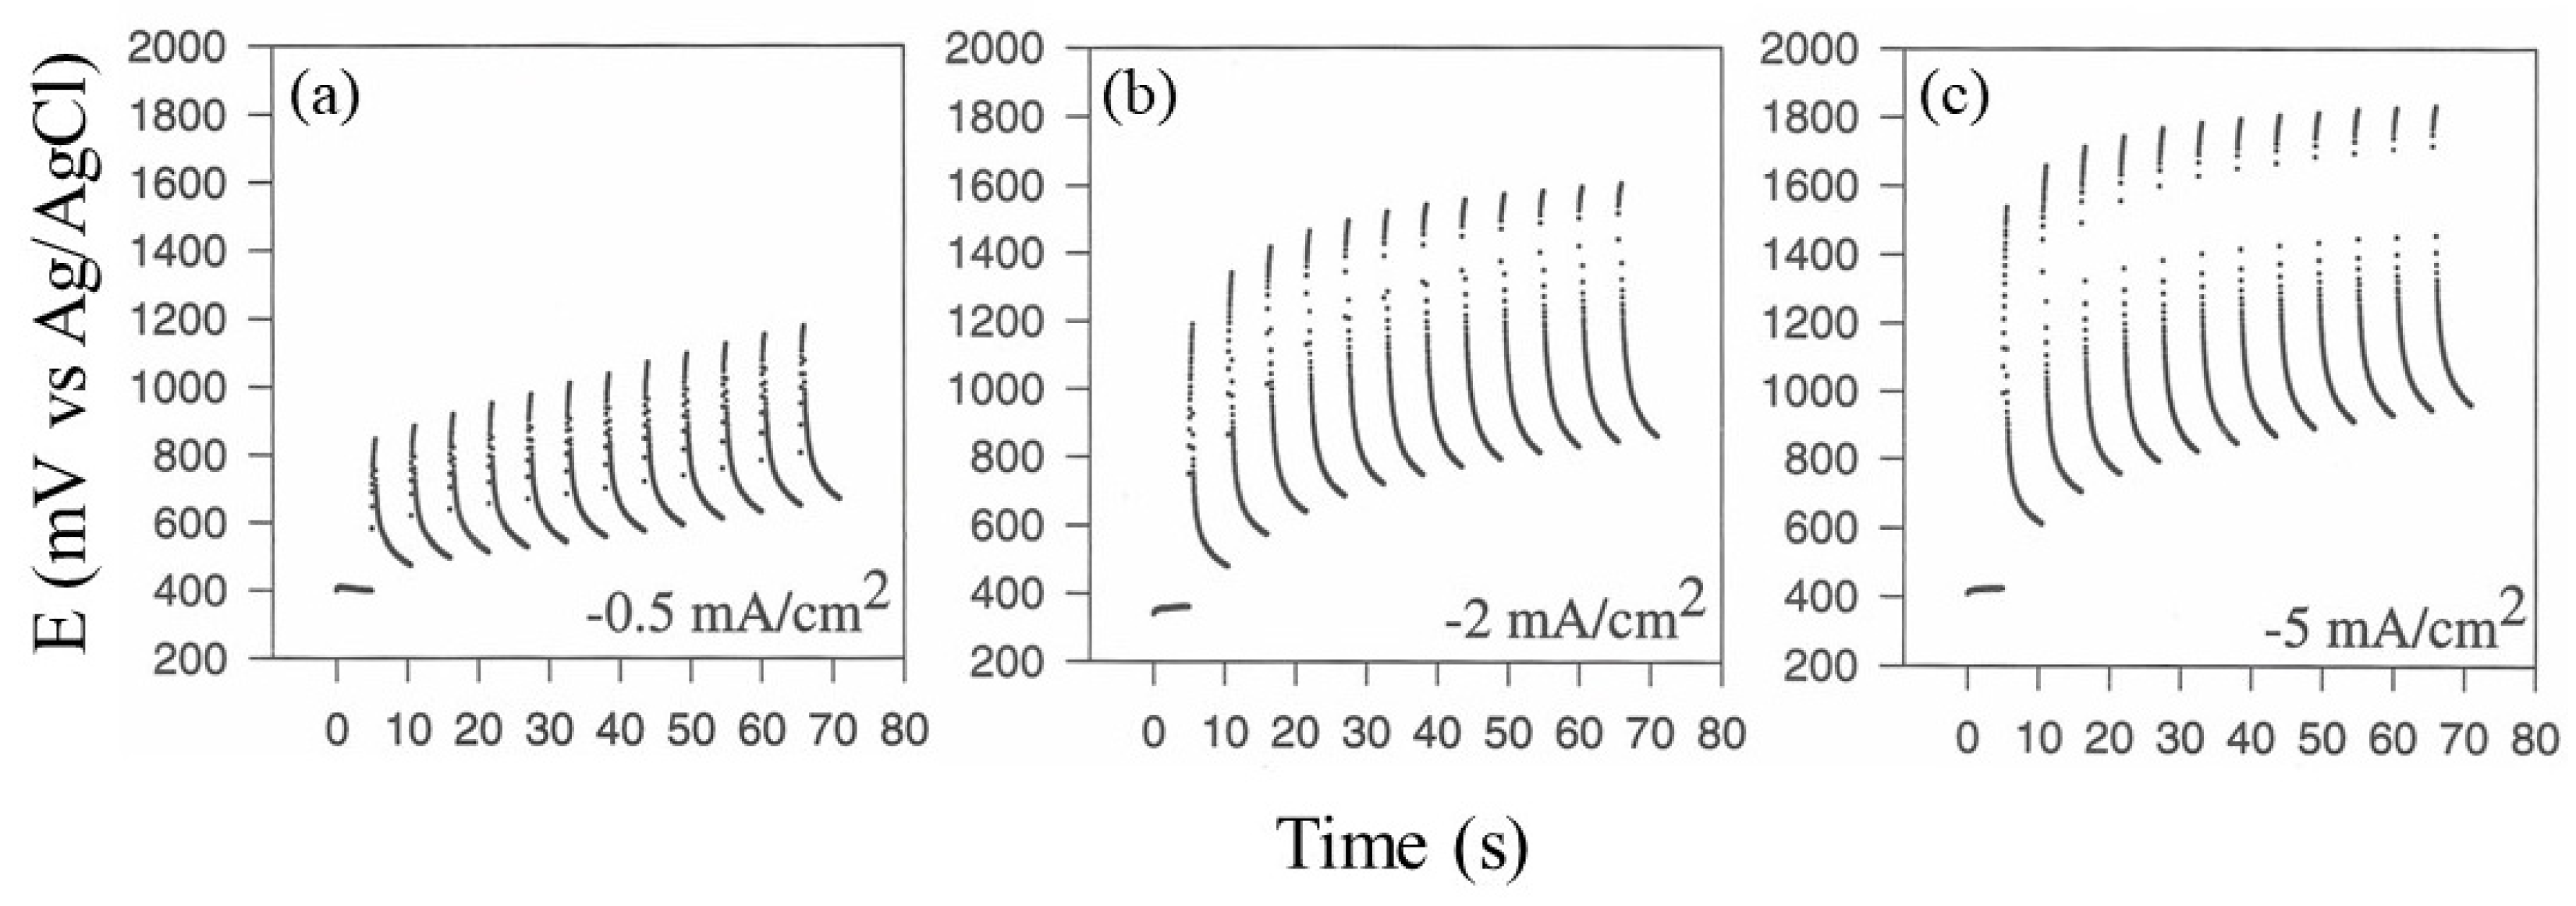
Figure 3 shows typical chronopotentiometric curves at the deposition electrode due to the application of current pulse sequences in a fixed duty cycle while varying I, as described in the figure. As can be seen, whatever the value of I, the expected potential increase was observed with the application of current pulse. Notably, a hysteresis effect was also evident, wherein the maximal potential reached by the deposition electrode increased with the increase in the time of the current pulse sequence application: due to the formation of platinum oxides on the electrode surface, this last effect was particularly revealing since it is well known that water discharge (and hence gas evolution at the electrode) is indeed mediated by the formation of metal oxides on the electrode surface. As evident from Figure 3, increasing I in the current pulse perturbation at the electrode promotes higher oxide formation on the surface of the electrode and hence dioxygen evolution. In particular, lower I values ensured lower, if any, water discharge, but electrodeposition was practically absent: these experimental conditions evidently do not promote any significant electrophoretic movements of proteins and hence any in situ co-crosslinking, even when extending the experiment for a very long time. Oppositely, higher I values promoted an evident and significant degree of protein deposition, but the water discharge was so intense that it destroyed any deposits. A I value of 2 mA/cm2 was an optimal current density value and a good compromise between efficient protein deposition and lower gas evolution at the electrode surface.
Regarding the duty cycle optimization of the current pulse sequence and its frequency, Figure 4 shows typical chronopotentiometric curves at the deposition electrode due to the application of a current pulse sequence at a fixed maximal current I (2 mA/cm2) while varying t1 and t2, as described in the figure. As can be seen, an increase in the duty cycle of the pulse sequence, i.e., increasing t2 while keeping t1 + t2 constant, was equivalent to an increase in I, as observed in the previous experiments; in fact, the deposition electrode reached higher potential values (suggesting intense kinetics of platinum oxide formation on its surface), and dioxygen evolution was more evident, destroying any formation of the protein deposit. On the contrary, lower duty cycle values permitted the formation of a compact protein layer even if at a lower rate. Further, increasing the frequency of the current pulse sequence by lowering both t1 and t2 was not effective for protein deposition: in fact, due to the inherent inertia of the electrophoresis of big molecules like proteins, electrophoresis could be considered negligible at the higher frequency values. Accordingly, the application of a current pulse sequence at low frequency values and low duty cycles constitutes mandatory conditions for the optimal electrophoresis of both proteins and in situ co-crosslinking: a current pulse sequence with t1 5 s and t2 0.5 s yielded the best protein deposit at a current density of 2 mA/cm2.
In these optimized conditions, after just a few seconds, an opalescent layer was observed on the electrode surface, without any evidence of gas evolution. After 1 min and more, a yellowish proteic layer was clearly visible; it did not have any gas bubbles entrapped on it and was quite resistant to being washed with water when the electrode was removed from the bath solution.
More insights into the growth of protein deposition and in situ co-crosslinking were gained via an electrochemical quartz crystal microbalance (EQCM) study. Here, a platinum-plated quartz disk electrode was used as the deposition electrode in the electrochemical cell: by measuring the frequency change of the quartz crystal resonator, the growth of the proteic deposit could be followed and eventually quantified [34].
Since EQCM measurements allowed for the measurement of mass changes as low as about 1 ng/cm2 and are sensitive to viscosity changes, preliminary experiments were performed to exclude significant frequency changes due to protein adsorption at the surface of the deposition electrode and/or changes in the viscosity of the solution due to crosslinking in a bath solution. Using a 1 h time window, the frequency changes in a pure buffer reached a maximal value of about 0.1 kHz, while those observed in the presence of both proteins and a crosslinker but without any current pulse application were on the order of 1 kHz; finally, frequency changes due to protein adsorption, induced in the absence of GLU in the solution and without any current pulse application at the deposition electrode, were about 0.1 kHz as well.
These frequency changes were surely lower than those observed for EPD experiments wherein protein deposition and in situ co-crosslinking were expected. In fact, as reported in Figure 5, the frequency changes due to EPD/co-crosslinking were significantly higher, increasing with the time of protein deposition and starting and stopping with the current pulse sequence application as expected for a process under electrostatic control; further, the EQCM profiles were almost reproducible, as curves (b) and (c) in Figure 5 show, since they represented a couple of replicate experiments differing only in their deposition time. Notably, at the end of the deposition time, as shown in Figure 5 for both curves (b) and (c), which depict the cessation of current pulse application, the frequency changes reversed (i.e., the resonance frequency increased). This is likely due to the disruption of the concentration gradient of these proteins, still not crosslinked, near the electrode surface/solution interface, originally produced by their electrophoretic movements towards the deposition electrode; anyway, these frequency changes soon reached a plateau, demonstrating the presence of a deposit on the electrode surface and further detachment from it. Figure 5 also shows that frequency changes varied almost linearly with the low deposition time (case (b)) and in a hyperbolic fashion at longer durations, with an overall frequency change of about 0.3 kHz/min; using the well-known Sauerbrey equation [34], this corresponded to about 3 × 10⁻⁷ g/min, so, e.g., in the case (c) of Figure 5, a proteic deposition of about 10 µg (corresponding to nearly 500 ng/mm2 and roughly to a one-micron thickness) was observed in less than an hour. Similar EQCM studies [4,22] about the EPD of GOD performed using different electrical perturbation techniques and different chemical conditions reported significantly lower amounts of protein deposition: in ultrapure water, the amounts were comparable with the other conditions investigated, demonstrating that efficient EPD in these poor and uncontrolled chemical conditions is not mandatory. Finally, it should be stressed that the Sauerbrey equation, here and elsewhere used and sometimes misused, is strictly valid only for elastic mass measurements [34], i.e., when the deposit onto the quartz sensor is so rigid that it is mechanically coupled with the vibrating quartz, as in the case of metal deposition or thin film formation; on the contrary, in the present case, as for similarly fabricated biosensors proposed elsewhere, the nature of the enzymatic deposit is quite different from the rigid case, being essentially a dense gel with a viscoelastic nature wherein density, viscosity, and hydration states depend on the chemical conditions used for its formation. Accordingly, care should be taken when considering these mass or thickness figures as the real mass amounts of the proteic deposit.

3.4. Potentiodynamic Deposition

Even if the galvanodynamic approach optimized in this study proved capable of successfully depositing and in situ co-crosslinking GOD and BSA on the electrode surface, further approaches were investigated and studied. As previously pointed out, the concurrent and deleterious processes of water discharge and dioxygen bubbling are catalyzed by platinum oxide formation: since this last process is merely controlled by the potential of the deposition electrode under suitable chemical conditions, a potentiodynamic technique, wherein the potential is under the control of the EPD process, should increase the selectivity of the electrophoretic deposition towards gas evolution, increasing the efficiency of the overall EPD/co-crosslinking process; in fact, the galvanodynamic approach investigated herein, even if optimized, did not permit the true control of the potential reached by the deposition electrode since, as Figure 3 and Figure 4 show, its value increased, even if only slightly, during the current sequence application.
Since the preliminary potentiostatic experiments (see 
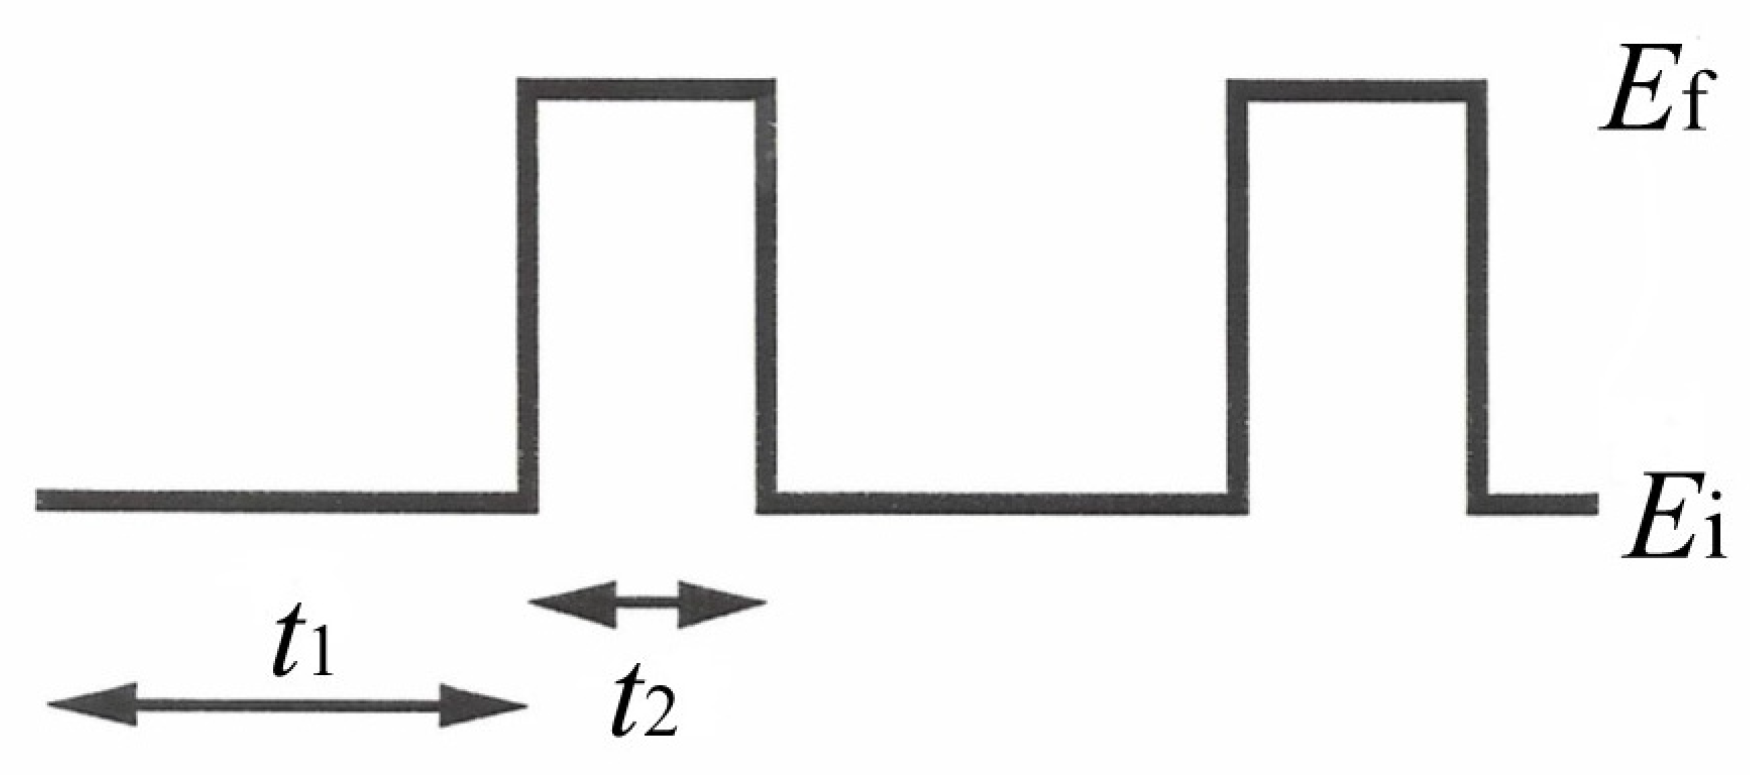
Section 3.2) failed to reach the goal of the present research, a potentiodynamic electrophoretic deposition technique was developed and investigated for protein deposition: here, a pulsed potential sequence (see Scheme 2) was applied at the deposition electrode while varying the potential step values Ei and Ef and the pulse duty cycle by t1 and t2.
Apart from t1 and t2 optimization, the selection of Ei and Ef was of paramount importance for removing any Pt oxide formed during the electrophoretic pulse step and minimizing oxide formation, respectively; accordingly, several electrochemical experiments were preliminarily conducted for this purpose. In this respect, Figure S2 shows typical cyclic voltammograms of the deposition Pt electrode as a function of scan rate in the media used for EPD/co-crosslinking deposition. Clearly evident are (a) the oxidation of the adsorbed dihydrogen and the subsequent Pt oxide formation due to Pt electrooxidation during the anodic scan (shown from left to right by the lower curves in both panels) and (b) Pt oxide stripping due to Pt electroreduction and the subsequent water reduction generating dihydrogen evolution during the reversal cathodic scan (right to left, the upper curves in both panels). As can be seen, the stripping peak, corresponding to the removal of Pt oxide from the electrode, shifts toward cathodic values, increasing the scan rate, but it was not lower than −0.1 V vs. Ag/AgCl, even for the fastest scan rate; accordingly, Ei was set at this potential value to assure the complete removal of the Pt oxide on the surface of the deposition electrode. Figure S2 also shows that the Pt oxide was formed in the range 0.2 ÷ 1 V vs. Ag/AgCl and shifted toward more positive values, increasing the scan rate.
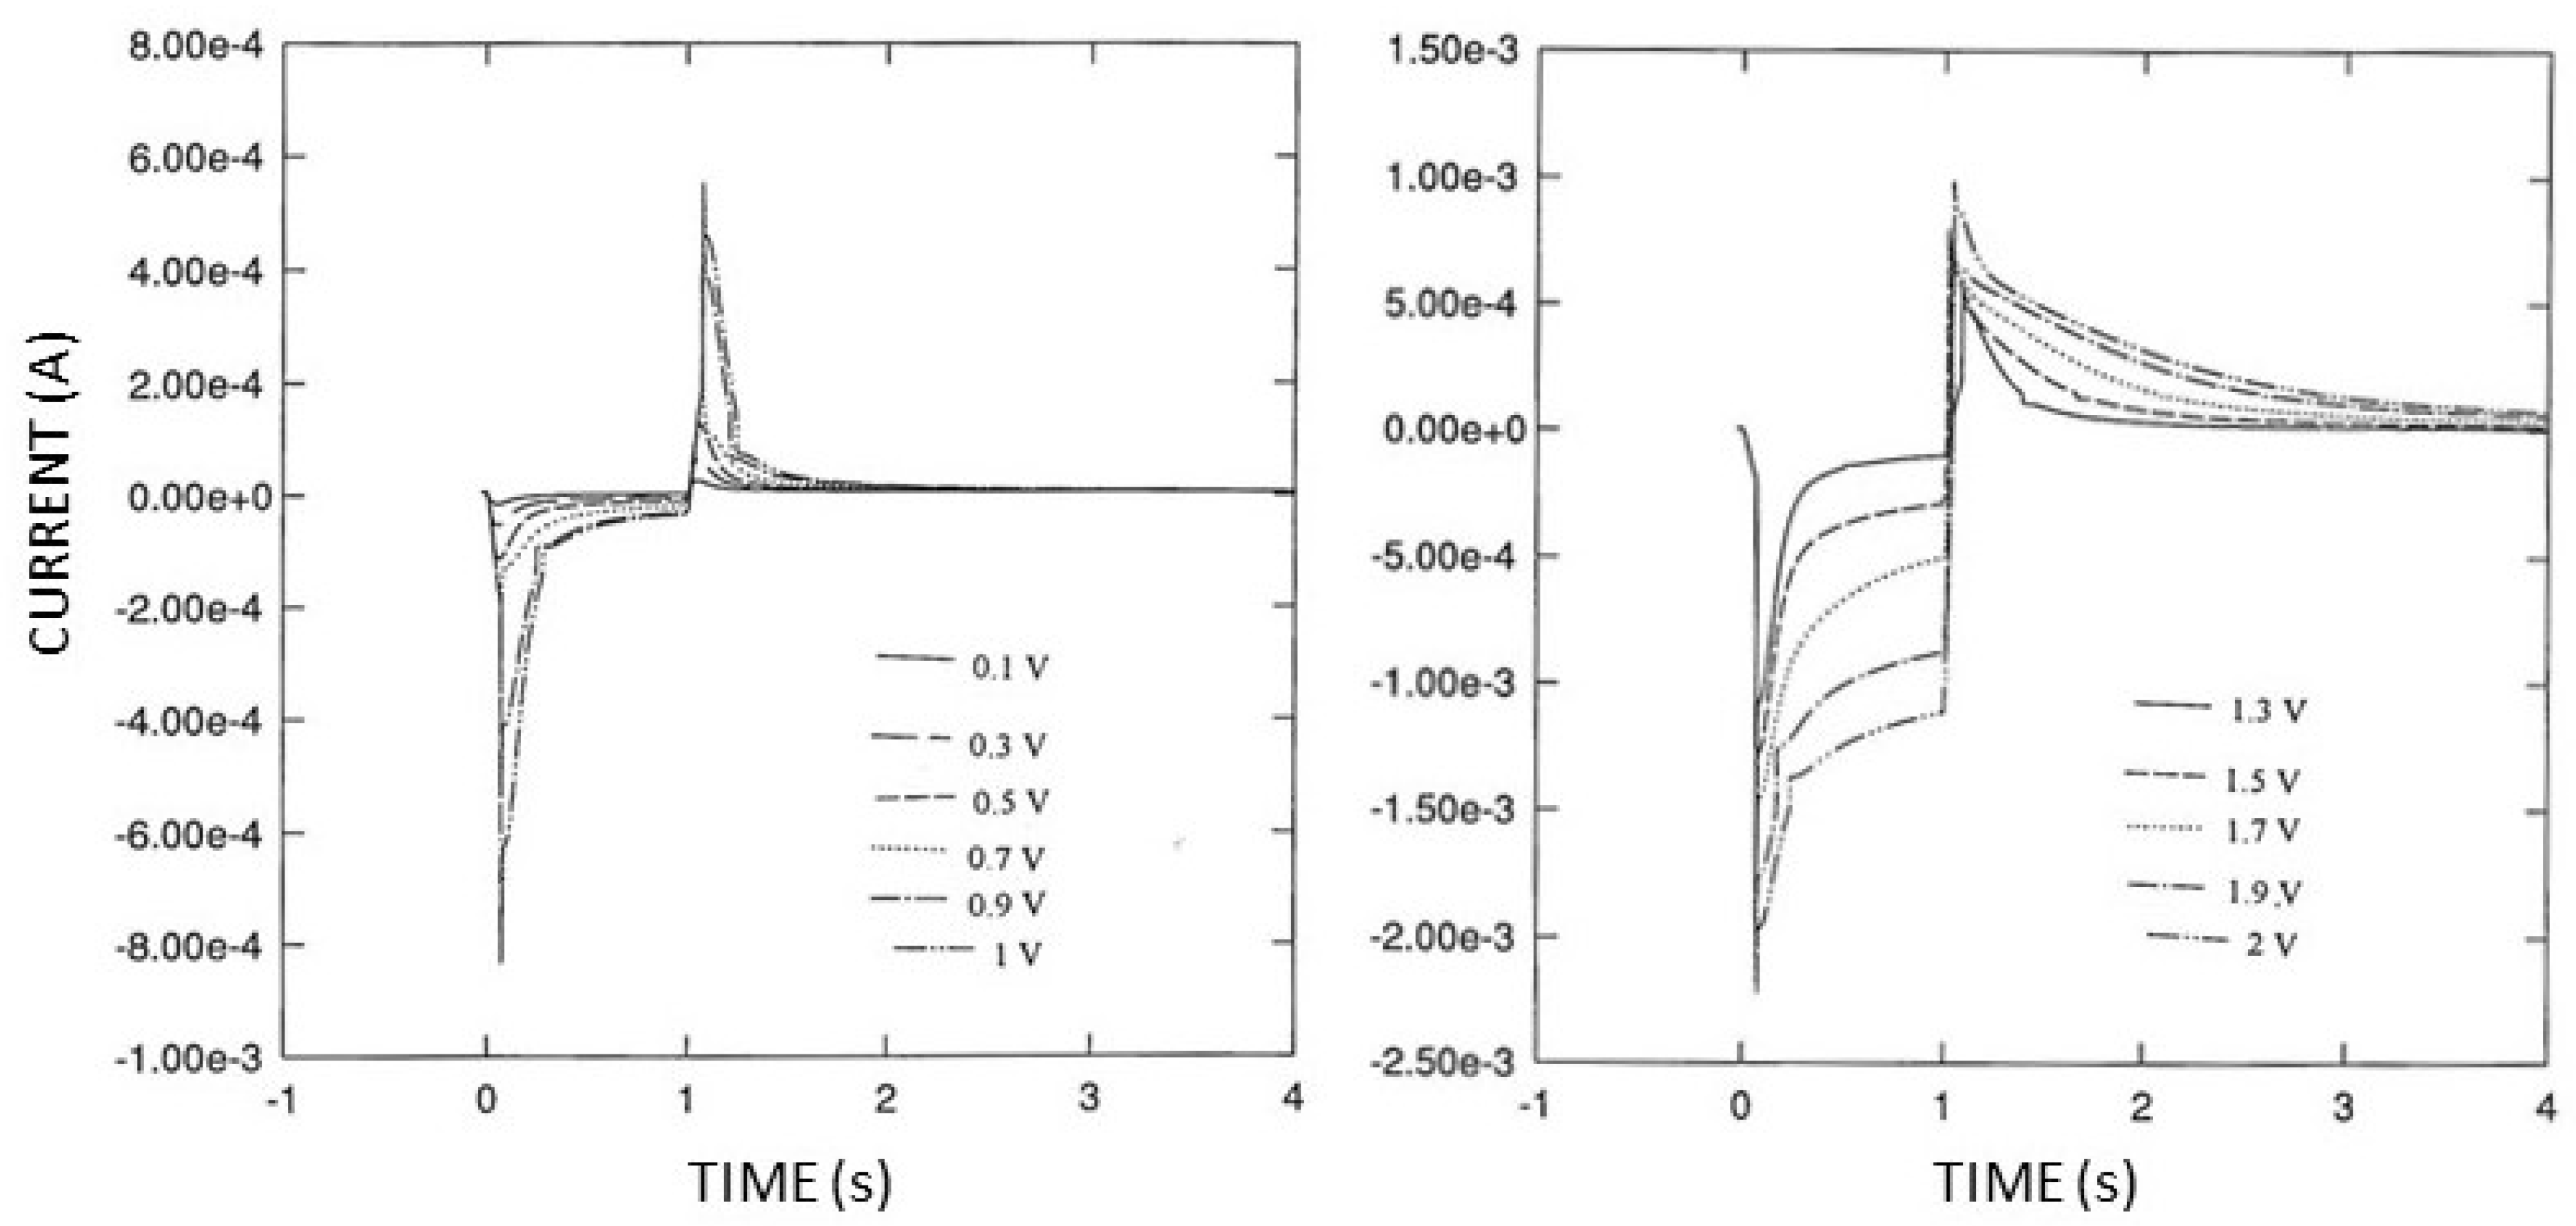
Due to this significant dependence on the scan rate, double potential step experiments (see Figure 6) were performed; particularly, chronoamperometric curves were acquired after the application of a single potential step of potential starting from Ef (Pt oxide formation) in the range of 0.1 ÷ 2 V vs. Ag/AgCl to Ei (oxide stripping) set at −0.1 V; in this case, t2 was 1 s, and t1 was 5 s. These experiments were preferred over simple cyclic voltammograms since the conditions were more akin to the potential pulse sequence under study.
The double potential step experiments shown in Figure 6 clearly evidenced that both the chronoamperometric curves, the positive ones due to Pt oxide stripping and the negative ones due to Pt oxide formation, increased in terms of current values and time extension upon increasing the final potential Ef. Nevertheless, this concurrent increase was biased for the high values. Considering that the areas under these curves correspond to the charges due to reduction (positive curves) and oxidation processes (negative curves), plots of these charge values, as shown in Figure 7, better highlight this occurrence: in fact, the net charge due to the oxidation processes increased to a greater extent than that due to the reduction processes upon increasing the final potential starting from values higher than 0.7 V vs. Ag/AgCl. Since this charge hysteresis means that the produced Pt oxide persists onto the electrode surface (thus catalyzing water discharge) even after the reduction-stripping step, care should be taken in choosing the right timing of the potential pulse sequence: in fact, t1 should be sufficiently higher than t2, and the latter should be significantly lower to assure the almost complete removal of Pt oxide formed during the application of Ef to induce the electrophoretic movement of proteins; on the other hand, the value of the latter potential should be sufficiently high to promote efficient electrophoresis in the time scale of the deposition experiment while minimizing Pt oxide formation and hence gas evolution.
Further experiments performed using pulsed voltammetry permitted us to optimize the potential and timing parameters of the potential pulse sequence shown in Scheme 2. Using an Ei value of −0.1 V vs. Ag/AgCl, as previously optimized, it was found that an Ef value of 1.8 V was a good compromise between efficient and quick protein deposition and low dioxygen evolution. Regarding the timing of the potential pulse sequence, t2 was reduced at 12 ms (a value much lower than that used in galvanodynamic deposition), while t1 was set to 5 s; indeed, t1 could be set even higher, up to 20 s, assuring the complete absence of any side effects, but higher t1 values were not adequate for promoting sufficient electrophoresis/co-crosslinking in the time scale of the experiment in order to produce a deposit that had good mechanical properties and was firmly attached to the deposition electrode.
In these optimized conditions, the growth of the proteic layer somewhat resembled that already described for the galvanodynamic deposition technique. Even using this potentiodynamic approach, after just a few seconds, an opalescent foamy-like layer was evident onto the electrode surface; on the contrary, after less than 1 min and more, a visual inspection showed a nearly “double” proteic layer, with the inner layer much more compact and adherent to the electrode, while the outer layer was foamy and easily detachable via a simple water washing procedure.
Further insights were gained via an EQCM study. Figure 8 shows a typical EQCM profile of the growth of the proteic layer using this approach. Unlike the previous EQCM experiments (see Figure 5), after the application of the optimized potential pulse sequence at the deposition electrode, the frequency change abruptly varied in less than 1 min, reaching a plateau in less than 5 min: this feature suggested quick protein deposition of the layer, which, after a few minutes, quickly stopped growing, as confirmed via a visual inspection. Even if the growth rate was much greater (roughly 10−6 g/min) than that observed for the galvanodynamic deposition technique, the amount of the deposit formed at the plateau was significantly lower, estimated to be about 3.3 µg, with the deposit requiring less than 5 min to be formed. While a fast growth rate is surely desirable, unfortunately, it seems the growth of the proteic layer cannot be changed so that higher amounts are obtained. The reasons for this undesirable behavior are unknown: a severe ohmic drop due to the presence of a compact proteic layer, significantly reducing the electrical field around the electrode, may be tentatively suggested; even if a similar deposit is expected when employing the galvanodynamic approach, on the contrary, there, the increase in potential, as previously evidenced in this technique, should maintain an adequate electrical field to continue promoting satisfactory electrophoresis of proteins towards the electrode.
Finally, a further frequency change was observed after stopping the potential pulse application (see Figure 8), wherein the growth of the deposit somewhat continued even in the absence of any electrophoretic movement of the proteins. Anyway, this last frequency change, which was significantly lower, exhibited a slower rate and reached a plateau after a few minutes. Notably, this peculiar feature disappeared completely if the potential pulse sequence application was protracted for more than 30 min, even if a plateau had already been reached a while ago. This last piece of evidence suggested the chemical (as opposed to electrophoretic) nature of this frequency change: it is probable that the co-crosslinking kinetics were less intense than the electrophoretic kinetics, so the frequency change observed after the stop time in Figure 8 was due to residual co-crosslinking still acting after the end of the electrophoretic movement of the proteins. This feature was not evident in the galvanodynamic deposition approaches since the EPD growth was slower and the co-crosslinking was not limiting.
Even if the potentiodynamic approach apparently permitted the quick formation of a proteic deposit of a well-defined mass and thickness, which cannot induce further growth, the preliminary experiments showed that thicker deposits can be grown by varying some electrical parameters, like Ef, instead of increasing the deposition time. In this context, further experiments are ongoing in our laboratory.

4. Conclusions

EPD is a powerful and promising technique for enzyme immobilization but suffers from concomitating electrochemical processes, which, by inducing gas evolution at the deposition electrode, significantly depress the deposition process and physically damage the deposition layer. Since gas evolution due to water discharge also produces a severe pH drop at the deposit electrode/solution interface, this undesirable coupled process further damages the quality of the enzymatic layer under EPD production.
The present paper demonstrates that current or potential pulse techniques can be used to minimize these undesirable effects. After an appropriate study and optimization of the current or potential pulse sequences proposed herein, water discharge and dioxygen evolution were sufficiently minimized to allow for the production of intact proteic deposits. Notably, in the present study, EPD was also used, mainly as a novel tool for performing an electrophoretically assisted, classical enzyme immobilization technique like co-crosslinking, thus permitting the immobilization of the desired protein in situ, i.e., exclusively onto the deposition electrode. This novel approach permitted the coupling of the advantages arising from classical enzyme immobilization techniques, like high activity and stability of their enzymatic products, with those expected from electrochemically assisted deposition, i.e., the precise spatial control of the deposition process and the thickness of the deposit and the ability to coat any complexly shaped substrates as well.
Unfortunately, the potentiodynamic approach, as investigated herein, apparently did not permit the control of the mass of the deposit and its thickness, even if the quick formation of a proteic deposit was observed, a feature highly desirable in biosensor fabrication. Since preliminary experiments revealed that mass and thickness could also be controlled by varying some electrical parameters like the final potential, further studies are required to optimize this latter electrical perturbation method.
Of course, this original EPD approach, studied here and proposed for the first time, allowed us to fabricate novel amperometric biosensors. Further insights about their production and their analytical performances will be described elsewhere.

Supplementary Materials

The following supporting information can be downloaded at https://www.mdpi.com/article/10.3390/app14010212/s1. Scheme S1: The influence of ionic strength on (a) the double layer size of the proteins, (b) their electrophoretic retardation, and (c) their interaction for successful crosslinking; Figure S1: Chronopotentiometric curves observed under EPD galvanostatic deposition of GOD (0.5% w/v) and BSA (1% w/v) at GLU level of 2.5% v/v in phosphate buffer at pH 7, I 0.1 M. Curves (bottom to top) refer to 1, 3, 5, 7, and 9 mA/cm2 current densities, respectively; Figure S2: Cyclic voltammograms at the Pt deposition electrode in phosphate buffer at pH 7, I 0.1 M, at low (left panel) and high (right panel) scan rates (in both panels, inner curves refer to the lower scan rate values).

Author Contributions

Conceptualization, A.G.; methodology, A.G. and R.C.; investigation, A.G., R.C., G.B., A.D.C. and M.A.A.; resources, A.G.; data curation, A.G. and R.C.; writing—original draft preparation, A.G.; writing—review and editing, A.G.; visualization, A.G.; supervision, A.G.; project administration, A.G.; funding acquisition, A.G. All authors have read and agreed to the published version of the manuscript.

Funding

The Authors gratefully acknowledge financial support from Ministero dell’Istruzione, dell’Università e della Ricerca Italiana (MIUR).

Data Availability Statement

The data presented in this study are available in the article and in supplementary material here.

Acknowledgments

This work comes from the experimental contributions of Alessandra Salernitano’s thesis (1997–1998 academic year); she is fully acknowledged for her experimental skills.

Conflicts of Interest

The authors declare no conflicts of interest.

References

  1. Lacefield, W.R. Current Status of Ceramic Coatings for Dental Implants. Implant Dent. 1998, 7, 315–322. [Google Scholar] [CrossRef] [PubMed]
  2. Boccaccini, A.R.; Keim, S.; Ma, R.; Li, Y.; Zhitomirsky, I. Electrophoretic deposition of biomaterials. J. R. Soc. Interface 2010, 7, 177–180. [Google Scholar] [CrossRef] [PubMed]
  3. Seuss, S.; Boccaccini, A.R. Electrophoretic deposition of biological macromolecules, drugs, and cells. Biomacromolecules 2013, 14, 3355–3369. [Google Scholar] [CrossRef] [PubMed]
  4. Ammam, M. Electrochemical and electrophoretic deposition of enzymes: Principles, differences and application in miniaturized biosensor and biofuel cell electrodes. Biosens. Bioelectron. 2014, 58, 121–131. [Google Scholar] [CrossRef] [PubMed]
  5. Bakhshandeh, S.; Amin Yavari, S. Electrophoretic deposition: A versatile tool against biomaterial associated infections. J. Mater. Chem. B 2018, 6, 1128–1148. [Google Scholar] [CrossRef] [PubMed]
  6. Sikkema, R.; Baker, K.; Zhitomirsky, I. Electrophoretic deposition of polymers and proteins for biomedical applications. Adv. Colloid Interface Sci. 2020, 284, 102272. [Google Scholar] [CrossRef] [PubMed]
  7. Johnson, K.W. Reproducible electrodeposition of biomolecules for the fabrication of miniature electroenzymatic biosensors. Sens. Actuators B Chem. 1991, 5, 85–89. [Google Scholar] [CrossRef]
  8. Strike, D.J.; de Rooij, N.F.; Koudelka-Hep, M. Electrodeposition of glucose oxidase for the fabrication of miniature sensors. Sens. Actuators B Chem. 1993, 13, 61–64. [Google Scholar] [CrossRef]
  9. Johnson, K.W.; Allen, D.J.; Mastrototaro, J.J.; Morff, R.J.; Nevin, R.S. Reproducible Electrodeposition Technique for Immobilizing Glucose Oxidase. In Diagnostic Biosensor Polymers; Usmani, A.M., Akmal, N., Eds.; American Chemical Society: Washington, DC, USA, 1994; pp. 84–95. ISBN 9780841229082. [Google Scholar]
  10. Yang, Q.; Atanasov, P.; Wilkins, E. Development of needle-type glucose sensor with high selectivity. Sens. Actuators B Chem. 1998, 46, 249–256. [Google Scholar] [CrossRef]
  11. Quinto, M.; Koudelka-Hep, M.; Palmisano, F. Enzyme modified microband electrodes: Cross-talk effects and their elimination. Analyst 2001, 126, 1068–1072. [Google Scholar] [CrossRef]
  12. Matsumoto, N.; Chen, X.; Wilson, G.S. Fundamental studies of glucose oxidase deposition on a Pt electrode. Anal. Chem. 2002, 74, 362–367. [Google Scholar] [CrossRef] [PubMed]
  13. Ammam, M.; Fransaer, J. AC-electrophoretic deposition of glucose oxidase. Biosens. Bioelectron. 2009, 25, 191–197, Corrigendum in Biosens. Bioelectron. 2010, 25, 1856–1651. [Google Scholar] [CrossRef] [PubMed]
  14. Strike, D.J.; de Rooij, N.F.; Koudelka-Hep, M. Electrochemical techniques for the modification of microelectrodes. Biosens. Bioelectron. 1995, 10, 61–66. [Google Scholar] [CrossRef]
  15. Ammam, M.; Fransaer, J. Two-enzyme lactose biosensor based on β-galactosidase and glucose oxidase deposited by AC-electrophoresis: Characteristics and performance for lactose determination in milk. Sens. Actuators B Chem. 2010, 148, 583–589. [Google Scholar] [CrossRef]
  16. Ammam, M.; Fransaer, J. Highly sensitive and selective glutamate microbiosensor based on cast polyurethane/AC-electrophoresis deposited multiwalled carbon nanotubes and then glutamate oxidase/electrosynthesized polypyrrole/Pt electrode. Biosens. Bioelectron. 2010, 25, 1597–1602. [Google Scholar] [CrossRef] [PubMed]
  17. Ammam, M.; Fransaer, J. AC-electrophoretic deposition of metalloenzymes: Catalase as a case study for the sensitive and selective detection of H2O2. Sens. Actuators B Chem. 2011, 160, 1063–1069. [Google Scholar] [CrossRef]
  18. Xu, S.; Huang, X.; Chen, Y.; Liu, Y.; Zhao, W.; Sun, Z.; Zhu, Y.; Liu, X.; Wong, C.P. Silver Nanoparticle-Enzyme Composite Films for Hydrogen Peroxide Detection. ACS Appl. Nano Mater. 2019, 2, 5910–5921. [Google Scholar] [CrossRef]
  19. Preethichandra, D.M.G.; Mala Ekanayake, E.M.I.; Onoda, M.; Kaneto, K. Performance Enhancement of Polypyrrole Based Nano-Biosensors by Different Enzyme Deposition Techniques. In Modern Sensing Technologies, Smart Sensors, Measurement and Instrumentation 29; Mukhopadhyay, S.C., Jayasundera, K.P., Postolache, O.A., Eds.; Springer International Publishing: Berlin/Heidelberg, Germany, 2019; Volume 29, pp. 213–229. ISBN 9783319995403. [Google Scholar]
  20. Shimomura, T.; Itoh, T.; Sumiya, T.; Hanaoka, T.A.; Mizukami, F.; Ono, M. Amperometric detection of phenolic compounds with enzyme immobilized in mesoporous silica prepared by electrophoretic deposition. Sens. Actuators B Chem. 2011, 153, 361–368. [Google Scholar] [CrossRef]
  21. Schlesinger, M.; Paunovic, M. (Eds.) Modern Electroplating; Wiley: Hoboken, NJ, USA, 2010; ISBN 9780470167786. [Google Scholar]
  22. Ammam, M.; Fransaer, J. A study on electrodeposition of glucose oxidase from low conductivity solutions. Electrochim. Acta 2010, 55, 9125–9131. [Google Scholar] [CrossRef]
  23. Im, D.M.; Jang, D.H.; Oh, S.M.; Striebel, C.; Wiemhöfer, H.D.; Gauglitz, G.; Göpel, W. Electrodeposited GOD/BSA electrodes: Ellipsometric study and glucose-sensing behaviour. Sens. Actuators B Chem. 1995, 24, 149–155. [Google Scholar] [CrossRef]
  24. Zaborsky, O. Immobilized Enzymes; CRC Press: Cleveland, OH, USA, 1973; ISBN 9780878190164. [Google Scholar]
  25. Kennedy, J.F.; White, C.A. Principles of immobilization of enzymes. In Handbook of Enzyme Biotechnology; Wiseman, A., Ed.; Ellis Horwood Lim., John Wiley & Sons: Hoboken, NJ, USA, 1985; pp. 147–207. ISBN 0133829200. [Google Scholar]
  26. Guerrieri, A.; De Benedetto, G.E.; Palmisano, F.; Zambonin, P.G. Electrosynthesized non-conducting polymers as permselective membranes in amperometric enzyme electrodes: A glucose biosensor based on a co-crosslinked glucose oxidase/overoxidized polypyrrole bilayer. Biosens. Bioelectron. 1998, 13, 103–112. [Google Scholar] [CrossRef] [PubMed]
  27. Guerrieri, A.; De Benedetto, G.E.; Palmisano, F.; Zambonin, P.G. Amperometric sensor for choline and acetylcholine based on a platinum electrode modified by a co-crosslinked bienzymic system. Analyst 1995, 120, 2731–2736. [Google Scholar] [CrossRef]
  28. Guerrieri, A.; Palmisano, F. An Acetylcholinesterase/Choline Oxidase-Based Amperometric Biosensor as a Liquid Chromatography Detector for Acetylcholine and Choline Determination in Brain Tissue Homogenates. Anal. Chem. 2001, 73, 2875–2882. [Google Scholar] [CrossRef] [PubMed]
  29. Guerrieri, A.; Cataldi, T.R.I.; Ciriello, R. The kinetic and analytical behaviours of an l-lysine amperometric biosensor based on lysine oxidase immobilised onto a platinum electrode by co-crosslinking. Sens. Actuators B Chem. 2007, 126, 424–430. [Google Scholar] [CrossRef]
  30. Guerrieri, A.; Ciriello, R.; Cataldi, T.R.I. A novel amperometric biosensor based on a co-crosslinked l-lysine-α-oxidase/overoxidized polypyrrole bilayer for the highly selective determination of l-lysine. Anal. Chim. Acta 2013, 795, 52–59. [Google Scholar] [CrossRef] [PubMed]
  31. Ciriello, R.; De Gennaro, F.; Frascaro, S.; Guerrieri, A. A novel approach for the selective analysis of L-lysine in untreated human serum by a co-crosslinked L-lysine–α-oxidase/overoxidized polypyrrole bilayer based amperometric biosensor. Bioelectrochemistry 2018, 124, 47–56. [Google Scholar] [CrossRef] [PubMed]
  32. Bucur, R.V.; Bartes, A.; Mecea, V. Kinetic measurements on a stationary disk electrode in a uniformly rotating fluid (SDERF)—I. The limiting diffusion current in the Fe(CN)4−6-Fe(CN)3−6-system. Electrochim. Acta 1978, 23, 641–646. [Google Scholar] [CrossRef]
  33. Gabrielli, C.; Keddam, M.; Torresi, R. Calibration of the Electrochemical Quartz Crystal Microbalance. J. Electrochem. Soc. 1991, 138, 2657–2660. [Google Scholar] [CrossRef]
  34. Marx, K.A. Quartz crystal microbalance: A useful tool for studying thin polymer films and complex biomolecular systems at the solution-surface interface. Biomacromolecules 2003, 4, 1099–1120. [Google Scholar] [CrossRef]
Figure 1. Graphic representation of ED and EPD processes. Upper panels refer to ED and EPD processes, while lower panels refer to the electrophoretic-protein-deposition-assisted in situ co-crosslinking enzyme immobilization scheme proposed herein. Electrodes are represented by the large rectangles; circles and ellipses represent the protein and the enzyme molecules, respectively, whose concentration profiles from the electrode surface are shown on the right of each panel; and upper and lower right panels illustrate the concentration profiles of the molecules when an electrical field is applied between electrodes (for the case of negatively charged molecules).
Applsci 14 00212 g001
Figure 2. Potential attained at the deposition electrode for each constant current application in galvanostatic experiments, as shown in Figure S1; for each experiment, the potential was sampled at 120 s. Inset: typical chronopotentiometric curve observed for galvanostatic deposition experiments; current density: 1 mA/cm2.
Applsci 14 00212 g002
Scheme 1. Schematic representation of the current pulse sequence applied at the deposition electrode in galvanodynamic experiments. I represent the maximal current value of the pulse, t1 denotes the pulse inactive time, and t2 denotes the pulse active time, i.e., the pulse width of the waveform.
Applsci 14 00212 sch001
Figure 3. Chronopotentiometric curves at the deposition electrode due to the application of current pulse sequence (see Scheme 1) for a fixed duty cycle (t1 5 s, t2 0.5 s) while varying I: (a) −0.5 mA/cm2, (b) −2 mA/cm2, and (c) −5 mA/cm2.
Applsci 14 00212 g003
Figure 4. Chronopotentiometric curves at the deposition electrode due to the application of current pulse sequence (see Scheme 1) at fixed maximal current I (2 mA/cm2) while varying t1 and t2: (a) t1 5.3 s, t2 0.2 s, (b) t1 5 s, t2 0.5 s, and (c) t1 4 s, t2 1.5 s.
Applsci 14 00212 g004
Figure 5. Resonance frequency changes at the deposition electrode during the application of the galvanodynamic current pulse sequence optimized in this study. Arrows labeled start and stop represent the timing of current pulse application at the electrode. (a): only phosphate buffer solution (pH 7, I 0.1 M); (b,c): GOD 0.5% w/v, BSA 1% w/v, and GLU 2.5% v/v in phosphate buffer solution (pH 7, I 0.1 M); (b,c) differing exclusively in the deposition time.
Applsci 14 00212 g005
Scheme 2. Schematic representation of the potential pulse sequence applied at the deposition electrode in potentiodynamic experiments. Ei and Ef represent the initial and final potential values of the pulse step, respectively, while t1 and t2 denote the durations of Ei and Ef application.
Applsci 14 00212 sch002
Figure 6. Typical chronoamperometric curves resulting from double potential step experiments at the Pt deposition electrode in phosphate buffer ay pH 7, I 0.1 M. Ei was −0.1 V vs. Ag/AgCl; t2 is 1 s and t1 is 5 s in both panels; Ef was in the range 0.1 ÷ 1 V vs. Ag/AgCl (left panel) and in the range of 1.3 ÷ 2 V vs. Ag/AgCl (right panel). Outer curves in both panels correspond to higher voltage values.
Applsci 14 00212 g006
Figure 7. Charge due to the oxidation processes (upper curve) and reduction processes (lower curve) versus the final potential Ef (V vs. Ag/AgCl) as obtained by integrating the areas of the chronoamperometric curves in Figure 6. Each measurement refers to 5 replicates.
Applsci 14 00212 g007
Figure 8. Resonance frequency change at the deposition electrode during the application of the potentiodynamic current pulse sequence optimized in this study. Arrows labeled start and stop represent the timing of potential pulse application at the electrode.
Applsci 14 00212 g008
Disclaimer/Publisher’s Note: The statements, opinions and data contained in all publications are solely those of the individual author(s) and contributor(s) and not of MDPI and/or the editor(s). MDPI and/or the editor(s) disclaim responsibility for any injury to people or property resulting from any ideas, methods, instructions or products referred to in the content.

