Abstract
This paper’s aim is to assess the rail wear evolution of railway tracks under mixed traffic conditions for sharp curves. Field investigations were conducted over a period of five years, at 800 points on a rail track, for two curves that underwent maintenance interventions: sleeper and rail replacements during measurements. Lateral and vertical wear measurements were monitored with mechanical instruments, and Prokon and Sap simulations were performed in order to determine the bearing capacity of the rail at different stages of wear. The results obtained after five years of investigation show wear speed propagation on the outer rail of small-radius curves as well as the bending moments and admissible stress variation. At more than 18% of the studied points, lateral wear exceeded the maximum admissible limit, showing a faster propagation speed on the outer rail compared to the vertical wear rate.
1. Introduction
Railway tracks and railway vehicles constitute a mechanical system where these act reciprocally and depend on each other. The stresses that the track, as a whole, is subjected to depend on the movement of the rolling stock: the traffic speed, the constructive characteristics of the rolling stock and the track, their degree of maintenance and wear, and the elasticity of the track in the vertical and horizontal plane. The dynamic of the rail–wheel interaction is essential to determine and understand the conditions that the rail–wheel system is subjected to [1]. Independent of the movement of trains, a series of other forces act on the track caused by environmental conditions (wind, temperature, etc.) [2,3]. Wheel–rail contact and its components represent the basis of railway vehicle dynamics, and this theory has been developed over the years.
The rail is a structural element in the railway superstructure that provides the running surface, carries the vertical and horizontal vehicle forces and distributes these via track grids and the ballast bed into the subsoil, ensuring high passenger comfort and guiding elements to avoid derailment; its life cycle is influenced by track maintenance works and loads [2,3]. The wheel is subjected to a combination of vertical, lateral and horizontal loads as a result of wheel–rail interaction and thermal loading from temperature variations. Tangential and normal forces can lead to uneven oxidative and fatigue rail wear [4], since wear and rolling contact fatigue can damage both the wheels and rails, becoming more and more severe with increased running speeds and axle loads [5]. In Romania, where this study was conducted, the rail temperature varies between −30 and +60 °C. The life span of the rail is influenced by line geometrical defects on the horizontal and vertical planes, rail and wheel defects and mobile loads, all contributing to wear acceleration and the degradation of the entire superstructure.
Due to complex terrain characteristics in the Transylvanian mountains, many existing railway tracks include small-radius curves, where the wheel–rail interaction is subjected to excessive rail wear and defect failure, which are among the primary causes of rail renewal in sharp curved sections. These particular sections are difficult to manage from a maintenance point of view, and it is also difficult to predict rail wear evolution in order to estimate the renewal period. Romanian standard I314 [6] requires rail wear, gauge and level measurements twice a year for curves with a radius below 300 m.
There are numerous research papers on rail–wheel interaction and wear prediction models, but there are limited in-field investigations on lateral and vertical rail wear on small-radius curves with a radius below 300 m.
In [7], Jeong et al. present an analysis of the effect of rail head wear on rail strength and structural integrity, considering vertical rail wear and lateral rail wear separately and calculating the bending moments and stresses for both cases. The research considers rail strength as either resistance to permanent plastic bending or resistance to failure, indicating rail wear limits using the ratio between the worn rail bending moment and the new rail bending moment separately for vertical wear and lateral wear situations.
Research Purpose
Given the above-described context, the purpose of this paper is to evaluate rail wear propagation on small-radius curves due to mixed traffic, monitored over a period of five years, on two curves with a radius of 275 m and 280 m. The main research questions this study sought to answer were: How does rail wear progress over time for small-radius curves, and how does this influence the bending moment and stresses on the rail?
The measurements were made during maintenance interventions on the rail superstructure: sleeper and rail replacements. The results show the evolution of rail wear on the x–x and y–y axes, as well as the bending moments and stresses using on-site measurements and simulations, providing technical information regarding rail wear evolution based on rail stresses for worn rails considering vertical and lateral wear simultaneously.
2. Materials and Methods
The first theory on wheel–rail contact was the two-dimensional theory of Carter [8], where the wheel is approximated with a cylinder and the rail by an infinite half space. Carter’s theory is capable of predicting the frictional losses in the driving wheel. Later, in approximately 1956, Parker and Johnson worked on the three-dimensional theory using the Herz solution and demonstrated that, in fact, the contact shape between the wheel and rail has an elliptical form. Next, the motion of the wheel was presented in relation to the rail, where both were considered rigid, aiming for the generalization of Carter’s notion of creepage. The linear theory was generalized by Kalker in 1967 [9], considering the relatively rigid slip small, the hertzian elliptical shape of the contact between rail and wheel and that the rolling that takes place following the direction of one of the ellipsis axes. In 1984, Shen, Hedrick and Elkins published their theory on vehicle motion dynamics without flanging [10] that can be used for vehicle motion simulation with large motions without flanging and an elliptical contact area.
2.1. Rail Wear
The material loss that the rail profile is subjected to, because of the high temperatures and substantial stress from wheel–rail contact, as a result of the rolling-sliding motion, is called wear [11,12].
The wear calculations of the railway wheels can be determined by dividing the phenomenon into two categories: corrugation of the rails and wheels taking into consideration the un-roundness of the wheels and, second, the rail and wheel profiles, which are considered perfectly cylindrical and perfectly round, respectively [13]. The Archard wear law [14] is often used in studies for wear characteristics [15,16] with the wear rate being expressed as the wear loss per unit sliding distance.
Rail wear can be categorized into three main types: wear at the top of the rail (vertical wear), wear of the gauge (lateral wear), or a combination of both, which is known as head and side wear. In sharp curves, the most significant form of wear is gauge wear on the lower rail, which escalates with increasing running speeds [17]. In these curves, the wheel flange makes contact with the gauge corner of the rail head, leading to abrasive wear [18]. Understanding the rail's behavior is crucial, focusing on material loss or displacement. The stresses on the rail arise from contact stresses, bending stresses, and thermally induced stresses. Managing contact stresses is essential as they are linked to fatigue and wear. The primary wear mechanisms in wheel–rail sliding or rolling contacts encompass adhesive, abrasive, fatigue-driven, thermal, and oxidative wear processes [18,19].
Rail wear is influenced by a multitude of factors, including axle load, rail profile, train speed, material properties of wheels and rails, traffic type, track curvature, line type (straight or curved), surface condition of the contact between the rail and wheel, lubrication, and various other influences. This wear can lead to alterations in the contact surface between the rail and wheel, resulting in surface deterioration, changes in contact geometry, and track instability that may culminate in derailments. Material loss due to wear leads to modifications in the rail cross-section, necessitating maintenance work and replacement activities [12,20,21,22,23]. Wear is commonly associated with frictional work and is influenced by various factors such as the steel grade of the rail and wheel, the compatibility between the rail and wheel materials, the friction coefficient, normal contact stresses, relative slips, the design, construction, and maintenance of vehicles, tracks, rail and wheel profiles, as well as surface treatments and environmental conditions (e.g., humidity, corrosion) [24,25,26,27]. The distribution of traffic loads on the rail occurs over an approximate surface area of 100 mm² with contact stresses significantly high due to loads ranging from 50 to 200 KN/wheel. The rail experiences normal contact pressure, tangential forces, thermal stresses, and residual stresses.
Given the importance of wear in rail service, it can lead to various track-related issues, including gauge widening, elevated rail–wheel forces, and compromised vehicle dynamics due to rail profile loss and material deterioration in strength and rigidity. The literature categorizes wear as mild, severe, or catastrophic [17]. Research has shown that the wear rate increases linearly with the maximum pressure and friction coefficient. For instance, Alwahdi et al. [28] concluded that the wear rate is directly proportional to the traction coefficient and creepage.
2.2. Rail Wear Diagnostics Methods
To ensure optimal technical conditions, quality, and safety of the railway superstructure, specific methods are employed for periodic diagnosis and examination. Given that the wheel–rail system is consistently subjected to high loads, the timely detection of rail cracks, fractures, wear, plastic deformations, and other potential failures is crucial to prevent train derailments, overturning, or other significant accidents [29]. Additionally, in sharp curves, rail corrugation is a prevalent wear phenomenon on the rail surface, serving as a primary contributor to noise and vibration propagation [30].
The diagnosis of rail conditions can be determined through various methods [31]:
- Visual methods: These are applicable to rail track elements that can be visually monitored in either a static or dynamic state.
- Geometric methods: These methods involve angle measurements and lengths and are used for operational and initial diagnostic assessments.
- Graphic-computational and computational methods: These techniques focus on the structural and geometrical arrangement of the track, particularly in curves.
Physical non-destructive methods: These methods are employed for detecting hidden rail errors and deficiencies without causing any damage.
2.3. Rail Track Geometry for Spatial Curves
A spatial railway curve is defined by three coordinates: x, y, and z, with z representing the superelevation. The trajectory of a vehicle on a spatial curve is illustrated in Figure 1. The spatial 3D curve, denoted as AT (alignment–transition curve point)–TC (transition curve–circular curve point), projects onto the vertical plane (xoz) to depict the superelevation and onto the horizontal plane (xoy) to represent the x and y coordinates, where y is a function of x. The trajectory of the railway axis is denoted as r, and the curvature is expressed as ρ.
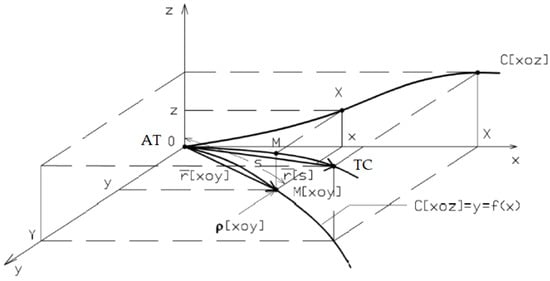
Figure 1.
Spatial railway curve.
The interaction between the rail and wheel contact is significantly affected by factors such as rail corrugation, which involves periodic surface irregularities at distinct wavelengths, as well as wear in rail and wheel profiles, time-variable creepage, and contact geometries [32].
2.4. Rail Measurements
The investigation into the progression of rail wear involved conducting measurements on sharp curved tracks, specifically focusing on the outer rail of rail type 65 with the Romanian Vignole profile. The rail wear assessment utilized a dedicated rail wear measuring device, as depicted in Figure 2. This device is positioned on the rail base and employs contact needles to measure both vertical and lateral rail wear. The obtained values from measurements on the rail head and gauge corner are documented on a rail wear measuring form. Rail type 65 is characterized by a weight of 65 kg/m, a height of 17.2 cm, and additional properties that are detailed in Table 1.
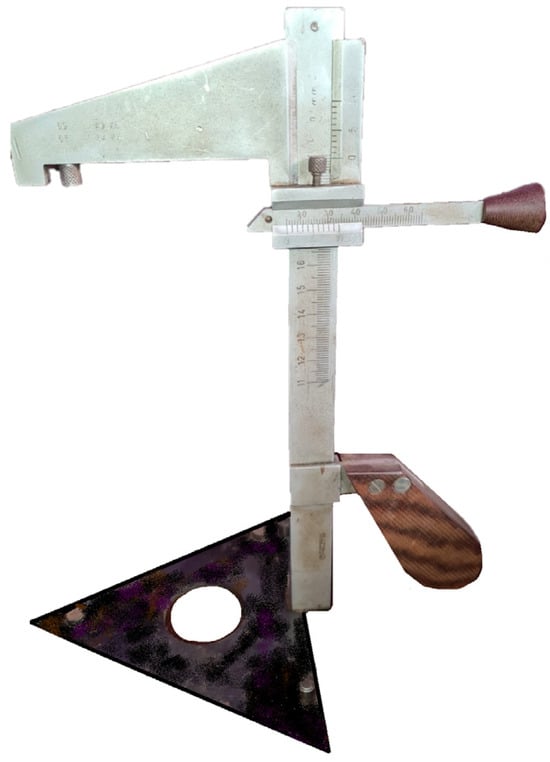
Figure 2.
Rail wear mechanical measuring device.

Table 1.
Rail properties.
The chemical composition of Romanian rail type 65, in addition to iron, includes the following elements: C 0.60%, Mn 1.20%, Si 0.35%, P 0.03%, S 0.03%. According to Romanian regulations I314 [7], which govern wear measurements, specific procedures are mandated based on time and traffic loads, particularly at characteristic points of curves and locations where the gauge and level are assessed for the outer rail:
For curves with a radius exceeding 300 m, an annual wear measurement is required irrespective of traffic loads.
For curves with a radius less than or equal to 300 m and annual loads up to 15 million tons, biannual measurements are mandatory in the March–April and September–October intervals.
For curves with a radius less than or equal to 300 m and annual loads exceeding 15 million tons, three measurements per year are stipulated in March, July, and October.
On alignment sections, an annual wear measurement is mandated.
In compliance with Romanian standards, the vertical wear limit for rail type 65 is 9 mm for speeds over 100 km/h, 11 mm for speeds below 100 km/h, and the horizontal wear limit is set at 13 mm. If wear values exceed these limits, the worn rail section should be replaced. Figure 3 illustrates the specific points where wear measurements were conducted.
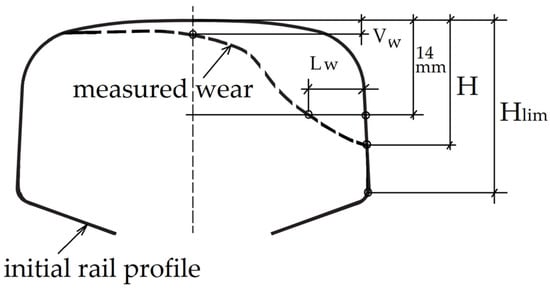
Figure 3.
Rail wear measuring points.
For this research, a comprehensive dataset comprising 800 points was collected over a five-year period: from 2019 to 2023. Measurements were conducted semi-annually, focusing on all designated points along curves. A cord length of 20 m was utilized, as illustrated in Figure 4. The curves studied had a radii of 275 m and 280 m.
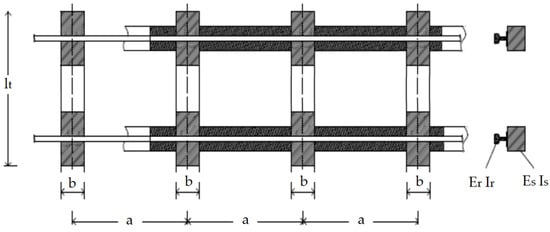
Figure 4.
Fictive beam considered for rigidity length L calculus.
Utilizing the data acquired from rail measurements, tables were generated to document wear information, including:
- Track section;
- Kilometer of the measured section;
- Nature of the section (alignment or curve) with the radius value and curve orientation (left/right);
- Characteristic points of the curve;
- Lateral rail wear (mm);
- Vertical rail wear (mm);
- Date of the measurements;
- Superelevation (mm).
Table 2 displays the attributes of the rail observed in the two examined curves. Curve 1 utilizes timber sleepers beneath the rails, which is a practice mandated by Romanian standards for tight curves and joint railway tracks, despite the limited prevalence of timber sleepers. Despite having satisfactory strength and stiffness, timber sleepers exhibit a shorter lifespan compared to their concrete counterparts [33,34,35,36]. In contrast, curve 2 is equipped with concrete T17 type sleepers.
Table 2.
Studied curve’s characteristics.
Sleepers embedded in ballasted tracks contribute significantly to track stiffness. Pre-stressed concrete sleepers are preferred for their durability, while timber sleepers are chosen for their flexibility [34,35,36,37,38]. The bending stiffness is a crucial parameter for effective load distribution [37].
In both instances, after the first quarter of 2019, all sleepers were replaced with the same type. Similarly, after the first quarter of 2021, rails were replaced on both curves due to a wear rate exceeding admissible limits. Rail wear was measured both before and after the replacements.
2.5. Rail Bending Moments and Bearing Capacity
Following the rail wear measurements, the subsequent step involves calculating the bearing capacity of the rail affected by wear along the length of the studied curves. The rail bending stress is determined for the rail-sleeper frame, treated as a beam on an elastic foundation, using the Zimmermann theory. The virtual beam considered in the calculations is illustrated in Figure 4 and Figure 5. This method, initially developed by Winkler (1867) [39] and Zimmermann (1888) [40], is widely employed for its simplicity in rail design. Other approaches based on this model, such as those by Talbot (1918–1934) [41,42], Timoshenko and Langer (1923) [43], and Clarke (1957) [44], have been developed.
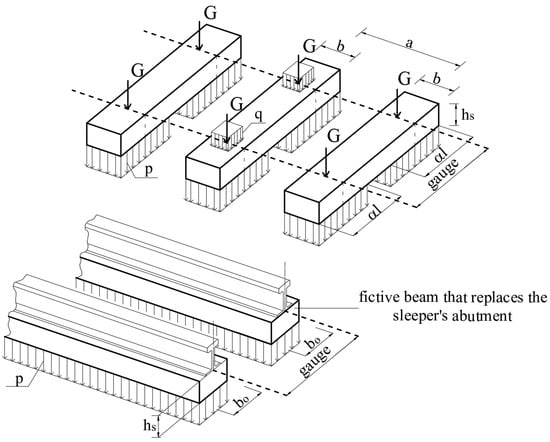
Figure 5.
Loads distribution from wheel to the base of the sleeper, using the fictive beam.
Given the escalating traffic loads, the choice of the ultimate strength of the rail steel significantly influences the operational life of the rail in service. Dynamic axle loads necessitate the use of specific coefficients to account for the rail load under conditions of moving vehicles at speed. Dynamic loads can elevate rail stress values beyond static conditions due to factors such as lateral bending of the rail, eccentric load of the rail, load transfer from the wheel to the rail-sleeper frame, vertical impact of the wheel on the rail due to speed, and geometric imperfections and irregularities in the track, wheel, and rail profiles [45].
Figure 5 illustrates the virtual beam used for calculating bending moments, leading to the determination of the equivalent length L.
In the case of multiple loads, the determination of bending moments can be achieved through the utilization of the influence line depicted in Figure 6.
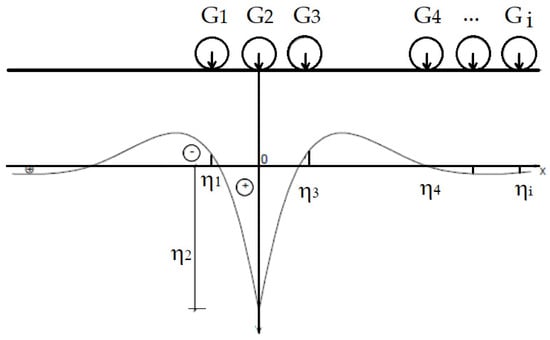
Figure 6.
Influence line for bending moment calculus.
Bending moments in the rail using the influence line method can be expressed as:
The equivalent length L can be determined using Equation (2):
2.6. Data Collection of Rail Wear, Level, Gauge, and Superelevation
Twice a year, measurements were conducted for a duration of five years on small radii curves subjected to mixed traffic, assessing both vertical and lateral rail wear. The measuring points are highlighted in Figure 7, and all observed curves feature the incorporation of transition curves and a central circle in their construction. Throughout the measurements, maintenance activities were carried out with a focus on monitoring the evolving characteristics of wear and geometric curves over time.
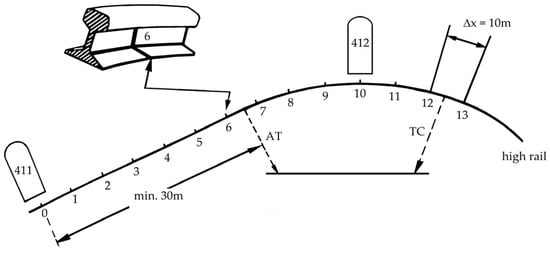
Figure 7.
Rail measuring points along the curve’s length.
The rails employed on the examined curves belong to type 65, featuring a rail inclination of 1:20. Each curve underwent measurement at 35 to 42 points; the quantity was contingent on the length of the specific curve.
Here, AT denotes the alignment transition point, and TC designates the transition curve point. Figure 8 showcases the initial rail profile type 65 alongside the maximum wear profile identified during the investigations. Relevant properties for both profiles are detailed in Table 3.
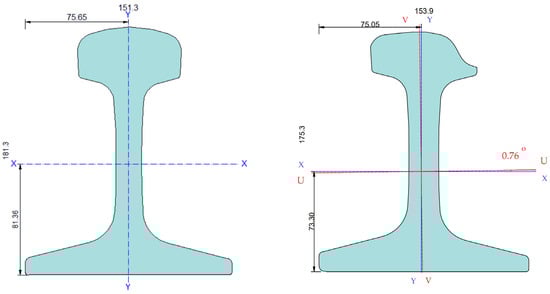
Figure 8.
Initial rail type 65 with no wear and the maximum wear situation found on the 2 curves studied.
Table 3.
New rail and rail most advance wear rate rail properties.
Measurements for R 275 m curve, for time interval 2019–2023, for vertical wear (Vw), are shown in Table 4.
Table 4.
Vertical wear for R275 curve.
Measurements for R 275 m curve, for time interval 2019–2023, for lateral wear (Lw), are shown in Table 5.
Table 5.
Lateral wear for R 275 m curve.
3. Results
Figure 9, Figure 10, Figure 11, Figure 12, Figure 13, Figure 14, Figure 15 and Figure 16 offer a comparison of the wear propagation rate throughout the five-year study on the two curves, featuring discernible values post rail replacement. Each measured point on the outer rail illustrates both lateral and vertical wear rates, reflecting an average speed increase of 1 mm/year.
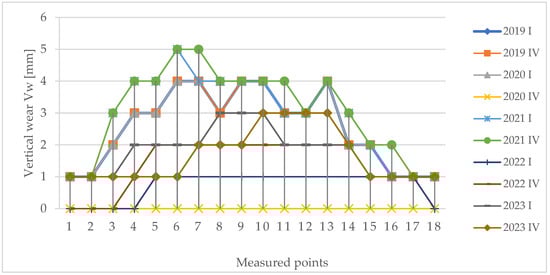
Figure 9.
Vertical wear for curve 1, years 2019–2023, first and fourth quarter, on the curve’s length.
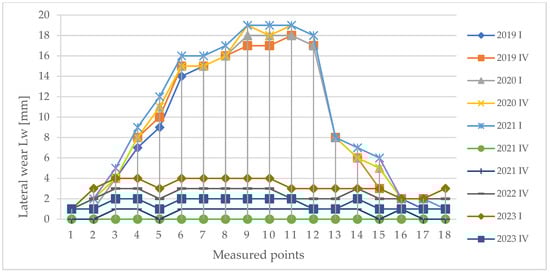
Figure 10.
Lateral wear for curve 1, years 2019–2023, first and fourth quarter on the curve’s length.
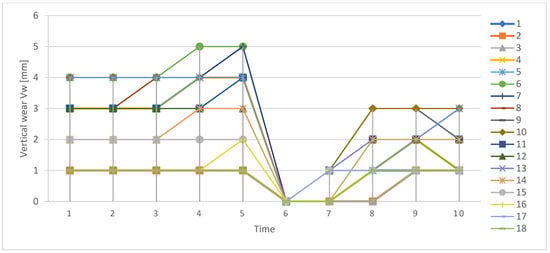
Figure 11.
Evolution of vertical wear for curve 1, years 2019–2023, over time, for the 18 measured points.
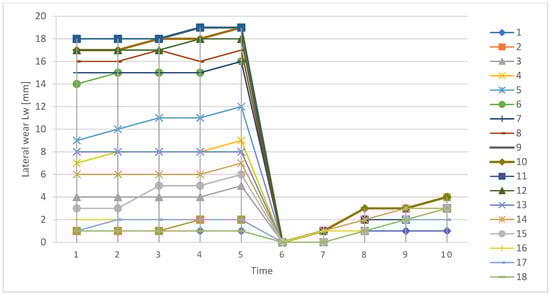
Figure 12.
Evolution of lateral wear for curve 1, years 2019–2023, over time, for the 18 measured points.
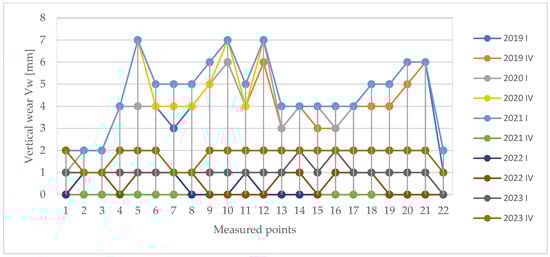
Figure 13.
Vertical wear for curve 2, years 2019–2023, first and fourth quarter on the curve’s length.
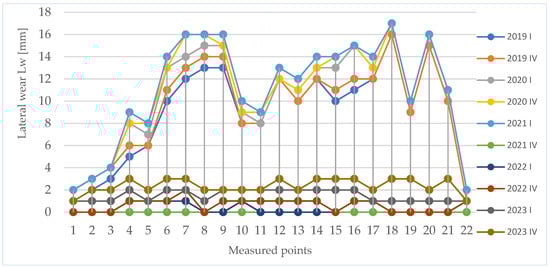
Figure 14.
Lateral wear for curve 2, years 2019–2023, first and fourth quarter, on the curve’s length.
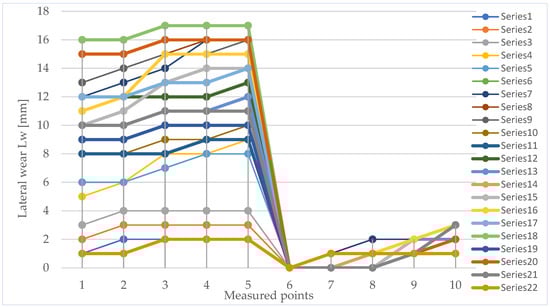
Figure 15.
Evolution of vertical wear for curve 2, years 2019–2023, over time, for the 22 measured points.
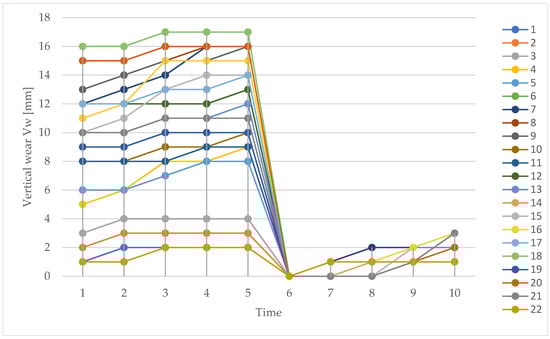
Figure 16.
Evolution of lateral wear for curve 2, years 2019–2023, over time, for the 22 measured points.
Taking into account the wear variations at the same measured points over time, Figure 11 and Figure 12 illustrate the vertical and lateral wear variations for curve 1, while Figure 13 and Figure 14 depict the corresponding variations for curve 2.
The data obtained for the new rail profile and for six points along the curve's length, considering the measured lateral and vertical wear over specific time intervals, are summarized in Table 6.
Table 6.
New rail profile type 65 with perfect condition, without wear, for timber and concrete sleepers.
The stress analysis conducted in this paper focuses on determining bending stresses for the studied curved track, accounting for both lateral and vertical rail wear variations along the lengths of the two curves. The decrease in bending rigidity of the rail due to wear is a key consideration. Given the variations in ballast bed properties from a new line to a track compacted by traffic, the track response differs. To address this, the modulus of the ballast bed was treated as a variable during the time intervals when measurements were recorded.
Table 7 displays the values obtained for the outer curve line, with data from the initial measurements in 2019 I, considering five points along the length of the studied curve 1 with timber sleepers. The same parameters were calculated for these points across all time intervals studied in this paper, resulting in a variation diagram for bending moment and unitary efforts when compared with the initial rail profile parameters.
Table 7.
Rail profile type 65, outer rail, R 275 m curve, timber sleepers, wears measured on 2019 I.
The values considered for bending moments and admissible stresses were calculated using SAP2000 19.0.0 software, and the results are represented in Figure 17 and Figure 18.
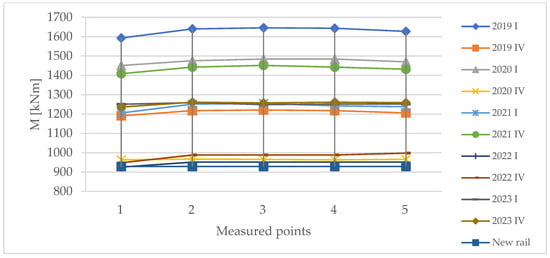
Figure 17.
Bending moments evolution for the most advanced wear case, curve 1, over time.
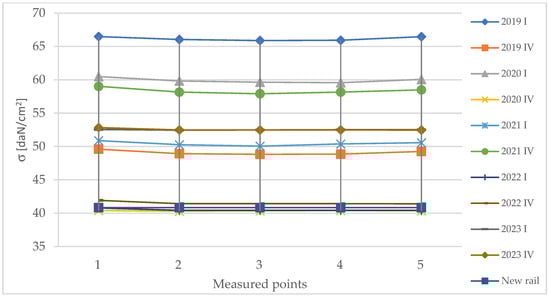
Figure 18.
Admissible stress evolution for the most advanced wear case, curve 1, over time.
Admissible stresses were determined using the bending moment M for each measured point and the resistance modulus W:
The calculation of bending moments and admissible stresses took into account the characteristics of the ballast bed, incorporating the ballast bed coefficient (C). Following the replacement of sleepers and rails, the ballast bed coefficient reached its maximum value of 5 daN/cm2. However, during the subsequent biannual investigations, this coefficient progressively decreased to a minimum of 3 daN/cm2.
4. Discussion
All measurements were conducted at consistent locations on the outer rail over a span of five years. It is crucial to note the need for sleeper replacement after the first quarter of 2019 and rail replacement after the first quarter of 2020. Rail wear measurements were taken both before and after these replacements with the replaced sleepers and rails being identical to the original ones. Diagrams depicting lateral and vertical wear illustrate the propagation of wear post-rail replacement, along with variations in bending moments and stresses.
The maximum allowable wear values for speeds below 100 km/h are 13 mm for lateral wear and 11 mm for vertical wear. Vertical wear values within and exceeding the limits were zero, while lateral wear values beyond the maximum limit were recorded for 75 points (18.75% of measured points). The highest wear values observed during the five-year monitoring period were 7 mm for vertical wear (curve 1) and 19 mm for lateral wear (curve 2). No maintenance activities were carried out on the rails during the investigations.
The two curves under study differ in sleeper type: timber sleepers for curve 1 and concrete sleepers for curve 2. Railway sleepers play a crucial role in distributing loads from the wheel to the rail and, subsequently, to the ballast bed. Their bending stiffness is vital for this function, with low stiffness risking rail fatigue and high stiffness causing impact loads and vibrations. Timber sleepers offer adaptability and flexibility, while concrete sleepers, though durable, possess excessive bending stiffness, leading to strain, overloading, and changes in ballast bed grains.
Maintenance interventions occurred over the years for both curves: sleeper replacement between 2019 I and 2019 IV (with the same type), and rail replacement between 2021 I and 2021 IV.
Contact stresses, generally compressive (except for transverse shearing stress), contribute to rail head fatigue damage. Significant wear alters the wheel–rail contact area, leading to gauge widening, especially on the outer rail. The bending moment increases significantly over the new rail situation, and lateral wear over admissible limits can reduce material capacity to support higher contact stresses.
Both curves, experiencing mixed traffic (approximately 50% passenger trains and 50% freight trains), underwent wear measurements solely on the outer rail. Considering the distinct behavior of passenger and freight traffic, outer rail wear is attributed to passenger traffic. Despite a superelevation higher than actual traffic conditions, wear-induced speed limitations were imposed, maintaining the superelevation at initial values. High superelevation deficiencies result in increased centrifugal unbalanced force, leading to elevated pressure, lateral thrust, and wear on the outer rails.
Effective maintenance of the rail superstructure is crucial for keeping wear within acceptable limits. Due to wear rates, speed restrictions were enforced for safety, causing delays. Proposed measures include employing high-resistance rail types in small radius curves, rail lubrication, and periodic rail geometry reconfiguration.
5. Conclusions
The primary research inquiries—regarding the progression of rail wear over time in small radius curves and its impact on bending moments and stresses in both vertical and lateral rail wear—can be addressed as follows:
Bending Moments and Unitary Effort:
In the most advanced wear situation (Lw 4 mm, Vw 17 mm), the bending moment value compared to the new rail situation increased by 63%, while the unitary effort for the most advanced rail wear, compared to the new rail situation, increased by 78%—both within admissible limits.
Notably, a sleeper change (2019 I–2019 IV) requiring ballast bed tamping resulted in a reduction in bending moments by up to 25%, compared to the initially registered 63%, and unitary efforts decreased by up to 35%, compared to the initially registered 78%. This indicates a moderate 40% decrease in efforts due to ballast bed tamping under conditions of maximum rail wear rates.
Lateral and Vertical Wear Progression:
Over the five-year observation period, lateral wear in small radius curves exhibited a faster propagation rate than vertical wear.
Within a one-year timeframe, wear propagation ranged from 0 mm to a maximum of 2 mm. Lateral wear developed at a significantly quicker pace than vertical wear for both curves.
As the wear stabilized, values became consistent along the transition curve's length. The wear position gradually shifted to the lower part of the rail side on the circular curve section, reaching values exceeding admissible limits after attaining levels of 13 mm.
Author Contributions
Conceptualization, M.C. and G.K.; methodology, M.C.; software, A.D.D.; validation, M.L.D. and V.M.; formal analysis, C.F.; investigation, M.C.; resources, G.K.; data curation, A.D.D.; writing—original draft preparation, V.M.; writing—review and editing, M.L.D.; visualization, V.M.; supervision, A.D.D.; project administration, M.C.; funding acquisition, M.L.D. All authors have read and agreed to the published version of the manuscript.
Funding
The APC was funded by the Technical University of Cluj-Napoca.
Institutional Review Board Statement
Not applicable.
Informed Consent Statement
Not applicable.
Data Availability Statement
Data can be requested by researcher via email: madalina.ciotlaus@infra.utcluj.ro. The data are not publicly available due to privacy.
Conflicts of Interest
The authors declare no conflict of interest.
Nomenclature
| Vw | vertical wear |
| Lw | lateral wear |
| H | maximum height of the wear |
| Hlim | rail head height |
| G | wheel load |
| L | equivalent length of the empiric beam considered |
| x | distance from the application point of the load G to the origin of the influence line |
| C | ballast bed modulus |
| Er | rail Young’s modulus |
| Ir | rail moment of inertia |
| Es | sleeper Young’s modulus |
| Is | sleeper moment of inertia |
| α | track condition coefficient |
| b | sleeper width (cm) |
| l | sleeper length (cm) |
| a | distance between sleepers’ axes |
| φ | dynamic coefficient [46] |
| t | track exceeding probability coefficient [46] |
| δ | coefficient depending on track quality [46] |
| V | vehicle speed (km/h) |
| ys | rail center of gravity |
| M | rail bending moment |
| σ | rail unitary effort |
References
- Hamadache, M.; Dutta, S.; Olaby, O.; Ambur, R.; Stewart, E.; Dixon, R. On the fault detection and diagnosis of railway switch and crossing systems: An overview. Appl. Sci. 2019, 9, 5129. [Google Scholar] [CrossRef]
- Lichtberger, B. Track Compendium: Formation, Permanent Way, Maintenance, Economics, 1st ed.; Eurail Press: Leipheim, Germany, 2005. [Google Scholar]
- Zhang, H.; Ding, H.H.; Cui, X.L.; Wang, Y.; Han, Z.Y.; Meli, E.; Wang, W.J. Experimental investigation on the effect of contact forces on uneven longitudinal wear of rail material. Wear 2023, 532–533, 205108. [Google Scholar] [CrossRef]
- Yulong Xie, Y.; Wang, W.; Guo, J.; An, B.; Chen, R.; Wu, Q.; Bernal, E.; Ding, H.; Spiryagin, M. Rail rolling contact fatigue response diagram construction and shakedown map optimization. Wear 2023, 528–529, 204964. [Google Scholar]
- Carter, F.W. On the action of a locomotive driving wheel. Proc. R. Soc. Lond. 1926, 112, 151–157. [Google Scholar]
- Railway Instruction 314 Regarding Norms and Tolerances on the Railway Track; Ministery of Transport and Telecomunications: Bucharest, Romania, 1989.
- Jeong, D.Y.; Tang, Y.H.; Orringer, O. Estimation of Rail Wear Limits Based on Rail Strength Investigations; US Department of Transportation: Washington, DC, USA, 1998. [Google Scholar]
- Kalker, J.J. On the Rolling Contact of Two Elastic Bodies in the Presence of Dry Friction. Ph.D. Thesis, Technische Hogeschool Delft, Delft, The Netherlands, 1967. [Google Scholar]
- Shen, Z.Y.; Hedrick, J.K.; Elkins, J.A. A comparison of alternative creep-force models for rail vehicle dynamic analysis. Veh. Syst. Dyn. 1983, 12, 79–83. [Google Scholar] [CrossRef]
- Jin, X.; Wen, Z.; Xiao, X.; Zhou, Z. A numerical method for prediction of curved rail wear. Multibody Syst. Dyn. 2007, 18, 531–557. [Google Scholar] [CrossRef]
- Sonmez, H.Y.; Ozturk, Z. Effects of Traffic Loads and Track Parameters on Rail Wear: A Case Study for Yenikapi–Ataturk Airport Light Rail Transit Line. In Urban Rail Transit; Springer: Berlin/Heidelberg, Germany, 2020. [Google Scholar]
- Kalker, J.J. Wheel-rail rolling contact theory. Wear 1991, 144, 243–261. [Google Scholar] [CrossRef]
- Hanief, M.; Charoo, M.S. Archard’s wear law revisited to measure accurate wear coefficient considering actual sliding velocity. Mater. Today Proc. 2021, 47, 5598–5600. [Google Scholar] [CrossRef]
- Enblom, R.; Berg, M. Simulation of railway wheel profile development due to wear—Influence of disc braking and contact environment. Wear 2005, 258, 1055–1063. [Google Scholar] [CrossRef]
- Jendel, T. Prediction of Wheel Profile Wear—Comparisons with Field Measurements. Wear 2002, 253, 89–99. [Google Scholar] [CrossRef]
- Santa, J.F.; Toro, A.; Lewis, R. Correlations between rail wear rates and operating conditions in a commercial railroad. Tribol. Int. 2015, 95, 5–12. [Google Scholar] [CrossRef]
- Lewis, R.; Olofsson, U. Wheel-Rail Interface Handbook; Elsevier: Amsterdam, The Netherlands, 2009. [Google Scholar]
- Famurewa, S.M.; Asplund, M.; Kumar, U. Evaluation of rail wear characteristics on heavy haul track section using measurement data. In Proceedings of the IHHA Conference, Perth, Australia, 21–24 June 2005; pp. 536–543. [Google Scholar]
- Soleimani, H.; Moavenian, M. Tribological aspects of wheel–rail contact: A review of wear mechanisms and effective factors on rolling contact fatigue. In Urban Rail Transit; Springer: Berlin/Heidelberg, Germany, 2017; pp. 227–237. [Google Scholar]
- Sadeghi, J.; Akbari, B. Field investigation on effects of railway track geometric parameters on rail wear. J. Zhejiang Univ. Sci. A 2006, 7, 1846–1855. [Google Scholar] [CrossRef]
- Shebani, A. Prediction of Wheel and Rail Wear Using Artificial Neural Networks. Doctoral Dissertation, University of Huddersfield, Huddersfield, UK, 2016. [Google Scholar]
- Meghoe, A.; Loendersloot, R.; Tinga, T. Rail wear and remaining life prediction using meta-models. Int. J. Rail Transp. 2019, 8, 1–26. [Google Scholar] [CrossRef]
- Lin, Y.C.; Yan, B.H.; Chang, Y.S. Machining characteristics of titanium alloy (Ti–6Al–4V) using a combination process of EDM with USM. J. Am. Acad. Dermatol. 2002, 104, 171–177. [Google Scholar] [CrossRef]
- Li, Z.L.; Kalker, J.J. Simulation of severe wheel-rail wear. WIT Trans. Built Environ. 1998, 37, 10. [Google Scholar]
- Vernaillen, T.; Wang, L.; Núñez, A.; Dollevoet, R.; Li, Z. Rail wear rate on the Belgian railway network—A big-data analysis. Int. J. Rail Transp. 2023, 1–16. [Google Scholar] [CrossRef]
- Enblom, R.; Berg, M. Proposed procedure and trial simulation of rail profile evolution due to uniform wear. Proc. Inst. Mech. Eng. Part F J. Rail Rapid Transit 2008, 222, 15–25. [Google Scholar] [CrossRef]
- Ranjha, S.A.; Mutton, P.; Kapoor, A. Effect of head wear and lateral forces on underhead radius crack propagation. Proc. Inst. Mech. Eng. Part F J. Rail Rapid Transit 2014, 228, 620–630. [Google Scholar] [CrossRef]
- Alwahdi, F.; Franklin, F.J.; Kapoor, A. The effect of partial slip on the wear rate of rails. Wear 2005, 258, 1031–1037. [Google Scholar] [CrossRef]
- Zhang, P.; Moraal, J.; Li, Z. Design, calibration and validation of a wheel-rail contact force measurement system in V-Track. Measurement 2021, 175, 109105. [Google Scholar] [CrossRef]
- Xie, Q.; Tao, G.; He, B.; Wen, Z. Rail corrugation detection using one-dimensional convolution neural network and data-driven method. Measurement 2022, 200, 111624. [Google Scholar] [CrossRef]
- Kanis, J.; Zitrický, V.; Hebelka, V.; Lukáč, P.; Kubín, M. Innovative Diagnostics of the Railway Track Superstructure. Transp. Res. Procedia 2021, 53, 138–145. [Google Scholar] [CrossRef]
- Torstensson, P.T.; Pieringer, a.; Nielsen, J.C.O. Simulation of rail roughness growth on small radius curves using a non-Hertzian and non-steady wheel–rail contact model. Wear 2014, 314, 241–253. [Google Scholar] [CrossRef]
- Ticoalu, A.; Aravinthan, T.; Karunasena, W. An investigation on the stiffness of timber sleepers for the design of fibre composite sleepers. In Proceedings of the 20th Australasian Conference on the Mechanics of Structures and Materials (ACMSM 20), Toowoomba, Australia, 2–5 December 2008. [Google Scholar]
- Hamzah, S.H.; Din, K. Appraisal of used wooden railway sleeper. J. Eng. Sci. Technol. 2008, 3, 224–233. [Google Scholar]
- Lojda, V.; Belkom, A.; Krejčiříková, H. Investigation of the elastic modulus of polymer sleepers under a quasistatic and cyclic loading. Civ. Environ. Eng. 2019, 15, 125–133. [Google Scholar] [CrossRef]
- Esveld, C. Modern Railway Track, 2nd ed.; MRT-Productions: Zaltbommel, The Netherlands, 2001. [Google Scholar]
- Belkom, A. Recycled Plastic Railway Sleepers: Analysis and Comparison of Sleeper Parameters and the Influence on Track Stiffness and Performance. In Railway Engineering; Lankhorst Engineered Products: Sneek, The Netherlands, 2015; p. 20. [Google Scholar]
- Lojda, V. The historical development of railway sleepers from the perspective of material: From stone to polymers. In RDT 2nd Research, Development and Innovation in Transport–RDIT; RDIT: Ostrava, Czech Republic, 2018. [Google Scholar]
- Winkler, E. Die Lehre von der Elastizitat und Festigkeit; Dominikus Verlag: Prag, Czech Republic, 1867. [Google Scholar]
- Zimmermann, Z. Die Berechnung des Eisenbahnoberbaus; Ernst & Korn Verlag: Berlin, Germany, 1888. [Google Scholar]
- Talbot, A.N. Stresses in Railroad Track. Reports of the Special Committee on Stresses in Railroad Track. First Progress Report. Proc. AREA 1918, 19, 873–1062. [Google Scholar]
- Talbot, A.N. Stresses in Railroad Track. Reports of the Special Committee on Stresses in Railroad Track. Second Progress Report. Proc. AREA 1920, 21, 645–814. [Google Scholar]
- Timoshenko, S.; Langer, B.F. Stresses in railroad track. Trans. ASME Appl. Mech. 1932, 54, 277–293. [Google Scholar] [CrossRef]
- Clarke, C.W. Track loading fundamentals, Parts 1 to 7. In The Railway Gazette; Temple Press Limited: London, UK, 1957. [Google Scholar]
- Doyle, N.F. Railway Track Design: A Review of Current Practice; BHP Melbourne Research Laboratories: Mulgrave, Australia, 1980. [Google Scholar]
- Lee, J.; Oh, K.; Park, Y.; Choi, J. Study on the Applicability of Dynamic Factor Standards by Comparison of Spring Constant Based Dynamic Factor of Ballasted and Concrete Track Structures. Appl. Sci. 2020, 10, 8361. [Google Scholar] [CrossRef]
Disclaimer/Publisher’s Note: The statements, opinions and data contained in all publications are solely those of the individual author(s) and contributor(s) and not of MDPI and/or the editor(s). MDPI and/or the editor(s) disclaim responsibility for any injury to people or property resulting from any ideas, methods, instructions or products referred to in the content. |
© 2023 by the authors. Licensee MDPI, Basel, Switzerland. This article is an open access article distributed under the terms and conditions of the Creative Commons Attribution (CC BY) license (https://creativecommons.org/licenses/by/4.0/).