1. Introduction
The mechanical behavior of civil engineering structures or infrastructures under the most adverse conditions has been the focus of researchers for many years. The airport runway, as one of the most important infrastructures, is mainly used for normal aircraft takeoff, landing, and taxiing, but is not sufficient to resist extreme loads such as rough impacts or explosions. Existing airport runways are not only subject to direct impacts caused by aircraft takeoff and landing, but also suffer from additional impacts caused by aircraft accidents. Simultaneously, runways can experience increased roughness during the course of operation caused by the load and other environmental factors over the long term, and the vibration and impact of aircraft cause wear and tear, endangering the safety of the runway in the process of aircraft takeoff, landing, and taxiing.
At present, the impact resistance of airport pavements is mainly evaluated using test measurements and simulation. The FWD (falling weight deflectometer), HWD (heavy weight deflectometer), and SHPB (split Hopkinson pressure bar) methods have been used to study the effect of impact loading on the road surface, and finite element software such as ANSYS and ABAQUS have been applied to simulate the impact process on the road surface and calculate its dynamic response. Wang Weili of the Civil Aviation University of China used FWD to measure the impact progress modulus of an airport pavement, combined with the ACN-PCN method, to reflect the structural load-bearing capacity of the airport pavement and ensure its operational safety [
1]. Zheng Fei calculated the parameters of the bending elasticity modulus, the equivalent modulus of elasticity of the foundation, and the thickness of the pavement based on FWD, and fitted the regression equation for the mechanical response of the airport pavement; the relative error between the FEM simulation and the regression equation was less than 2% [
2]. Loizos shared practical experience with methods for measuring pavement bearing capacity, suggesting that the inclusion of the CBR obtained from impact testing when calculating PCN values would underestimate the potential for damage to asphalt concrete. In addition, the reliability of the values obtained from the tests is questionable, as the existing calculation methods are only meaningful under certain assumptions and limitations, and there is no referable calibration procedure between the methods [
3]. Cai Jing investigated the factors affecting the dynamic deflection and velocity response of a concrete airport pavement under impact loading. The results showed that the thickness and dimensions of the slab were the main factors influencing the variation in the deflection, and the modulus of the foundation reaction had a greater influence on the velocity response. On the basis of this, a non-linear relationship between the thickness of the slab and the maximum deflection has been proposed [
4]. Tarefder analyzed the ability of different software programs to process drop hammer bending instrument data and verified the accuracy of the inversion results by comparing the inversion data with indoor test results. The results suggest that the EVERCALC processing software has higher precision and accuracy [
5]. Sun calculated the required response values for the load-bearing capacity of airport pavements using HWD or FWD. This helps airport managers to assess the performance of airport pavements to ensure safe operation [
6]. Yuan Jifeng investigated the effect of impact loading on the damage level and mechanical response of recycled aggregate reinforced concrete on airport pavements with different thicknesses and reinforcement ratios using FWD. On the basis of this study, optimization recommendations were proposed for the promotion of the application of recycled aggregate concrete in the field of road construction [
7].
The finite element method is used to disaggregate the road surface into multiple small units and solve them by numerical simulation, which can take into account the complex characteristics of the road surface such as material non-linearity and geometric non-linearity that cannot be considered using the traditional elastic laminar theory system, and this further improves the accuracy and reliability of the mechanical response of the road surface [
8]. Tarahomi investigated mechanical response and prediction models for airport pavements using 3D finite element software. The study found that the models are ideal for predicting the mechanical response of rigid pavements and can effectively reveal the damage mechanisms of such surfaces [
9]. Hae Won used ABAQUS to construct a finite element model of the concrete road surface of Incheon International Airport. The accuracy and reliability of the HWD was the subject of simulation and analysis by the model, and the results were consistent with the model simulation [
10]. Zhu Maojiang constructed a three-dimensional finite element model based on the UTW theory to study the variation in the dimensional thickness of the paving slab and the tensile stress at the bottom of the slab, and proposed quality control criteria for asphalt paving and UTW paving, including the dimensions and thickness of the paving slab and the modulus of elasticity of the material [
11]. Prawesti concluded that the performance of the existing airport pavement was no longer compatible with the development of transport technology. By estimating the number of aircraft at the airport over the next 20 years and the number of equivalent annual take-offs, a three-dimensional finite element model was constructed to perform the response and fatigue analysis of the rigid pavement structure and to calculate the maximum stress, displacement, thermal stress, and fatigue life of the airport pavement slabs over the next 20 years [
12]. Dong Zejiao of the Harbin Institute of Technology obtained the response data of the airport pavement based on sensors, verified the feasibility of the finite element model, and established the coupled field of temperature and mechanics. He proposed the temperature control criteria for the structure of the pavement [
13]. To simulate the cracking process of a concrete pavement under impact, Zhang Qunlei developed a large-scale three-dimensional finite element model of the road surface. Comparing the results of core bores, impact tests, and simulations, a road surface impact FEM model was proposed that was highly consistent with the actual situation and accurately simulated the crack and crush process of the concrete road surface under the action of multi-head impact loading [
14]. Tian Yu applied finite element analysis and multivariate interpolation to design a wheel impact surface at Shanghai Hongqiao International Airport, and proposed a damage surface design method to determine the cumulative damage factor through the simulation of the load transfer effect, which improved and optimized the existing method for calculating the load-bearing capacity of the rigid road surface at the airport [
15]. Shafabakhsh et al. used LEDFAA and ABAQUS software to carry out pavement dynamics analysis, studied the influence of different landing gear configurations and speeds on pavement performance, and calculated the cumulative damage factor of the pavement. The research shows that the Airbus 340–500/600 has the greatest impact on pavement damage, and the deflection value of the pavement subgrade is the largest when the speed is 5 km/h [
16,
17].
In addition, DONG Qian et al. proposed a new method to analyze the bearing capacity of the runway pavement using runway vibration mapping during aircraft taxiing by collecting the response under aircraft loading using acceleration sensors, comparing the measured and calculated fundamental frequencies to correct the finite element model parameters to ensure the accuracy of the bearing capacity of the airport pavement [
18].
In summary, the existing aircraft structure, material, and pavement structure design can no longer meet the development needs with the increasing complexity of aircraft types, heavy loads, and high-speed development. Although the impact test can obtain the bearing capacity of the airport pavement and evaluate its operational safety, there is a delay, and the field testing interrupts the traffic, which is costly in terms of human and material resources. Finite element simulation can solve the problem of timeliness, but most of the existing models still use the application of static loads to carry out relevant studies, which is reasonable under the circumstances of low aircraft loads and speeds. However, under significant dynamic loads, the differences between the static load distribution and the actual forces on the ground during aircraft flight become more and more significant and the dynamics of the pavement structure cannot be described by static characteristics, and the existing theories and methods cannot fundamentally explain and resolve these differences and deficiencies. At the same time, there is a certain effect on the pavement when the wheels pass through the unevenness, which cannot be simulated by static loads [
19,
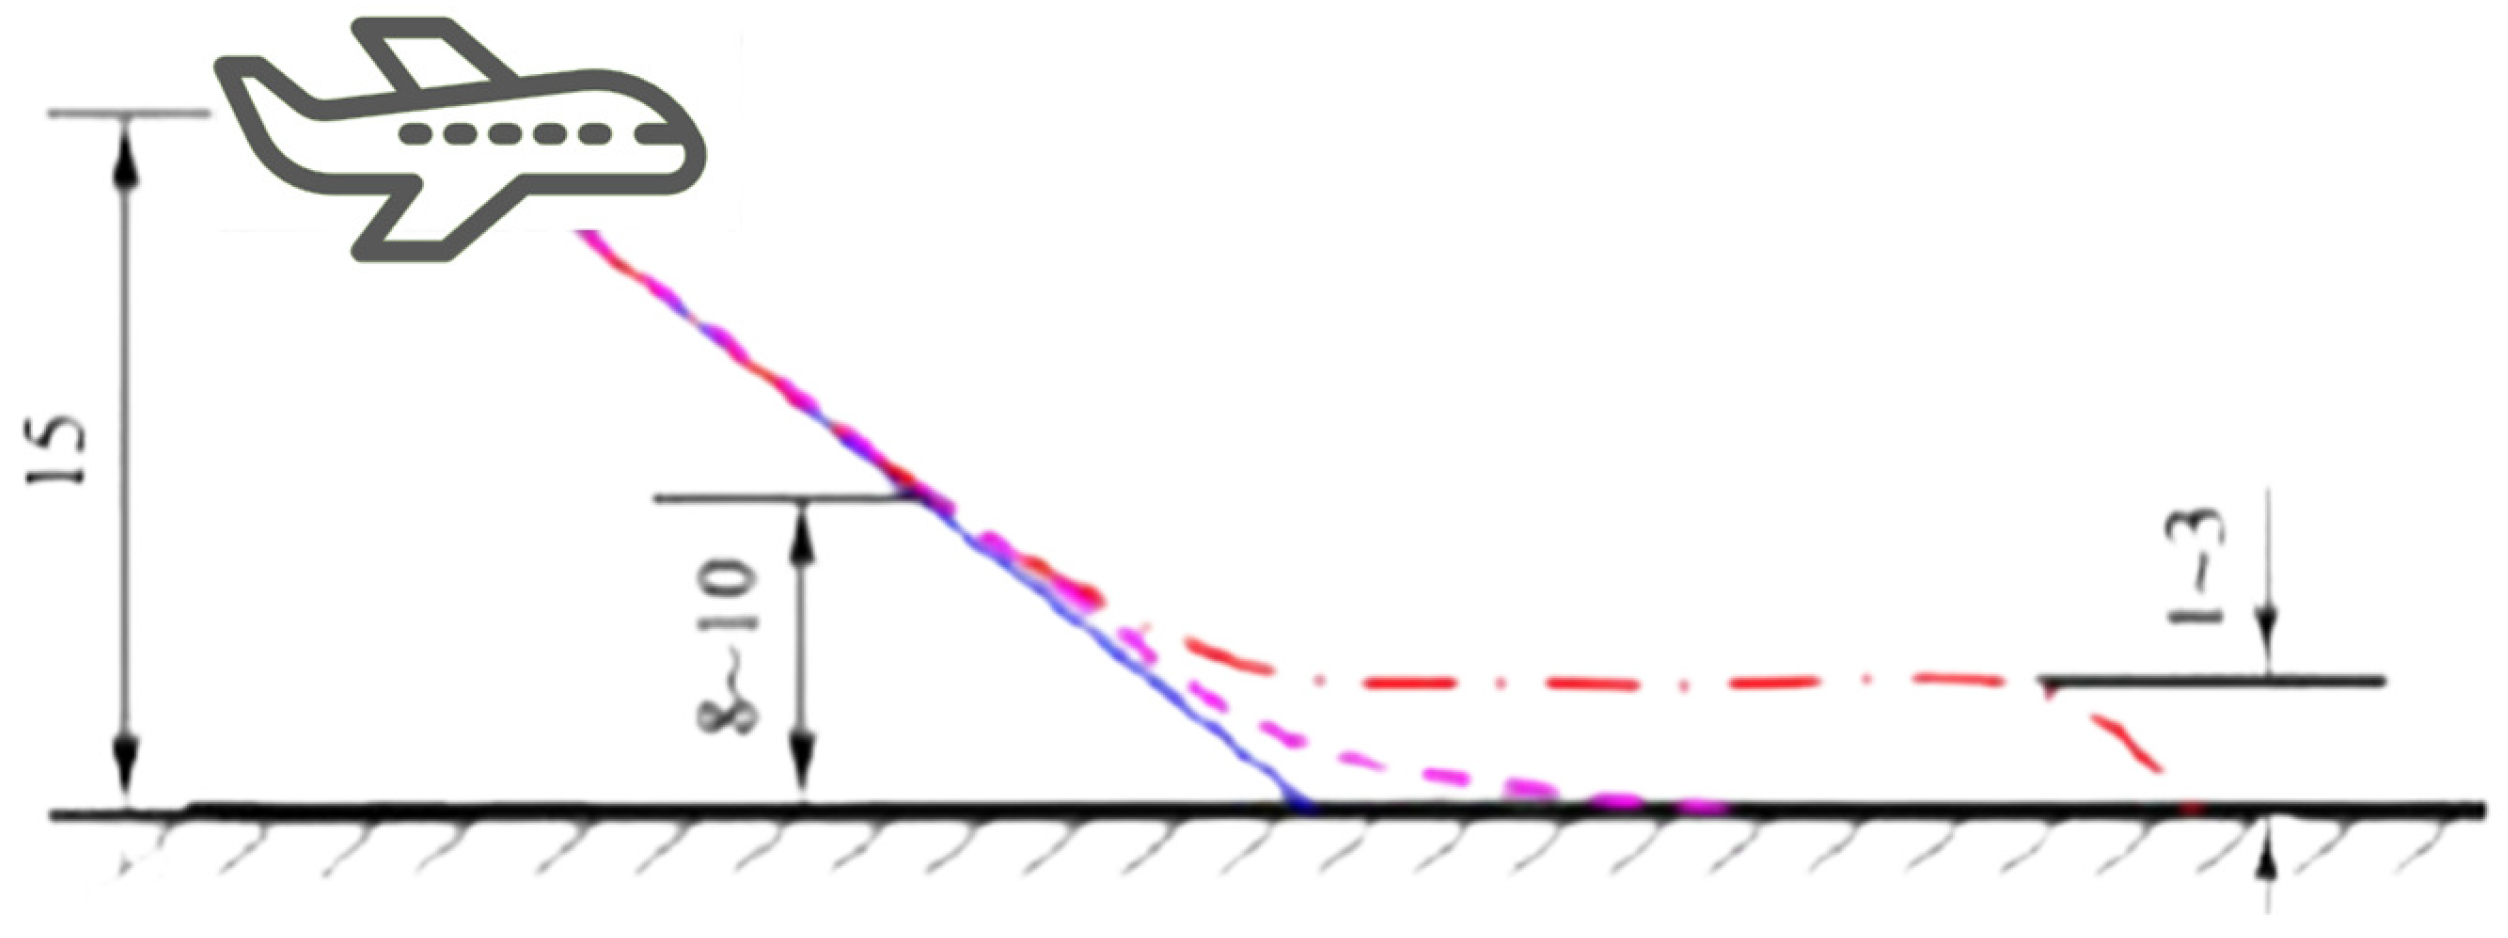
20]. Furthermore, the normal landing of an aircraft has a certain impact on the road surface, the magnitude of which depends on the drift height of the aircraft and the level of the pilot. In the case of a violent landing, the impact loading on the road surface is three times more than the static load [
21], and it is not possible to describe the dynamic effect of the impact loading using a static method [
22]. Finally, after the construction and operation of the airport pavement, many phenomena have occurred that cannot be explained by statics, such as fatigue cracking and aggregate loosening. If the damage caused by the dynamic effect is still not taken into account, it will lead to considerable blindness when designing, constructing, maintaining, and modifying the airport structure [
2].
Therefore, in this paper, a finite element model of the impact resistance of an airport pavement was constructed, dynamic loads were applied to the landing gear to simulate the impact of the aircraft landing on the pavement, and the dynamic response of the pavement under dynamic impact loadings, including tire pressure, landing angle, and settlement speed, was investigated to evaluate the impact resistance of the pavement. It fills the gap in most existing studies, which have not assessed the pavement’s load-bearing capacity by means of tests or static loading, and provides data to reveal the impact resistance mechanism of the airport pavement.
3. Model Inputs
In the process of finite element calculation, in order to obtain reliable and valuable simulation results, the pretreatment of the model is very important, including the mesh segmentation, contact relationship, load application, and boundary conditions. In this paper, ANSYS Workbench is used to preprocess the model to lay a foundation for the subsequent study on the impact resistance of airport runways.
3.1. Meshing and Contact Relations
The finite element calculation process only includes the nodes and elements of the model mesh. The structure and density of the mesh have a significant impact on the accuracy of the calculation results, and the constant increase in the number of meshes will increase the CPU calculation time and storage space. Therefore, the relationship between the density of the mesh and the calculation accuracy should be controlled in the process of meshing in order to expect the most cost-effective calculation solution.
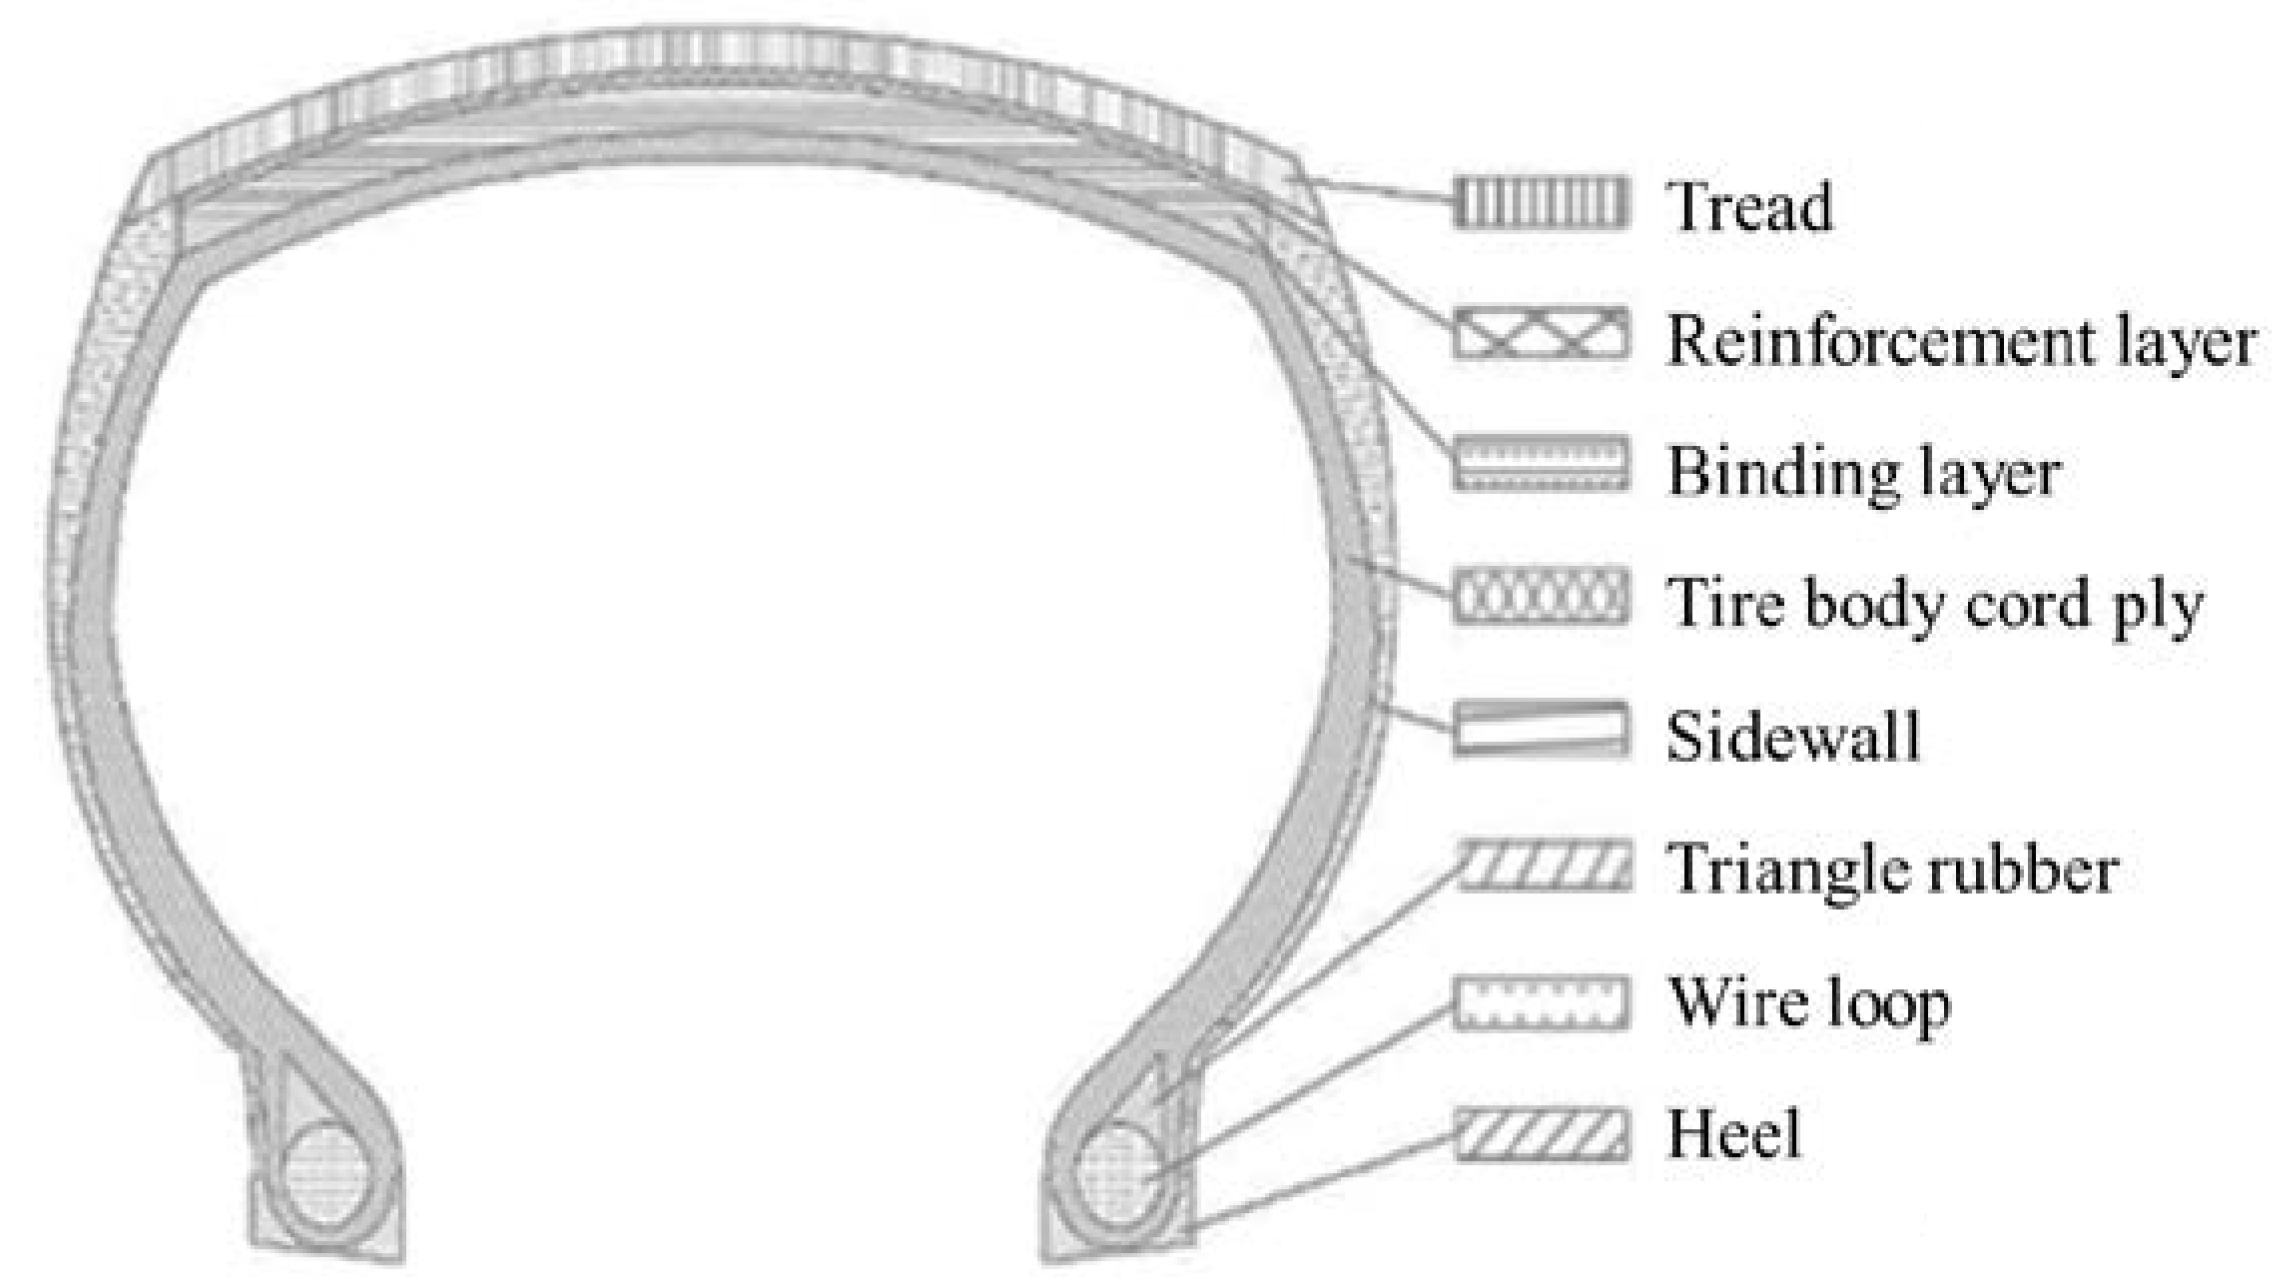
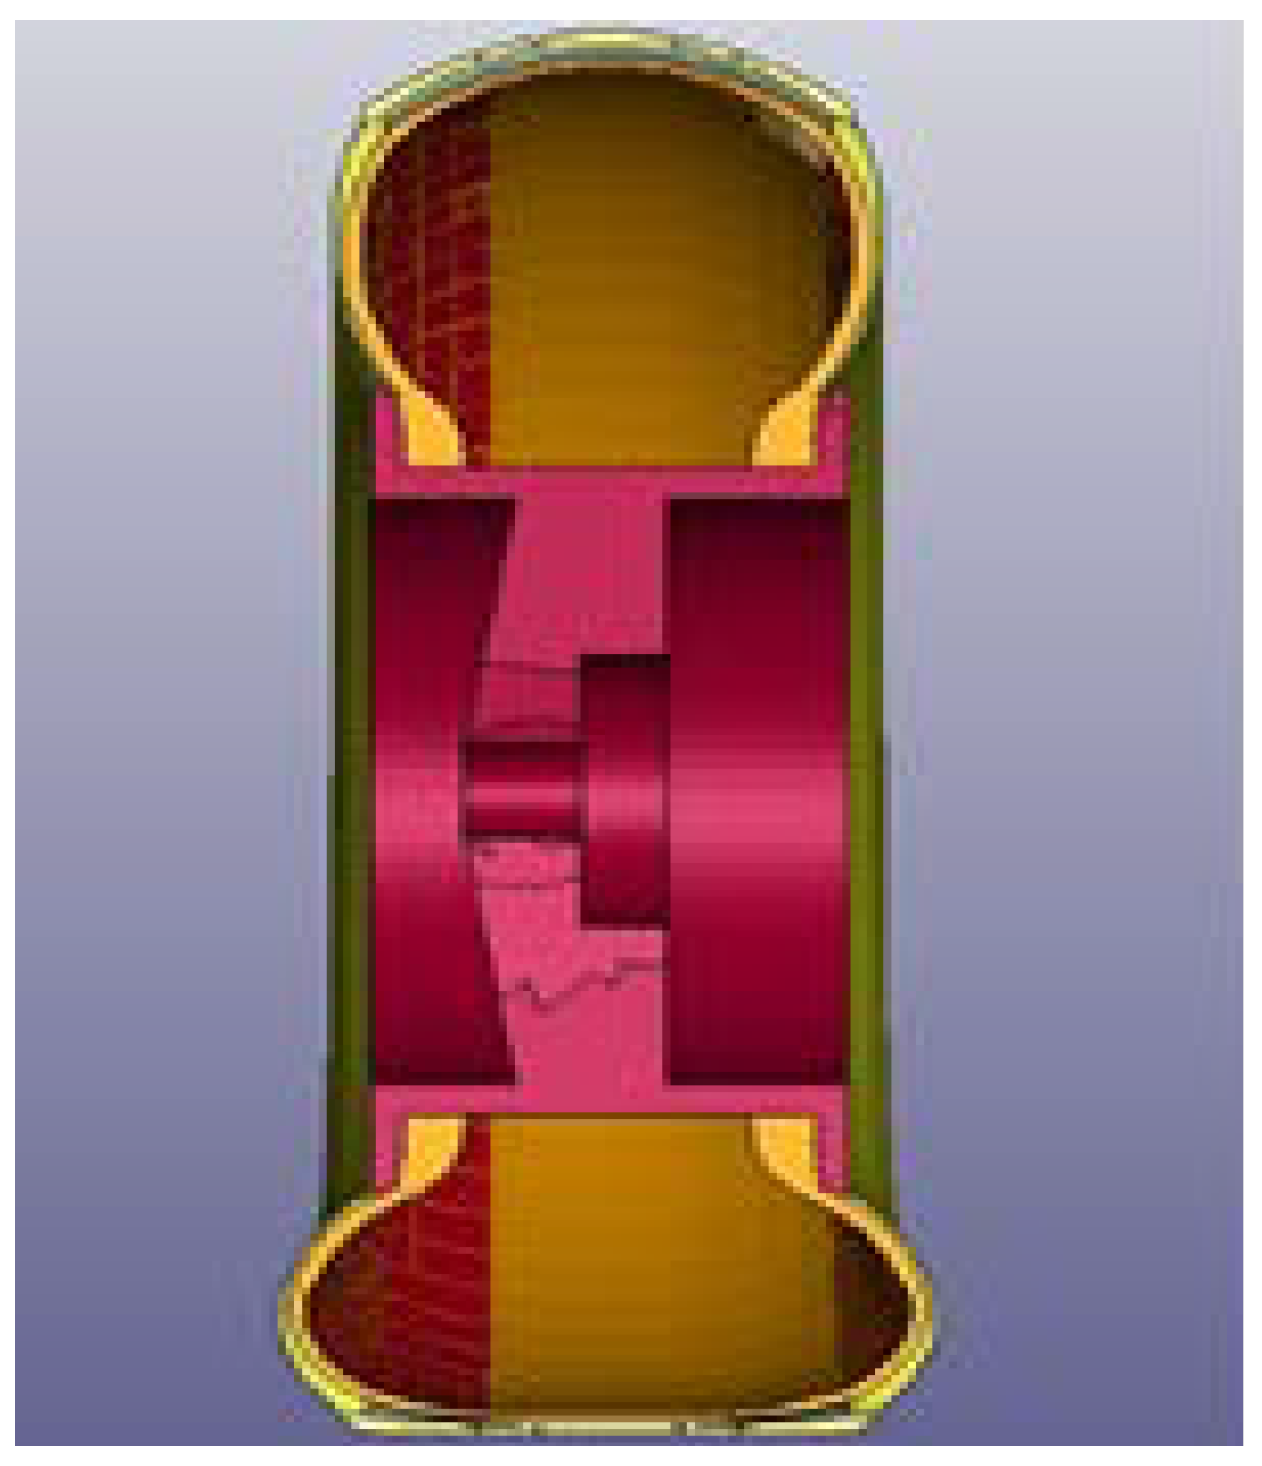
The buffer system and the hub have been defined as rigid bodies with mesh sizes of 20 mm. In the LS-PrePost software, the number and size of the rigid body meshes do not affect the calculation results. The wheel adopts a multi-zone subdivision method with a mesh size of 15 mm. The mesh size of the contact area between the tire and wheel is more intensive, which can better characterize the shape of the contact area. The tread is gridded at 10 mm to ensure the quality and uniformity of the overall tread structure. The overall shape of the road structure is regular, and no special treatment of the mesh is required.
The related research in this paper does not involve the landing gear. The contact inside the buffer system is set to bind for the convenience of calculation. It is also necessary to establish a connection between the tires and the hub to ensure that the tires can rotate forward around the landing gear bearings.
3.2. Loads and Boundary Conditions
The impact loading on the road surface during landing is determined by both the mass and the impact velocity of the aircraft. In this paper, the load of the aircraft is represented by the application of a point mass on the surface of the main landing gear. The maximum landing weight of a Boeing 737–800 is 663.80 kN, the landing gear configuration adopts single-axle two-wheel structure, the conversion factor of the main landing gear is 95%, and the energy absorption efficiency of the buffer system is 70%. The calculated load applied to each landing gear is 9.65 t, and the point mass applied to each landing gear is 9650 kg. In addition, the global standard Earth gravity should also be applied, with the direction vertical to the pavement.
In order to reduce the model calculation, this paper selected a local model of the pavement. Therefore, except for the top of the road surface, the remaining faces should be set displacement limits; that is, the displacement degrees of freedom of the pavement along their respective directions are set to 0. At the same time, the wave should be scattered outward after the impact of the landing gear on the pavement, instead of reflecting back after reaching the pavement boundary.
Each surface should be set up with non-reflecting boundary conditions to simulate an infinite area. The dynamic response will be scattered from all around the model, which is consistent with the real situation.
5. Result and Analysis
The impact of the aircraft on the pavement structure has the characteristics of short-time strong loading [
25]. The whole landing process is a complex damage process with a short time and a high strain rate, which also involves the transfer and exchange of contact surface impact energy. The damage mechanism is very complicated [
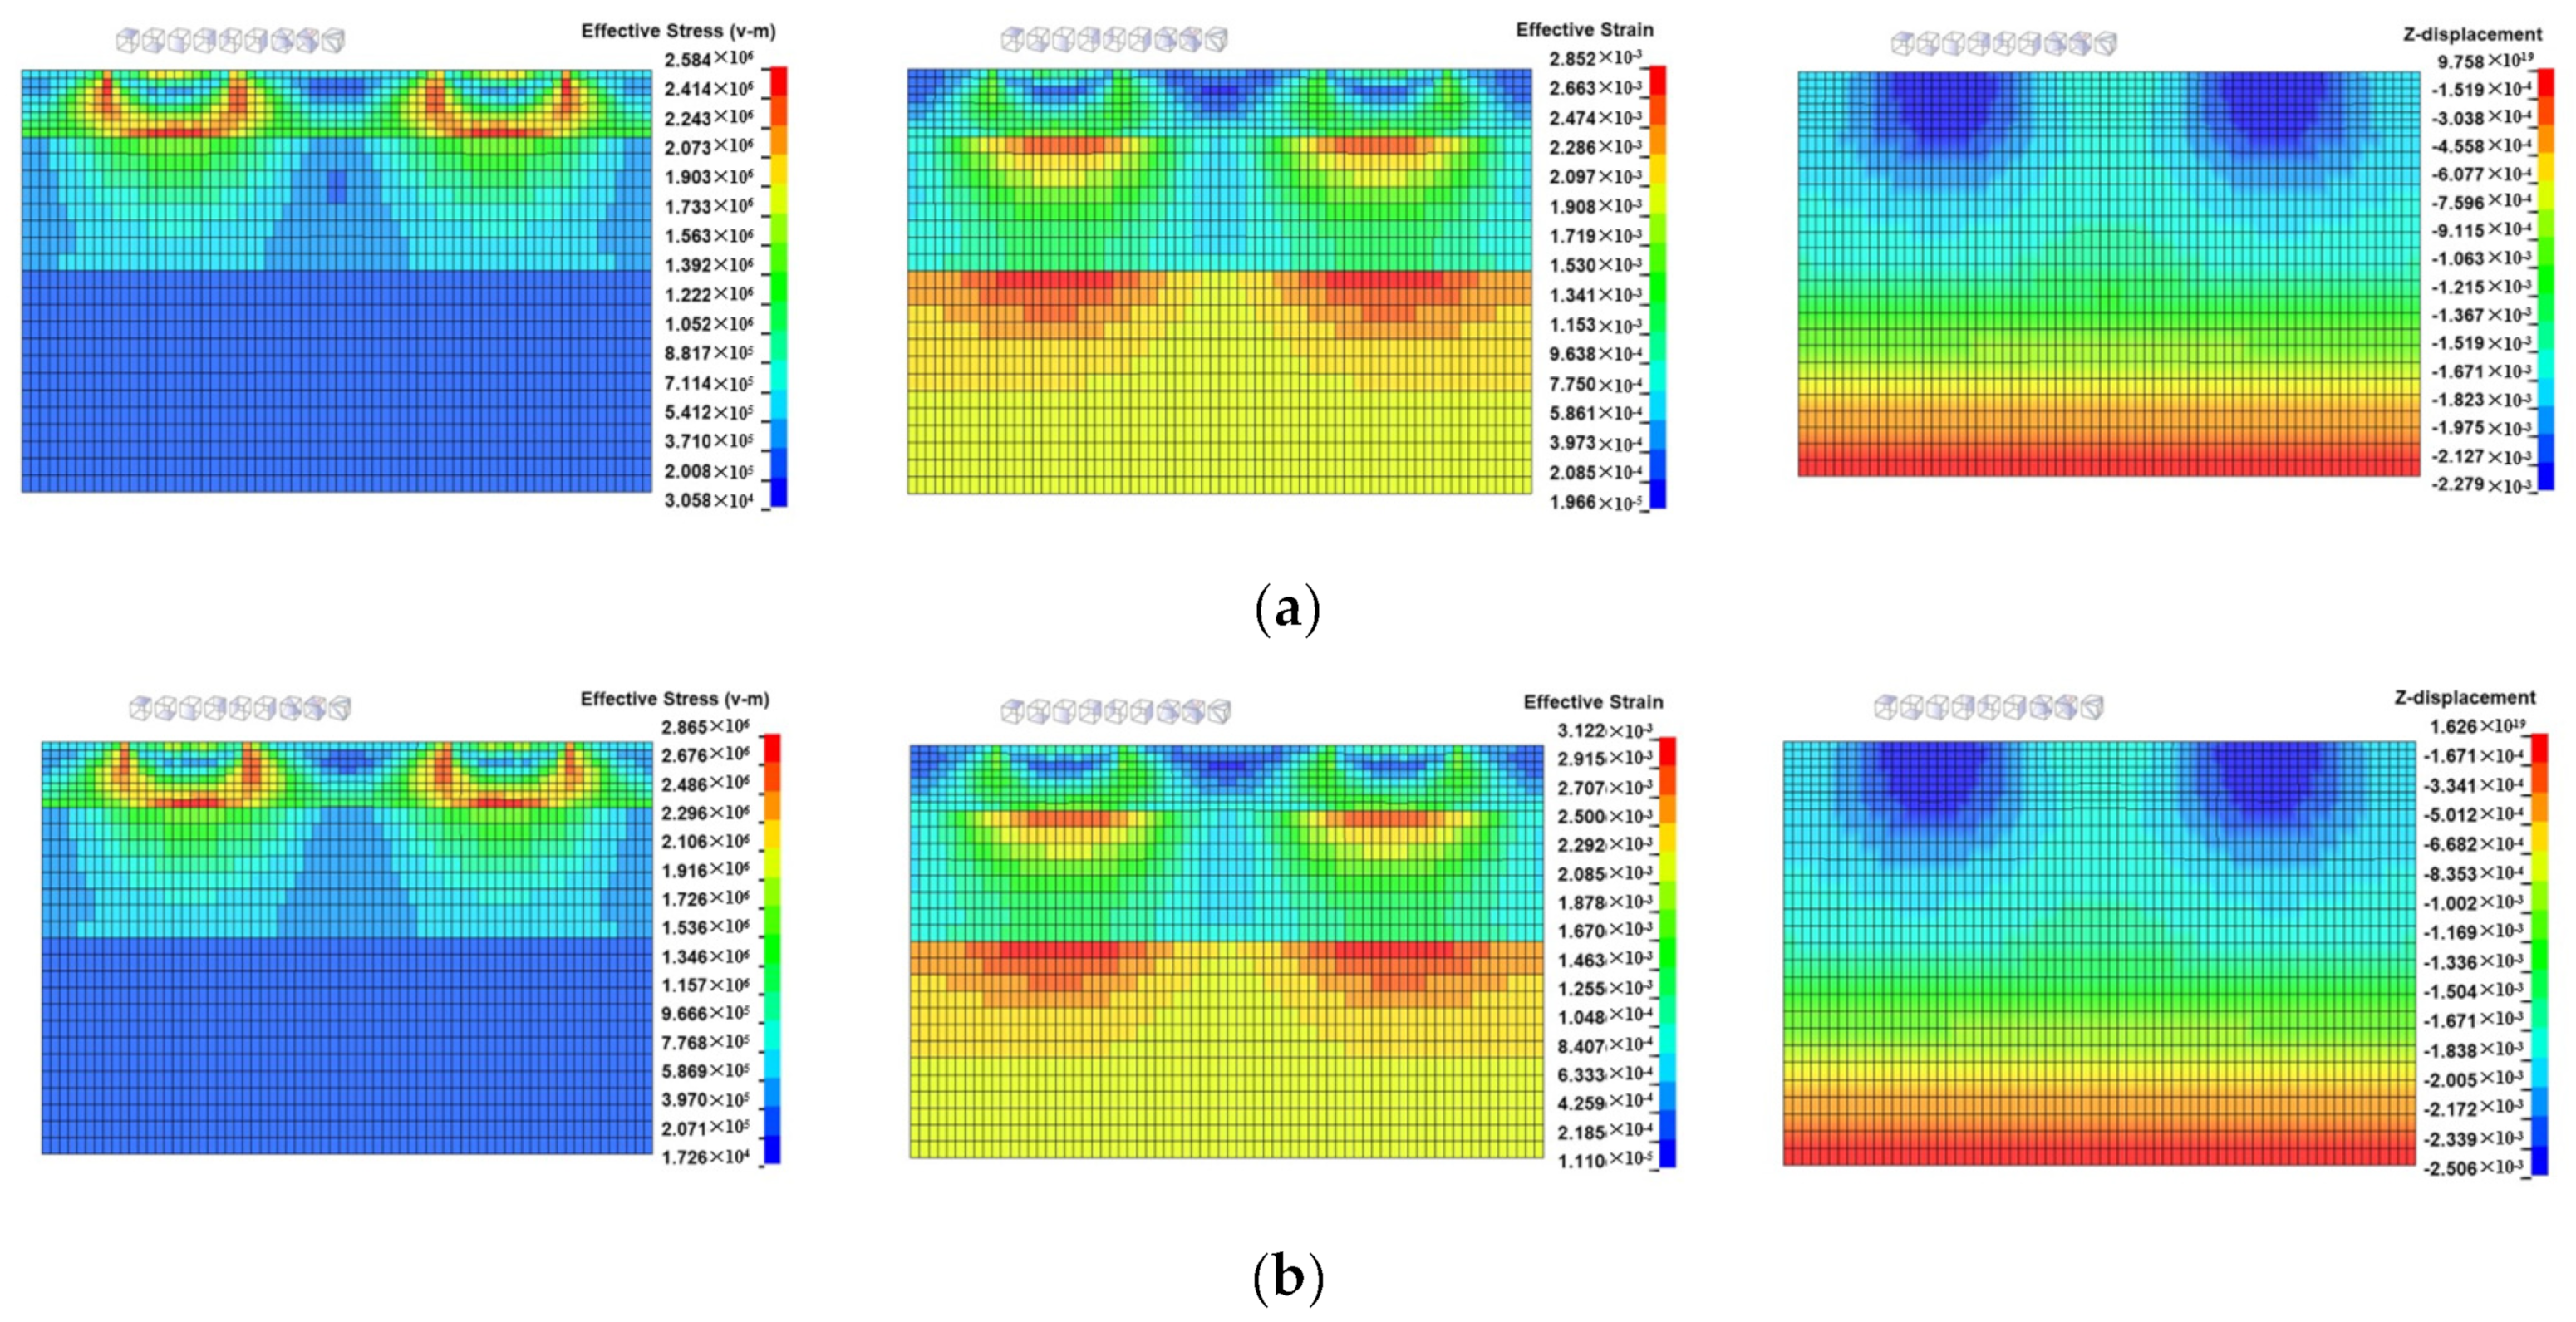
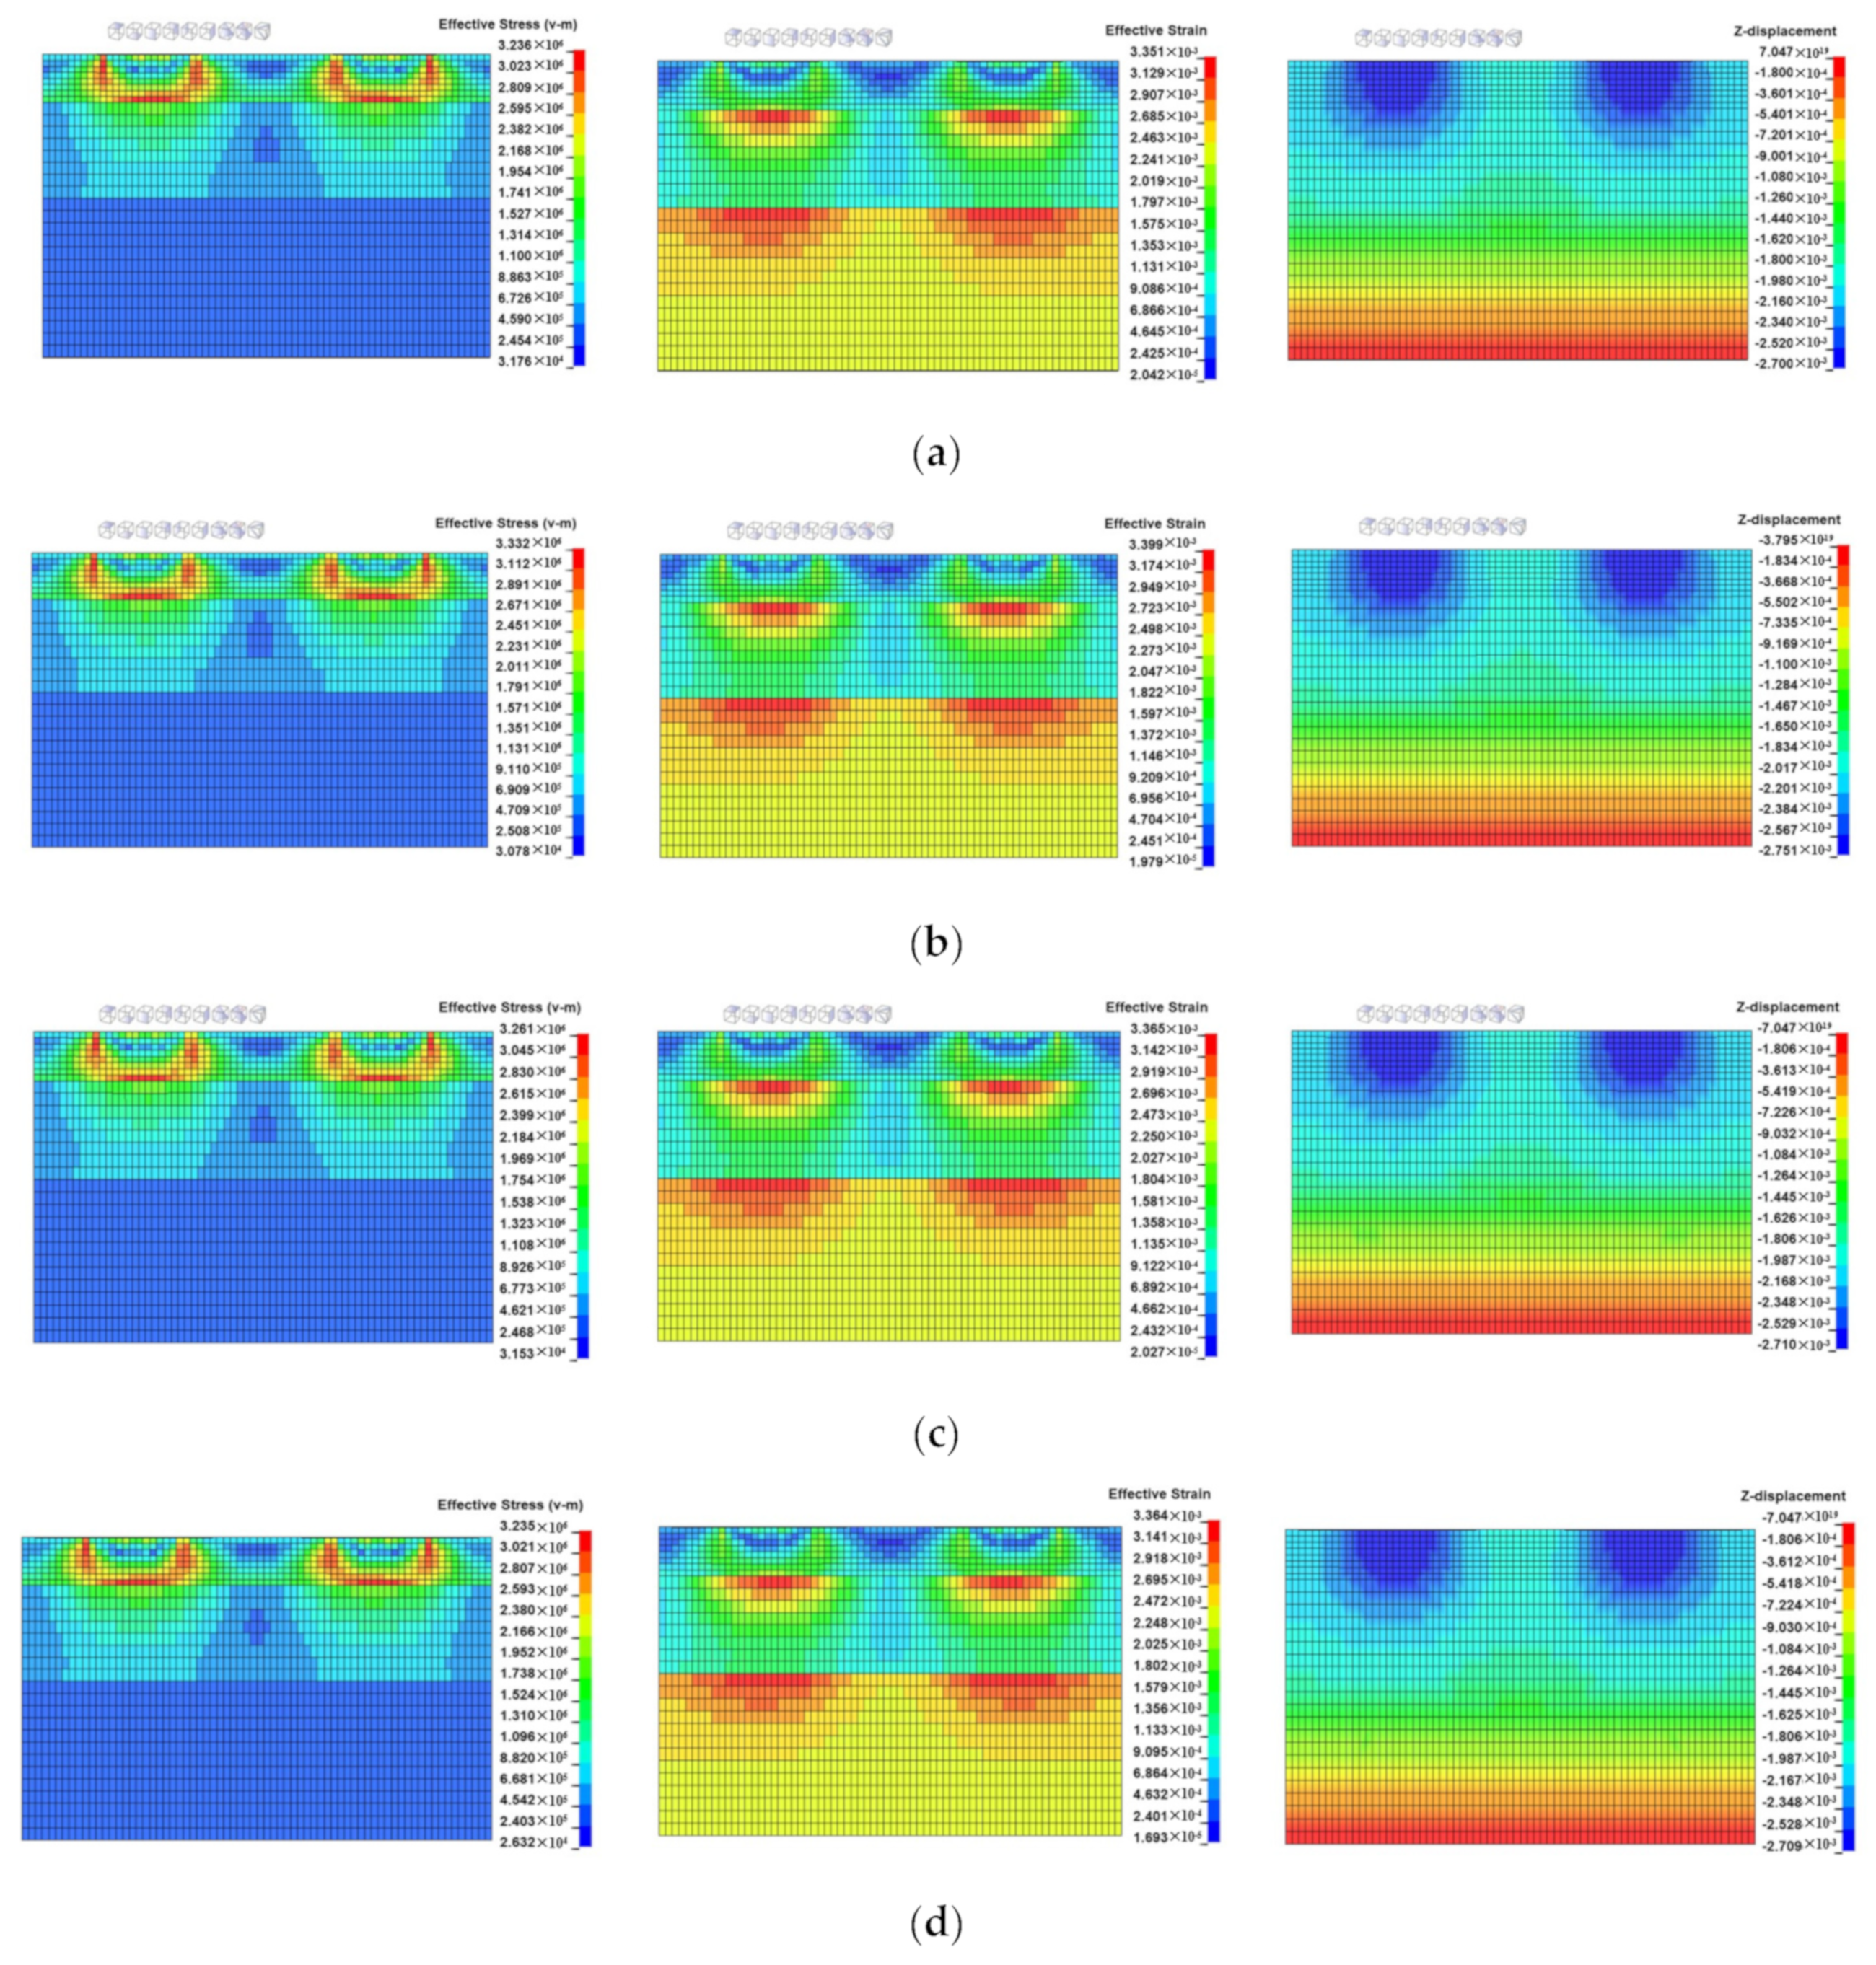
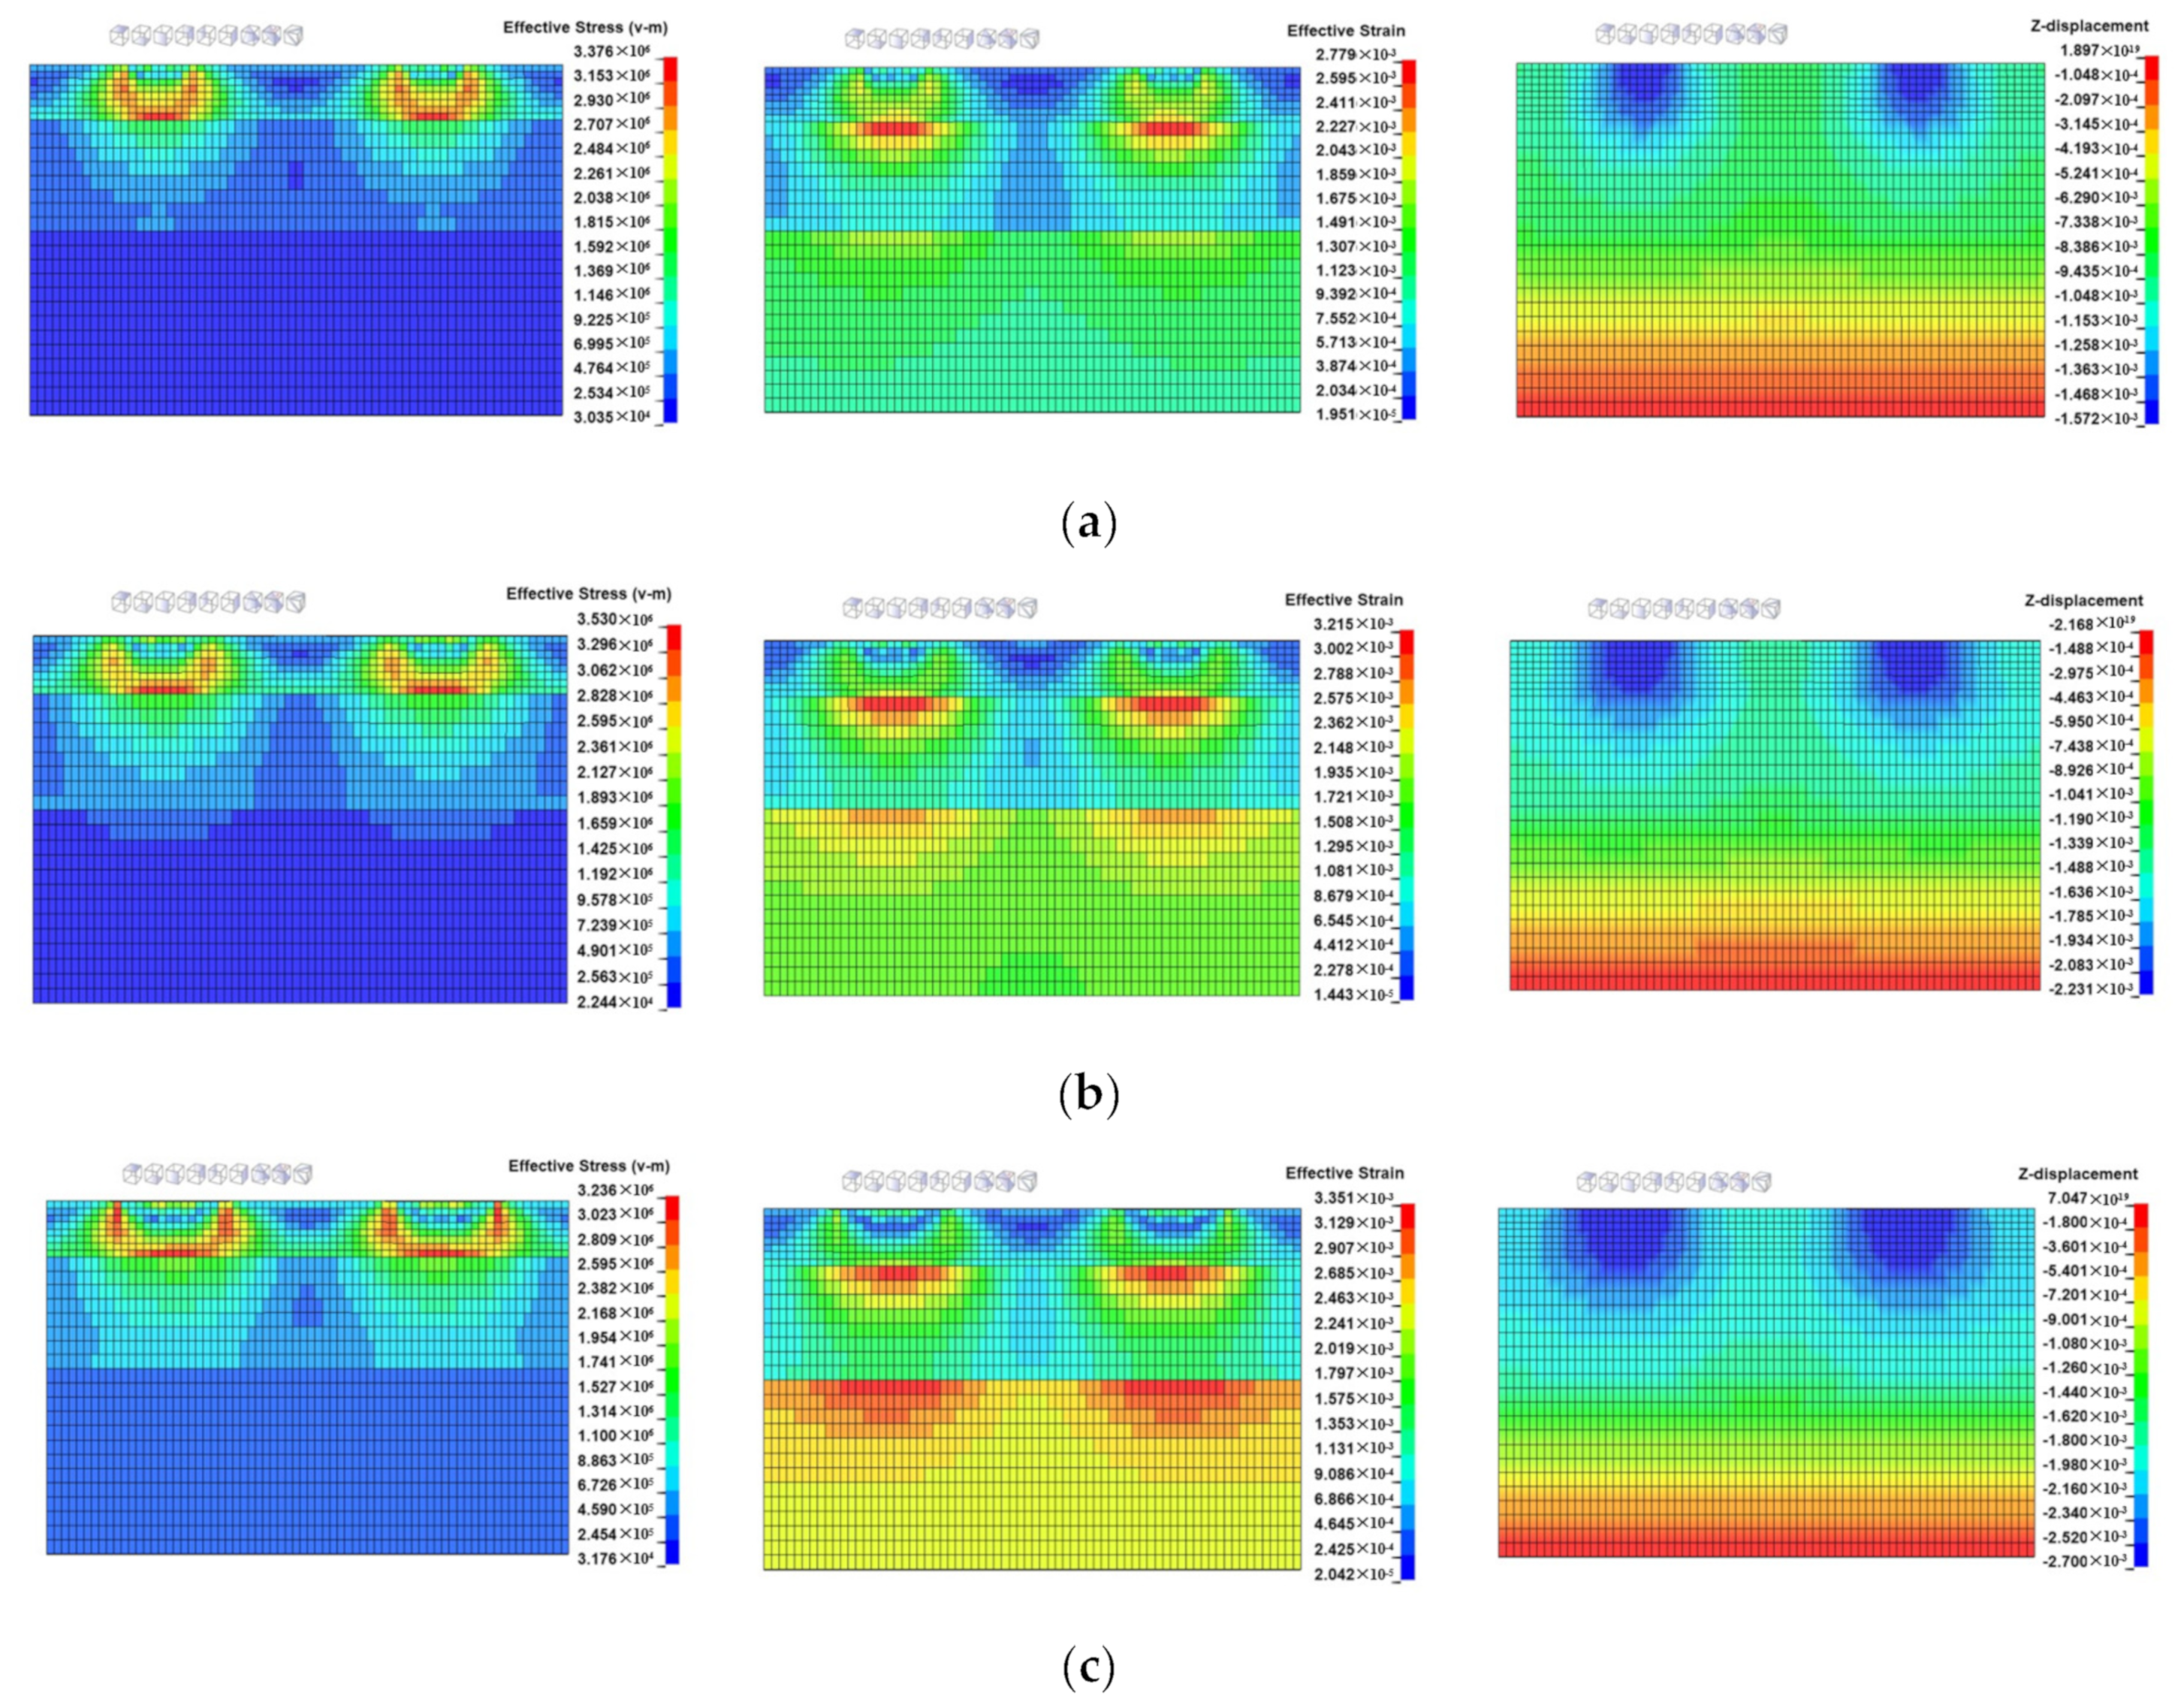
26]. In this paper, the same locations of different structures of an airport runway were selected as the research object, with point A on the top of the surface, point B at the bottom of the surface, point C at the bottom of the base, point D on the top of the soil foundation, and point E at the bottom of the soil foundation. The maximum value and corresponding time of the response parameters such as equivalent stress, effective strain, and the vertical displacement of each layer under different tire pressures, landing pitch angles, and sinking speeds were analyzed, and the impact resistance mechanism of the airport runway was revealed. The maximum effective stress, effective strain, and vertical displacement at each point with different influencing factors, as well as the corresponding time at which the maximum value was reached, are shown in
Figure 9,
Figure 10 and
Figure 11.
From
Figure 9, it can be seen that the maximum equivalent stress, effective strain, and displacement in the vertical direction at each layer increased with the increase in the tire pressure at a given landing pitch angle and sinking speed.
Figure 9a illustrates the effect of tire pressure on the maximum equivalent stress at each point, in which the maximum stress at 2.0 MPa tire pressure increased by 14.2% and 29.8% compared with 1.5 MPa and 1.0 MPa, respectively. The stress values of the remaining structures also increased with the increase in the tire pressure, but the growth rate was smaller, indicating that the effect of tire pressure on the flexural tensile stress at the bottom of the layers of the airport pavement was more significant.
Figure 9b presents the effect of tire pressure on the maximum effective strain of each layer during the impact process of aircraft landing. The maximum value of the effective strain at the top of the soil foundation under 2.0 MPa tire pressure was 7.8% and 19.1% higher than that of 1.5 MPa and 1.0 MPa, respectively. The maximum effective strain value at the top of the soil foundation was the largest under the same tire pressure, which was 1.09 times, 1.22 times, and 1.20 times the strain of the bottom of the soil foundation, indicating that the soil foundation can withstand the largest deformation, followed by the surface and the base. The difference in the strain values of the different layers is closely related to the modulus and thickness of the material. The differences in the strain values have a close relationship with the elastic modulus and thickness, and the effect of the former being more significant.
Figure 9c shows the changes in the vertical displacement of each structure during the contact between the tire and the pavement. From the figure, it can be seen that the vertical displacement gradually decreases as the depth increases, and the upper and lower displacements of the surface are similar. Under different tire pressures, the maximum vertical displacement at the top of the surface at a tire pressure of 2.0 MPa is 10.7% and 22.2% higher than that at 1.5 MPa and 1.0 MPa, respectively. Under the same tire pressures, the displacement at the top of the surface is 3.7% higher than that at the bottom of the surface, and the bottom of the base is 6.6% higher than that at the top of the soil foundation, which shows that the thickness of the layers and different structures have an effect on the displacement. Although the upper and lower surfaces of the same structure in different positions, the vertical displacement difference caused by the interlayer structure is significantly larger than the thickness of the structure.
As can be seen from
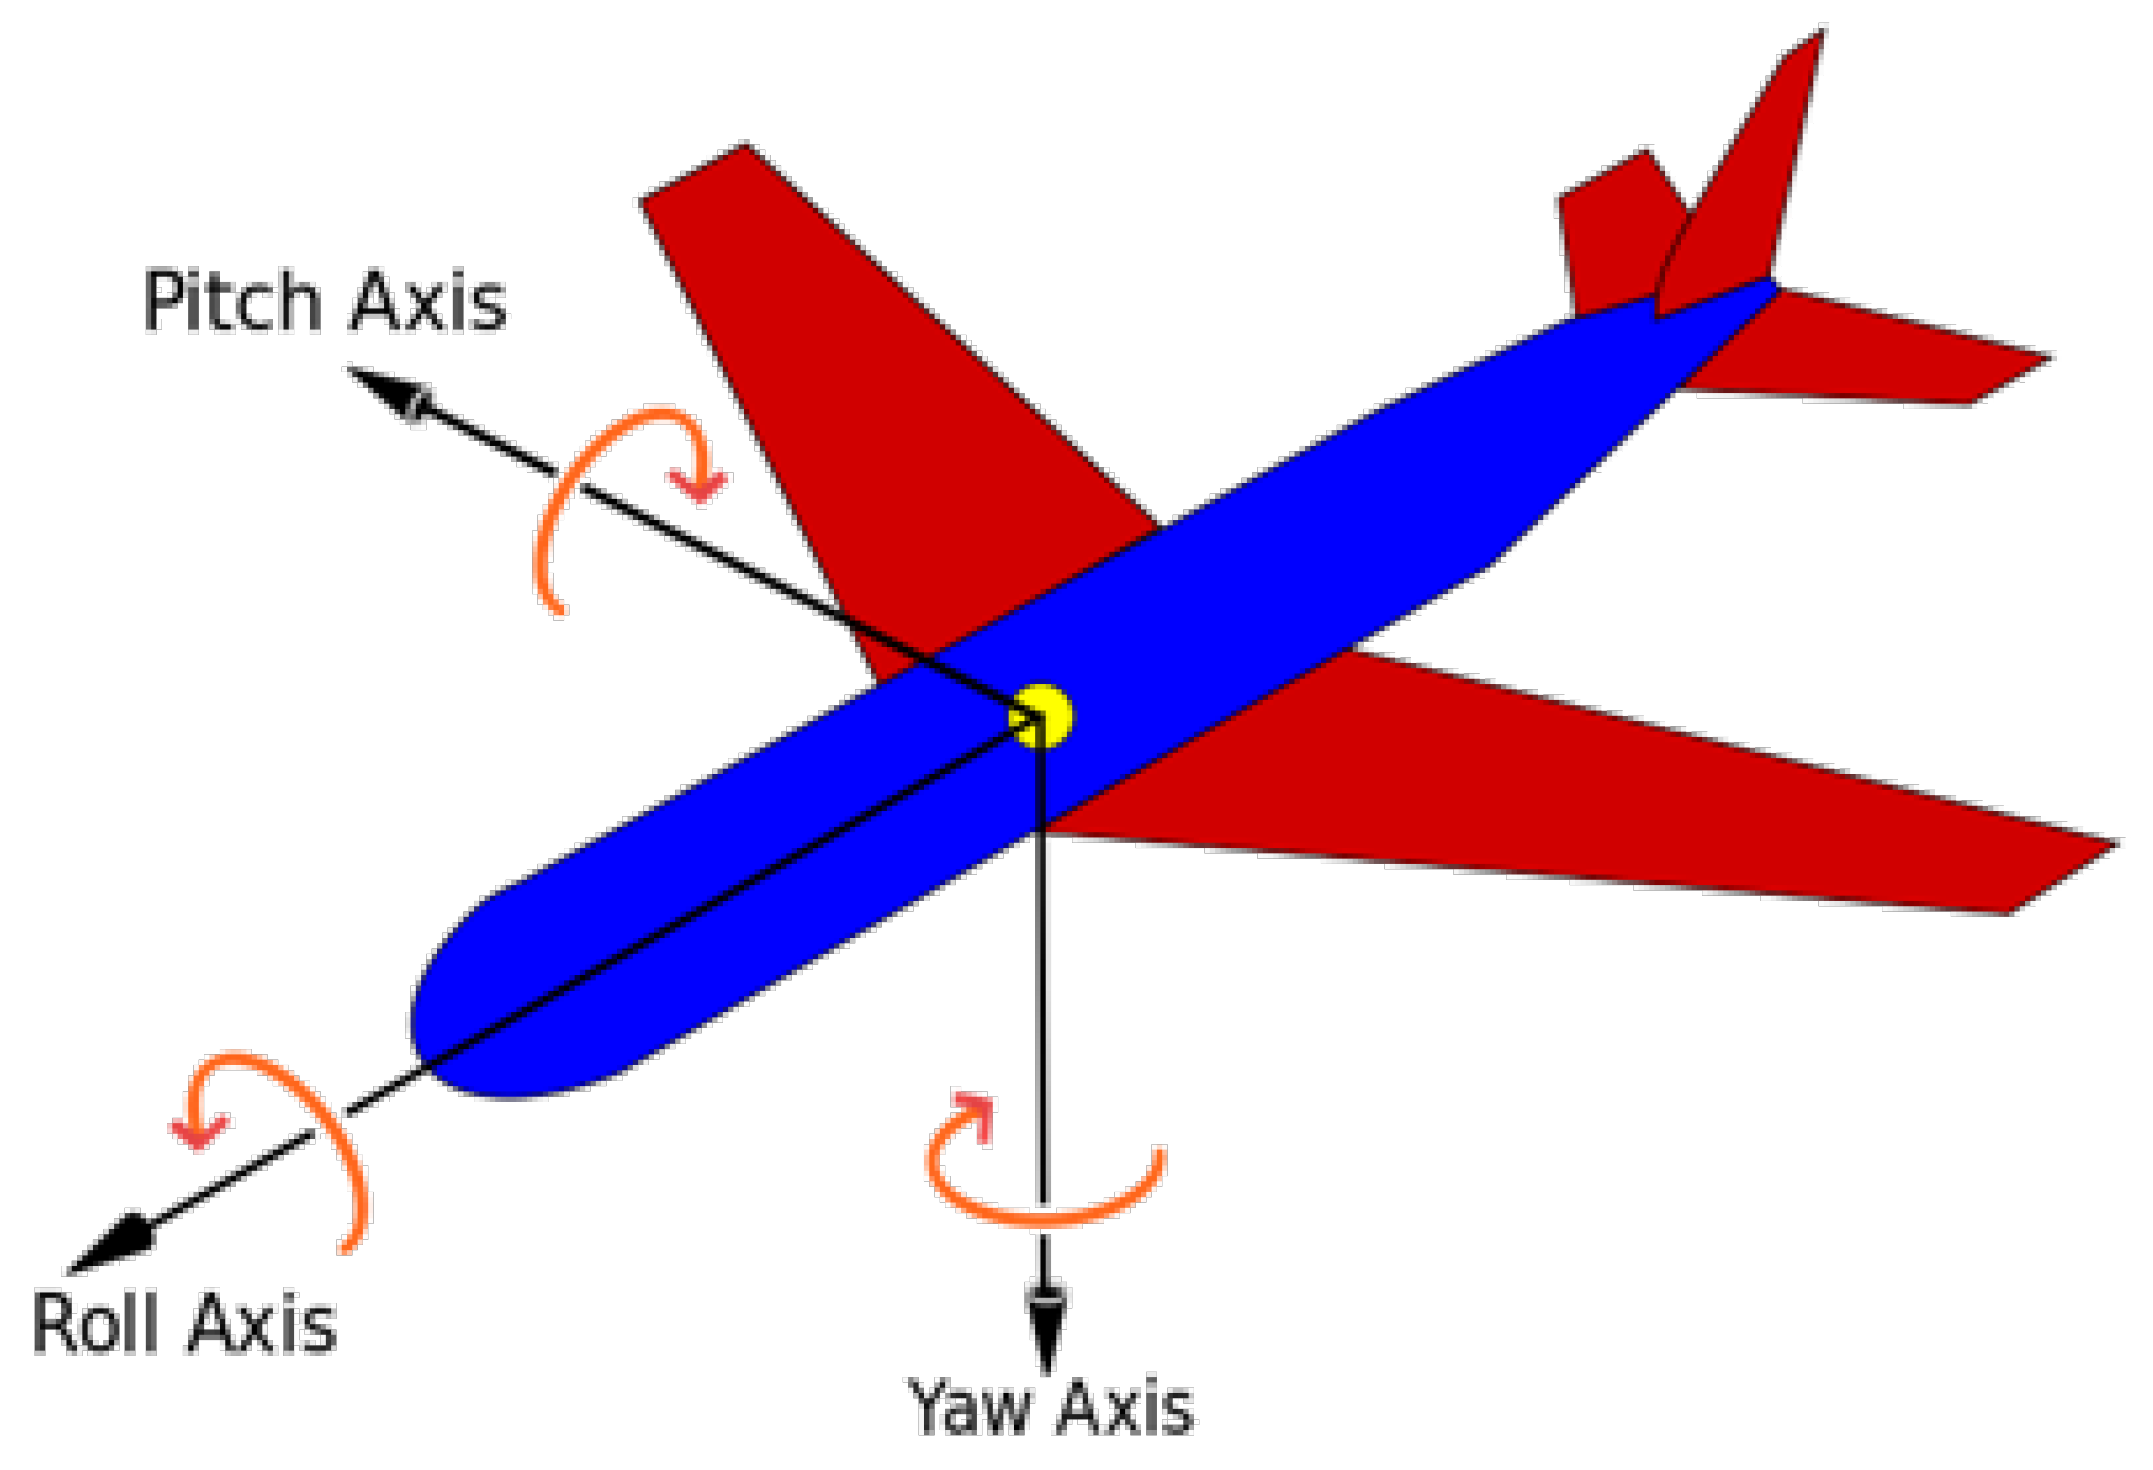
Figure 10, when the tire pressure and sinking speed are certain, the maximum effective stress, effective strain, and vertical displacement of each structure slightly decrease with the increase in the landing pitch angle, and the maximum effective stress and strain also appear at the bottom of the surface and at top of the soil foundation, but the degree of influence of the landing pitch angle is very limited. It is proven that this parameter mainly ensures the attitude stability of the aircraft during takeoff and landing, and prevents the phenomenon of aircraft tail grazing the ground and loss of control due to stall speed.
From
Figure 11, it can be seen that the maximum effective stress, effective strain, and vertical displacement of each structure increased with the increase in the sinking speed at a certain tire pressure and landing pitch angle.
Figure 11a displays the effect of sinking speed on the maximum effective stress of the airport pavement. At 3.0 m/s, the maximum flexural tensile stress at the bottom of the surface is 9.9% and 25.2% higher than at 2.0 m/s and 1.0 m/s, respectively, and the time required to reach the maximum stress is 0.012 s and 0.025 s earlier, implying that the magnitude of the sinking speed affects the impact loading when the landing gear is in contact with the pavement. Therefore, the sinking speed during the landing process should be controlled to ensure the structural safety of the pavement.
Figure 11b demonstrates the maximum effective strain of the pavement for different sinking speeds. It can be seen from the figure that the maximum strain at the top of the soil foundation at 3.0 m/s increased by 31.7% and 93.1% compared to 2.0 m/s and 1.0 m/s, respectively, demonstrating that the increase in sinking speed significantly increases the strain on the airport pavement and affects the safety.
Figure 11c reveals the vertical displacement changes of each structure during the aircraft impact process, and the law is similar to the influence of tire pressure on vertical displacement. Compared to 2.0 m/s and 1.0 m/s, the maximum vertical displacement of 3.0 m/s increased by 28.1% and 93.1%, respectively. However, in terms of time, it can be clearly seen that increasing the sinking speed significantly accelerates the time when the pavement displacement reaches the maximum value. The average time to reach the maximum displacement of each structure at the sinking speed of 3.0 m/s, 2.0 m/s and 1.0 m/s is 0.013 s, 0.014 s, and 0.018 s, respectively, indicating that the larger the sinking speed, the larger the displacement deformation of the pavement in a shorter time.
In addition to the above rules, for a given tire pressure, the landing angle and sinking speed of the aircraft tire are constant. The equivalent stress at the bottom of the surface is the largest, followed by the top of the surface, the bottom of the base, the top of the soil foundation, and the bottom of the soil foundation. It shows that the stress at the bottom of the surface is more significant during the impact process, and the flexural tensile stress should be used as the key index of the impact resistance of the airport runway. The maximum effective strain is at the top of the soil foundation, followed by the bottom of the surface, the bottom of the soil foundation, the top of the surface, and the bottom of the soil foundation. This is due to the fact that the shear modulus of each material in the structure gradually decreases from the top to the bottom. Therefore, even if the stress at the top of the soil foundation is small, it can still withstand a large amount of deformation, and the structure will not break easily. As the landing gear acts directly on the top of the surface, resulting in the largest deformation of vertical displacement, the deformation gradually decreases as the depth of the structure increases. Moreover, the time required to reach the maximum effective stress and strain is the same for each structure, while the time corresponding to the maximum value of displacement lags behind the effective stress and strain. The farther the distance between the surface and the landing gear, the longer the time required.
In order to prove the correctness of the conclusion of this paper, related research from other scholars were compared. Shi Xingna investigated the vibration of the pavement structure using acceleration signals and found that the stress at the combination of the surface and the base of the airport pavement is the most complex and obvious, and proposed stress to be an important control indicator [
27]. Dulli found that the cracks of the airport pavement first appeared on the bottom surface of the surface layer, and the cracks started to expand after the accumulated damage until the development of cracks in the surface layer [
28]. This is consistent with the conclusion in this paper that the stress on the bottom surface of the surface layer can be used as a key concern indicator.
6. Conclusions
In this paper, ANSYS was used to construct the tire–road coupling model of an airport runway, simulate the impact process of aircraft landing, and investigate the influence of tire pressure, landing pitch angle, and sinking speed on the dynamic response of an airport pavement. According to the simulation results, with the increase in the tire pressure and sinking speed, the maximum values of equivalent stress, effective strain, and vertical displacement of different structures increased, and the effect of sinking speed was more significant. With the increase in the landing angle, there was a slight decrease in the response parameters, but the overall change was not significant. In the process of calculating, it was found that the flexural tensile stress at the bottom of the surface, the strain at the top of the soil foundation, and the vertical displacement at the top of the surface are the indicators that should be paid attention in the pavement structure to ensure safety. In addition, the time for each structure of the pavement to reach the maximum stress and strain was constant, while the displacement time was slightly delayed, and the farther the distance between the structure and the top of the surface, the longer the time required.
In summary, the influence of sinking speed on the dynamic response of the airport pavement was the most significant, followed by tire pressure, and the landing pitch angle was negligible. During the operation of an airport, attention should be paid to indexes such as the stress at the bottom of the surface, the strain at the top of the soil foundation, and the vertical displacement at the top of the surface. Sensors can be used to monitor changes in the above indexes in real time to determine the best time for pavement maintenance and ensure the operational safety of the airport.
In this paper, only an asphalt mixture pavement was studied, and cement concrete pavements were not included. Meanwhile, the influence of environmental factors on the pavement during aircraft landing was not taken into account, and a coupled tire–road surface–environment model can be constructed in the future to obtain a better simulation of the impact effect on airport pavements during aircraft landing.

