Abstract
The extracts and extractive residues were obtained by single-stage extraction with acetone, CS2 and acetone/carbon disulphide solvent (IACDSM) under mild conditions, and they were then characterised by infrared and segmented peak fitting analysis. The results showed that acetone and CS2 solvents could dissolve more aromatic structures containing fatty side chains, while the mixed solvents could extract more phenolic substances. The acetone extracts were mainly asymmetric -CH2 stretching vibrations, while the remaining two extracts were dominated by aliphatic -CH. A comparison of the IR results of the tar residue and the three solvent extracts showed that the main structure of the tar residue was not altered throughout the process, but the aromatic structure was altered more by the extraction. Compared to the original sample, the proportion of tetrasubstituted or trisubstituted benzene rings in the three solvent extracts increased, while the proportion of pentasubstituted benzene rings produced a significant decrease. Comparison of the IR structural parameters showed that the aromatic ring condensation was higher in the as-received CS2 extracts and acetone extracts, with the acetone extracts having longer straight aliphatic chains and fewer branched chains. The analysis of the composition of the extraction results provides a reference basis for the separation and purification technology of coal tar residue, enabling the further development of China’s coal chemical industry.
1. Introduction
The coal coking production process produces a large amount of residues, among which coal tar residue is classified as hazardous waste due to the large amount of carcinogenic polycyclic aromatic hydrocarbons (PAHs) [1,2], which make it a wasted available resource [3]. Although there are many comprehensive utilization methods for tar residue, the lack of in-depth research on the nature of tar residue and the high cost of treatment have prevented the effective treatment and high value-added utilization of tar residue [4].
Coal tar residue still contains more organic aromatic compounds and fixed carbon. The solvent extraction method uses the “similar solubility” principle of the organic components in coal tar residue [5,6] and the extraction solvent to achieve the separation and recovery of organic components in coal tar residue [7,8] and improve its utilization rate.
The extracts are generally determined by gas chromatography–mass spectrometry (GC/MS) [9], Fourier transform infrared spectrometry (FTIR) [10], and pyrolysis gas chromatography-mass spectrometry (PY-GC/MS) [11] techniques to determine their compositional structures. Liang et al. [12] investigated the effect of deashing on the structure of Yimin lignite using FTIR and concluded that the deashing process had a greater effect on the aromatic structure and oxygen-containing functional groups, mainly due to the three effects of substitution, hydrolysis, and ion exchange that occurred during the deashing process. Liang et al. [13] conducted a qualitative and semi-quantitative study of the functional groups of long-flame and anthracite coals based on the FTIR and split-peak fitting techniques. The results showed that the organic matter content of low-degradation coals was less than that of high-degradation coals, and the organic matter maturity of high-degradation coals was higher than that of low-degradation coals. As the degree of coal metamorphism increases, the degree of coal aromatization becomes higher and the degree of coal aromatic ring condensation becomes stronger and more prone to condensation. Wang et al. [14] used acid-washed and Hefeng sub-bituminous coals as research objects, and analysed the molecular structures of the extracted products with the help of FTIR and segmented peak fitting methods. The results showed that the hydroxyl hydrogen bonding structure of all five extraction levels was dominated by self-conjugated hydroxyl hydrogen bonds; CS2 dissolved a larger proportion of aromatic structures containing fatty side chains in the five extraction levels. The functional groups contained in the extracts were the same at all levels. Zhao et al. [15] analyzed the structural characteristics of different chemical components of Yimin lignite using Fourier transform infrared spectroscopy. The results show that humic acid and asphaltene have fewer aromatic rings and are mostly in the form of monocyclic rings, while residual coal has more aromatic rings and is mostly in the form of naphthalene rings; and that humic acid and asphaltene contain a large number of aliphatic hydrocarbons, which are shorter in length and more branched.
In this paper, single-stage extraction experiments with various solvents were carried out on tar residues using ultrasonic-assisted extraction at room temperature. The extracts and extractive residues were analysed by FTIR detection and segmented peak fitting techniques in order to obtain the structural characteristics of the soluble organic components in the tar residues.
2. Materials and Methods
2.1. Sample Preparation and Reagents
Coal tar residue came from the Yulin Lanchar plant. The samples were dried under vacuum conditions at 40 °C for 2 h, then taken out and placed in a desiccator at room temperature and sealed in bags. The elemental and industrial analyses of the samples are shown in Table 1. The acetone and CS2 solvents used in the experiments were commercially available analytically pure reagents, which were refined by rotary evaporator before use.

Table 1.
Proximate and ultimate analyses of the coal tar residue samples.
2.2. Extraction Experiments
Weigh 5 g of coal tar residue into a filter paper cartridge in a beaker, add 40 mL of each of the three organic solvents, acetone, CS2 and CS2/acetone (1:1, V:V), place in an ultrasonic cleaner and shake for 20 min; ultrasonic power: 100%, extraction temperature: 20 °C. After extraction, remove and filter the filter paper cartridges, concentrate the extract using a rotary evaporator, transfer to a sample bottle to dry, and weigh naturally.
2.3. FTIR Determination and Split-Peak Fitting of Samples
The structure and functional groups of coal tar residue extracts and extractive residues were analysed using a Nicolet iN10 & iZ10 Fourier infrared spectrometer from Thermo Fisher Scientific, Waltham, MA, USA. The IR measurement conditions were: 100 um, 2 min scan, resolution 0.4 cm−1, scan range 400–4000 cm−1, and test specimens were produced using the KBr compression method.
Due to the complexity of the structure of coal tar residue, its IR spectra cannot directly give specific information on the structure of the functional groups corresponding to the overlapping peaks and shoulder peaks, so this paper uses Origin 2019b to fit the measured IR spectra to the peaks, referring to the literature [16,17] for the partitioning of the aromatic structures in the 700–900 cm−1 region, the distribution of oxygen-containing functional groups and C=C bonds of benzene rings in the 1000–1800 cm−1 region, aliphatic hydrogens in the 2800–3000 cm−1 region, and hydroxyl groups in the 3000–3600 cm−1 region. The distribution of hydroxyl functional groups in the 700–3600 cm−1 region was quantified in order to obtain more adequate information on the structure of tar residues.
3. Results and Discussion
3.1. Infrared Spectroscopic Characterisation of Extracts
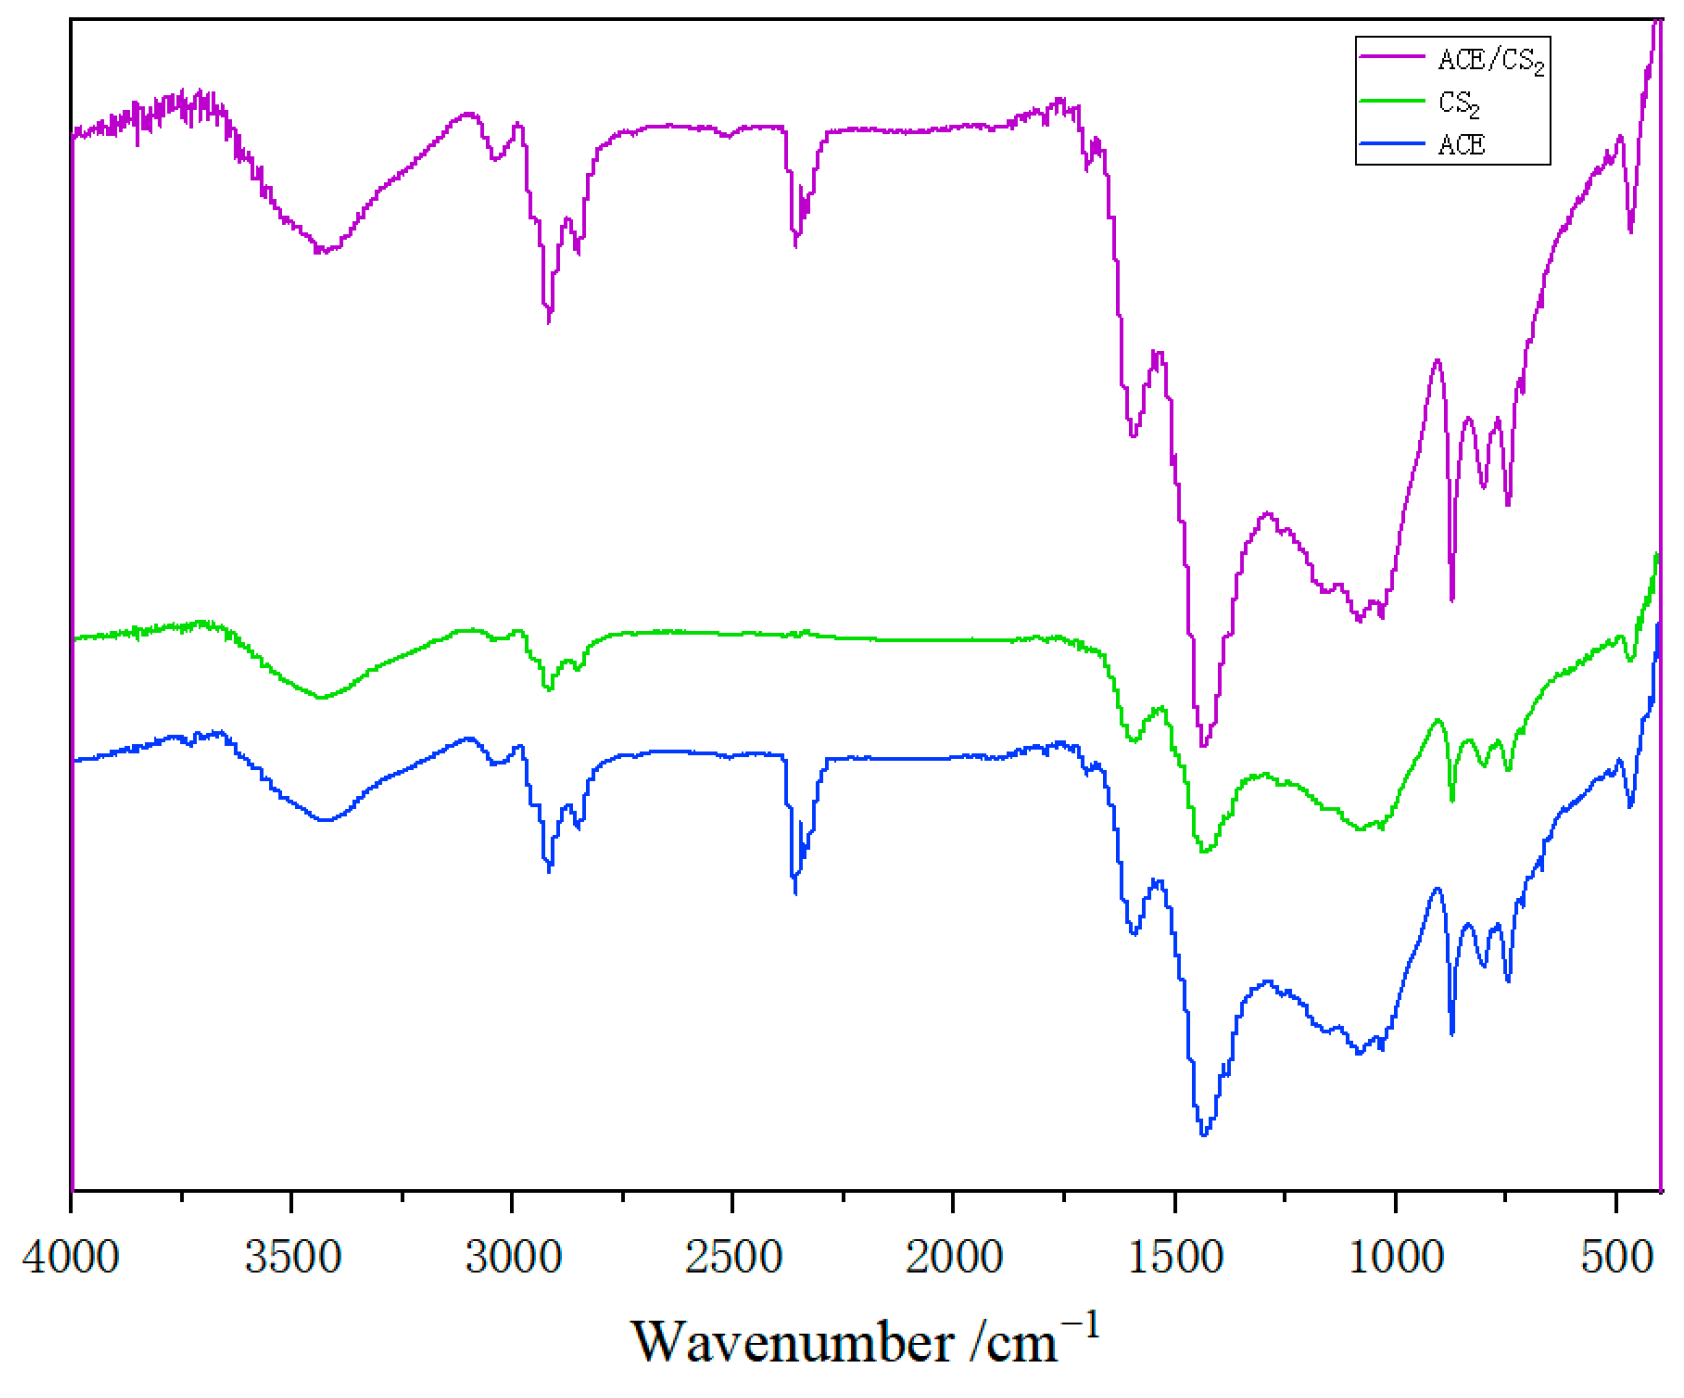
Figure 1 shows the FTIR spectra of the three solvent single-stage extracts of coal tar residue. The absorption peaks around 3440 cm−1 for the three solvent extracts are the characteristic absorption peaks of joined hydroxyl groups or the absorption peaks of stretching vibrations of intramolecular hydrogen bonds. The peaks of some intensity at 3043 cm−1 for the three solvent extracts are the absorption peaks of C-H stretching vibrations on the benzene ring. Increasing aromatic ring condensation and higher aromatic ring substitution reduces the C-H structure and thus makes the absorption peak weaker. The peak near 1594 cm−1 is the absorption peak of the C=C backbone stretching vibration of the aromatic ring. The multiple absorption peaks between 2850–2920 cm−1 represent the aliphatic hydrogen absorption peaks of the -CH2- structure, while the absorption peak near 1435 cm−1 is the characteristic aliphatic hydrogen peak of the -CH3- structure, both of which indicate a high level of aliphatic structure and aromatic ring oligomerisation in the three extracts. 910–650 cm−1 is the characteristic absorption peak of the aromatic compound. The absorption peaks at 910–850 cm−1 are usually the out-of-plane bending vibration absorption peaks of a single (i.e., isolated) hydrogen atom by a substituted benzene ring; at 815–790 cm−1 they are caused by the out-of-plane bending vibration of two neighbouring hydrogen atoms by a substituted benzene ring; at 750 cm−1 they are caused by the out-of-plane bending vibration of three neighbouring hydrogen atoms by a substituted benzene ring; and at 710 cm−1 they are the out-of-plane bending vibration absorption peaks of aromatic ring skeletons. The absorption peak at 710 cm−1 is an out-of-plane bending vibration of the aromatic ring backbone. All of these indicate that the extract contains a high concentration of aromatic compounds [14].
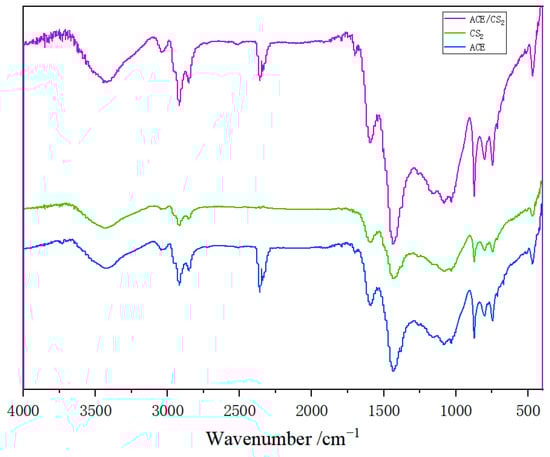
Figure 1.
Infrared spectra of three solvent extracts from coal tar residues.
3.2. Infrared Spectral Split Peak Fitting of Extracts
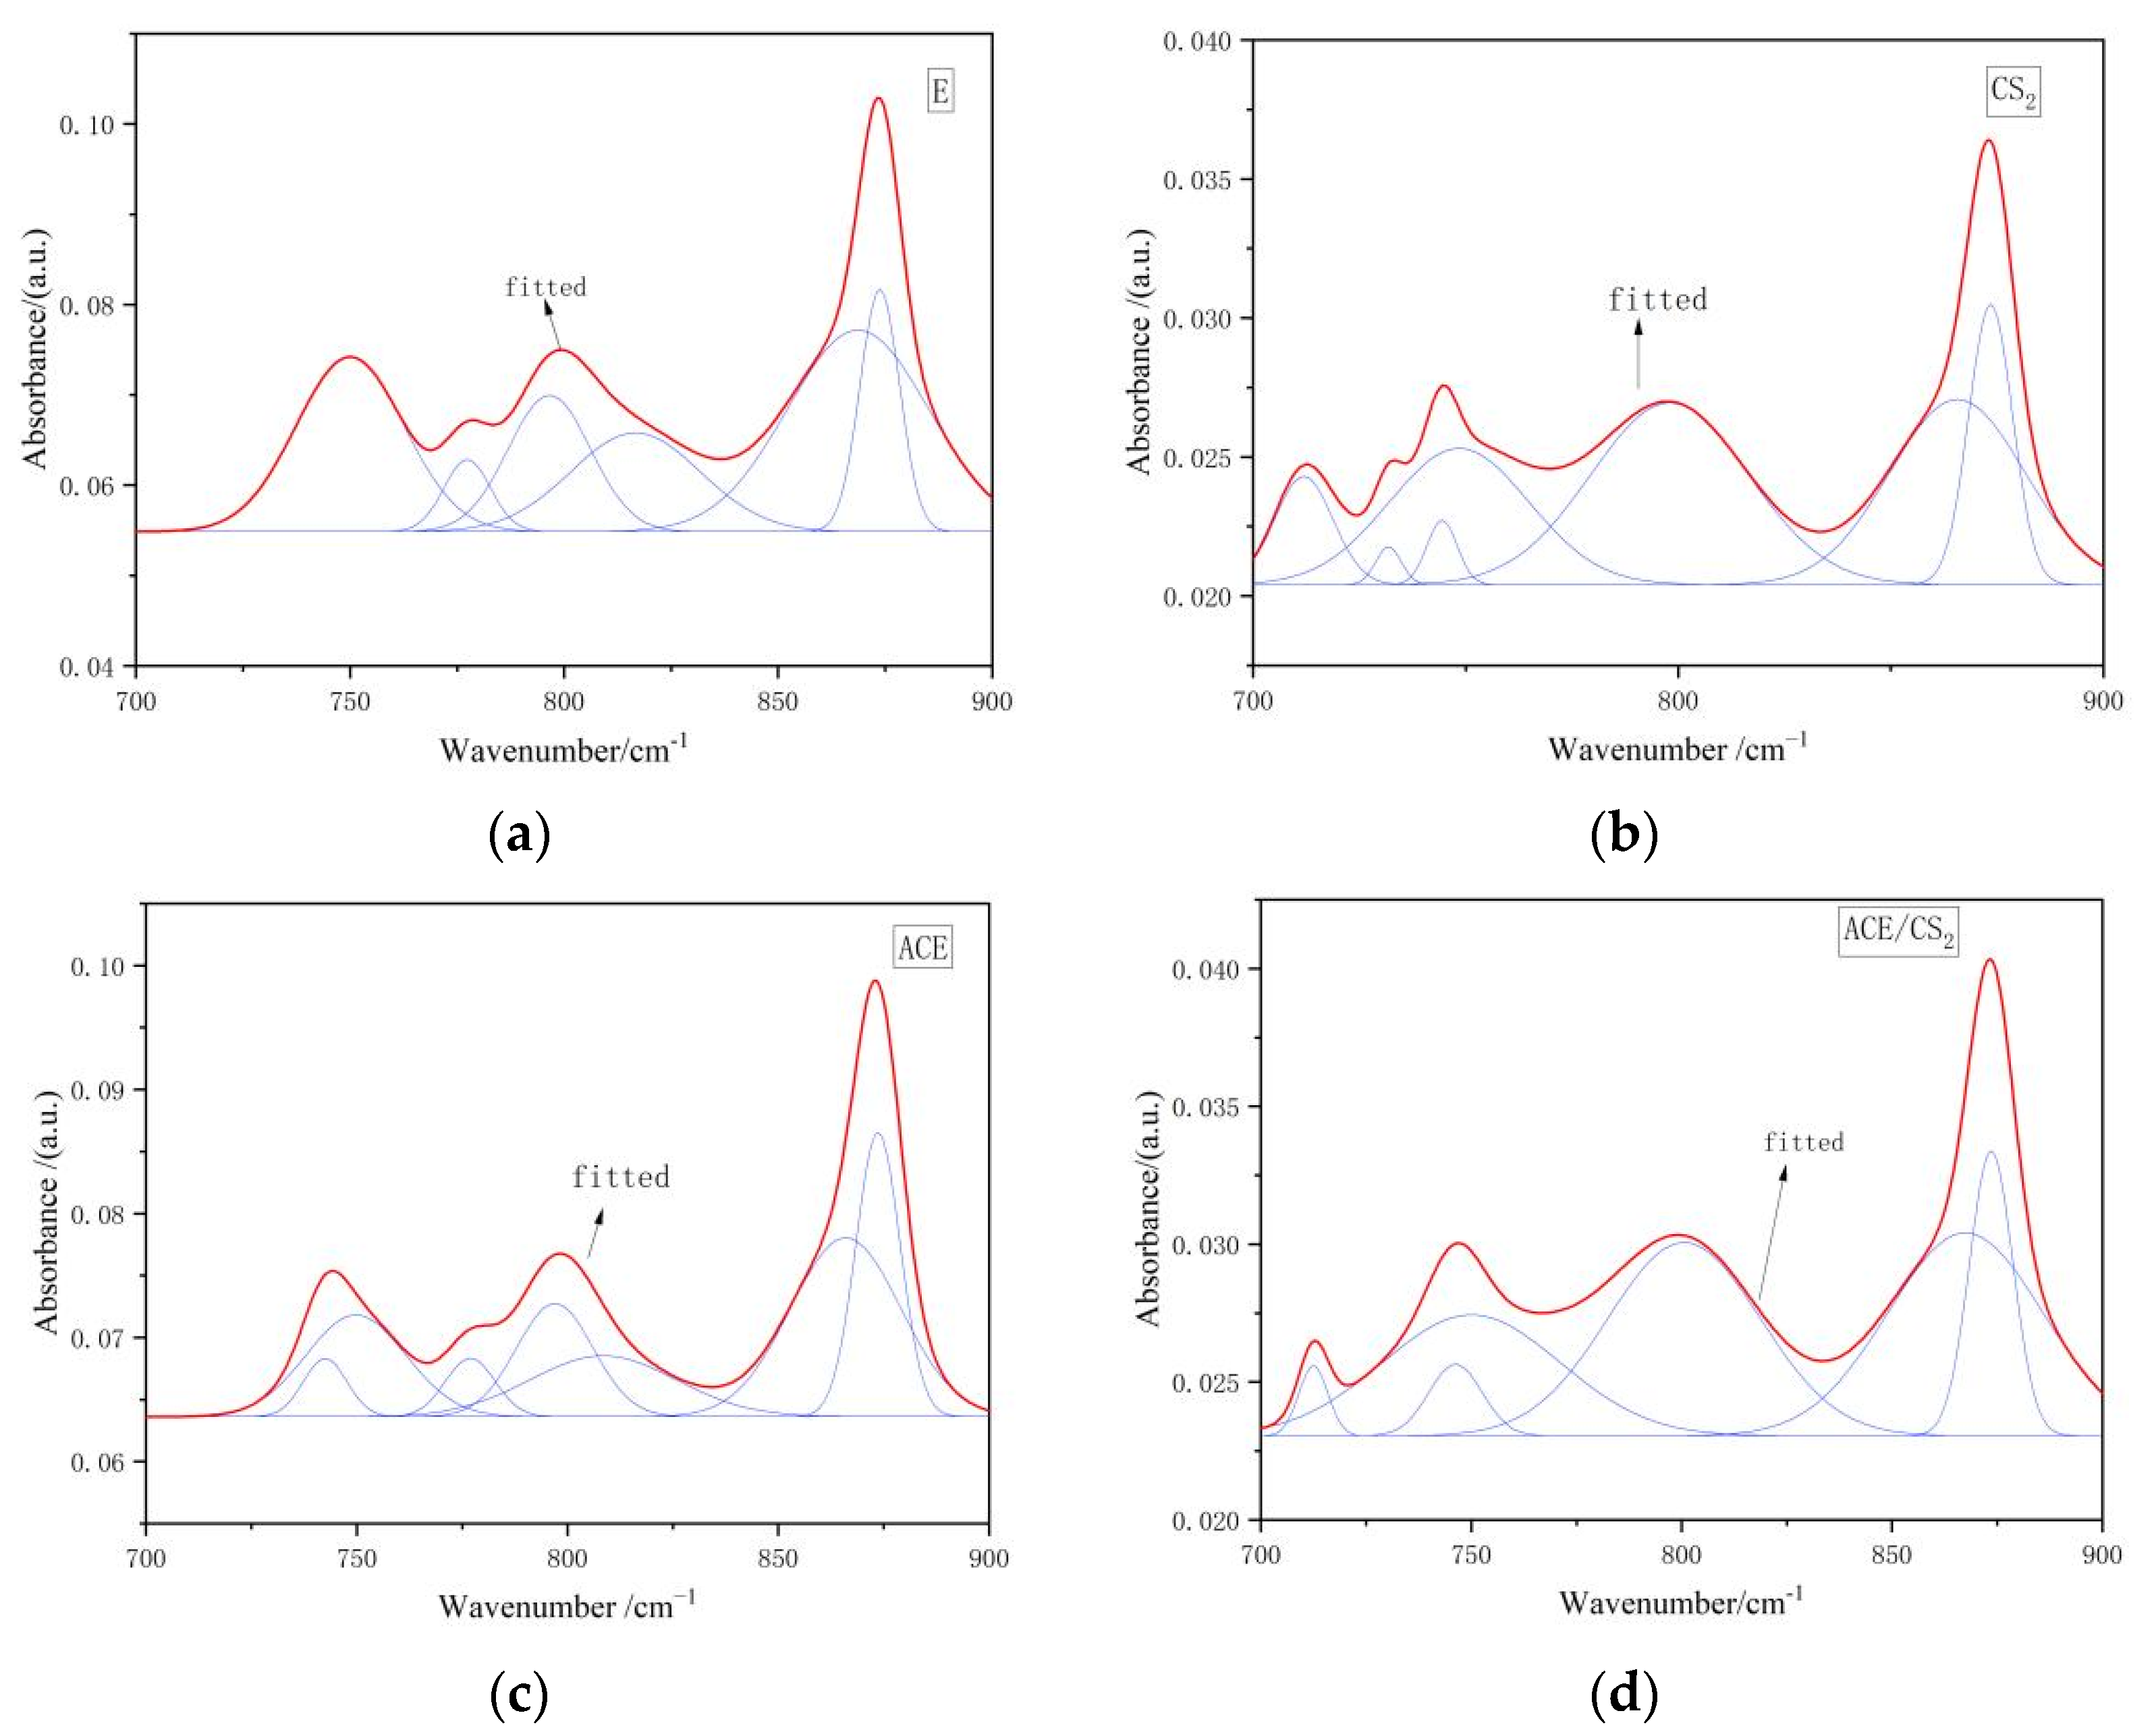
3.2.1. Results of Peak Splitting Fits for Extracts in the 700–900 cm−1 Interval
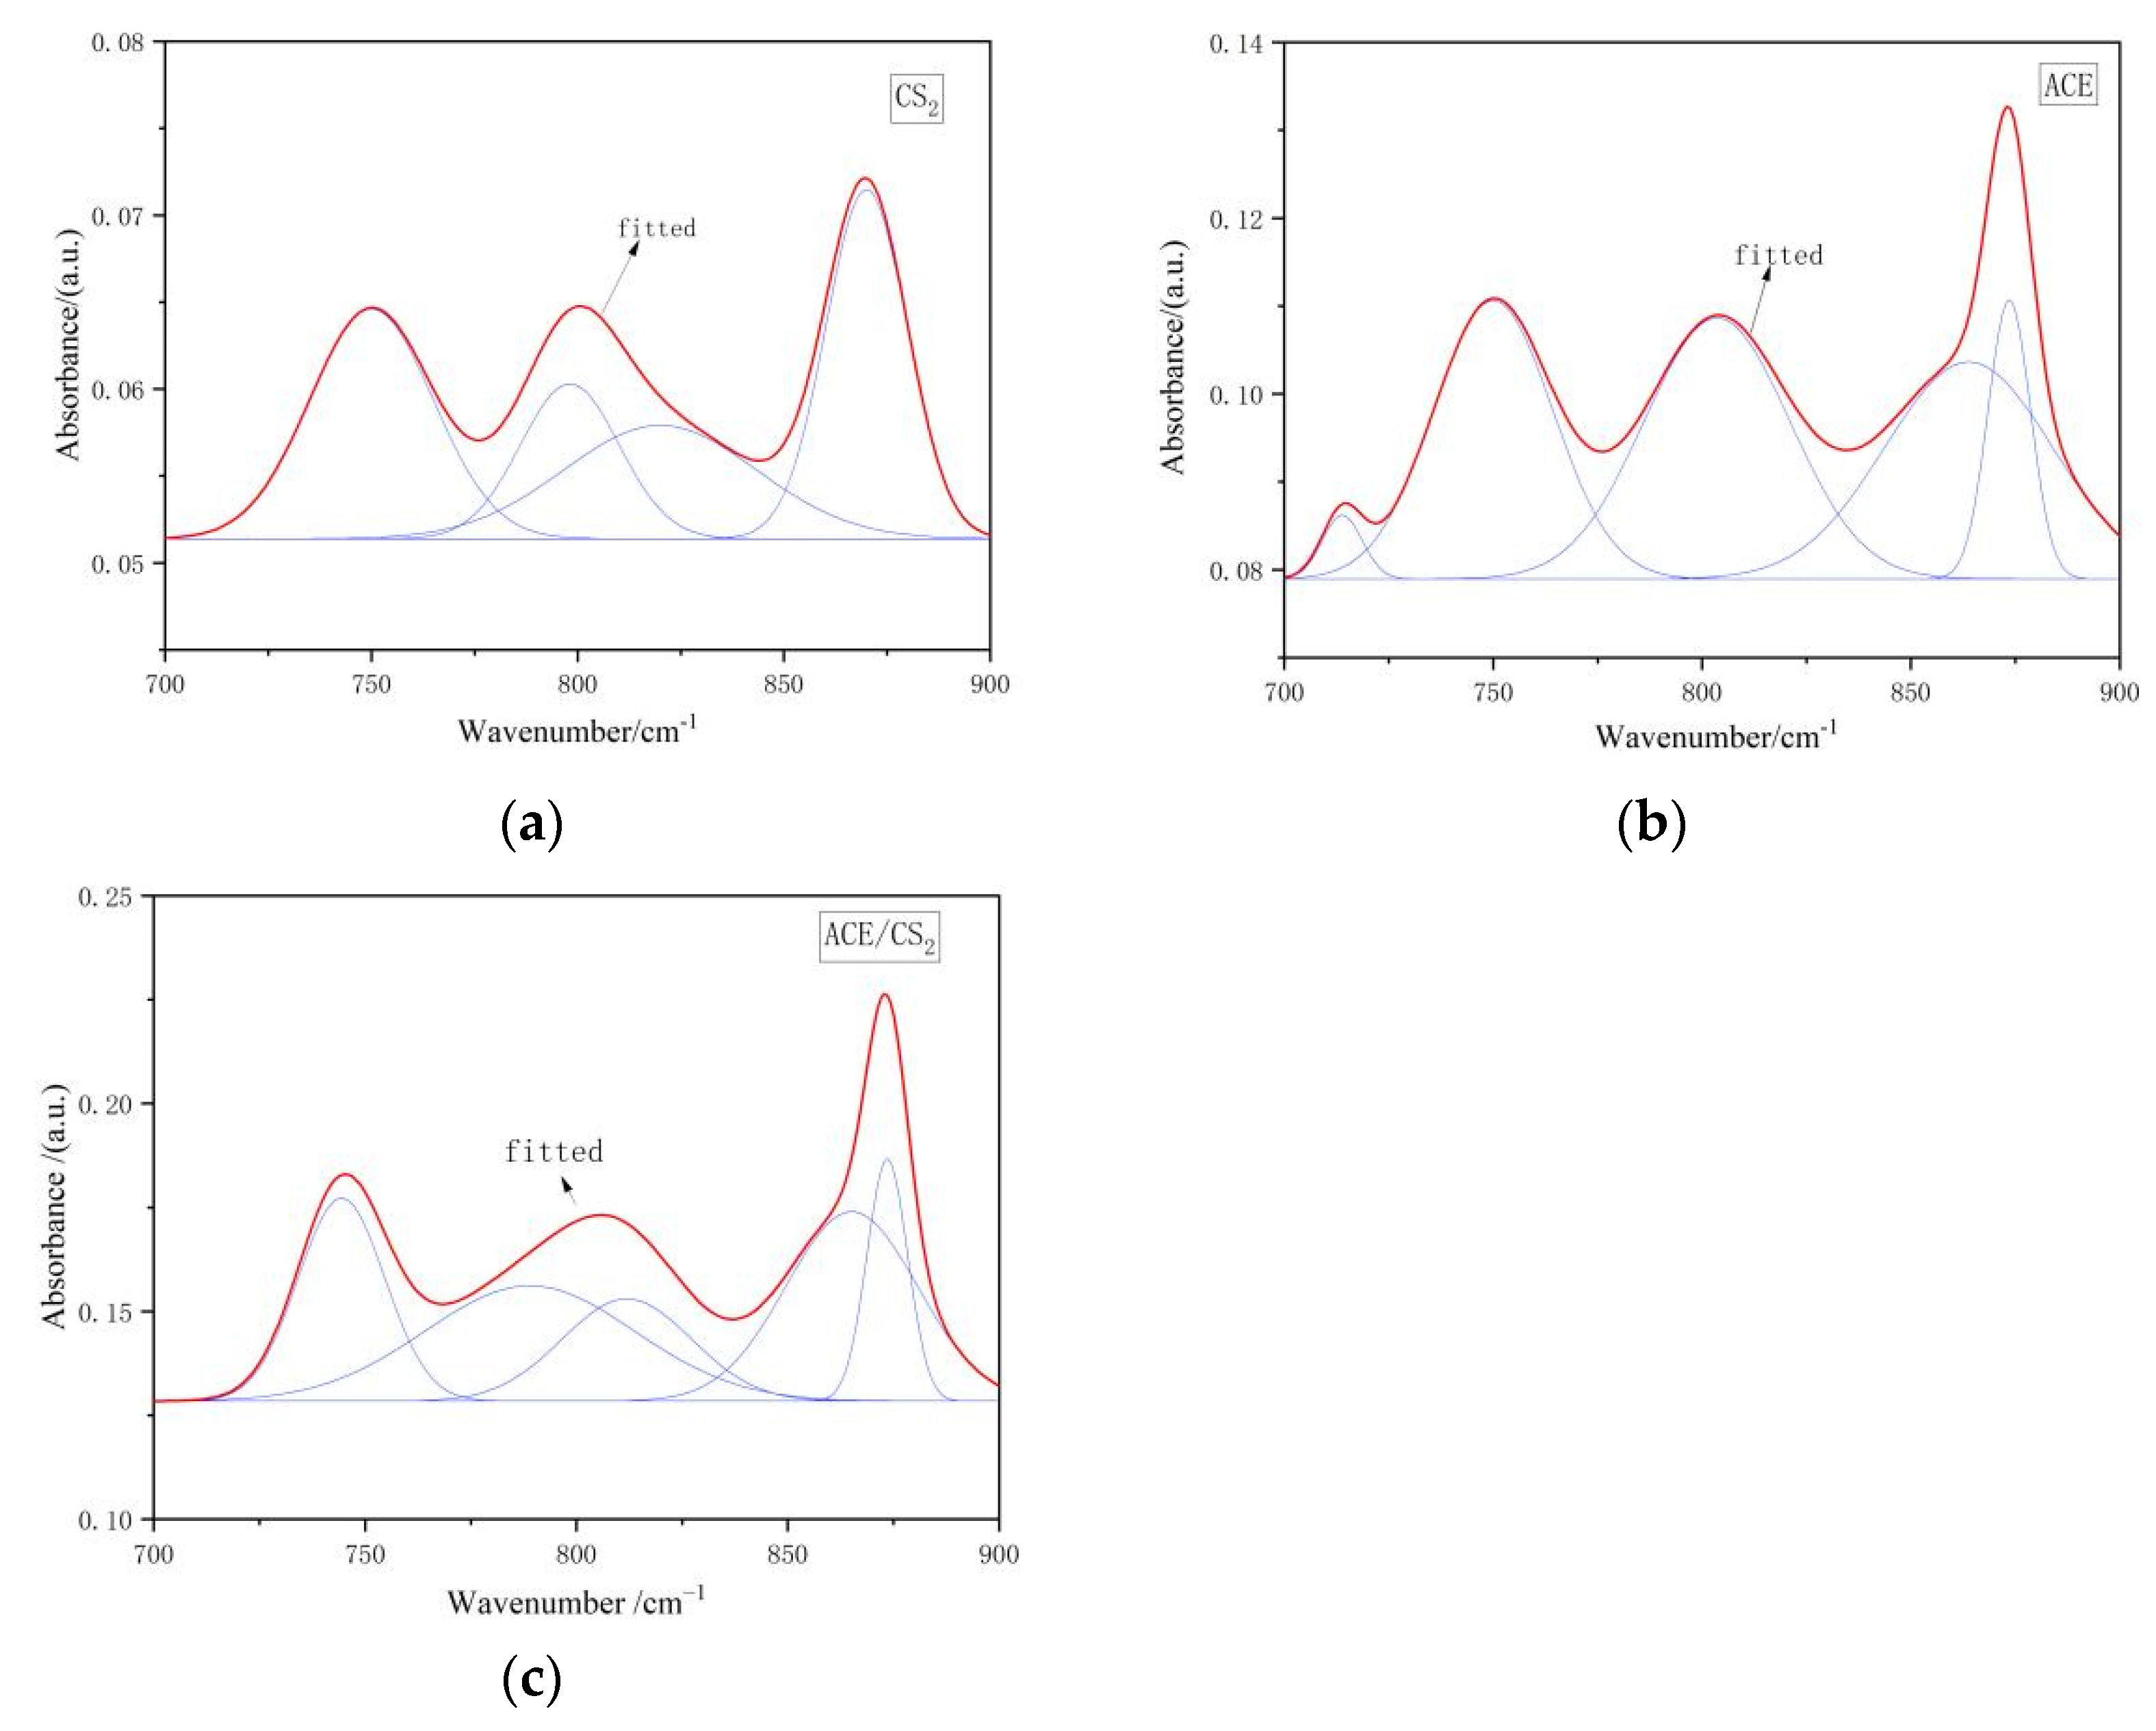
Figure 2 shows the fitted IR peak splitting curves for the three extracts in the 700–900 cm−1 interval. The peaks of the infrared spectra in this region are the characteristic absorption peaks of aromatic compounds. The position of the absorption peaks in this wave number range can be used to determine the substitution of hydrogen atoms on the aromatic ring. The CS2 extracts were predominantly disubstituted, tetrasubstituted, and pentasubstituted benzene rings. The acetone extracts and the acetone/CS2 mixture extracts were dominated by benzene ring trisubstitution. The fitted data results in Table 2 show that acetone and CS2 can dissolve more aromatic structures containing aliphatic side chains.
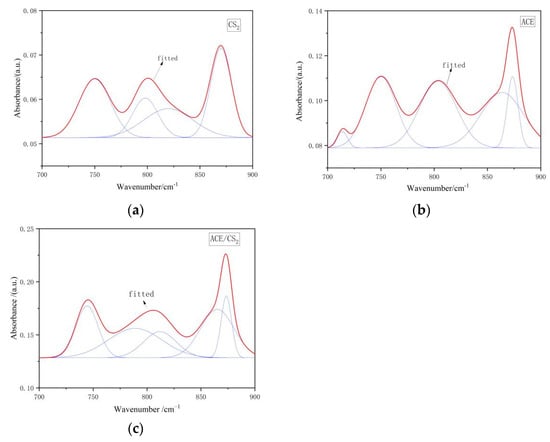
Figure 2.
Infrared spectra of extracts in the 700–900 cm−1 range. ((a) is the carbon disulphide fit, (b) is the acetone fit and (c) is the mixed solvent fit. The red line is the fitted curve and the blue line is the sub peak).
Table 2.
Infrared spectra of three solvent extracts 700–900 cm−1 split peak fitting ratio of each absorption peak area.
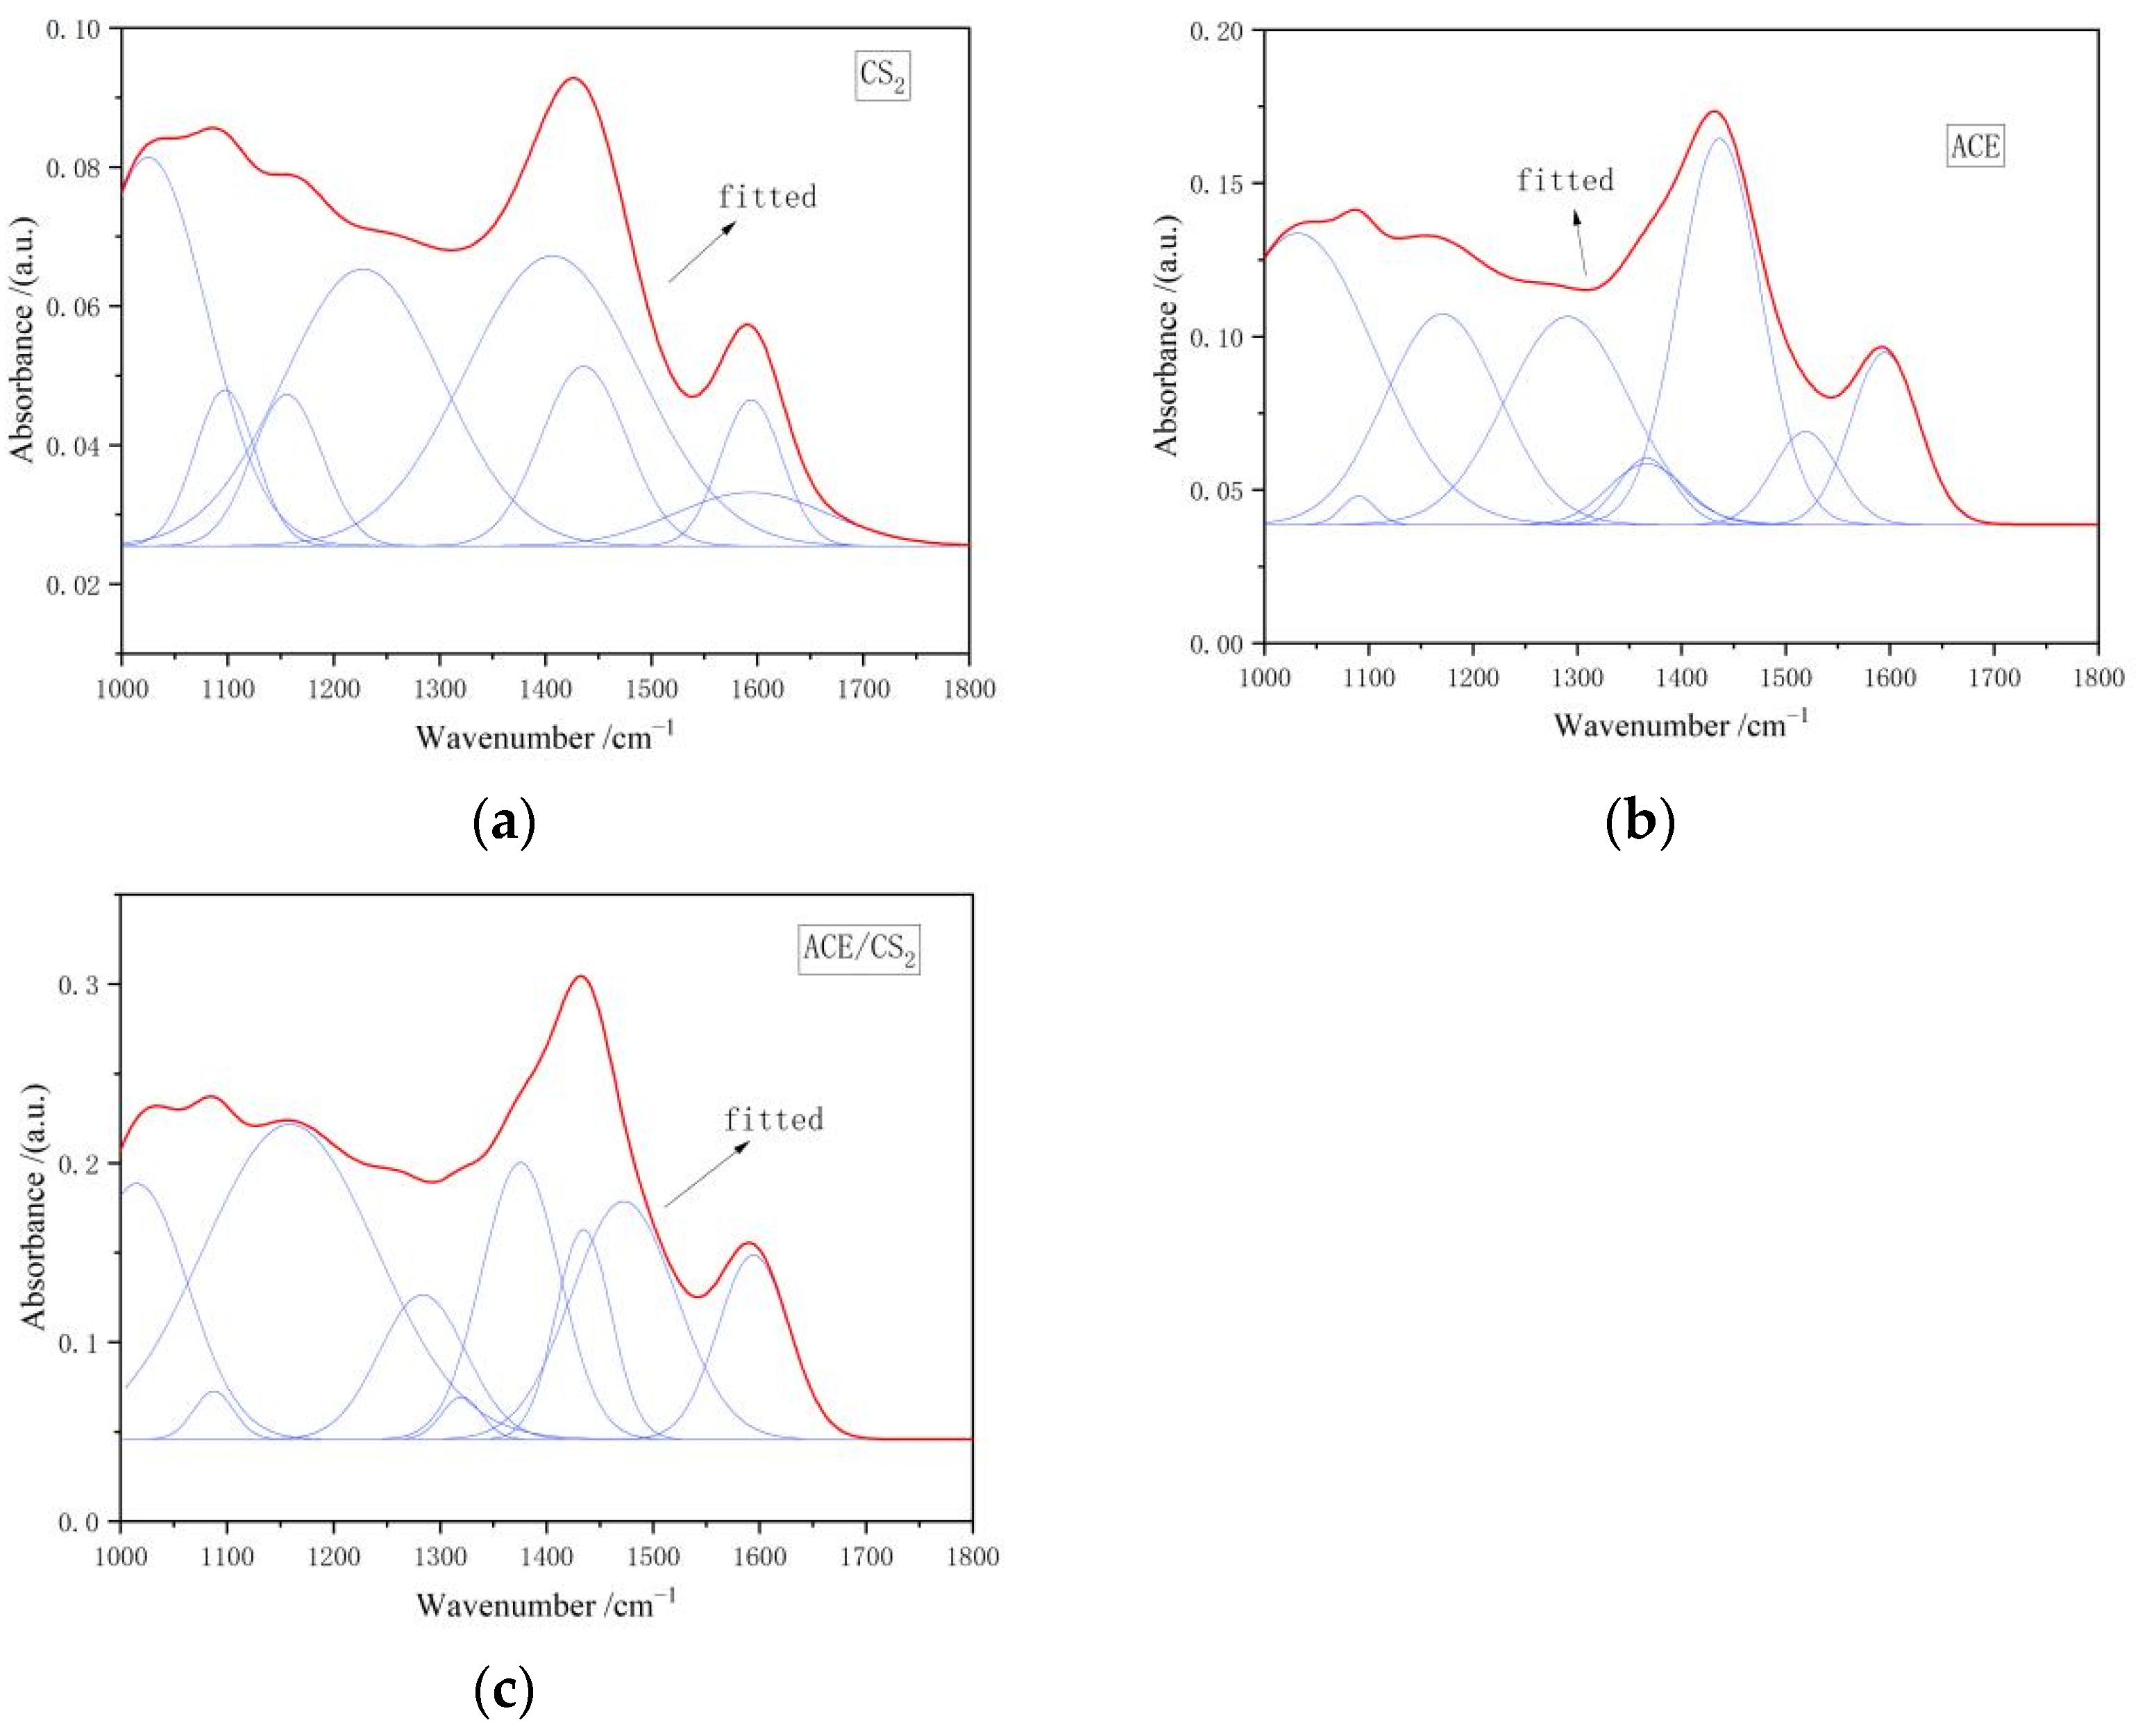
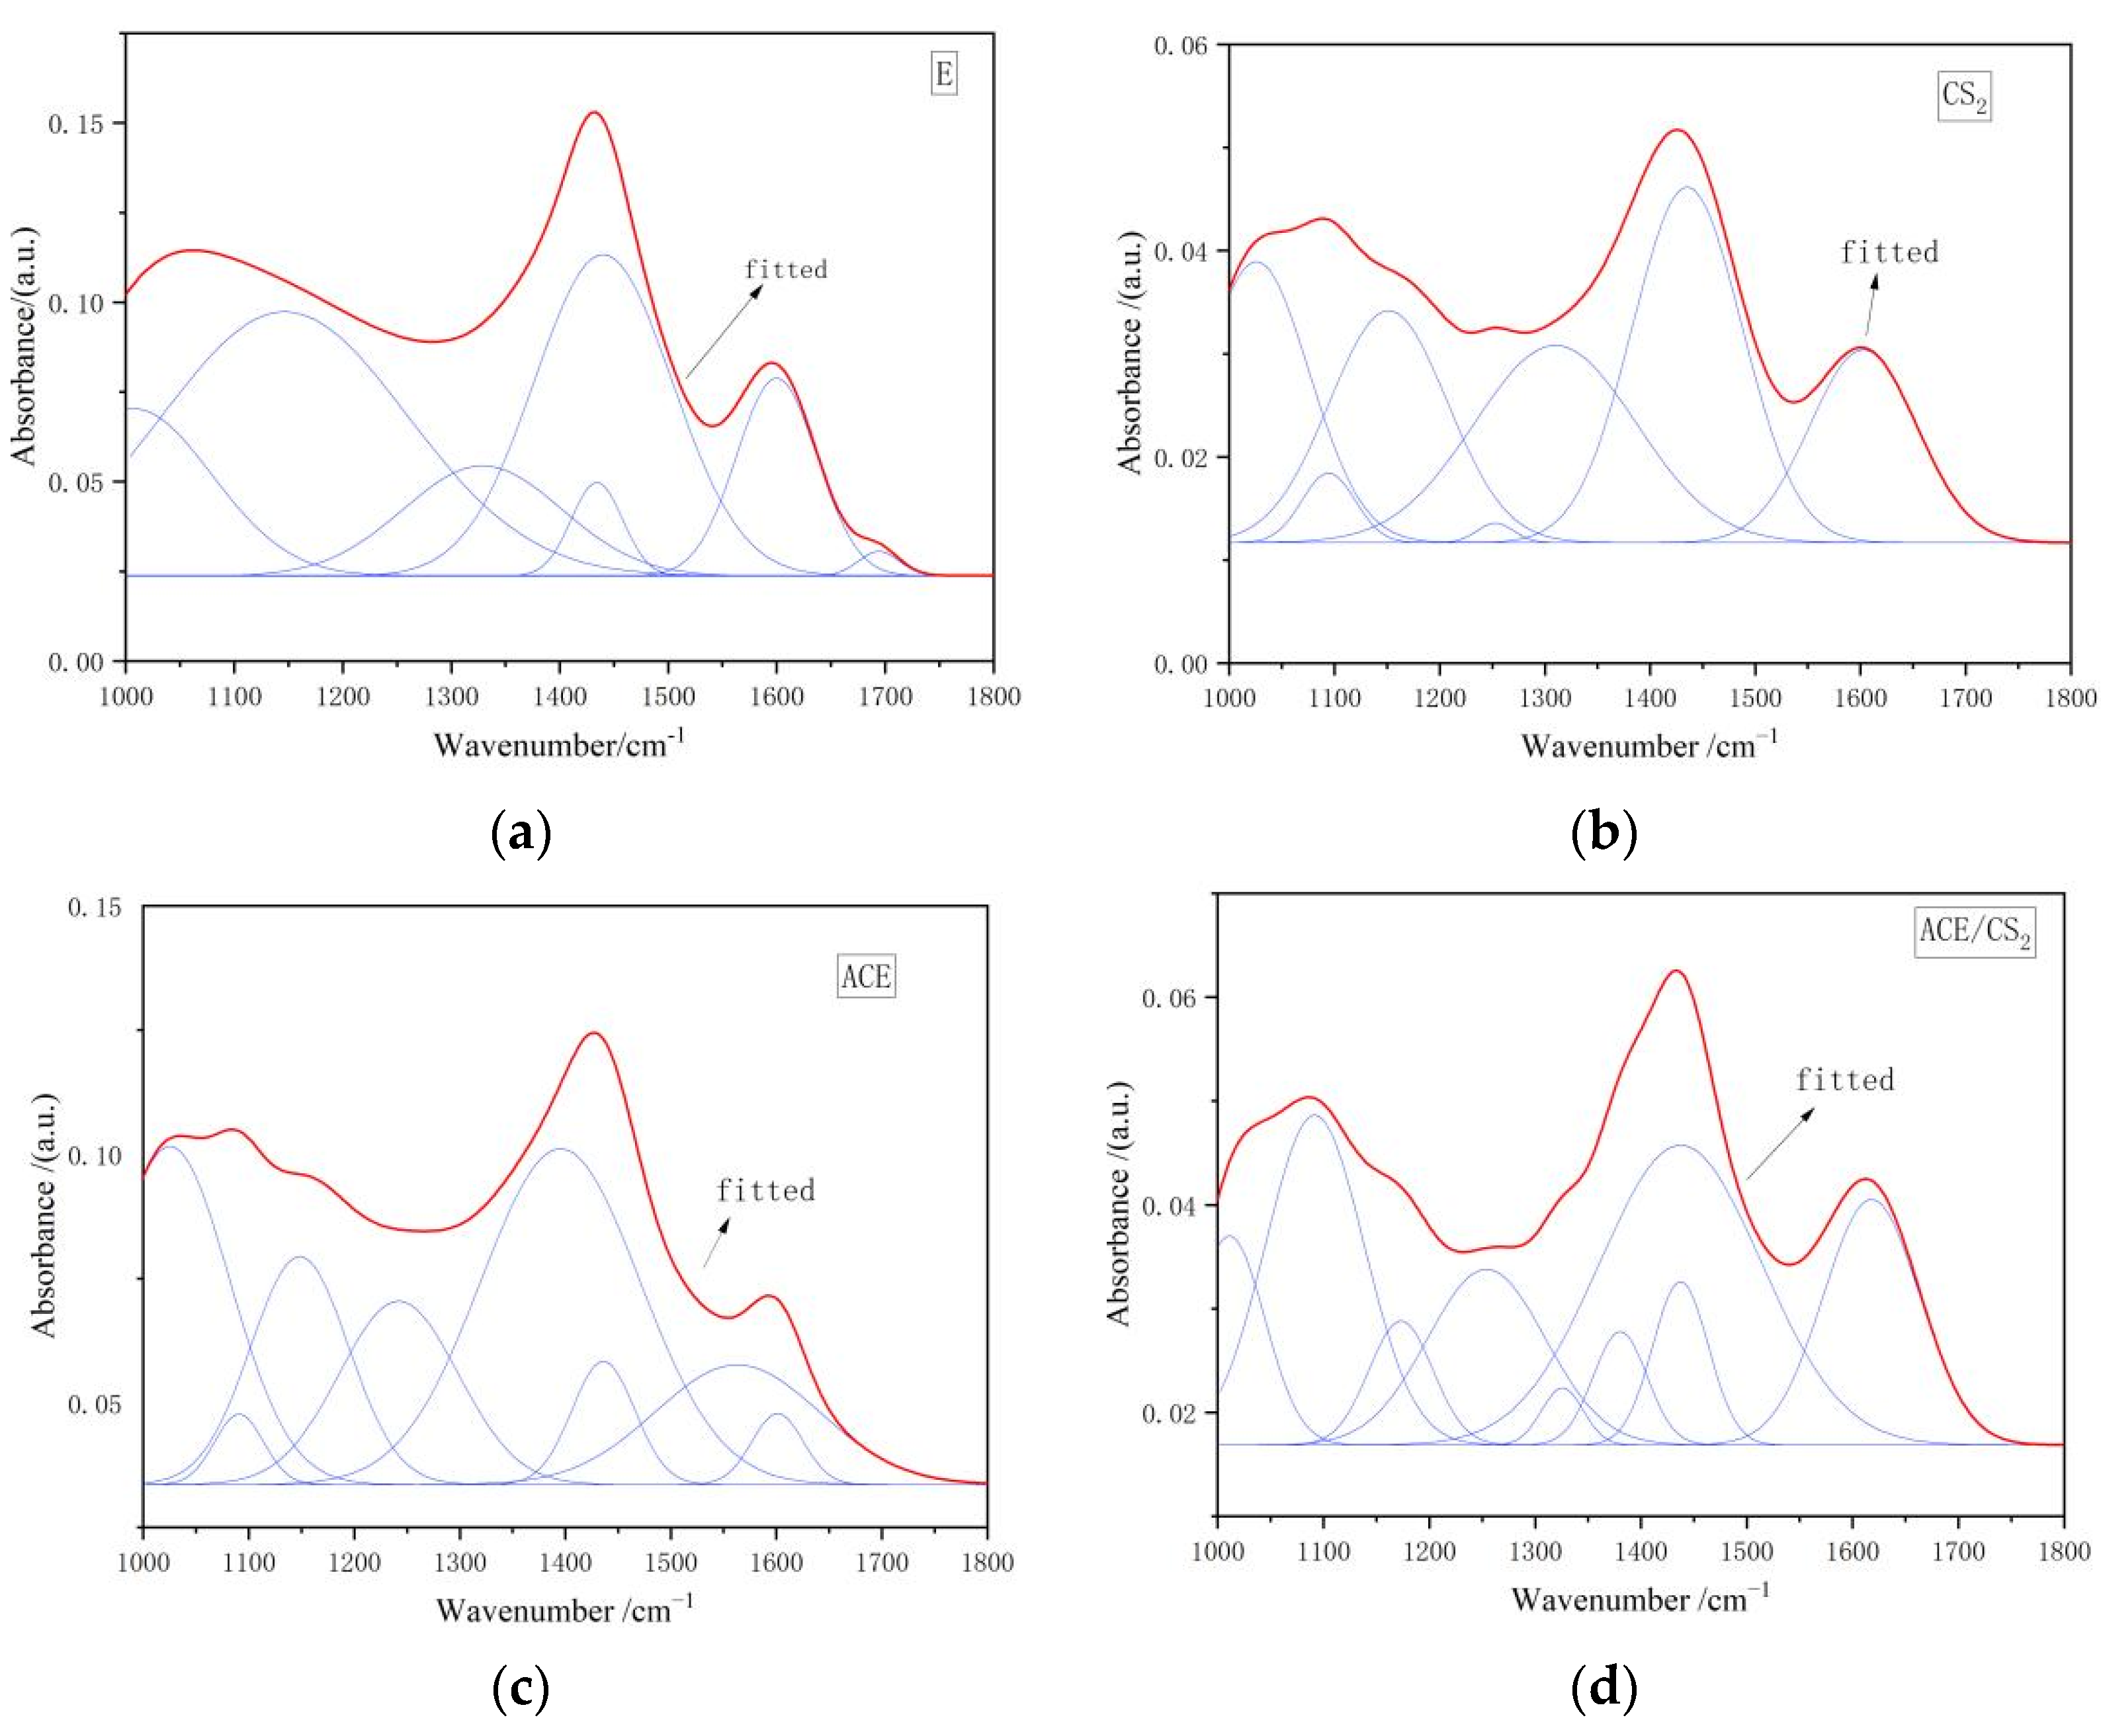
3.2.2. Extracts 1000–1800 cm−1 Interval Peak Splitting Fit Results
Figure 3 shows the IR peak fitting curves of the three solvent extracts in the 1000–1800 cm−1 interval. Combining the fitted parameters of the spectra shows that the acetone extracts are dominated by asymmetric vibrational absorption peaks in the C-H plane and absorption peaks associated with the C-O-C band, which is probably the ether group of dibenzofuran. The CS2 extracts are dominated by asymmetric vibrational absorption peaks in the C-H plane and asymmetric =C-O-C absorption peaks in aromatic ethers. The mixed extracts are dominated by the C-O stretching vibrations of the phenols. From the results of the fitted data in Table 3, it is clear that the acetone/CS2 solvent mixture extracts more phenolics.
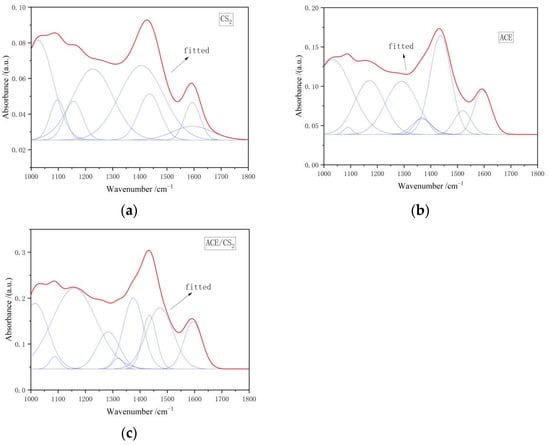
Figure 3.
Infrared spectra of extracts in the 1000–1800 cm−1 range. ((a) is the carbon disulphide fit, (b) is the acetone fit and (c) is the mixed solvent fit. The red line is the fitted curve and the blue line is the sub peak).
Table 3.
Infrared spectra of three solvent extracts 1000–1800 cm−1 split peak fitting ratio of each absorption peak area [14].
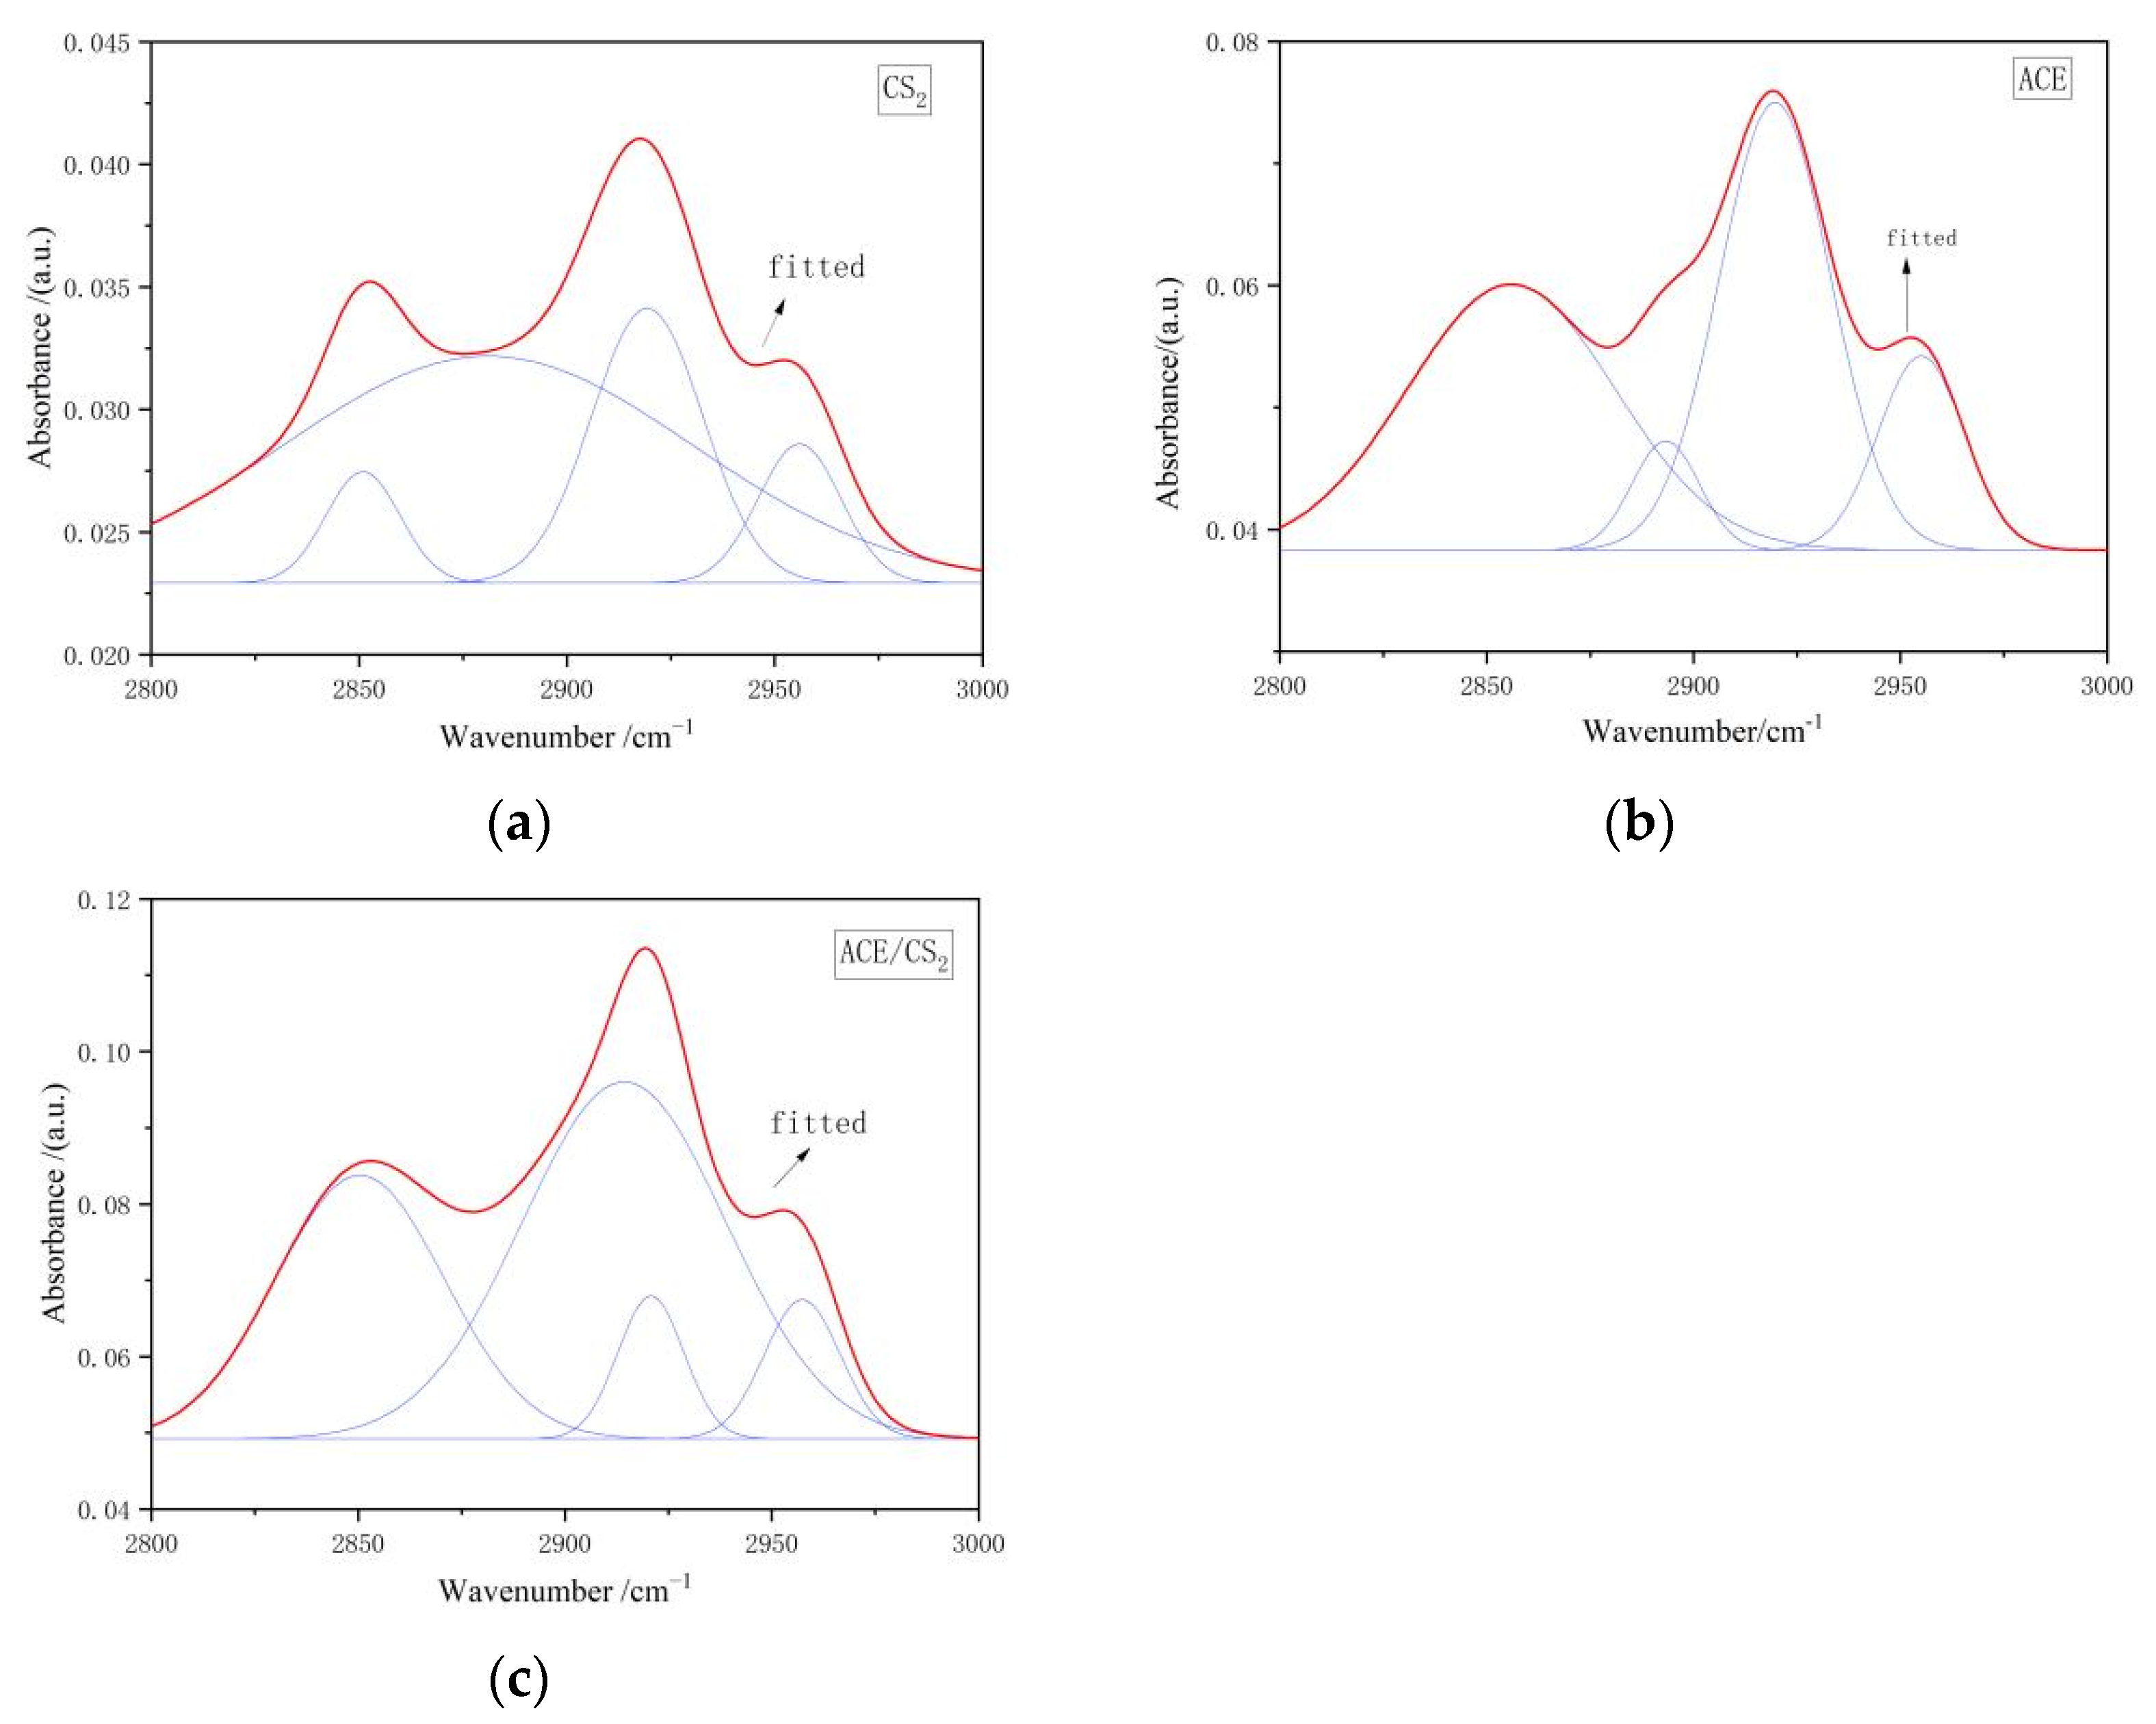
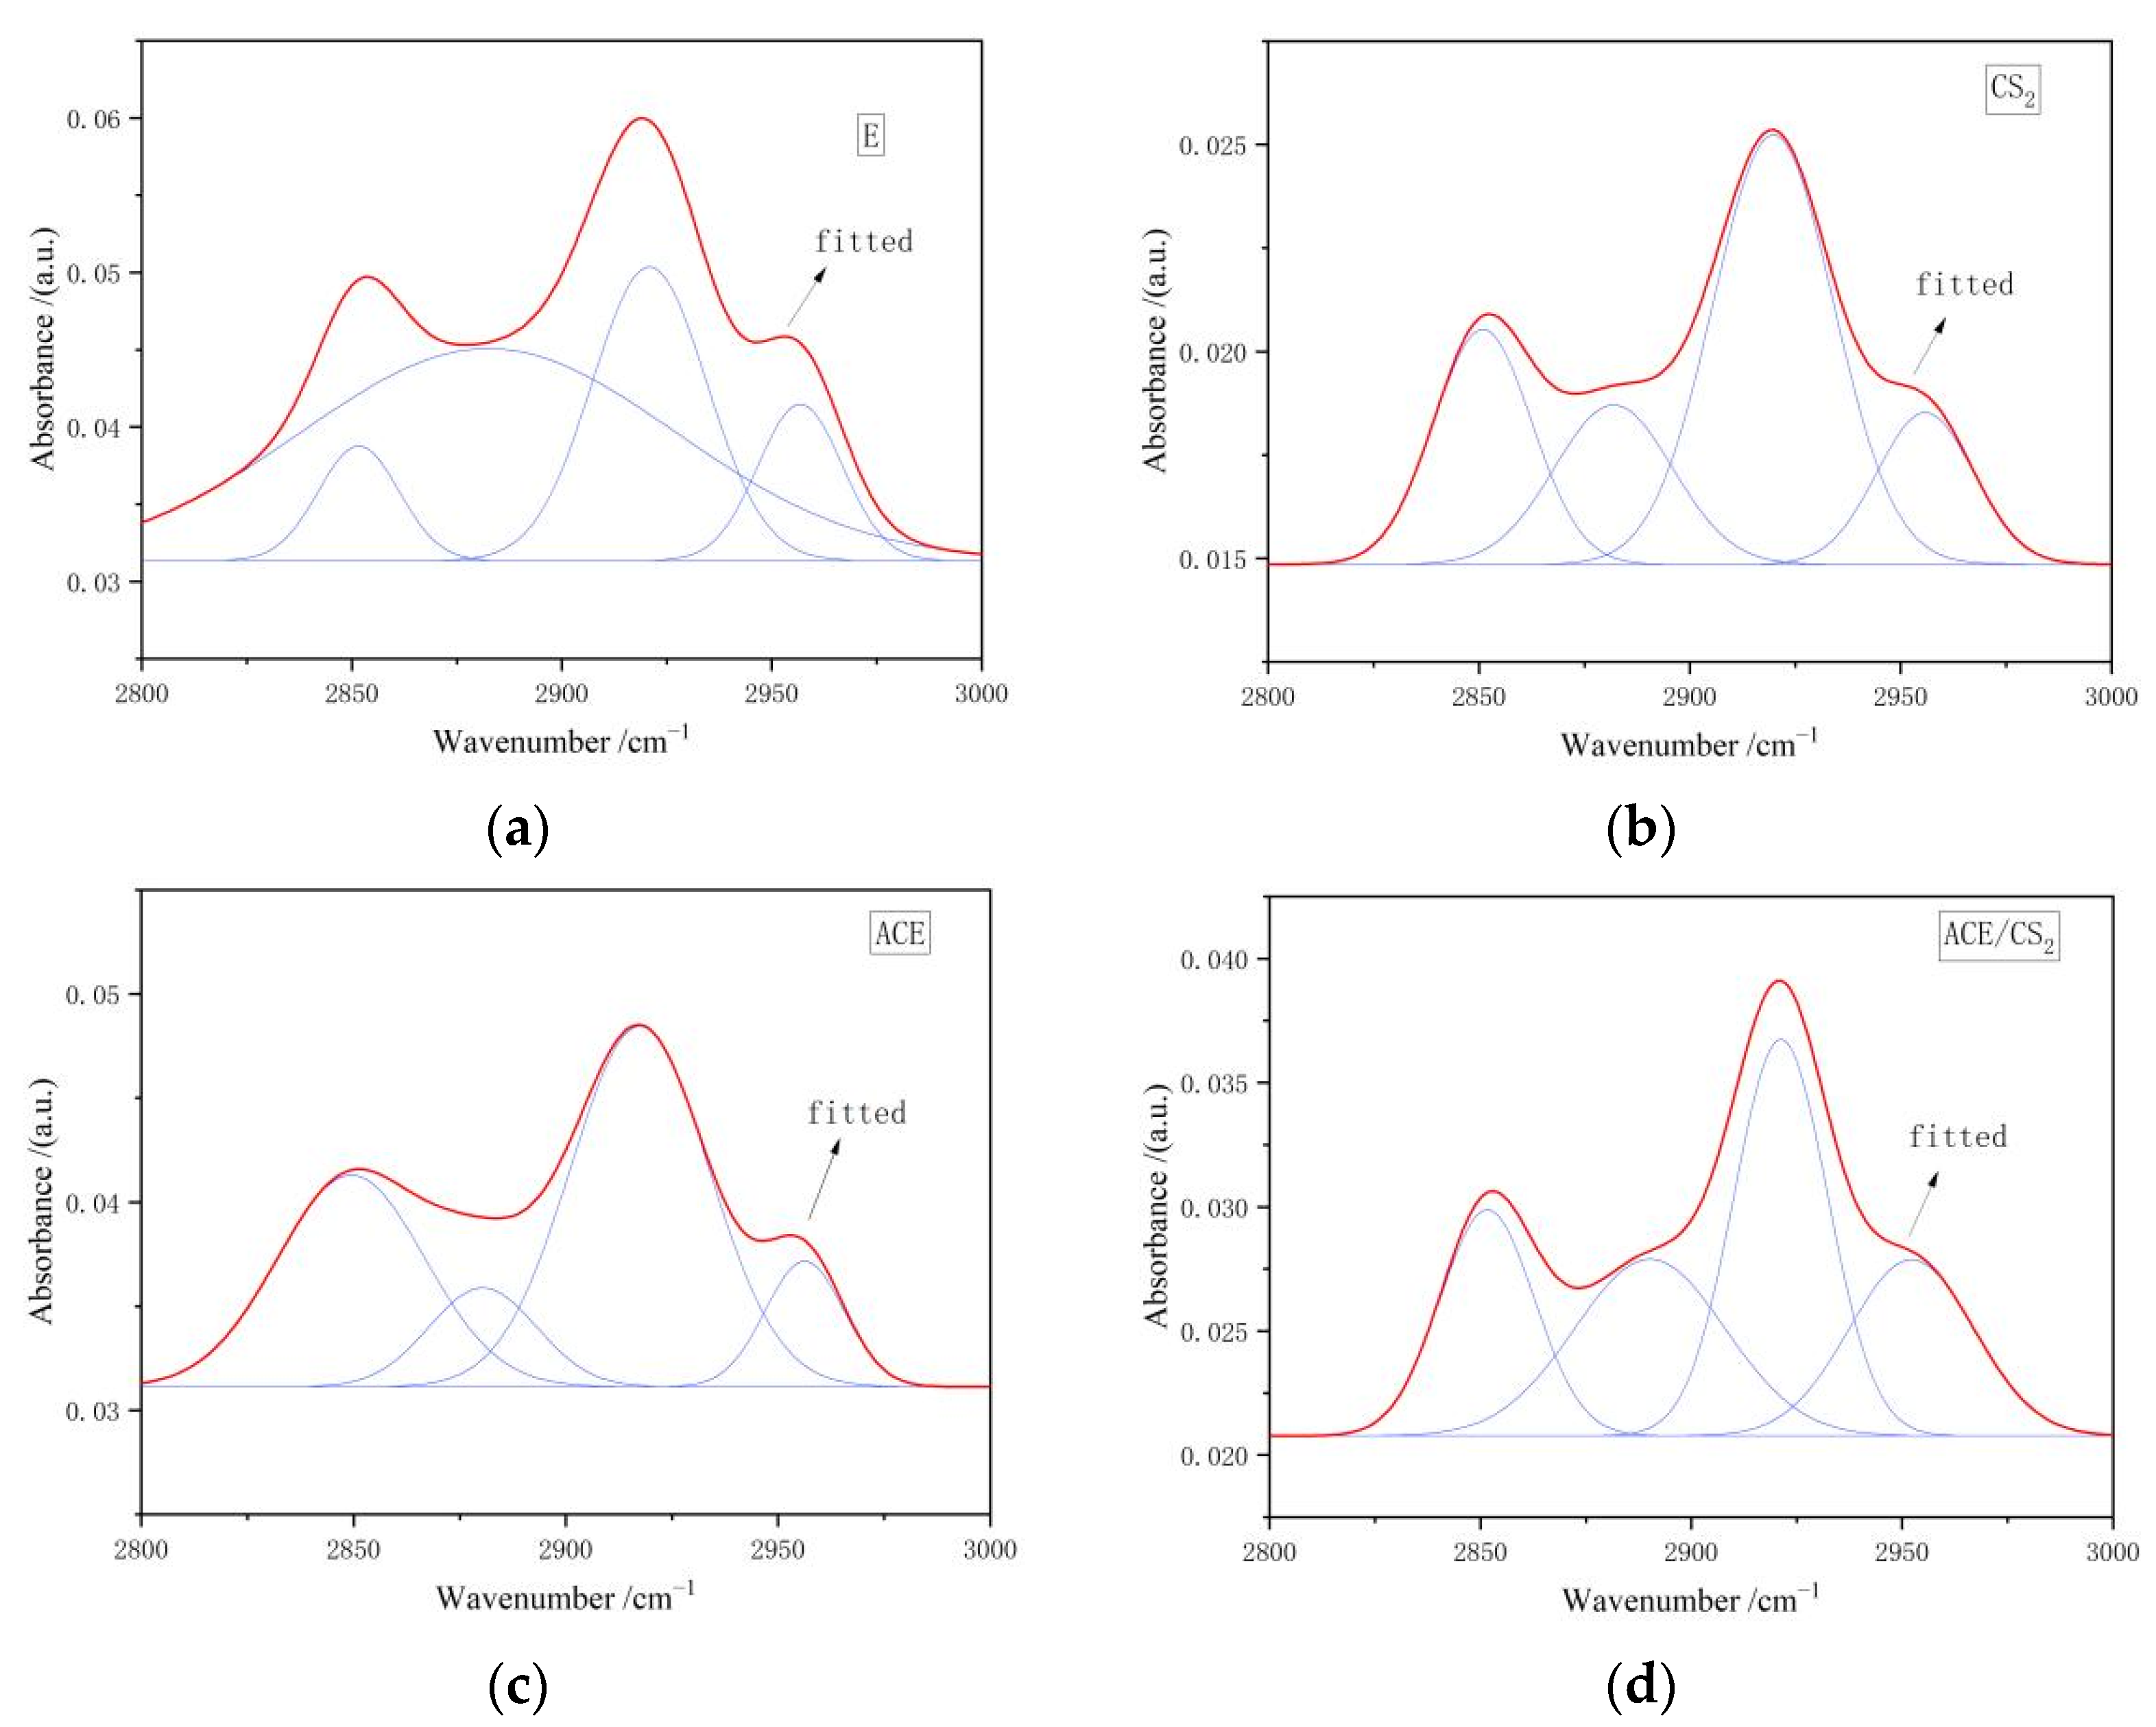
3.2.3. Results of Peak Splitting Fits for Extracts in the 2800–3000 cm−1 Interval
Figure 4 shows the fitted IR peak splitting curves for the three solvent extracts in the 2800–3000 cm−1 interval, and the corresponding fitted data results are shown in Table 4. The peaks in this interval are attributed to the stretching vibration of the aliphatic hydrocarbon CHx, and this dictates that six to eight peaks are appropriate for the deconvolution of this section of the spectrum. From the fitted parameters it is clear that both extracts are dominated by aliphatic -CH except for the acetone extract, which is dominated by the symmetric -CH2 stretching vibration.
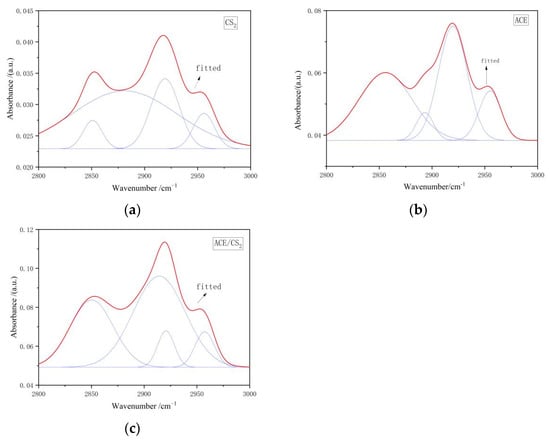
Figure 4.
Infrared spectra of extracts in the interval 2800–3000 cm−1. ((a) is the carbon disulphide fit, (b) is the acetone fit and (c) is the mixed solvent fit. The red line is the fitted curve and the blue line is the sub peak).
Table 4.
Infrared spectra of three solvent extracts 2800–3000 cm−1 split peak fitting ratio of each absorption peak area.
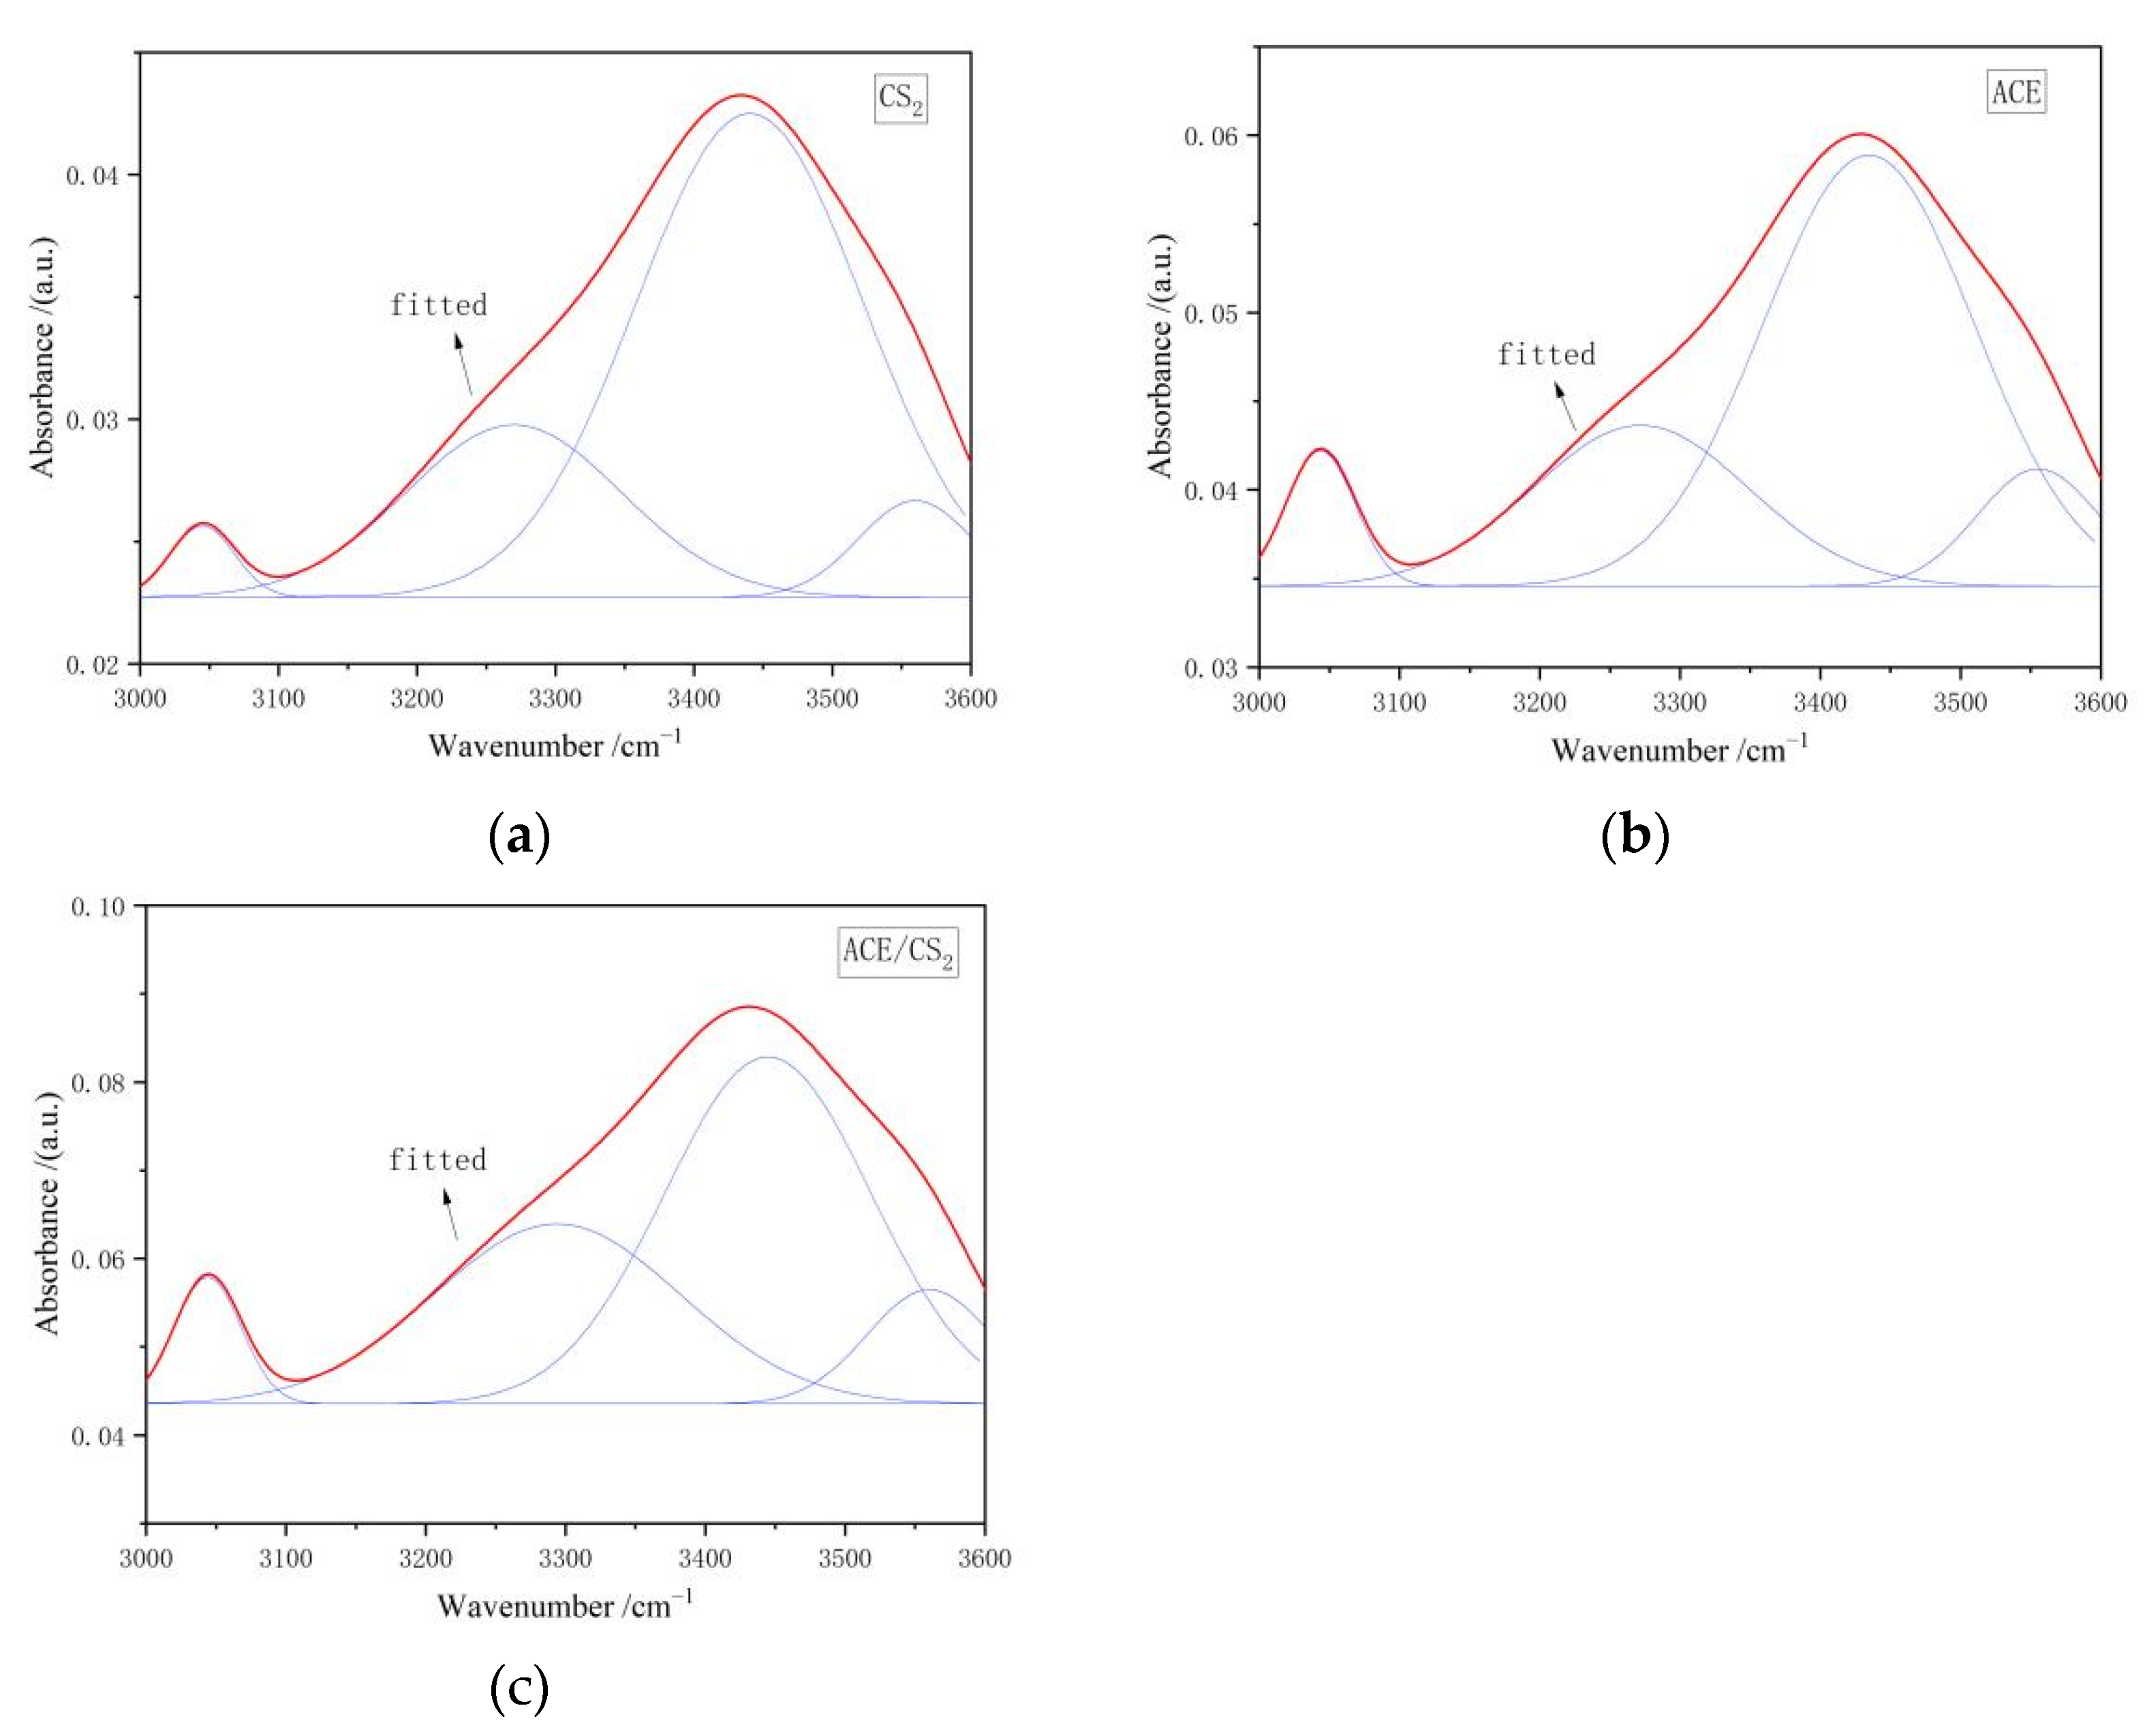
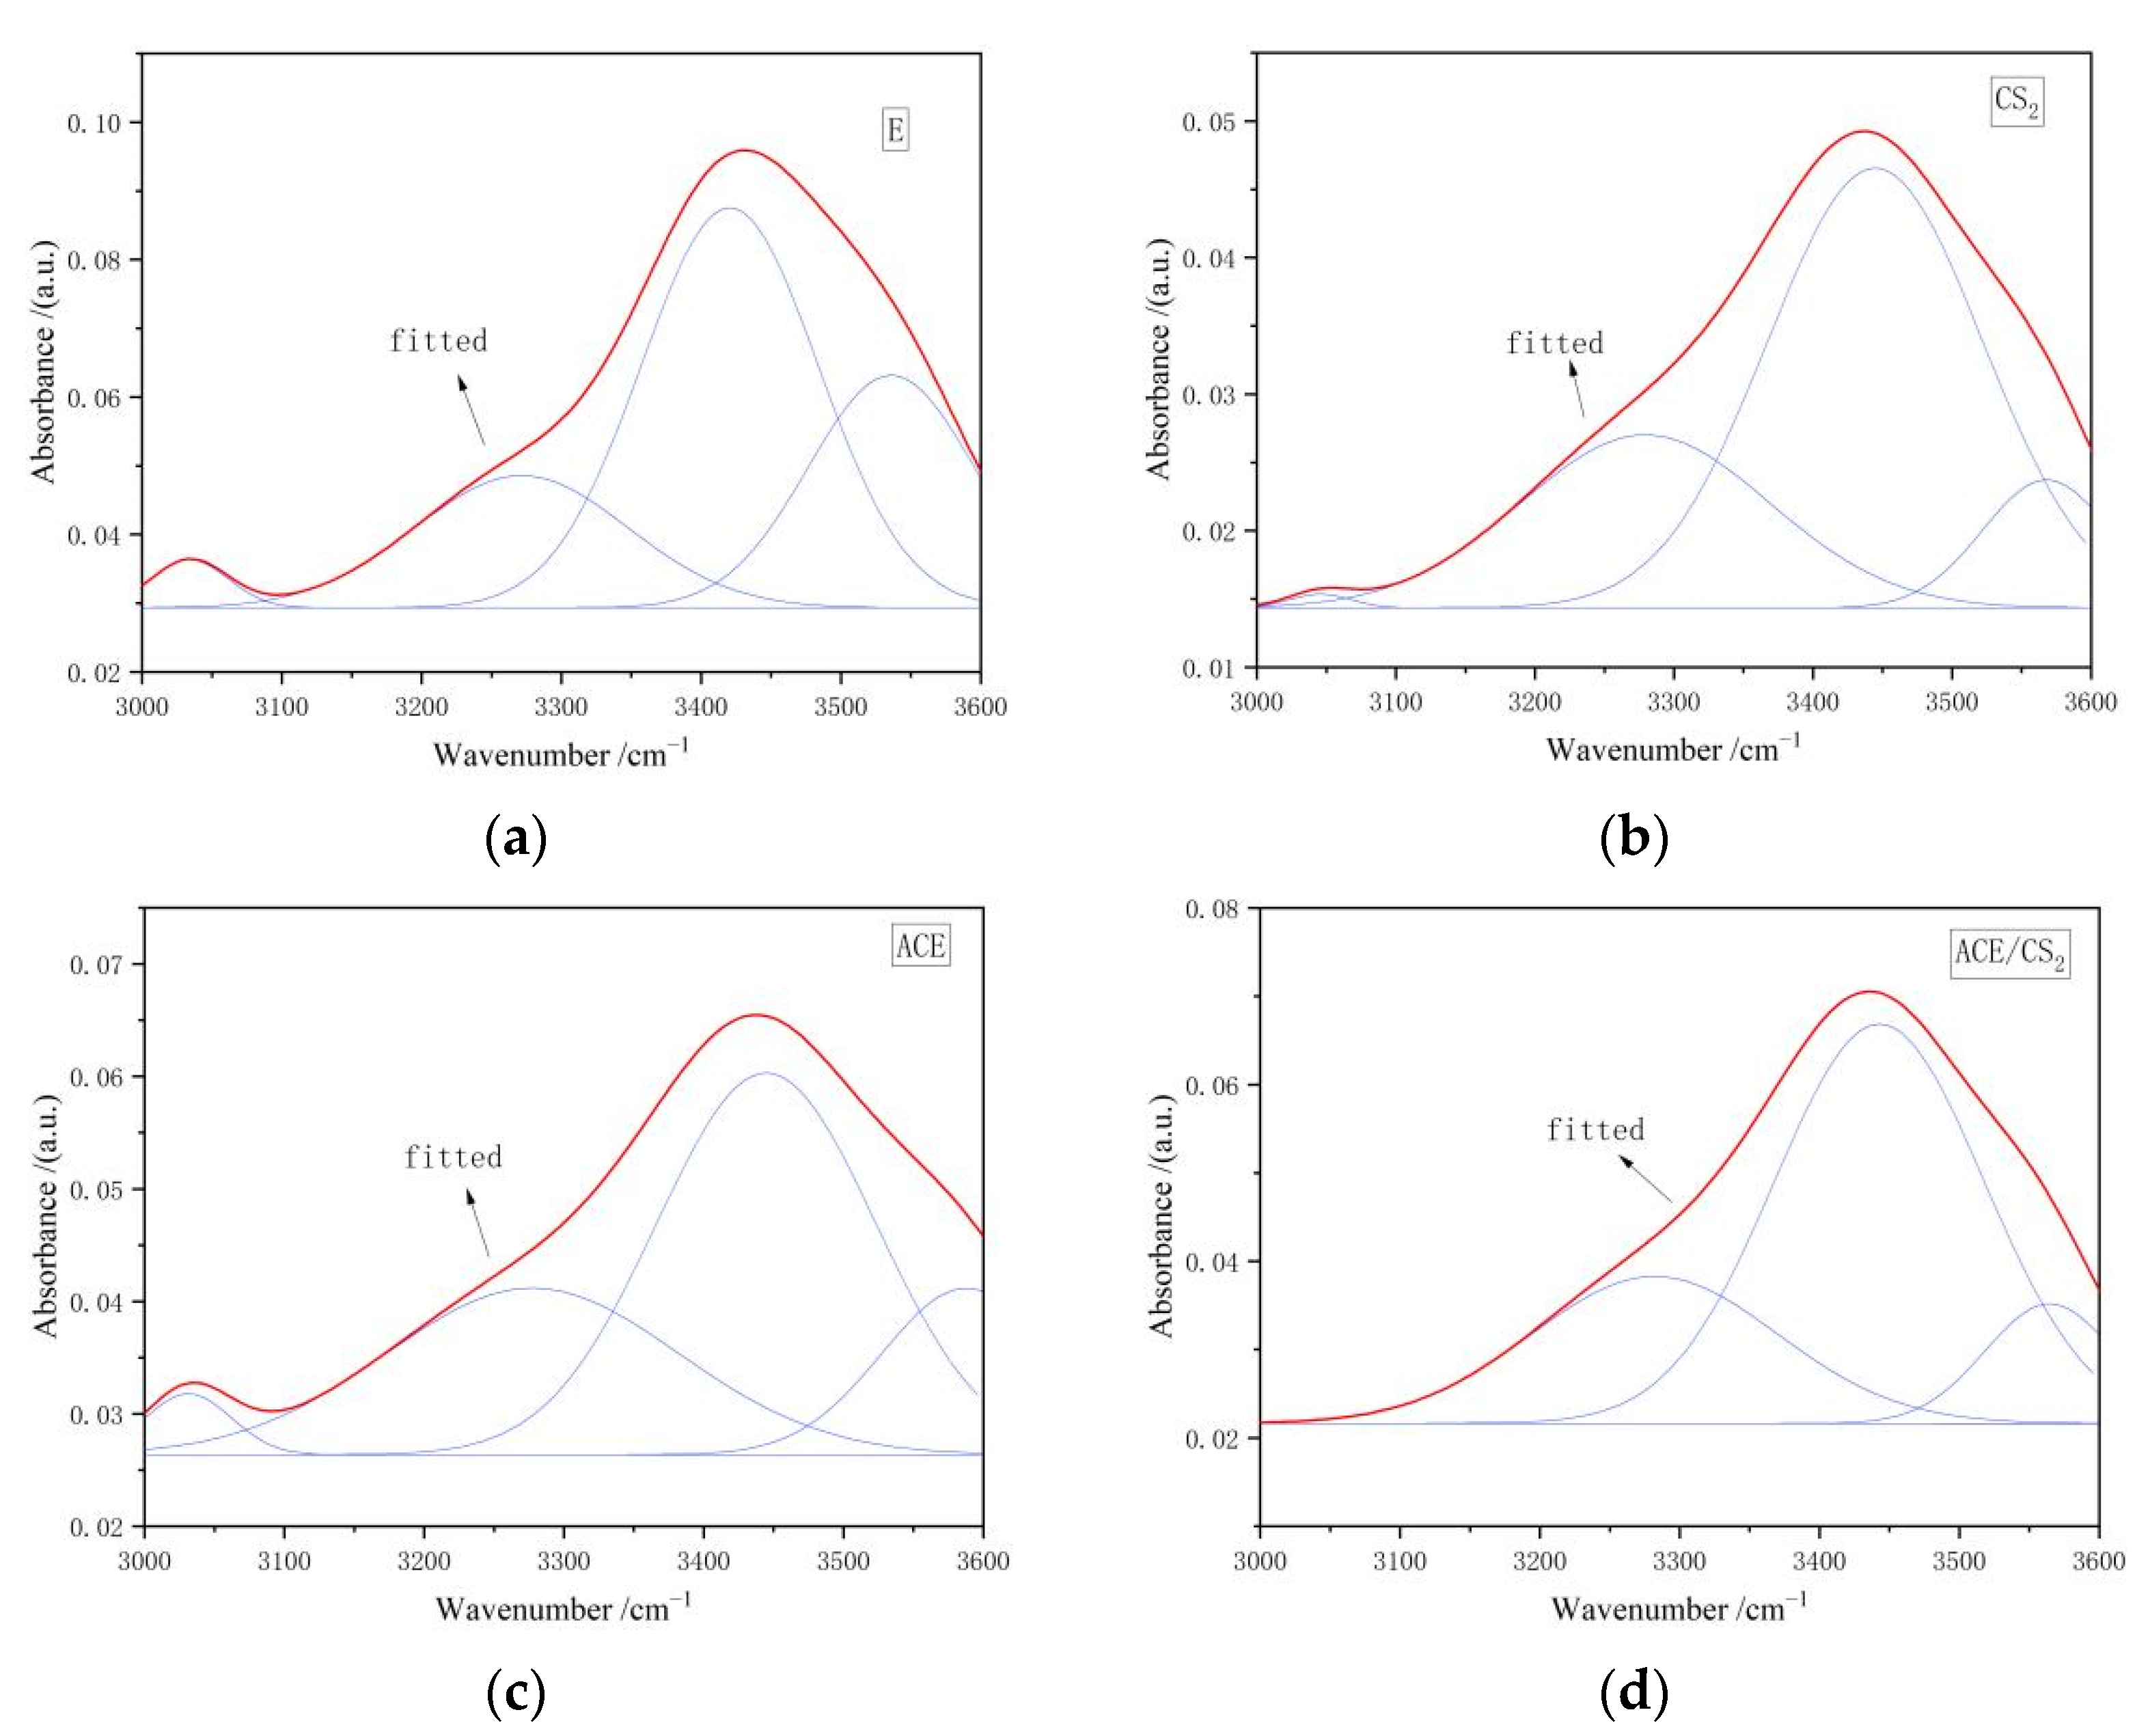
3.2.4. Results of Peak Splitting Fits for Extracts in the 3000–3600 cm−1 Interval
Figure 5 shows the fitted IR peak splitting curves for the three extracts in the 3000–3600 cm−1 interval, and the corresponding fitted data results are shown in Table 5. There are six main forms of hydroxyl functional groups present in coal, namely hydroxyl-N hydrogen bonding near 3150 cm−1, ring-conjugated hydroxyl hydrogen bonding near 3200 cm−1, hydroxyl-ether oxygen hydrogen bonding near 3300 cm−1, hydroxyl self-conjugated hydrogen bonding near 3410 cm−1, hydroxyl-π hydrogen bonding near 3516 cm−1, and the free hydroxyl group near 3611 cm−1 [18,19]. The fitted parameters of the spectra show that all three extracts are dominated by hydroxyl self-conjugated hydrogen bonds and contain a large number of ring-conjugated hydroxyl hydrogen bonds.
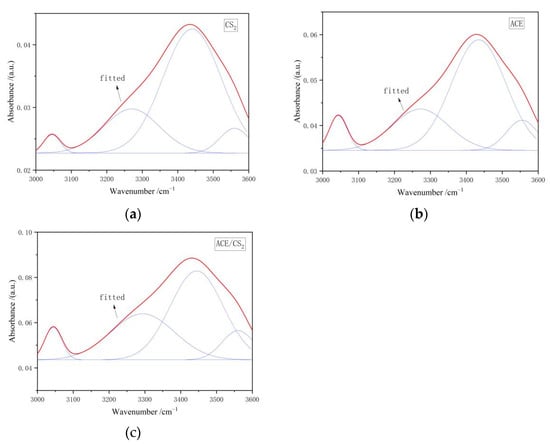
Figure 5.
Infrared spectra of 3000–3600 cm−1 extracts. ((a) is the carbon disulphide fit, (b) is the acetone fit and (c) is the mixed solvent fit. The red line is the fitted curve and the blue line is the sub peak).
Table 5.
Infrared spectra of the three extracts 3000–3600 cm−1 split peak fitting ratio of each absorption peak area [15].
3.2.5. Analysis of the Structural Parameters of the Three Extracts
The structural parameters obtained from the split-peak fitting results were used for the semi-quantitative analysis of the different solvent tar residue extracts. The structural parameters were calculated according to Equations (1) and (2) and the results are shown in Table 6.
where DOC indicates the degree of aromatic ring condensation of the extract.
DOC = A900−700/A1600,
A(CH2)/A(CH3) = A2920/A2950,
Table 6.
Structural parameters of the three extracts.
CH2/CH3 characterises the length of the fatty side chains and the degree of branching in the samples. As can be seen from Table 6, the CS2 extract had a larger DOC, indicating a higher degree of aromatic ring condensation and the presence of more aromatic hydrocarbons with a large number of aromatic rings, while the acetone/CS2 mixed solvent extract had a smaller DOC value. Comparing the A(CH2)/A(CH3) data for the three extracts shows that the acetone extract has the largest CH2/CH3 index, indicating that the extract has the longest aliphatic side chain and the fewest branched chains.
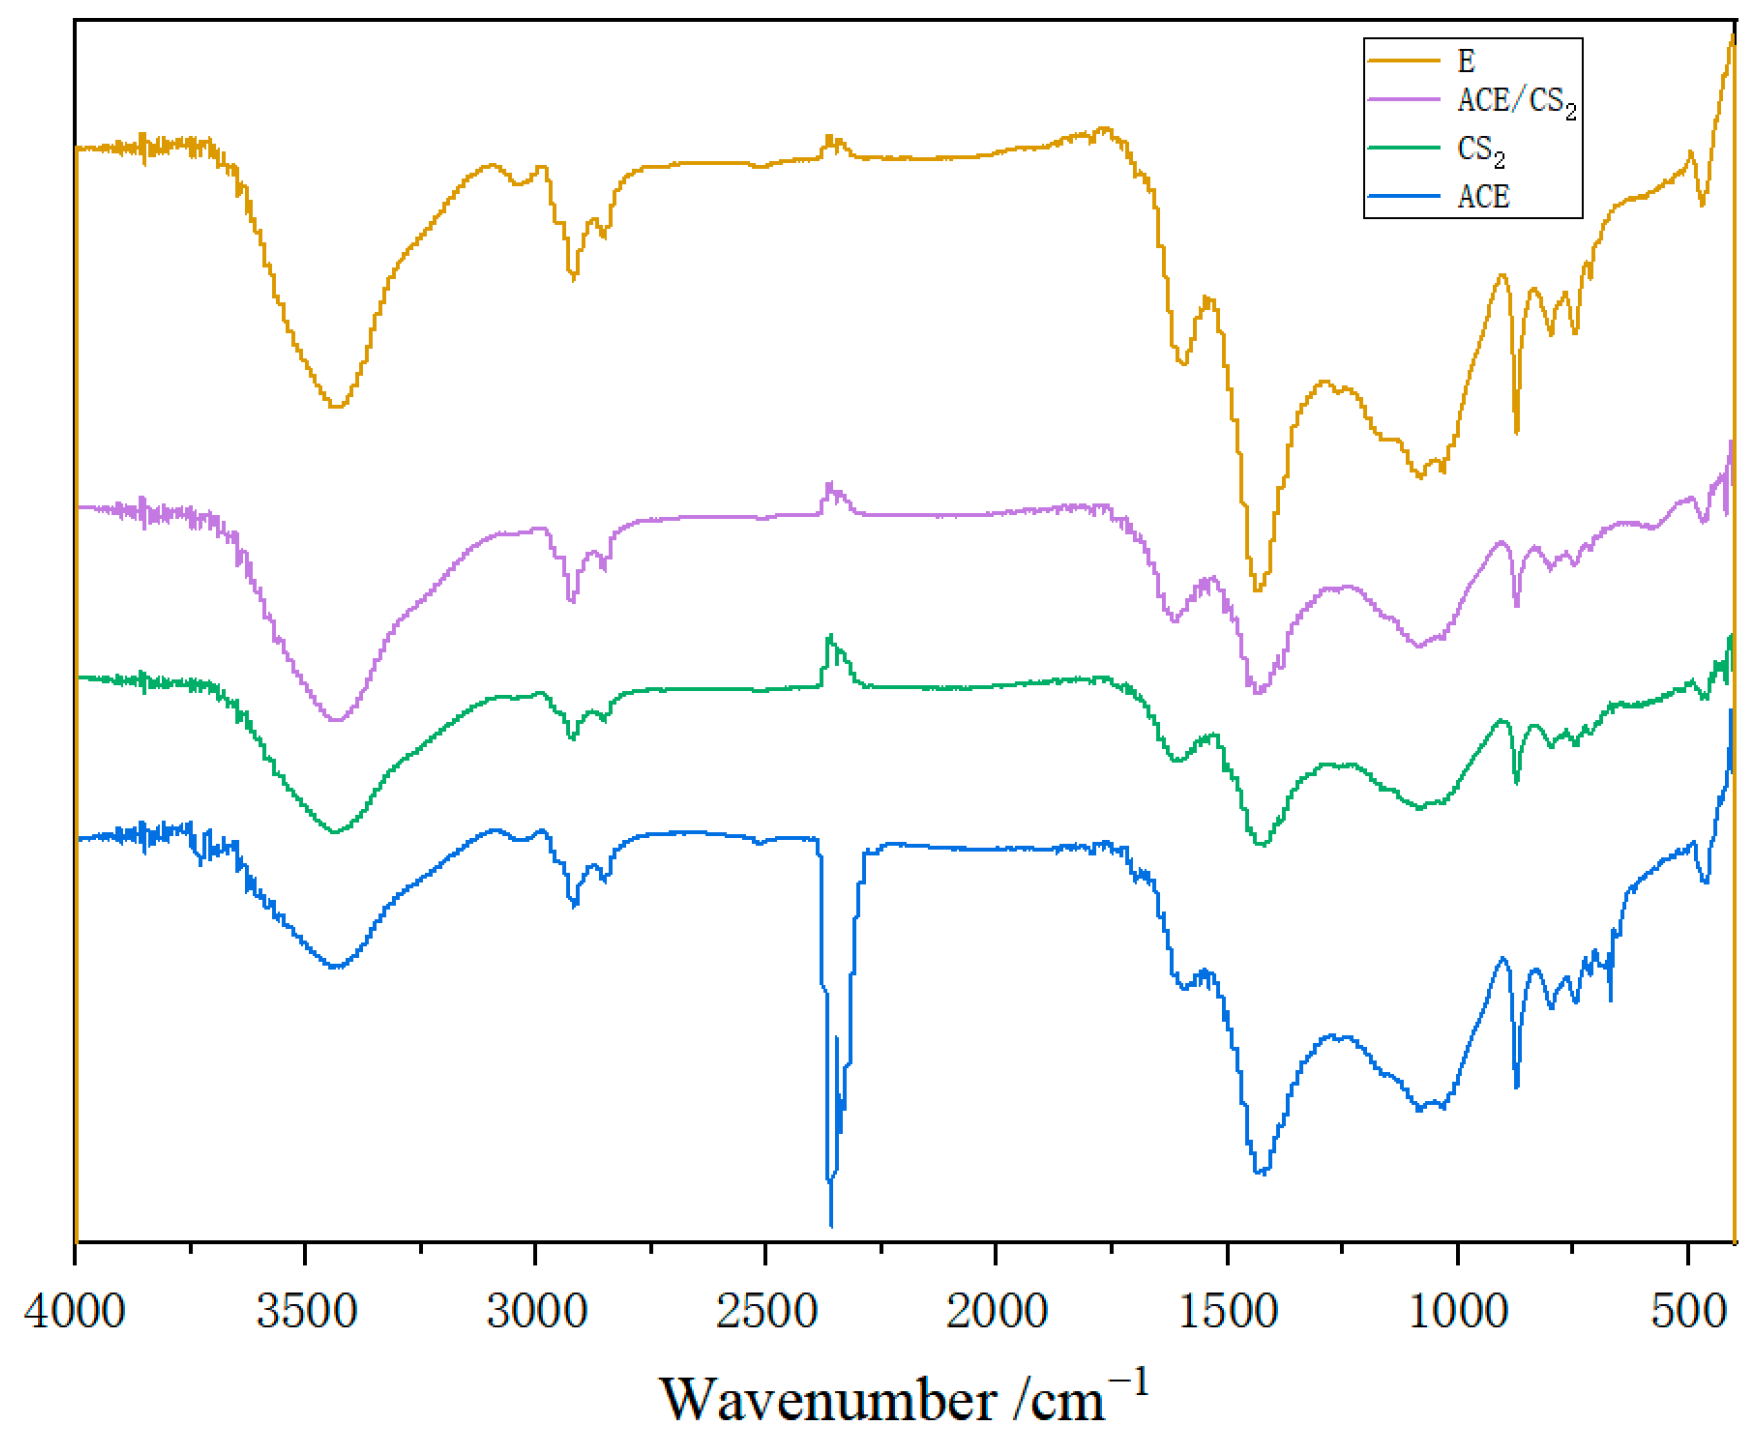
3.3. Comparative Infrared Spectroscopy of Coal Tar Residues and Extractives
The IR spectra of the coal tar residue and its three solvent extracts are given in Figure 6. It can be seen that the position of the characteristic peaks did not change before and after extraction, but only the peak intensity changed, which indicates that the ultrasonic-assisted extraction method does not destroy the main structure of the tar residue itself. The peak intensity of the hydroxyl functional group at 3440 cm−1 was somewhat reduced compared to the original sample, indicating that some of the hydroxyl-containing compounds were extracted by the solvent. The 910–650 cm−1 of the absorption peaks were classified as characteristic absorption peaks of aromatic compounds. The intensity of the absorption peak at 745 cm−1 is somewhat reduced compared to the original sample, indicating a reduction of aromatic compounds in the extractives.
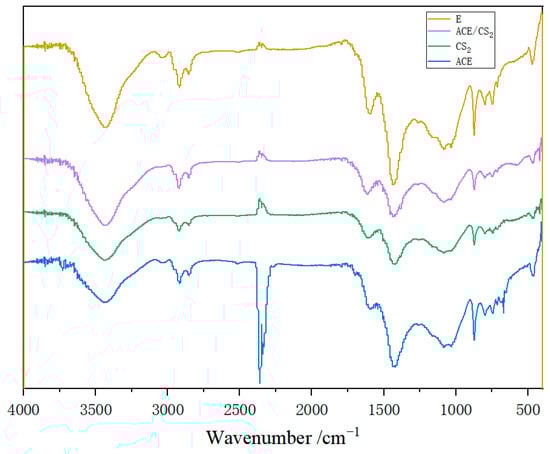
Figure 6.
Infrared spectra of coal tar residue and its three extractive residues.
3.4. Infrared Spectral Split Peak Fitting of Coal Tar Residue and Extractives
3.4.1. Results of the Peak Splitting Fit for the 700–900 cm−1 Interval
Figure 7 shows the IR peak splitting curves of the coal tar residue and its three solvent extractables in the 700–900 cm−1 region, and the corresponding fitted data are shown in Table 7. The acetone/CS2 mixed solvent residue was dominated by benzene ring pentasubstitution and benzene ring tetrasubstitution, while the rest of the two solvent residues were dominated by benzene ring pentasubstitution and benzene ring trisubstitution. The above data show that the aromatic structure of the tar residue after extraction changed significantly, with the proportion of tetrasubstituted or trisubstituted benzene rings increasing and the proportion of pentasubstituted benzene rings decreasing in the three solvent extracts compared to the original samples. This suggests that the aromatic ring compounds may have undergone substitution reactions during the extraction process, resulting in structural changes.
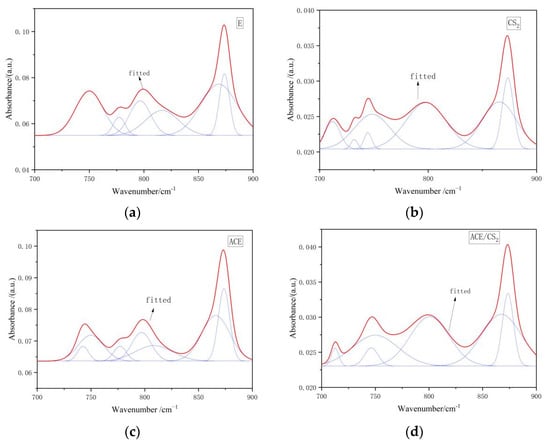
Figure 7.
Infrared spectra of the original and extractive residues in the 700–900 cm−1 region. ((a) is an original tar residue fit, (b) is a fit to carbon disulphide, (c) is a fit to acetone and (d) is a fit to a mixed solvent. The red line is the fit line and the blue line is the sub peak).
Table 7.
Infrared spectra of four samples 700–900 cm−1 split peak fitting ratio of each absorption peak area.
3.4.2. Results of the Peak Splitting Fit for the 1000–1800 cm−1 Interval
Figure 8 shows the IR peak splitting curves of coal tar residue and its three extractives in the 1000–1800 cm−1 region, and the corresponding fitted data results are shown in Table 8. The asymmetric vibrational absorption peaks in the C-H plane of the group were dominant in the CS2 residue, and the C-N absorption peak was dominant in the CS2 residue. 1158 cm−1 was the C-O stretching vibration of the phenolic hydroxyl group, and the percentage of the phenolic hydroxyl group was higher in all three residues than in the tar residue. The percentage of this group in the CS2 extracts was the most variable, at 18.90%.
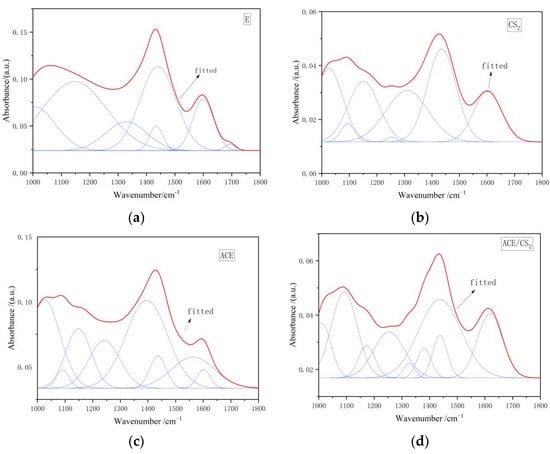
Figure 8.
Infrared spectra of the original and extractive residues in the 1000–1800 cm−1 region. ((a) is an original tar residue fit, (b) is a fit to carbon disulphide, (c) is a fit to acetone and (d) is a fit to a mixed solvent. The red line is the fit line and the blue line is the sub peak).
Table 8.
Infrared spectra of four samples 1000–1800 cm−1 split peak fitting ratio of each absorption peak area.
3.4.3. Results of the Peak Splitting Fit for the 2800–3000 cm−1 Interval
Figure 9 shows the IR peak splitting curves for coal tar residue and its three extractives in the 2800–3000 cm−1 region, and the corresponding fitted data results are shown in Table 9. The acetone residue was dominated by symmetric and asymmetric -CH2 stretching vibrations, while the CS2 and acetone/CS2 mixed solvent residues were dominated by asymmetric -CH2 stretching vibrations.
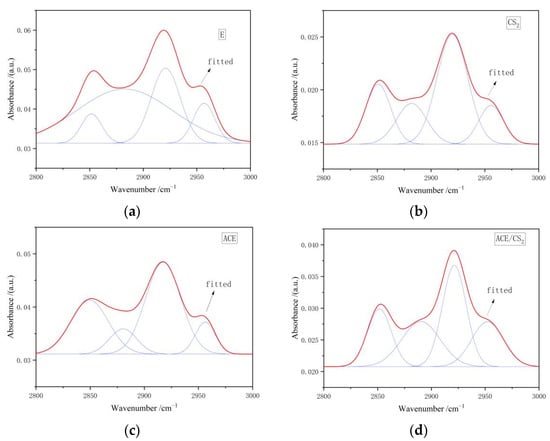
Figure 9.
Infrared spectra of the original and extractive residues in the 2800–3000 cm−1 region. ((a) is an original tar residue fit, (b) is a fit to carbon disulphide, (c) is a fit to acetone and (d) is a fit to a mixed solvent. The red line is the fit line and the blue line is the sub peak).
Table 9.
Infrared spectra of four samples 2800–3000 cm−1 split peak fitting ratio of each absorption peak area.
3.4.4. Results of the Split Peak Fit at 3000–3600 cm−1
Figure 10 shows the IR peak fitting curves of the coal tar residue and its three extractives in the 3000–3600 cm−1 region. The hydroxyl group is the main functional group that forms hydrogen bonds, and hydrogen bonds are a major non-covalent bond in the structure of coal macromolecules. As can be seen in Table 10, the three solvent extracts were dominated by hydroxyl self-conjugated hydrogen bonds and ring-conjugated hydrogen bonds near 3200 cm−1.
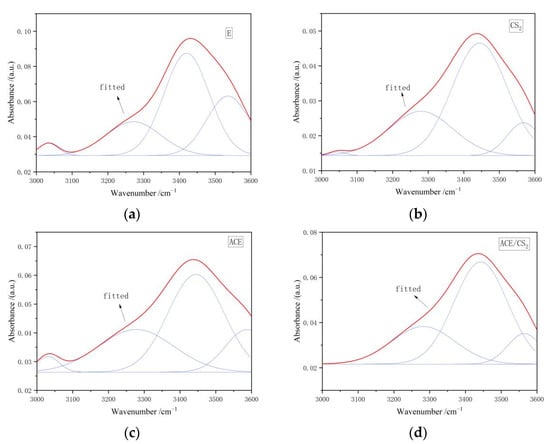
Figure 10.
Infrared spectra of the original and extractive residues in the 3000–3600 cm−1 region. ((a) is an original tar residue fit, (b) is a fit to carbon disulphide, (c) is a fit to acetone and (d) is a fit to a mixed solvent. The red line is the fit line and the blue line is the sub peak).
Table 10.
Infrared spectra of four samples 3000–3600 cm−1 split peak fitting ratio of each absorption peak area.
3.4.5. Analysis of Structural Parameters of Tar Residues and Extractives
In addition to the two structural parameters DOC and CH2/CH3, two other structural parameters were used to further characterise the structure of the tar pomace and extractive residues, and the results of the calculated data are shown in Table 11.
Table 11.
Structural parameters of coal tar residue and its three extractive residues.
The aromaticity (AR) is the aromatic C-H bending vibration/fatty C-H, which can be used to determine the degree of aromatisation:
AR = A700–900/A2800–3000,
The A-factor, commonly used to assess the hydrocarbon potential and maturity of cheese roots, is higher for greater A, and lower for greater maturity.
A = A2800–3000/(A1490–1600 + A2800–3000),
Table 11 shows that the aromaticity of the three solvent extracts was less than that of the original tar residue, indicating that the degree of aromatisation was lower than that of the tar residue. The highest A value for tar residue was 0.33, proving that it was the least mature, and the higher CH2/CH3 value indicates the length and branching of the fat side chains in the sample. A comparison of A(CH2)/A(CH3) showed that the acetone extracts had the longest fat chains and the least branched chains. A larger DOC for the acetone residue indicates a higher degree of aromatic ring condensation and the presence of more aromatic hydrocarbons with a large number of aromatic rings, whereas the DOC value for the acetone/CS2 mixture residue is smaller.
4. Conclusions
(1) The tar residue contains a large number of hydroxyl hydrogen bonds and polycyclic aromatic hydrocarbons, and the main substitution mode of the aromatic ring is benzene ring pentasubstitution, therefore, ultrasonic extraction has a large impact on the asymmetric=C-O-C absorption peak and aromatic structure of the aromatic ether in the tar residue.
(2) By comparing the extracts, extract residues, and the original samples after the ultrasonic extraction, it was found that all three extracts contained a large amount of PAHs, CS2 solvents could dissolve more aromatic structures containing aliphatic side chains, and the acetone/CS2 mixture could extract more phenols. Among the aliphatic structures, both extracts were dominated by aliphatic -CH, except for the acetone extract, which was mainly a symmetric -CH2 stretching vibration.
(3) A comparison of the IR results of the original tar residue and the five solvent extracts showed that the main structure of the tar residue did not change throughout the process, but the extraction changed the aromatic structure considerably. Compared to the original sample, the proportion of tetrasubstituted or trisubstituted benzene rings in the three solvent extracts increased, while the proportion of pentasubstituted benzene rings produced a significant decrease.
(4) The analysis of the extracted separated material from coal tar residue was carried out by using infrared fractionation fitting, thus demonstrating the effect of extraction on PAHs and laying the foundation for the subsequent selection of a suitable extractant for the extraction process.
Author Contributions
Conceptualization, X.W. (Xiaolong Wang) and X.W. (Xiaohua Wang); methodology, X.W. (Xiaolong Wang) and X.H.; software, X.H.; validation, X.H.; formal analysis, X.H. and X.W. (Xiaohua Wang); investigation, X.W. (Xiaolong Wang) and X.H.; resources, X.W. (Xiaolong Wang) and X.W. (Xiaohua Wang); data curation, X.H.; writin—original draft preparation, X.W. (Xiaolong Wang) and X.H.; writing—review and editing, X.W. (Xiaohua Wang) and X.H.; visualization, X.H.; supervision, X.W. (Xiaohua Wang); project administration, X.W. (Xiaohua Wang); funding acquisition, X.W. (Xiaohua Wang). All authors have read and agreed to the published version of the manuscript.
Funding
This research was funded by the Shaanxi Province Special Funds for Technological Innovation (grant number 2021QFY04-02); the Special Funds for Central Administration Guiding Local Science and Technology Development of Shaanxi Province (grant number 2021ZY-QY-08-04); Shaanxi Transportation Scientifific Research Programme (grant number 20-26K).
Institutional Review Board Statement
Not applicable.
Informed Consent Statement
Not applicable.
Data Availability Statement
The data presented in this study are available on request from the corresponding author. The data are not publicly available due to privacy concerns.
Conflicts of Interest
The authors declare no conflict of interest.
References
- Li, C.L.; Ma, J.X.; Lin, X.C. Current status and research outlook of coal tar residue disposal technology. Mod. Chem. Ind. 2020, 40, 5. [Google Scholar] [CrossRef]
- Ma, Y.H.; Su, W.; Wang, Q.H. Discharge and Disposal of Coking Residue and Distribution Characteristics of PAHs in it. Appl. Mech. Mater. 2013, 448–453, 448–452. [Google Scholar] [CrossRef]
- Xu, Z.; Huaishuang, S.; Wang, Y.; Zhao, Q.; Liang, Z. Characteristics of coal tar residue treated with microwave-assisted hydrothermal treatment. Fuel Process. Technol. 2021, 211, 106580. [Google Scholar] [CrossRef]
- Guo, S.; Lu, Z.H.; Wang, Y.G. Research progress of coal chemical organic waste residue extraction and treatment. Chem. Miner. Process. 2021, 50, 9. [Google Scholar] [CrossRef]
- Ma, Y.-Y.; Wang, H.-H.; Mo, W.-L.; Zhang, X.-Y.; Fan, X.; Ma, J.; Ma, F.-Y.; Wei, X.-Y. Effect and evaluation of series of organic solvents on extraction behavior of Lingwu bituminous coal. Ningxia Eng. 2022, 21, 127–132. [Google Scholar]
- Dai, C.W. Effect and Evaluation of Series of Organic Solvents on Cascade Extraction of Low-Grade Bituminous Coal in Lingwu; Ningxia University: Ningxia, China, 2022. [Google Scholar]
- Alcañiz-Monge, J.; Cazorla-Amorós, D.; Linares-Solano, Á. Characterisation of coal tar pitches by thermal analysis, infrared spectroscopy and solvent fractionation. Fuel 2001, 80, 41–48. [Google Scholar] [CrossRef]
- Guillen, M.D.; Iglesias, M.J.; Dominguez, A.; Blanco, C. Semi-quantitative FTIR analysis of acoal tar pitch and its extracts and residues in several organic solvents. Energy Fuels 2002, 6, 518–525. [Google Scholar] [CrossRef]
- Yang, Y.; Wang, Q.; Mao, N.; Wang, Y.M.; Zhang, J.P.; Bai, H.C. Ultrasound-assisted extraction of microscopic components of Yangchang Bay coal by aromatic organic solvents. Acta Pet. (Pet. Process.) 2020, 36, 1062–1068. [Google Scholar]
- Chang, Q.L. Pyrolysis characteristics and kinetic analysis of coal tar residue. Acta Pet. (Pet. Process.) 2021, 37, 924–931. [Google Scholar]
- Feng, X.J. Catalytic Reaction Separation of Medium and Low Temperature Coal Tar, Heavy Oil, Petroleum Ether Extraction, Cascade Catalytic Reaction; Northwestern University: Evanston, IL, USA, 2018. [Google Scholar]
- Liang, H.Z.; Wang, C.G.; Zeng, F.G.; Li, M.F.; Xiang, J.H. Application of infrared spectroscopy to study the effect of ash removal on the structure of Yimin lignite. J. Fuel Chem. 2014, 42, 129–137. [Google Scholar]
- Liang, C.H.; Liang, W.Q.; Li, W. Study on the functional groups of different coal rank coals based on Fourier infrared spectroscopy. Coal Sci. Technol. 2020, 48, 182–186. [Google Scholar]
- Wang, Y.; Ma, Y.Y.; Mo, W.L.; Gong, W.T.; Ma, F.Y.; Wei, X.Y.; Fan, X.; Zhang, S.P. FT-IR analysis of the functional group composition of extractives and extractive residues of Hefeng sub-bituminous coal. J. Fuel Chem. 2021, 49, 890–901. [Google Scholar] [CrossRef]
- Zhao, Y.G.; Li, M.F.; Zeng, F.G.; Liang, H.Z.; Zhao, Y.Y.; Xiang, J.H.; Li, E.H. Infrared spectroscopic study of the structural characteristics of different chemical components of Emin lignite. J. Coal 2018, 43, 546–554. [Google Scholar]
- Zhao, Y.; Qiu, P.; Chen, G.; Pei, J.; Sun, S.; Liu, L.; Liu, H. Selective enrichment of chemical structure during first grinding of Zhundong coal and its effect on pyrolysis reactivity. Fuel 2017, 189, 46–56. [Google Scholar] [CrossRef]
- Qin, Z.H.; Chen, H.; Yan, Y.J.; Li, C.-S.; Rong, L.-M.; Yang, X.-Q. FTIR quantitative analysis upon solubility of carbon disulfide/N-methyl-2- pyrrolidinone mixed solvent to coal petrographic cons tituents. Fuel Process Technol. 2015, 133, 14–19. [Google Scholar] [CrossRef]
- Li, D.T.; Li, W.; Li, B.Q. New advances in the study of hydrogen bonding in coal. Chem. Bull. 2001, 7, 411–415. [Google Scholar]
- Feng, J.; Li, W.Y.; Xie, K.C. Study of coal structure by Fourier infrared spectroscopy. J. China Univ. Min. Technol. 2002, 5, 362–366. [Google Scholar]
Disclaimer/Publisher’s Note: The statements, opinions and data contained in all publications are solely those of the individual author(s) and contributor(s) and not of MDPI and/or the editor(s). MDPI and/or the editor(s) disclaim responsibility for any injury to people or property resulting from any ideas, methods, instructions or products referred to in the content. |
© 2023 by the authors. Licensee MDPI, Basel, Switzerland. This article is an open access article distributed under the terms and conditions of the Creative Commons Attribution (CC BY) license (https://creativecommons.org/licenses/by/4.0/).