Abstract
The aim of this paper is to optimize the generation of frequencies obtained nonlinearly from the propagation of ultrasound in a bubbly liquid. A study is presented for which the number and size of the gas bubbles in the liquid are varied to determine the optimal medium, which is the one that allows the highest amplitude for these frequency components. We use a previously developed numerical software that tracks the nonlinear behavior of both ultrasound and bubble vibrations in time to carry out several simulations. We focus our attention on two one-dimensional configurations, a resonator of length set at a quarter of the wavelength with a free-wall condition and a cavity of length set at sixteen wavelengths with open-field condition. In each case, we analyze the generation of the 2nd, 3rd, and 4th harmonics of the source frequency. Our results show that, in both cases, the use of higher source amplitudes and lower source frequencies is more useful to increase the harmonic amplitudes. Moreover, smaller bubbles are more adequate when the void fraction is kept constant for this purpose in the first configuration, whereas the modification of void fraction has no influence in the second configuration, for which given a void fraction value, bubble sizes whose ratio are , , and maximize the 2nd, 3rd, and 4th harmonics, respectively. These conclusions could be of interest for some applications.
1. Introduction
An interesting type of multiphase media is the one composed by liquids with gas bubbles. These media are very attractive because the introduction of a small amount of gas in the form of tiny bubbles into the liquid changes its characteristics significantly, particularly its acoustic properties, which are altered drastically, albeit, its density is hardly modified. Gas bubbles introduce dispersion, attenuation, and nonlinear phenomena to the bubbly liquid [1,2].
Nonlinearity causes a transfer of energy from the fundamental signal to new frequency components when a finite-amplitude ultrasonic field propagates through a bubbly liquid. The generation of these new frequencies can be very interesting if one can take advantage of their virtues in a specific context, virtues that can be different and complementary from the features of the fundamental frequency, and that can be combined at the same time in such a way that the quality of the whole signal is enhanced. For example, on one hand, high-frequency components (harmonics, sum-frequency) generated from a single or a dual lower-frequency source can benefit from the high spatial resolution at its frequency value and from the low attenuation at the source frequencies, [3], which can be useful for applications in medical imaging [4], such as sonography, or bubble detection and characterization [5,6], such as bubble size. On the other hand, low-frequency components (subharmonics, difference–frequency) generated from a single or a dual higher-frequency source can benefit from the low attenuation at its frequency value and from the high spatial resolution at the source frequencies, which can be useful for applications in underwater exploration [7] or transmission [3,8] and nondestructive testing [9,10].
From the above considerations, optimizing the generation of the new frequency components, i.e., in such a way that the highest nonlinearity is obtained in the bubbly liquid, is clearly of interest, both from a theoretical challenge and applied point of view. Few studies on this topic exist in the literature. In [11], the existence of an optimal concentration of bubbles for which the harmonic generation is maximum by a layer of bubbles without changing its radius is described. In [12], the optimization of the generation of the second harmonic with the bubble radius and with the bubble density, separately without taking into account the trade-off between both, is shown. The generation of harmonics with the bubble density by keeping the bubble radius constant is studied in [13]. Due to the lack of existing studies about how to nonlinearly optimize a bubbly liquid accounting for all the parameters involved in the interaction between ultrasound and bubbles, it is reasonable to shed some light on this question. That is what this work deals with.
We thus seek here a compromise between bubble radius size and bubble density in order to have an optimal nonlinear medium for the generation of new frequencies. To this purpose, we study the double nonlinear interaction between the acoustic field, modeled by the wave equation, and the bubble vibrations, modeled by a Rayleigh–Plesset equation, as seen in Section 2, and we solve the resulting differential problem by means of the numerical model developed in [13]. Several studies are carried out to optimize the generation of harmonics, which is a measure of the nonlinearity of the medium. Different configurations are considered, by varying: the source amplitude, Section 3.1.2 and Section 3.2.2; the void fraction, Section 3.1.3 and Section 3.2.3; the source frequency, Section 3.1.4 and Section 3.2.4. Two types of resonator are used: one with a free-wall condition, Section 3.1; one with an open-field condition, Section 3.2. Finally, Section 4 shows the conclusions of this work.
2. Materials and Methods
In this section, we describe the model used in this work to study the ultrasonic field within a cavity of length L filled with a bubbly liquid. Two kinds of cavities are taken into account in the following study, which aims at designing the optimization of the bubbly medium in different configurations, given the wavelength at the source: a free-walled resonator for which with a pressure source at one side and a null pressure at the other one; an open-field cavity for which with a pressure source at one side and an open-field condition at the other one.
We assume an homogeneous distribution of spherical gas bubbles of the same size in a liquid. We also consider that: these bubbles are the only source of attenuation, nonlinearity, and dispersion; they are monodisperse and oscillate at their first radial mode; the surface tension is neglected; the bubble collapse is not modeled; buoyancy, Bjerknes and viscous drag forces are not considered [1,14,15]. Our model does not include inertial cavitation bubbles [16], for which the dispersion law for nonlinear attenuation and sound speed can be found in [17,18]. It must be noted that, since bubble–bubble interactions are not included here, their influence when void fraction is varied, which is described in [17,19,20], is neglected in the following Section 3.1.3 and Section 3.2.3.
The nonlinear interaction between bubble vibrations and ultrasound is modeled by the following differential system that couples the acoustic pressure (wave equation, Equation (1)) and the bubble volume variation (Rayleigh–Plesset equation, Equation (2)),
where is the current bubble volume, is the initial bubble volume, is its initial radius, x is the one-dimensional space coordinate, and t is the time. The resonator is excited by a pressure source placed at from time up to . In Equation (1), the sound speed and the density at the equilibrium state of the liquid are and , and the bubble density in the liquid is . In Equation (2), the viscous damping coefficient of the bubbly fluid is , in which is the cinematic viscosity of the liquid, is the resonance frequency of the bubbles, in which is the specific heats ratio of the gas, is its atmospheric pressure, and are the density and sound speed at the equilibrium state of the gas. The other parameters involved in the differential system are , , and . The initial conditions are
whereas the time-dependent pressure source of frequency f and amplitude is defined by
As said above, we consider two types of cavities, each one with a specific boundary condition at , i.e., the resonator with the free-walled cavity,
and the open-field cavity Equation (6) defined by
Both differential systems, Equations (1)–(5) for free-walled cavity on one hand, Equations (1)–(4) and (6) for open-field cavity on the other hand, are solved using the numerical model based on the finite-volume method in the space dimension and the finite-difference method in the time developed in [13]. It must be noted here that 100 finite volumes per wavelength and 400 time points per period of the source frequency are used in Section 3.
3. Results
The objective of this section is to study which type of bubbly liquid, in terms of bubble size and density, is more suitable for the generation of harmonics from a given frequency source in two different types of cavities, a free-walled resonator of length in Section 3.1 and a open-field cavity of length in Section 3.2. These resonators are chosen with these boundary conditions to limit the generation of subharmonics [21]. It must be noted here that whereas [21] studies the behavior of subharmonics, we study here the behavior of harmonics and their use to optimize the bubbly medium. The length is chosen to control the maximum pressure amplitude in the cavity. The length is enough to define open-field propagation. The liquid considered here is water, for which m/s, kg/m, and m/s, and the gas is air, with m/s, kg/m, and .
In the following, the last instant used in the simulations, , is high enough to guarantee the steady regime in the cavity; in Section 3.1 and in Section 3.2. The frequency-dependent results shown here are obtained by fast Fourier transform (FFT) applied to the last of the time-dependent acoustic pressure signal at a given space point within the cavity.
3.1. Cavity of Length
3.1.1. Amplitudes in the Cavity
In this section, we consider the free-walled resonator of length and a medium defined by m and m ( MHz). The void fraction . At the source we set kHz ( and kPa. The distribution of amplitudes of the fundamental and harmonic components generated in the cavity is shown in Figure 1. The maximum amplitude is obtained at the source frequency f. The maximum amplitude at the 2nd harmonic is huge, of , whereas the respective values at the 3rd and 4th harmonics are much lower, and .
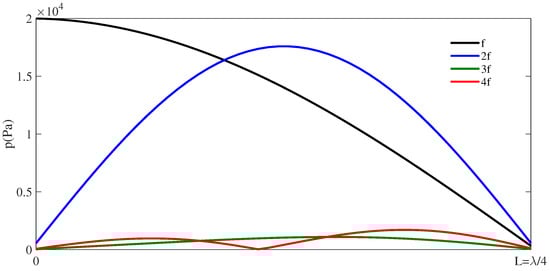
Figure 1.
Amplitude of f (black line), (blue line), (green line), and (red line) in the cavity of length vs. for kPa.
3.1.2. Several Source Amplitudes
To determinate which medium is more convenient to obtain more harmonic amplitudes for a given f, we change both and (thus also and ) by keeping constant at . Figure 2 shows the maximum amplitude of the 2nd, 3rd, and 4th harmonics vs. ratio for kPa, kPa, and kPa. The higher is ratio (medium with more smaller bubbles), the higher are the harmonic amplitudes. When increases from 3 to 20 the harmonic amplitudes grow quickly, whereas for values of from 20 to 65 their growth is slower and ends up to be constant. This behavior is similar for the three studied here, although, as expected, the harmonic generation is more intense for larger .
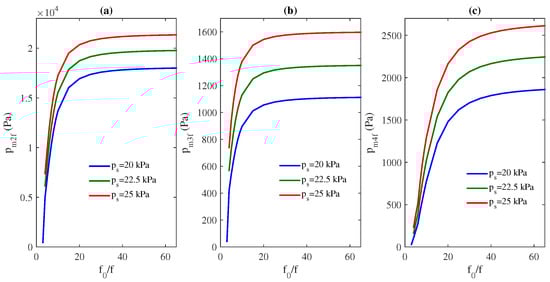
Figure 2.
Maximum amplitude of (a), (b), (c) in the cavity of length vs. , for three different source amplitudes kPa (blue line), kPa (green line), and kPa (red line).
3.1.3. Several Void Fractions
We carry out a study similar to the one in Section 3.1.2 but by keeping constant at kPa and for different void fractions. Figure 3 displays the maximum amplitude of the 2nd, 3rd, and 4th harmonics vs. ratio for , , and . The higher is , the higher are the harmonic amplitudes. When increases the 2nd harmonic amplitude hardly varies, whereas the 3rd and 4th harmonic amplitudes change over a high range. This range is higher for the 3rd harmonic. The growth with is similar to the previous section: When increases from 3 to 20 the harmonic amplitudes grow quickly, whereas for values of from 20 to 65 their growth is slower and ends up to be constant. It must be noted that even if pressure amplitudes here are low and void fractions here are high for biomedical applications [17], even in the case of imaging, this study shows that intense second and third harmonics can be obtained even at moderate pressure amplitudes through the correct definition of the optimal parameters of the bubbly liquid, such as bubble size and density.
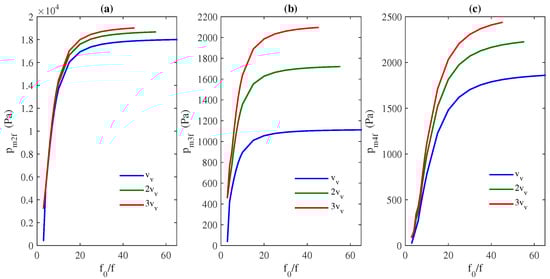
Figure 3.
Maximum amplitude of (a), (b), (c) in the cavity of length vs. , for three different void fractions (blue line), (green line), and (red line).
3.1.4. Several Source Frequencies
A study similar to Section 3.1.2 and Section 3.1.3 is carried out by keeping constant at kPa and constant at for different source frequencies. Figure 4 represents the maximum amplitude of the 2nd, 3rd, and 4th harmonics vs. ratio for kHz, kHz, and kHz. The lowest f value generates the higher harmonic amplitudes. The difference observed in the harmonic generation with the source frequency is more accentuated for the 4th and 3rd harmonics, although the latter to a lesser extent. The growth with is similar to the previous sections, when increases from 3 to 20 the harmonic amplitudes grow quickly, whereas for values of from 20 to 65 their growth is slower and ends up to be constant.
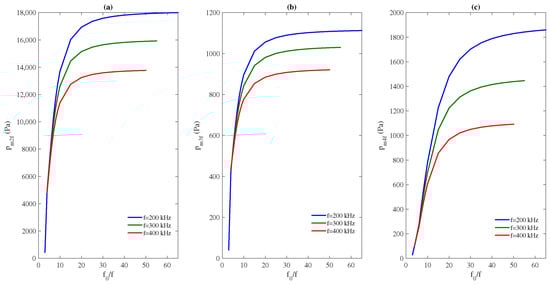
Figure 4.
Maximum amplitude of (a), (b), and (c) in the cavity of length vs. , for three different source frequencies kHz (blue line), kHz (green line), and kHz (red line).
To summarize, in this resonator, larger source amplitudes, smaller source frequencies, more amount of air and, for the same void fraction, more smaller bubbles, are more convenient and efficient for the generation of more intense harmonics.
3.2. Cavity of Length
3.2.1. Amplitudes in the Cavity
In this section, we consider the open-field cavity of length and we use the same parameters as in Section 3.1.1. The shape of the source and harmonic amplitudes inside the cavity is shown in Figure 5. As we can see, the maximum amplitude is given for the source frequency, f, and its position is at the source. The maximum of the 2nd harmonic amplitude is (of ) and its position is at , the maximum of the 3rd harmonic amplitude is (of ) and its position is at , and the 4th harmonic amplitude is (of ) and its position is at .
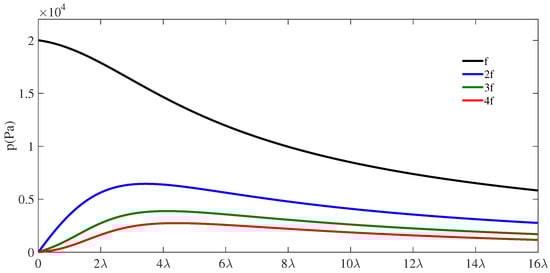
Figure 5.
Amplitude of f (black line), (blue line), (green line), and (red line) in the cavity of length vs. for kPa.
3.2.2. Several Source Amplitudes
To determinate which medium is more convenient to obtain more harmonic amplitudes for a given f, we change both and (thus also and ) by keeping constant at . Figure 6 shows the maximum amplitude of the 2nd, 3rd, and 4th harmonics vs. ratio for kPa, kPa, and kPa. A maximum for each 2nd, 3rd, and 4th harmonics exists. If we focus our attention on the generation of the second harmonic, Figure 6a, the maximum amplitude takes place when the ratio , with amplitudes of the order of (of ) for the three source amplitudes studied. The third harmonic has the maximum amplitude when , with amplitudes of the order of (of ) for the three source amplitudes studied. The fourth harmonic has the maximum amplitude when , with amplitudes of the order of (of ) for the three source amplitudes studied. The three harmonics have a similar behavior with , the harmonic amplitude grows quickly until it reaches a maximum, and then it decreases quickly until reaching a constant value. This behavior is similar for the three studied here, although, as expected, the harmonic generation is more intense for larger .
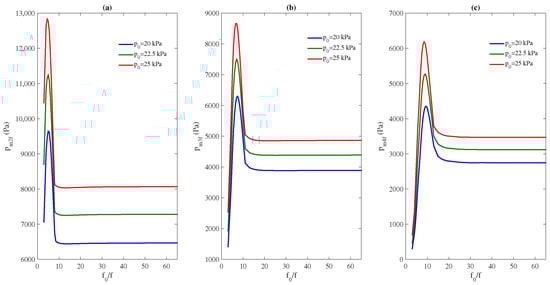
Figure 6.
Maximum amplitude of (a), (b), and (c) in the cavity of length vs. , for three different source amplitudes kPa (blue line), kPa (green line), and kPa (red line).
3.2.3. Several Void Fractions
We carried out a study similar to the one in Section 3.2.2 but by keeping constant at kPa and for different void fractions. Figure 7 displays the maximum amplitude of the 2nd, 3rd, and 4th harmonics vs. ratio for , , and . The generation of harmonics in this configuration is totally independent on void fraction, for the three void fractions the same harmonic amplitudes are obtained, the maximum for the three harmonics is maintained for the same ratio .
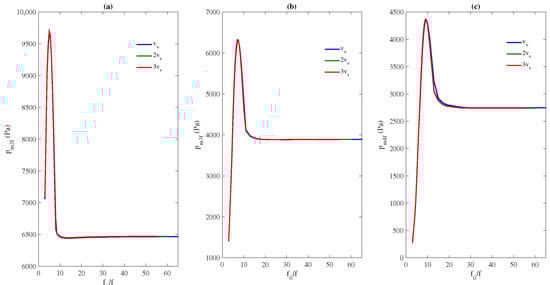
Figure 7.
Maximum amplitude of (a), (b), and (c) in the cavity of length vs. , for three different void fractions (blue line), (green line), and (red line).
3.2.4. Several Source Frequencies
A study similar to Section 3.2.2 and Section 3.2.3 is carried out by keeping constant at kPa and constant at for different source frequencies. Figure 8 represents the maximum amplitude of the 2nd, 3rd, and 4th harmonics vs. ratio for kHz, kHz, and kHz. The lowest f value generates the higher harmonic amplitudes, in a way similar to Section 3.1.4. For the three harmonics, the maximum is shifted slightly toward a lower ratio for higher source frequencies.
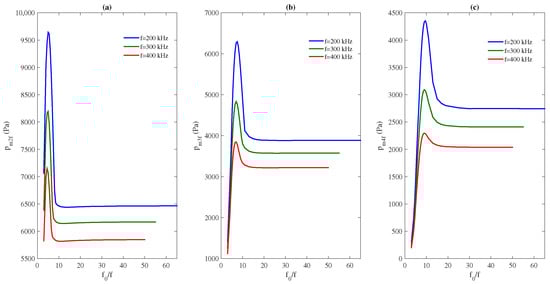
Figure 8.
Maximum amplitude of (a), (b), and (c) in the cavity of length vs. , for three different source frequencies kHz (blue line), kHz (green line), and kHz (red line).
To summarize, in this open-field case, larger source amplitudes, smaller source frequencies, and a ratio of approximately 5, 7, and 9 are more convenient and efficient for maximizing the 2nd, 3rd, and 4th harmonic, respectively. The generation of harmonics in this configuration is independent of void fraction.
4. Conclusions
In this work, we have carried out several one-dimensional numerical studies to analyze and to enhance the generation of harmonics in a bubbly liquid from a single-frequency ultrasonic field in two cavities. Our results show that higher source amplitudes (20–25 kPa), lower source frequencies (200–400 kHz), and higher void fractions are more suitable for the enhancement of the amplitude of harmonic components amplitudes in the free-walled cavity of length . Moreover, when keeping a constant void fraction in the cavity, smaller bubbles are more adequate for this purpose. This latter could especially be useful in practice. On the other hand, higher source amplitudes and lower source frequencies are more suitable for the enhancement of the amplitude of harmonic components amplitudes in the open-field cavity of length , whereas the modification of void fractions has no influence on this enhancement over the frequency range considered here. Moreover, when keeping a constant void fraction in this cavity, the optimal bubble size is , , and for maximizing the 2nd, 3rd, and 4th harmonic, respectively. This latter could be particularly useful in practice.
Author Contributions
Conceptualization, M.T.T.S. and C.V.; methodology, M.T.T.S. and C.V.; software, M.T.T.S. and C.V.; validation, M.T.T.S. and C.V.; formal analysis, M.T.T.S. and C.V.; investigation, M.T.T.S. and C.V.; writing—original draft preparation, M.T.T.S. and C.V.; writing—review and editing, M.T.T.S. and C.V.; supervision, C.V.; project administration, C.V.; funding acquisition, C.V. All authors have read and agreed to the published version of the manuscript.
Funding
This research was funded by the National Agency for Research (Agencia Estatal de Investigación, AEI), Ministry of Science and Innovation of Spain (Ministerio de Ciencia e Innovación), and the European Regional Development Fund (FEDER), grant number DPI2017-84758-P.
Institutional Review Board Statement
Not applicable.
Informed Consent Statement
Not applicable.
Data Availability Statement
Data is contained within the article.
Conflicts of Interest
The authors declare no conflict of interest. The funders had no role in the design of the study; in the collection, analyses, or interpretation of data; in the writing of the manuscript; or in the decision to publish the results.
References
- Hamilton, M.F.; Blackstock, D.T. Nonlinear Acoustics, 1st ed.; Academic Press: San Diego, CA, USA, 1998. [Google Scholar]
- Naugolnykh, K.; Ostrovsky, L. Nonlinear Wave Processes in Acoustics, 1st ed.; Cambridge University Press: Cambridge, MA, USA, 1998. [Google Scholar]
- Sinha, D.N.; Pantea, C. Broadband unidirectional ultrasound propagation using sonic crystal and nonlinear medium. Emerg. Mat. Res. 2013, 2, 117–126. [Google Scholar] [CrossRef]
- Desser, T.S.; Jeffrey, R.B. Tissue harmonic imaging tecniques: Physical principles and clinical aplications. Semin. Ultrasound CT MRI 2001, 22, 1–10. [Google Scholar] [CrossRef] [PubMed]
- Newhouse, V.L.; Mohana Shankar, P. Bubble size measurements using the nonlinear mixing of two frequencies. J. Acoust. Soc. Am. 1984, 75, 1473–1477. [Google Scholar] [CrossRef]
- Buckey, J.C.; Knaus, D.A.; Alvarenga, D.L.; Kenton, M.A.; Magari, P.J. Dual-frequency ultrasound for detecting and sizing bubbles. Acta Astronaut. 2005, 56, 1041–1047. [Google Scholar] [CrossRef] [PubMed]
- Kim, B.-N.; Yoon, S.W. Nonlinear parameter estimation in water-saturated sandy sediment with difference frequency acoustic wave. Ultrasonics 2009, 49, 438–445. [Google Scholar] [CrossRef] [PubMed]
- Westervelt, P.J. Parametric Acoustic Array. J. Acoust. Soc. Am. 1963, 35, 1535–1537. [Google Scholar] [CrossRef]
- Forsberg, F.; Shi, W.T.; Goldberg, B.B. Subharmonic imaging of contrast agents. Ultrasonics 2000, 38, 93–98. [Google Scholar] [PubMed]
- Shankar, P.M.; Krishna, P.D.; Newhouse, V.L. Advantages of Subharmonic over Second Harmonic Backscatter for Contrast-to-Tissue Echo Enhancement. Ultrasound Med. Biol. 1998, 24, 395–399. [Google Scholar] [CrossRef] [PubMed]
- Lombard, O.; Barrière, C.; Leroy, V. Nonlinear multiple scattering of acoustic waves by a layer of bubbles. Europhys. Lett. 2015, 112, 24002. [Google Scholar] [CrossRef]
- Guo, X.; Lin, Z.; Tu, J.; Liang, B.; Cheng, J.; Zhang, D. Modeling and optimization of an acoustic diode based on micro-bubble nonlinearity. J. Acoust. Soc. Am. 2013, 133, 1119–1125. [Google Scholar] [CrossRef] [PubMed]
- Tejedor-Sastre, M.T.; Vanhille, C. A numerical model for the study of the difference frequency generated from nonlinear mixing of standing ultrasonic waves in bubbly liquids. Ultrason. Sonochem. 2017, 34, 881–888. [Google Scholar] [CrossRef] [PubMed]
- Greiser, F.; Choi, P.K.; Enomoto, N.; Harada, H.; Okitsu, K.; Yasui, K. Sonochemistry and the Acoustic Bubble, 1st ed.; Elsevier: Amsterdam, The Netherland, 2015. [Google Scholar]
- Zabolotskaya, E.A.; Soluyan, S.I. Emission of harmonic and combination frequency waves by air bubbles. Soviet. Phys. Acoust. J. 1973, 18, 396–398. [Google Scholar]
- Tiwari, A.; Pantano, C.; Freund, J.B. Growth-and-collapse dynamics of small bubble clusters near a wall. J. Fluid. Mech. 2015, 775, 1–23. [Google Scholar] [CrossRef]
- Sojahrood, A.J.; Haghi, H.; Karshfian, R.; Kolios, M.C. Probing the pressure dependence of sound speed and attenuation in bubbly media: Experimental observations, a theoretical model and numerical calculations. Ultrason. Sonochem. 2023, 95, 106319. [Google Scholar] [CrossRef]
- Louisnard, O. A simple model of ultrasound propagation in a cavitating liquid. Part I: Theory, nonlinear attenuation and traveling wave generation. Ultrason. Sonochem. 2012, 19, 56–65. [Google Scholar] [CrossRef] [PubMed]
- Commander, K.W.; Prosperetti, A. Linear pressure waves in bubbly liquids: Comparison between theory and experiments. J. Acoust. Soc. Am. 1989, 85, 732–746. [Google Scholar] [CrossRef]
- Fuster, D.; Conoir, J.M.; Colonius, T. Effect of direct bubble-bubble interactions on linear-wave propagation in bubbly liquids. Phys. Rev. E 2014, 90, 063010. [Google Scholar]
- Tejedor Sastre, M.T.; Louisnard, O.; Vanhille, C. Generation of subharmonics in acoustic resonators containing bubbly liquids: A numerical study of the excitation threshold and hysteretic behavior. Ultrason. Sonochem. 2022, 88, 1350–4177. [Google Scholar] [CrossRef] [PubMed]


Disclaimer/Publisher’s Note: The statements, opinions and data contained in all publications are solely those of the individual author(s) and contributor(s) and not of MDPI and/or the editor(s). MDPI and/or the editor(s) disclaim responsibility for any injury to people or property resulting from any ideas, methods, instructions or products referred to in the content. |
© 2023 by the authors. Licensee MDPI, Basel, Switzerland. This article is an open access article distributed under the terms and conditions of the Creative Commons Attribution (CC BY) license (https://creativecommons.org/licenses/by/4.0/).