Abstract
The degree of the over-consolidation ratio (OCR) of silty clay affects the soil’s mechanical properties and in situ test results. The present study utilized numerical analysis to investigate the behavior of cone penetration and pore pressure dissipation in typical silty clay soils, while also taking into account the impact of the over-consolidation ratio (OCR). Effective stress finite-element analyses, which accounted for considerable deformation, were carried out at various OCRs. The model assumed the soil as a homogeneous material obeying the modified Cam Clay (MCC) model. The significant advance of this work is the evaluation of the effect of OCR on penetration resistance and pore pressure test data and the calculation formula of OCR and ch in typical silty clay. An inversion method based on the results of piezocone penetration tests was proposed in terms of strength and the over-consolidation ratio of the silty clay, which is of great importance for the inversion of soil parameters in the Yellow River Delta region. This paper presents a consolidation coefficient inversion method of typical normally and over-consolidated silty clays and corrected the disadvantage that traditional conversion methods could not take OCR effects into account.
1. Introduction
There are a lot of silty clay layers in the Yellow River Delta and Bohai Bay as a result of Yellow River transportation, and the silty clay layers with varying degrees of consolidation deposits in the Bohai gulf are due to the action of waves and erosion [1,2,3]. Using in situ tests to obtain the physical and mechanical parameters of silty clay possesses significant engineering value. The piezocone is widely used in in situ tests [4,5,6]. The tests provide cone penetration resistance (qc), pore pressure (u) and sleeve friction (fs) in every inch of the subsoil depth when the probe is driven into soils by a quasistatic load at the penetration speed of 20 ± 5 mm/s [5]. The change in penetration resistance, sleeve friction and pore pressure dissipation are an index of the engineering properties of soil. The test data obtained from geotechnical laboratory experiments can be used to calculate the physical parameters of clay and sandy soils either through theoretical models or empirical correlations [7,8,9,10,11].
The over-consolidation ratio (OCR) would affect the penetration resistance and the pore pressure dissipation characteristics because the preconsolidation pressure affects the rigidity index (Ir), undrained shear strength (su) and the permeability coefficient (k) of the clay [12,13,14]. The OCR and horizontal consolidation coefficients ch are important parameters for clays. Silty clay is a type of clay, but because of the existence of silty particles, the effective angle of friction, undrained shear strength and compressive modulus are typically higher than regular clay [15,16]. The Yellow River Delta and Bohai Bay regions are known to have a high prevalence of silty clay soils, which are notoriously difficult to characterize due to their complex structure and variable properties. As a result, accurate assessment of the geotechnical behavior of these soils is essential for the safe and reliable design of infrastructure projects. It is necessary to select the typical parameters of silty clays and analyze the influence of the OCR variation in different soils on penetration and pore pressure dissipation.
Mayne [17] proposed a semiempirical formula for estimating the OCR by combining the cavity expansion theory with the theory of critical state. Lunne et al. [18] recommend the empirical coefficient k for OCR estimation. According to Torstensson [19], the process of pore pressure dissipation follows the principles of cavity expansion theory, and it is recommended to use T50 for the calculation of consolidation coefficient. explains the law of pore pressure dissipation based on the cavity expansion theory and recommends using the T50 to calculate the consolidation coefficient. Houlsby and Teh [20] used the strain path method and recommended using the T* instead of T; T* is related to the position of the pore pressure sensor and the degree of consolidation. Mahmoodzadeh et al. [21] established the link between coefficients of consolidation measured in field piezocone dissipation tests and laboratory oedometer tests based on coupled effective stress FE approaches. The modified Cam Clay model is a constitutive model that is widely used to simulate the mechanical behavior of clay soils. One key advantage of the modified Cam Clay model is its ability to accurately capture the changes in void ratio during both penetration and dissipation phases of testing. This is important because clay soils are known to exhibit significant changes in void ratio during loading and unloading, which can greatly affect their consolidation behavior. The FE methods could consider the distribution of the pore pressure field and stress field in the early penetration stage, which is more accurate than traditional cavity expansion theory [22,23,24].
This paper presents the results of coupled pore fluid diffusion and effective stress FE analyses. Combined with the modified Cam Clay (MCC) constitutive model, we simulated a cone penetration and dissipation test in clay. Two typical silty clay parameters were selected. The effect of the OCR is discussed quantitatively by comparing the penetration resistance and pore pressure dissipation curves under OCR = 1, 3 and 5. The OCR calculation formula is established by comparing the calculation results of penetration resistance, and the ch calculation formula, which takes into account the influence of the over-consolidation ratio (OCR), is derived by analyzing and comparing dissipation curves obtained under varying OCR values.
2. Numerical Model
2.1. Model Geometry
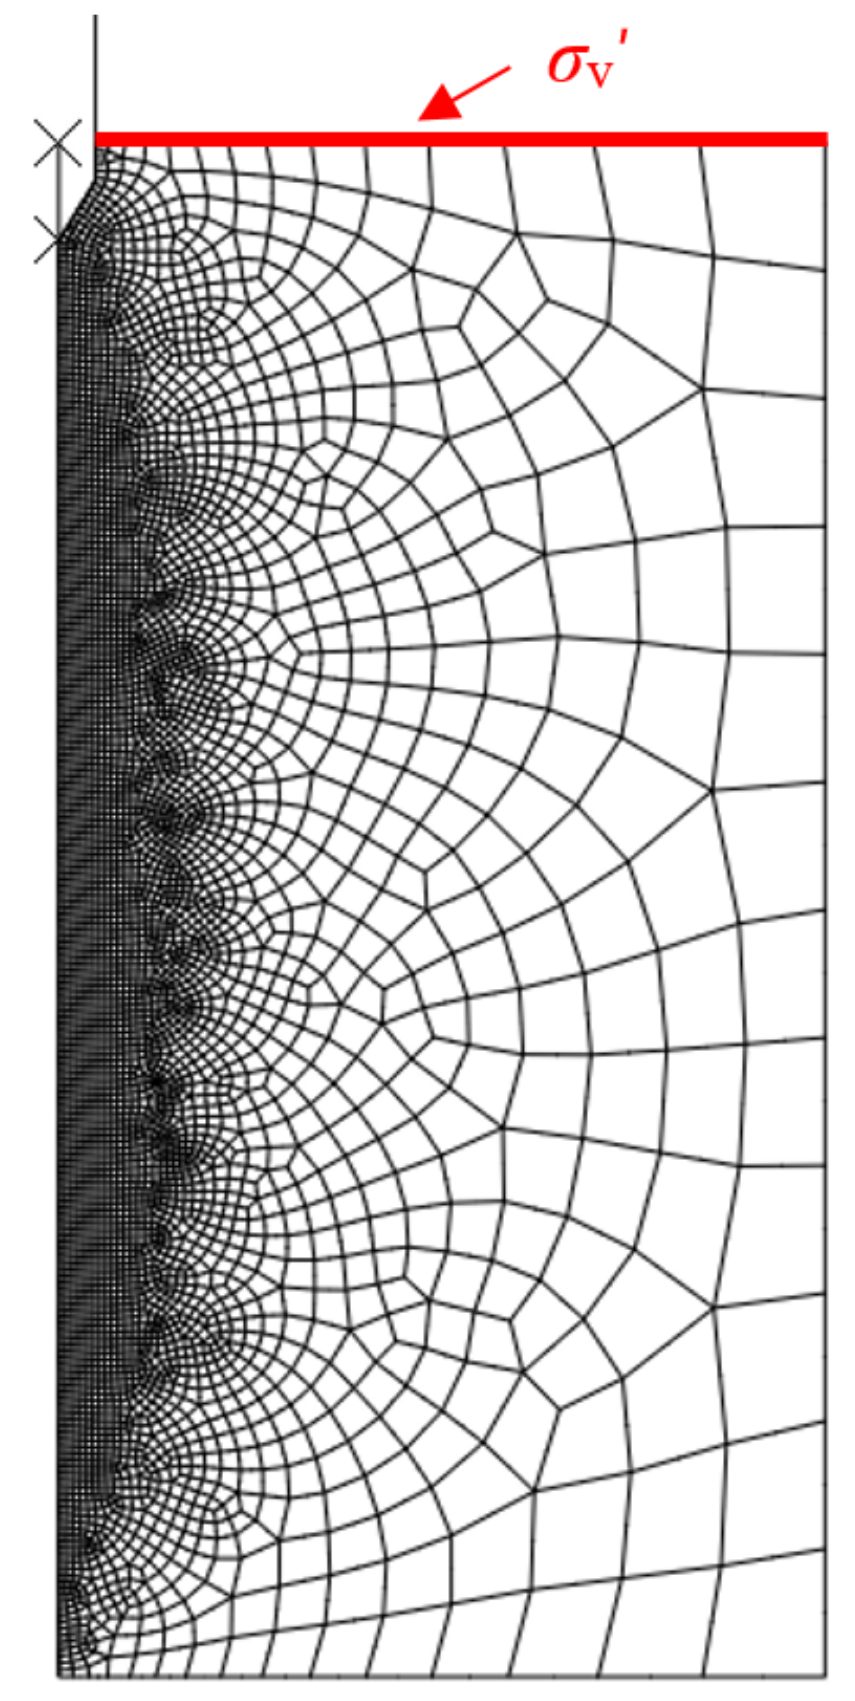
The use of numerical simulations to model the behavior of the piezocone probe in soil is a valuable tool in geotechnical engineering. It allows engineers to study the effects of different soil properties and boundary conditions on the probe measurements. In this article, the software Abaqus is employed as a critical tool in performing the simulations and analysis required for the study [24]. Figure 1 shows the model for a piezocone penetration simulation, which is a type of unit test used to determine the penetration resistance of a specific layer of soil under a particular pressure. The penetration resistance value obtained from this simulation corresponds only to the soil layer being tested and not to the entire soil profile. To expand on the statement, the pressure exerted by the overlying soil is known as the overburden pressure or overlying pressure. This pressure is caused by the weight of the soil above a certain point or depth. The overburden pressure increases with depth. To account for the effects of pore water pressure on soil behavior, it is common practice to use effective stress analysis.

Figure 1.
FE simulation model.
The standard size piezocone probe was considered in this research, and the diameter was approximately 0.036 m to simplify the calculation. The axisymmetric problem in the simulation involved dividing the soil into quadratic quadrilateral elements using reduced integration. The piezocone probe, on the other hand, was treated as a rigid body in the simulation, and its interaction with the soil was modeled using smooth contact. If it was necessary to compare with the experimental results, the influence of the friction coefficient was directly added to 1.3αc on Nc [6]. The soil domain was extended at least 10 times the cone diameter (D) in the horizontal direction and 20 times the cone diameter (D) in the vertical directions, which was sufficient to avoid boundary effects during the penetration and dissipation stage. Fixed displacement boundary conditions were specified on the base and sides of the soil domain. Any excess pore pressure was allowed to dissipate at the soil surface only.
To achieve steady conditions for the penetration resistance and excess pore pressure field, the penetrometers were first pre-embedded to a depth of 0.1 times the probe diameter (0.1 D), and then penetrated to a depth of 10 times the probe diameter (10 D) before entering the dissipation phase. Analysis of the results showed that a penetration distance of 6 times the probe diameter (6 D) was adequate for achieving steady conditions for both the penetration resistance and the excess pore pressure field. The mesh is shown in Figure 1. The mesh site sensitivity was tested and the mesh near the probe was 0.05 D. A tube with a diameter of D/20 was used to avoid serious mesh distortion, and the tube was treated as a rigid body. The interaction between the piezocone and soil was modelled with smooth contact. This method was originally presented by Yi et al. [23] and Mahmoodzadeh et al. [21] and has the high potential to obtain an accurate result.
2.2. Material Properties
The standard Modified Cam Clay (MCC) model was incorporated in the calculation, and the MCC parameters used were derived from experimental results conducted by Goh [25] on kaolin silty clay with a high plastic limit, containing silty particles, as well as from Zhang’s results [1] on Yellow River Delta silty clay. Due to the higher content of silty particles, the permeability and consolidation coefficient of the two soils were larger. These can be regarded as two typical silty clays; the kaolin silty clay was a form of silty clay with a high content of hydrophilic minerals such as kaolin, and the Yellow River Delta silty clay possessed a high content of nonhydrophilic minerals such as quartz. The MCC parameters are listed in Table 1.

Table 1.
MCC model parameters of the kaolin silty clay [25] and the Yellow River silty clay [1].
The OCR was varied by changing the size of the initial yield surface [21]. The parameter a0 represents the initial yield surface in Abaqus [24]:
The horizontal earth pressure coefficient should correspond to OCR, K0 formula:
The initial void ratio should also correspond to the state. The initial void ratio on the swelling line was calculated based on the preconsolidation pressure and the current stress. The initial void ratio e0 formula:
where pre represents the preconsolidation pressure, eN is the void ratio at p′ = 1 kPa on the virgin consolidated line, q is the shear stress and p’ is the mean effective stress. The void ratio in the bracket is the void ratio on the K0 consolidation line, corresponding to the preconsolidation pressure.
2.3. Permeability Parameters of Soil
The dissipation of excess pore pressure around the piezocone, a critical factor in assessing the geotechnical properties of soil, is influenced by a multitude of factors, including soil properties such as permeability and compressibility coefficients. Permeability, which describes the ability of soil to transmit fluids, is influenced by various factors, including the soil’s void ratio, which is the ratio of the volume of voids to the volume of solids in the soil. As the void ratio increases, the number and size of the voids in the soil increase, and this leads to a higher permeability. In turn, a higher permeability allows for a more rapid dissipation of excess pore pressure around the piezocone during penetration testing. This relationship between void ratio and permeability is particularly relevant in soils with low initial void ratios, such as clays, where small changes in void ratio can lead to significant changes in permeability and, consequently, the dissipation rate of excess pore pressure. permeability was deduced from the vertical consolidation coefficient cv and cv of the kaolin silty clay [25] obtained from oedometer tests by Purwana [26], fitted as:
and cv of the Yellow River Delta silty clay [1], fitted as:
where σv′ represents the vertical effective stress level, and the variables cv and σv′ are expressed in units of m2/year and kPa,
The relation between the permeability coefficient k and cv is:
where γw is the water weight, Es is the one-dimensional modulus and Es is related to λ as:
For K0 condition, the relationship between the vertical effective stress and void ratio is expressed as
where e0 is the void ratio of the normal consolidated soil under a certain stress condition, C is the distance between the K0 consolidation line and isotropic consolidation line and C = 0.0567, based on the parameters listed in Table 1.
According to the above Equations (5)–(8), the relationship between permeability coefficient k and void ration e of the kaolin silty clay is fitted as:
and the Yellow River Delta silty clay is fitted as:
where the unit of k is m/s.
The equation V = vD/cv is used to indicate the degree of drainage that occurs during a penetration test, where D is the probe diameter (m) and v is penetrometer velocity (m/s). cv represents the vertical consolidation coefficient measured during a one-dimensional consolidation test conducted under the same level of stress, and is measured in units of square meters per second (m2/s) [27,28]. The penetration rate adopted for the penetration simulation was 20 mm/s, and the normalized penetration rate was V = vD/cv = 100–1122. It was in an undrained condition during cone penetration.
2.4. Model Verification
The results for cone penetration resistance and excess pore pressure dissipation were compared with the published cone resistance factor and consolidation coefficient solution. Figure 2 compares the numerical cone resistance factors (Nc) of this work with previous studies under OCR = 1, Ir = 67 and Ir = 91. There was a significant agreement with Lu et al.’s formula [6]. Due to the rigidity index Ir being different, there was a slightly different outcome from Mahmoodzadeh et al.’s [21] FE calculation result. In Figure 2, w/D was the normalized penetration displacement.
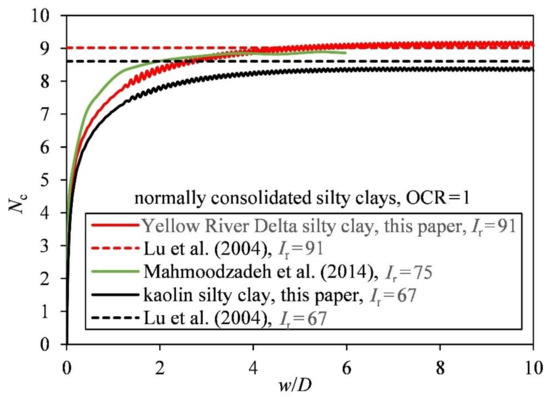
Figure 2.
Comparison of calculation results [6].
3. Effect of OCR on Penetration Resistance
3.1. Effect of OCR on Cone Resistance Factor Nc
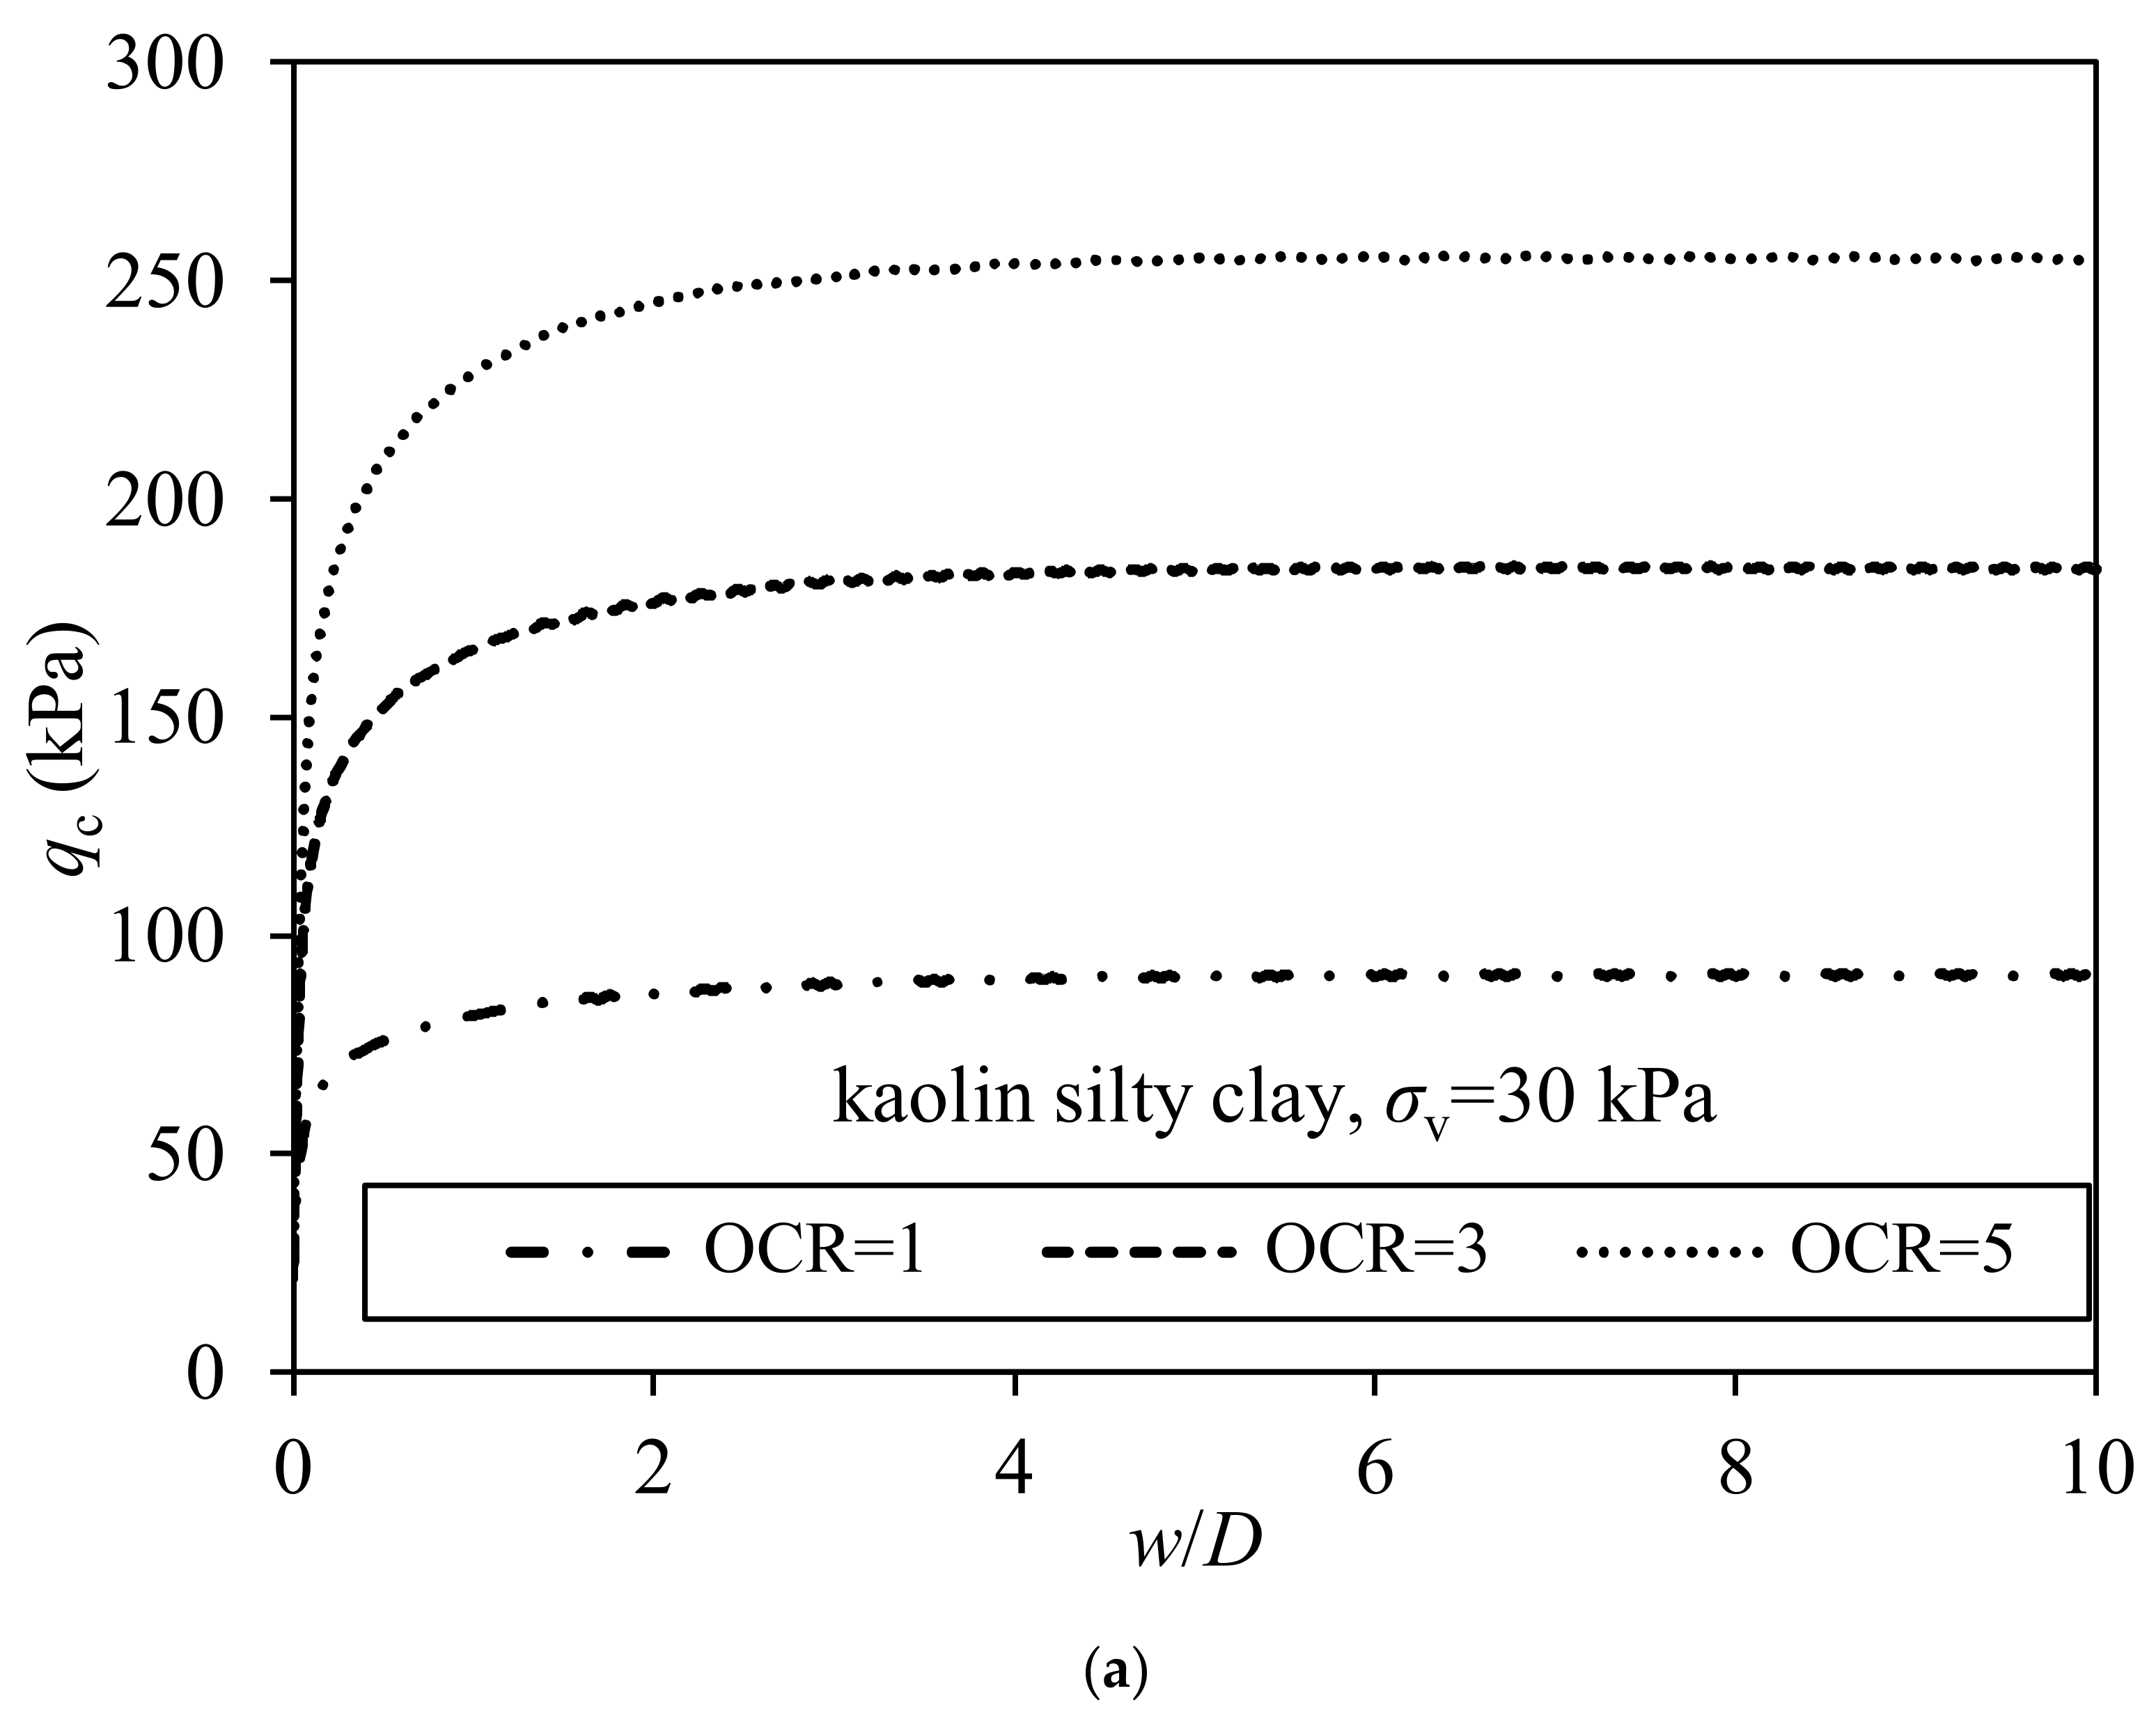
The cone tip resistance qc under different OCRs is shown in Figure 3. According to Figure 3, the OCR had a significant influence on qc.
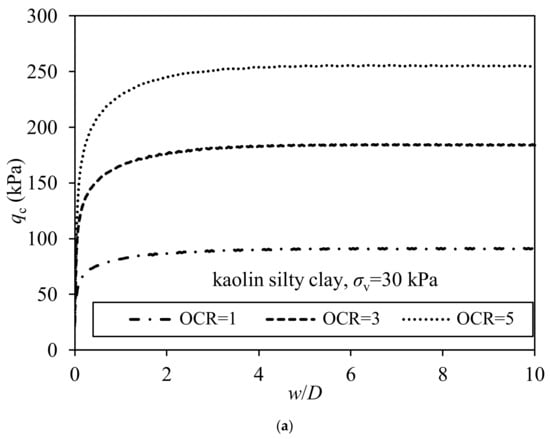

Figure 3.
Penetration resistance under different OCR at σv = 30 kPa. (a) Kaolin silty clay; (b) Yellow River Delta silty clay.
The cone tip resistance qc is related to the undrained shear strength in the form:
It is widely recognized that the cone resistance factor must vary with soil rigidity, owing to the accommodation of the cone volume by ‘elastic’ strains in the soil outside the plastic zone [6,18]. Lu et al.’s [6] cone resistance factor Nc is widely used in clay:
Equation (11) is adopted to normalize the calculated results. The undrained shear strength is theoretically derived from the Modified Cambridge Clay model:
where e is the void ratio of soil under the current state, and su is the undrained shear strength of the soil. For normally consolidated soils, e is on the K0 line, and for overconsolidated soils, e is on the swelling line. The relationship between the undrained strength of normally consolidated soil and over-consolidated soil under the same stress conditions is as follows:
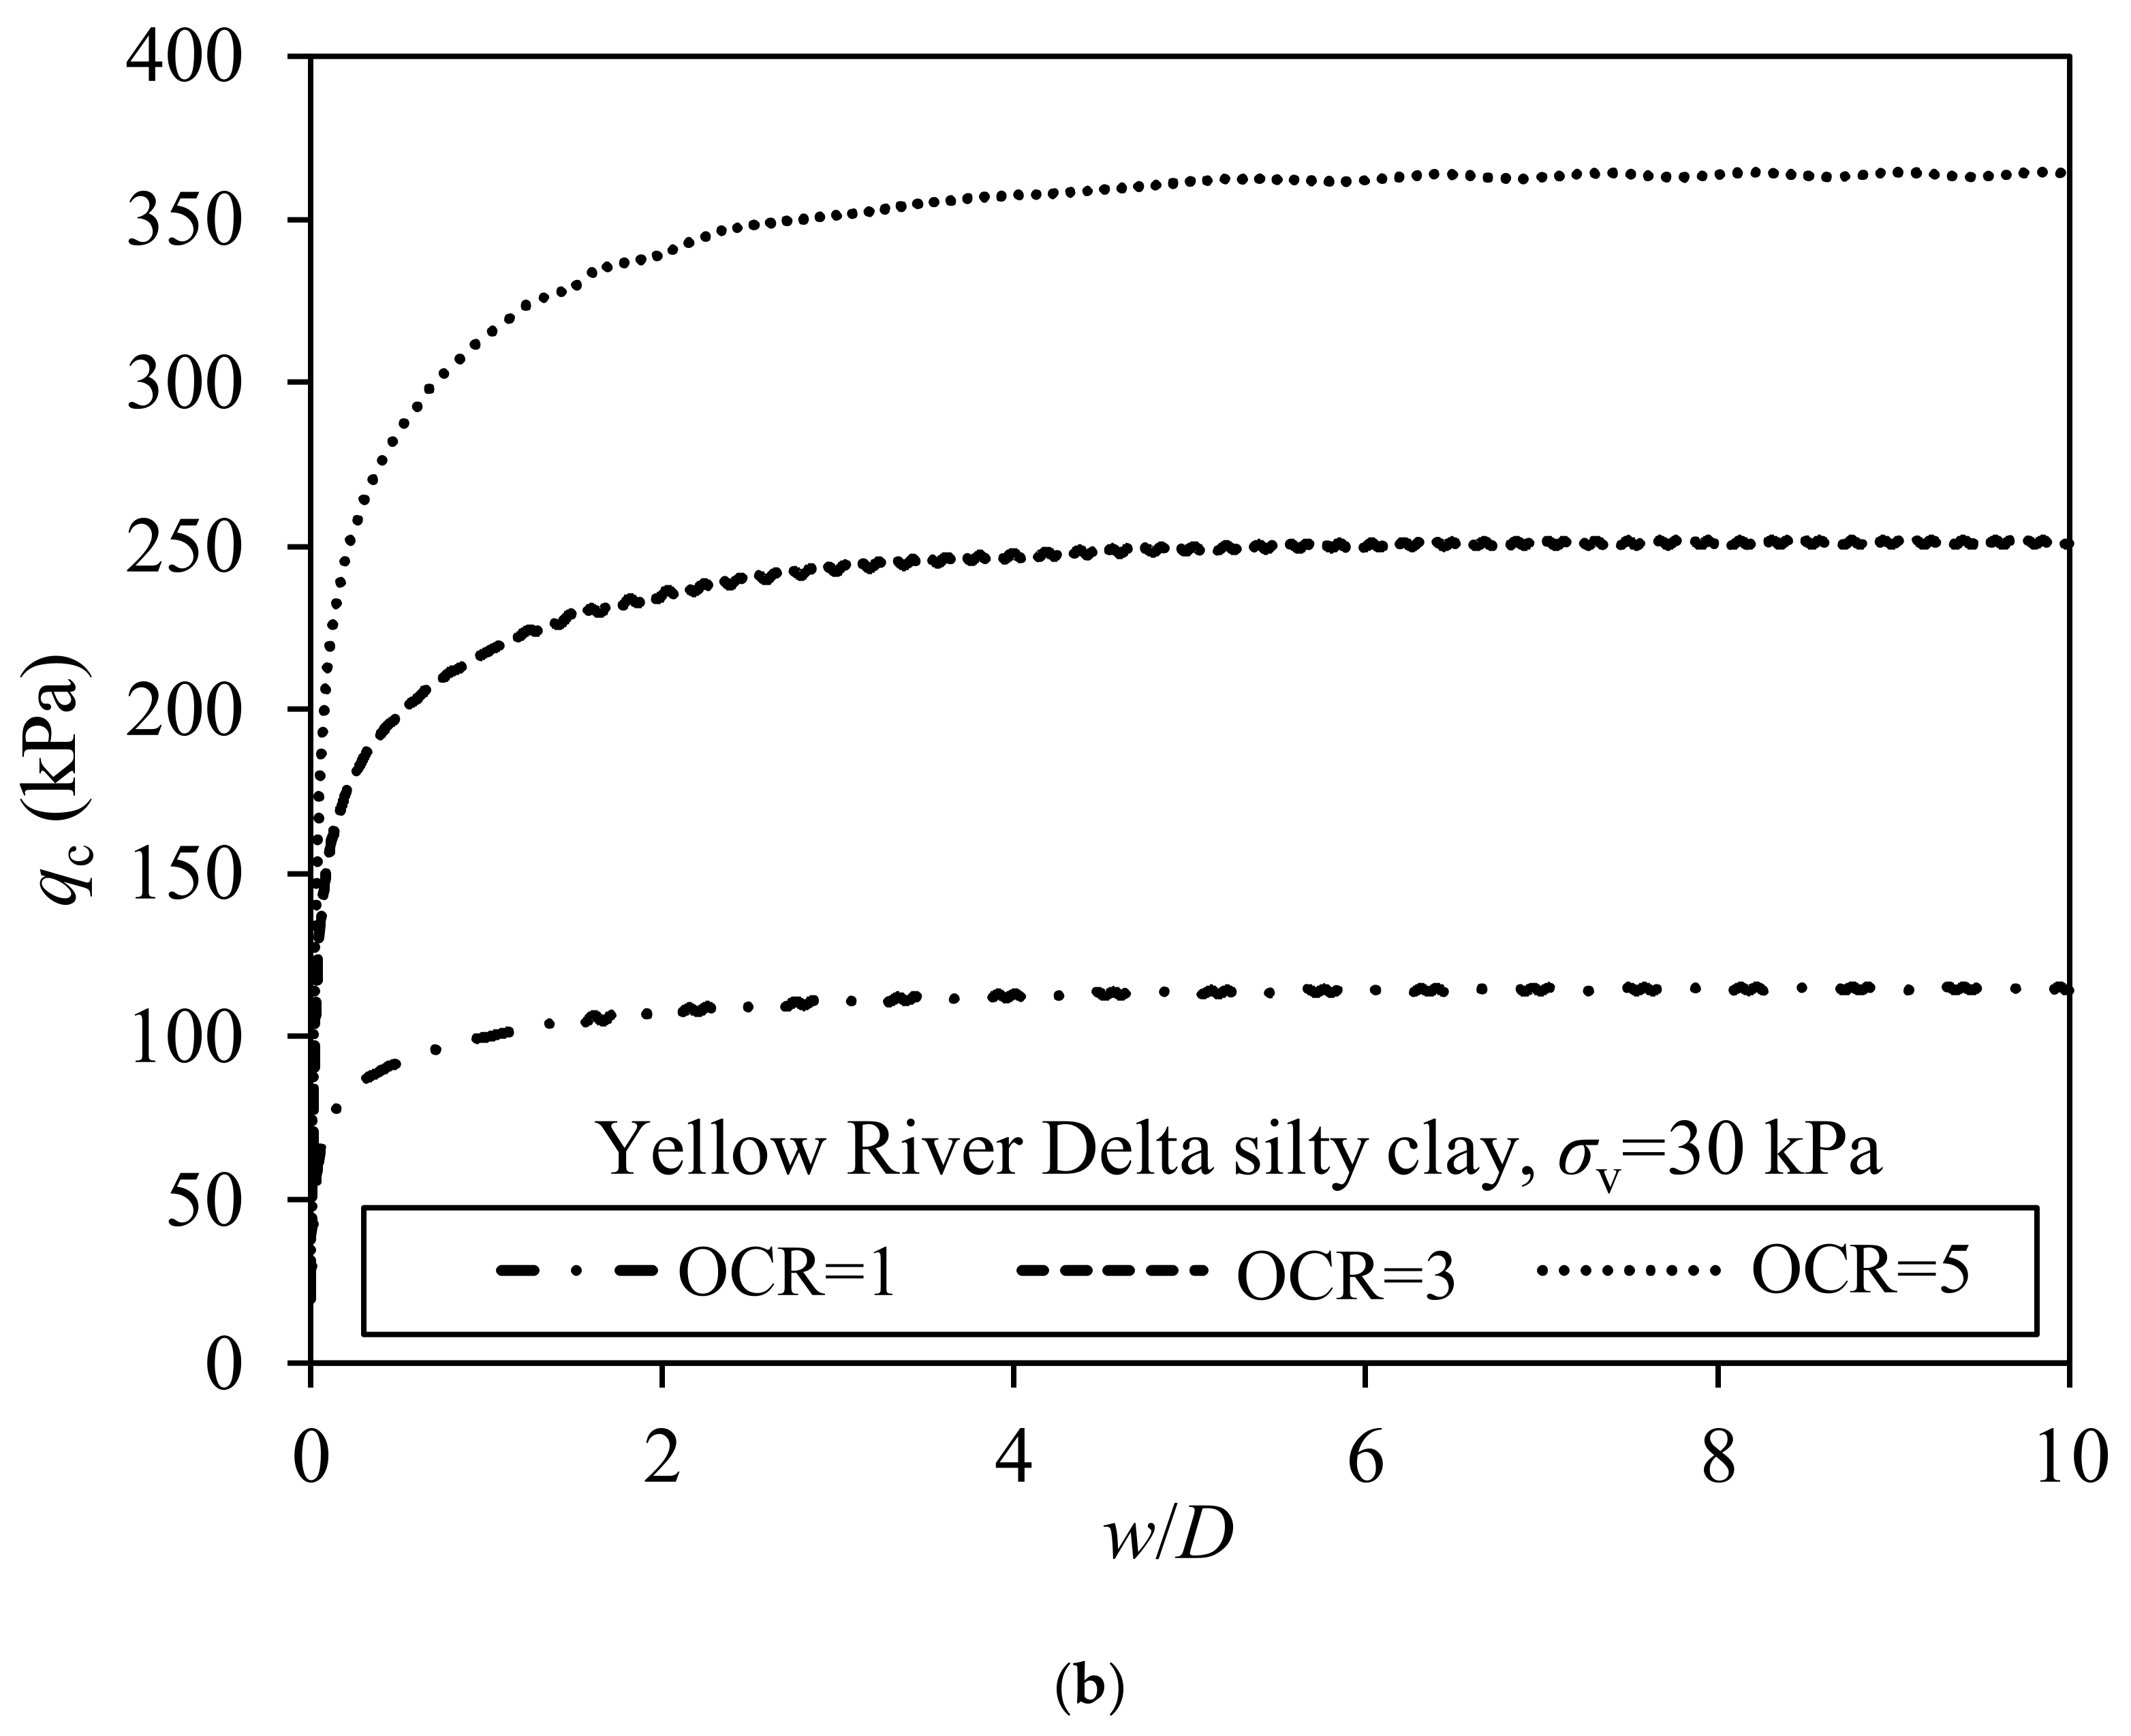
The cone resistance factor Nc is shown in Figure 4. It shows that the OCR almost does not affect Nc. The reason is that Nc mainly depends on plastic zone size and Ir is outside the plastic zone. The cone resistance factor Nc tends to be stable between 8–8.9 in kaolin silty clays and 8.9–9.9 in Yellow River Delta silty clay.
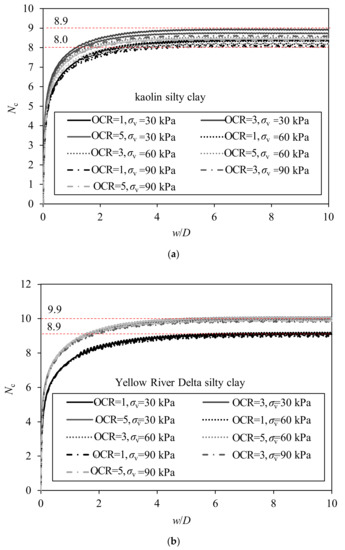
Figure 4.
Cone resistance factor Nc—normalized penetration depth curve. (a) Kaolin silty clay; (b) Yellow River Delta silty clay.
3.2. OCR Calculation Formula
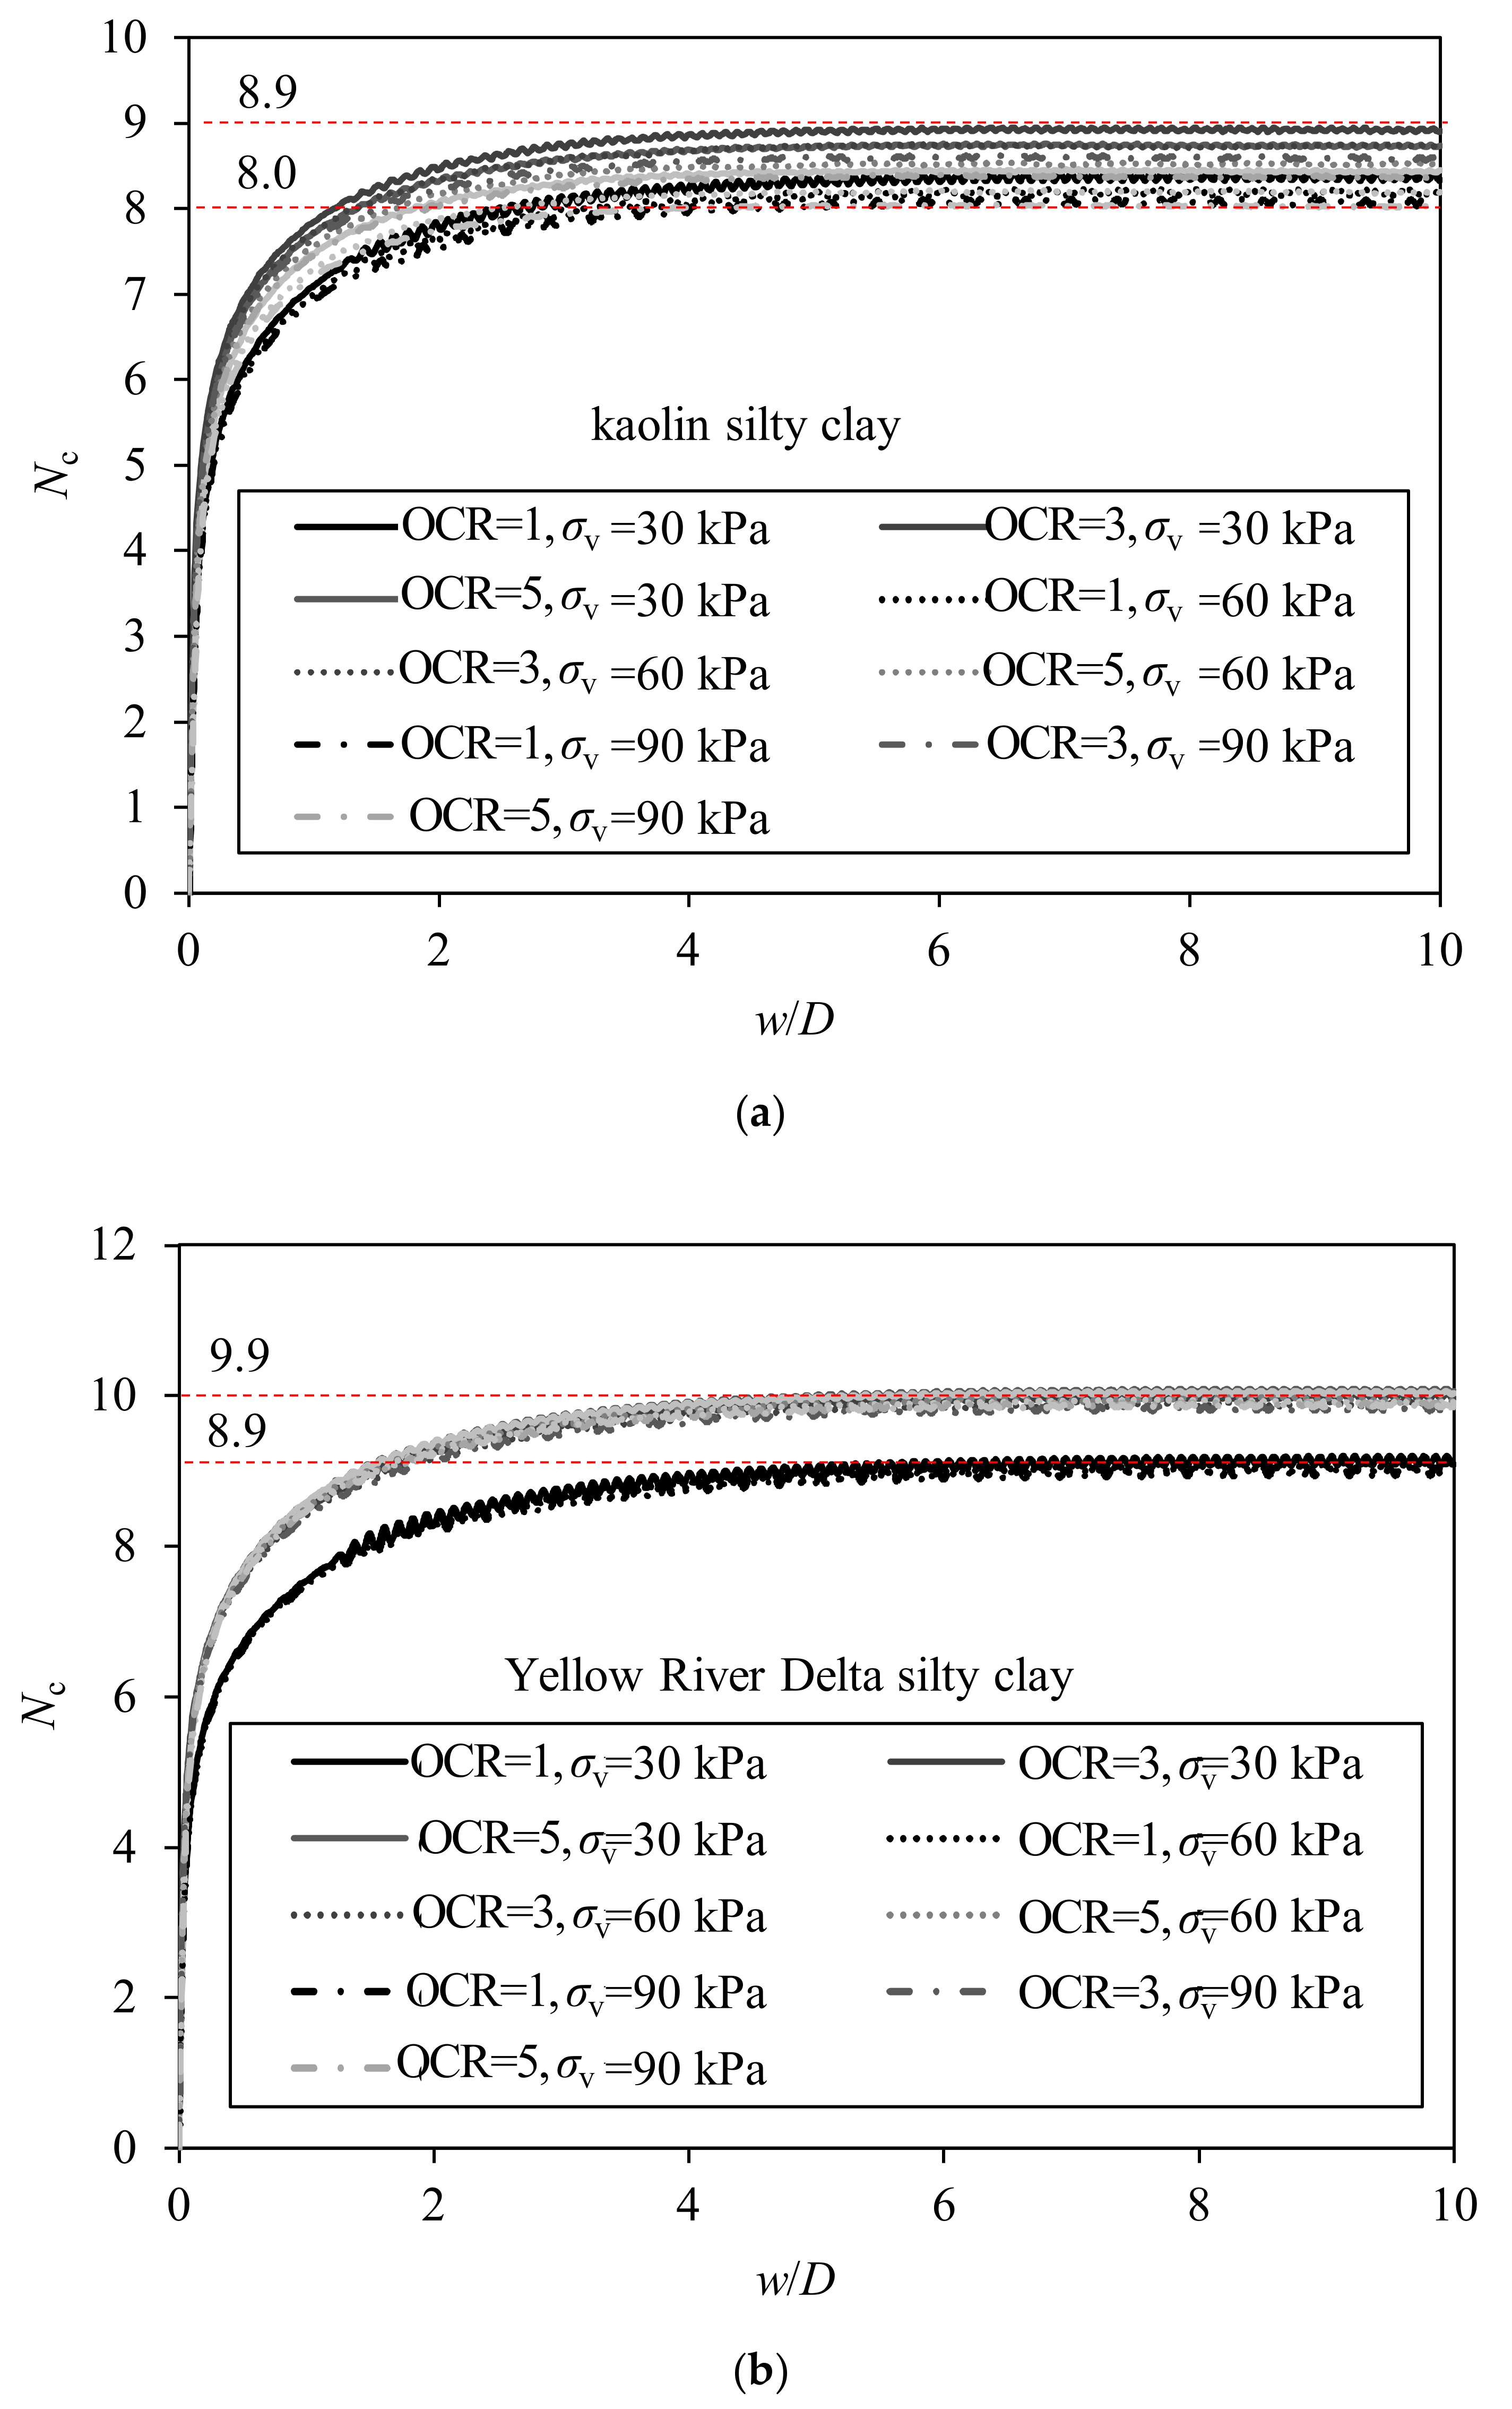
Compared with Lu et al.’s [6] Nc formula (Equation (12)), the Nc under different OCR and σv conditions is shown in Figure 5. The rigidity index Ir in Equation (12) can be calculated with the formula:
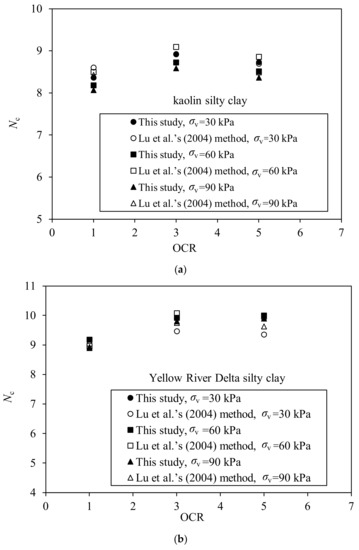
Figure 5.
Nc under different OCR and σv conditions. (a) Kaolin silty clay; (b) Yellow River delta silty clay [6].
According to Figure 5, the OCR affects Nc mainly by influencing the rigidity index Ir. The cone resistance factor Nc can be accurately predicted by using Lu et al.’s methods. According to the above calculation, the OCR of clay can be estimated with the following formula:
where Nc tends to be stable between 8–8.9 in kaolin silty clays and 8.9–9.9 in Yellow River Delta silty clay. It can be taken as 8.9 and 9.9 in the case of zero friction, and it can be taken as 9.8 and 10.8 when considering the friction. su(NC) depends on the soil type; for kaolin silty clay:
and for Yellow River Delta silty clay:
where Λ is the plastic compression ratio which is typically in the range of 0.6–0.8 [29], and it can be taken as 0.78 in silty clays.
In silty clays, Equation (16) can be expressed as
where m is related to the effective friction angle of soil, and it can be taken as 2.4–3.4.
4. Effect of OCR on Pore Pressure Dissipation
4.1. Effect of OCR on Initial Pore Pressure
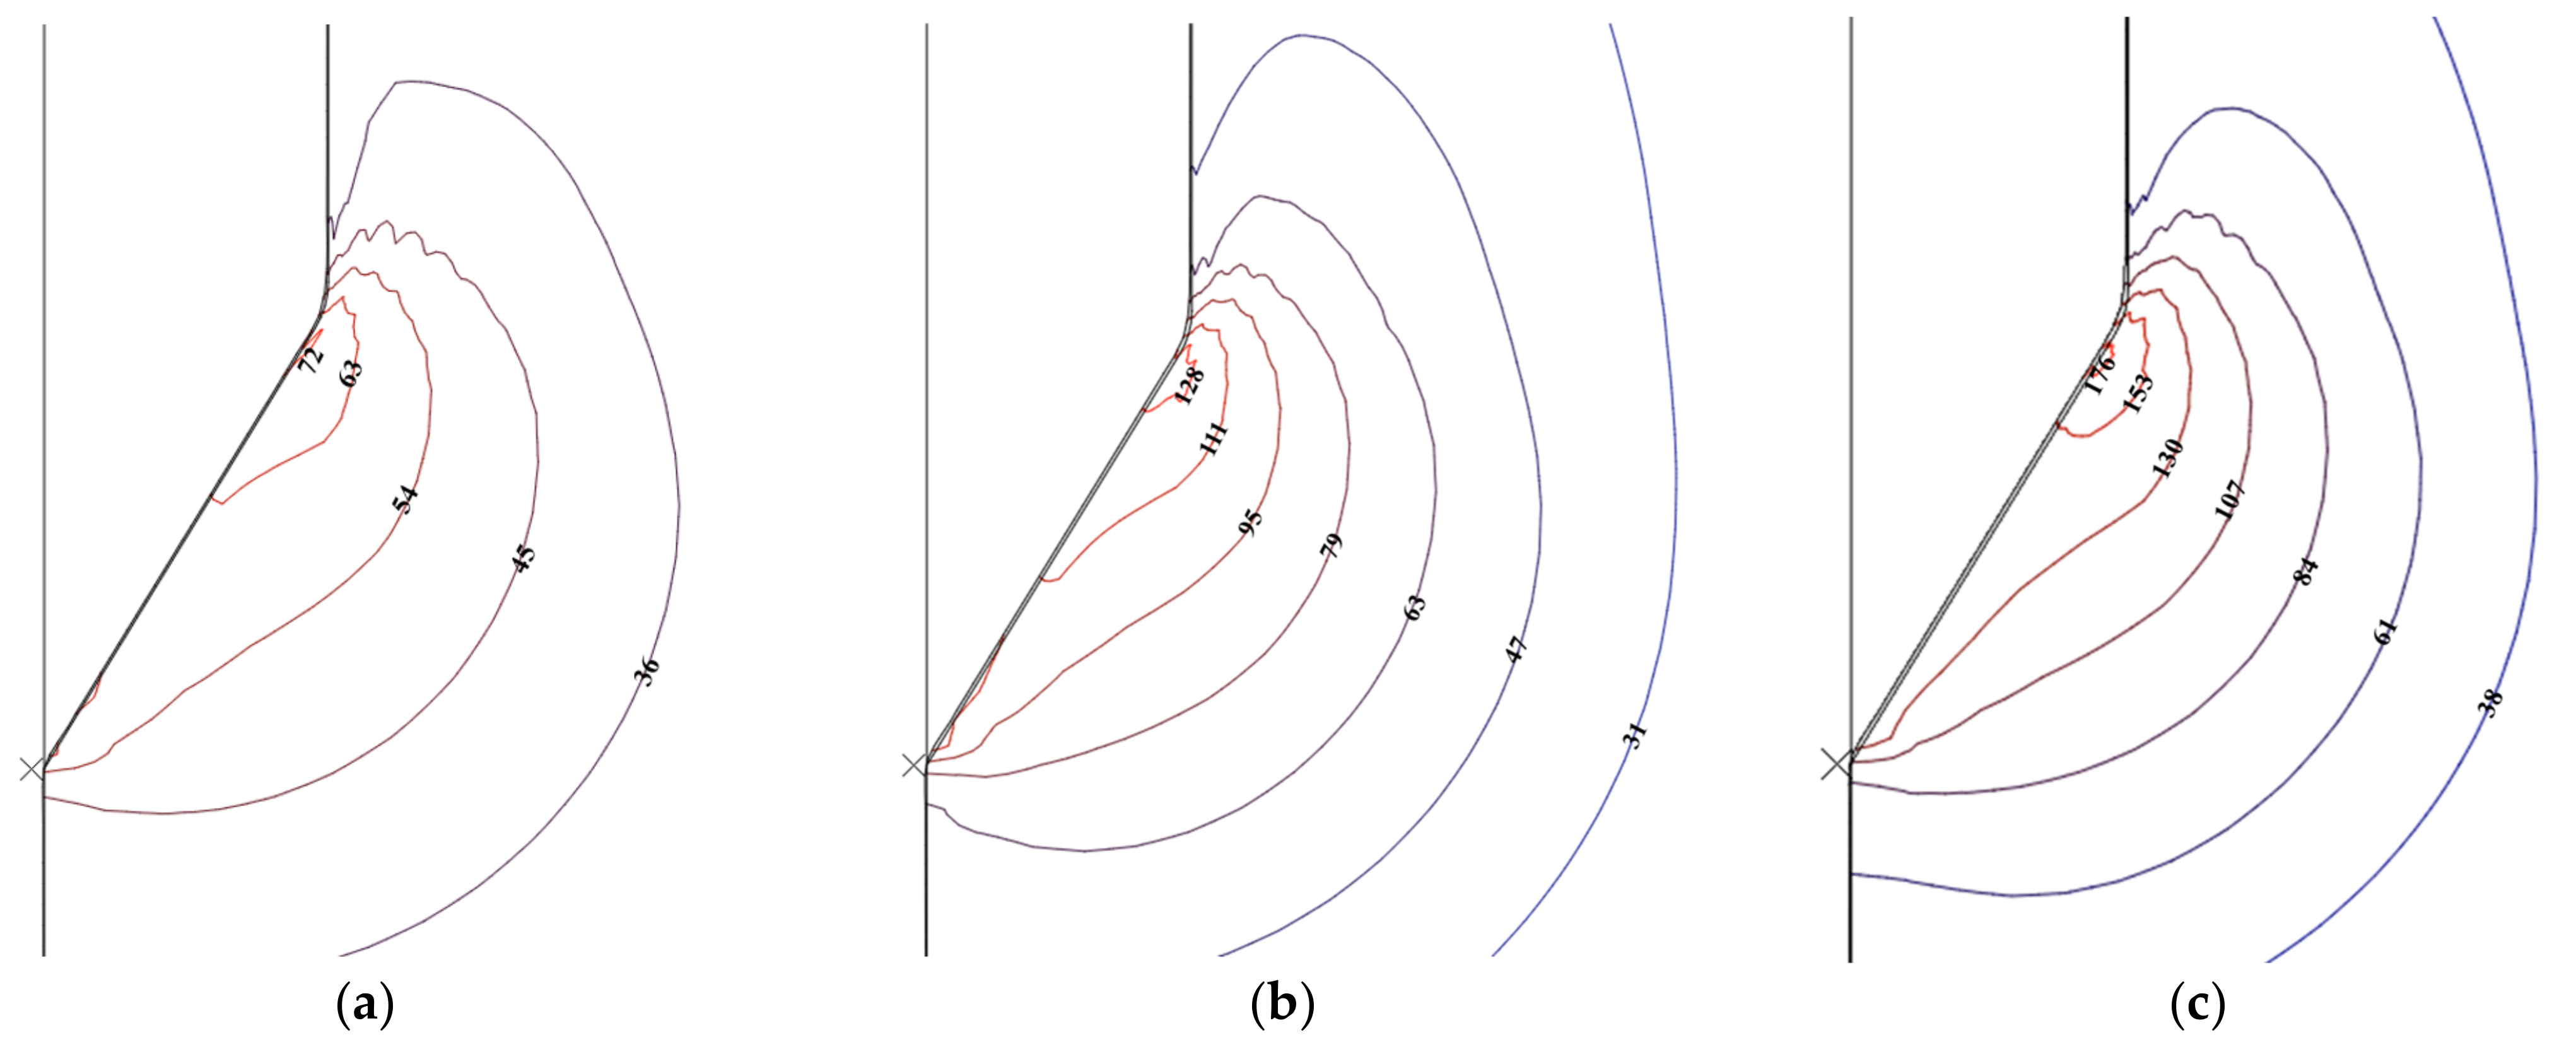
The computed excess pore pressure Δu contours after penetration and before dissipation for different OCRs at σv = 30 kPa in kaolin silty clays are shown in Figure 6. The excess pore pressure Δu contours of the Yellow River Delta silty clay was almost the same. The size of the pore pressure influence zone changed little. However, the gradient of the pore pressure increased with the increase in OCR. The pore pressure along the radial direction at the cone shoulder (u2) increased before it decreased. As the OCR increased, the changes became more dramatic.
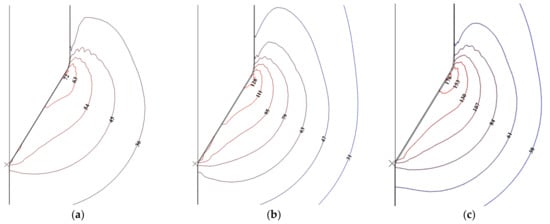
Figure 6.
Computed Δu contours after penetration under different OCR at σv = 30 kPa in kaolin silty clays. (a) OCR = 1; (b) OCR = 3; (c) OCR = 5.
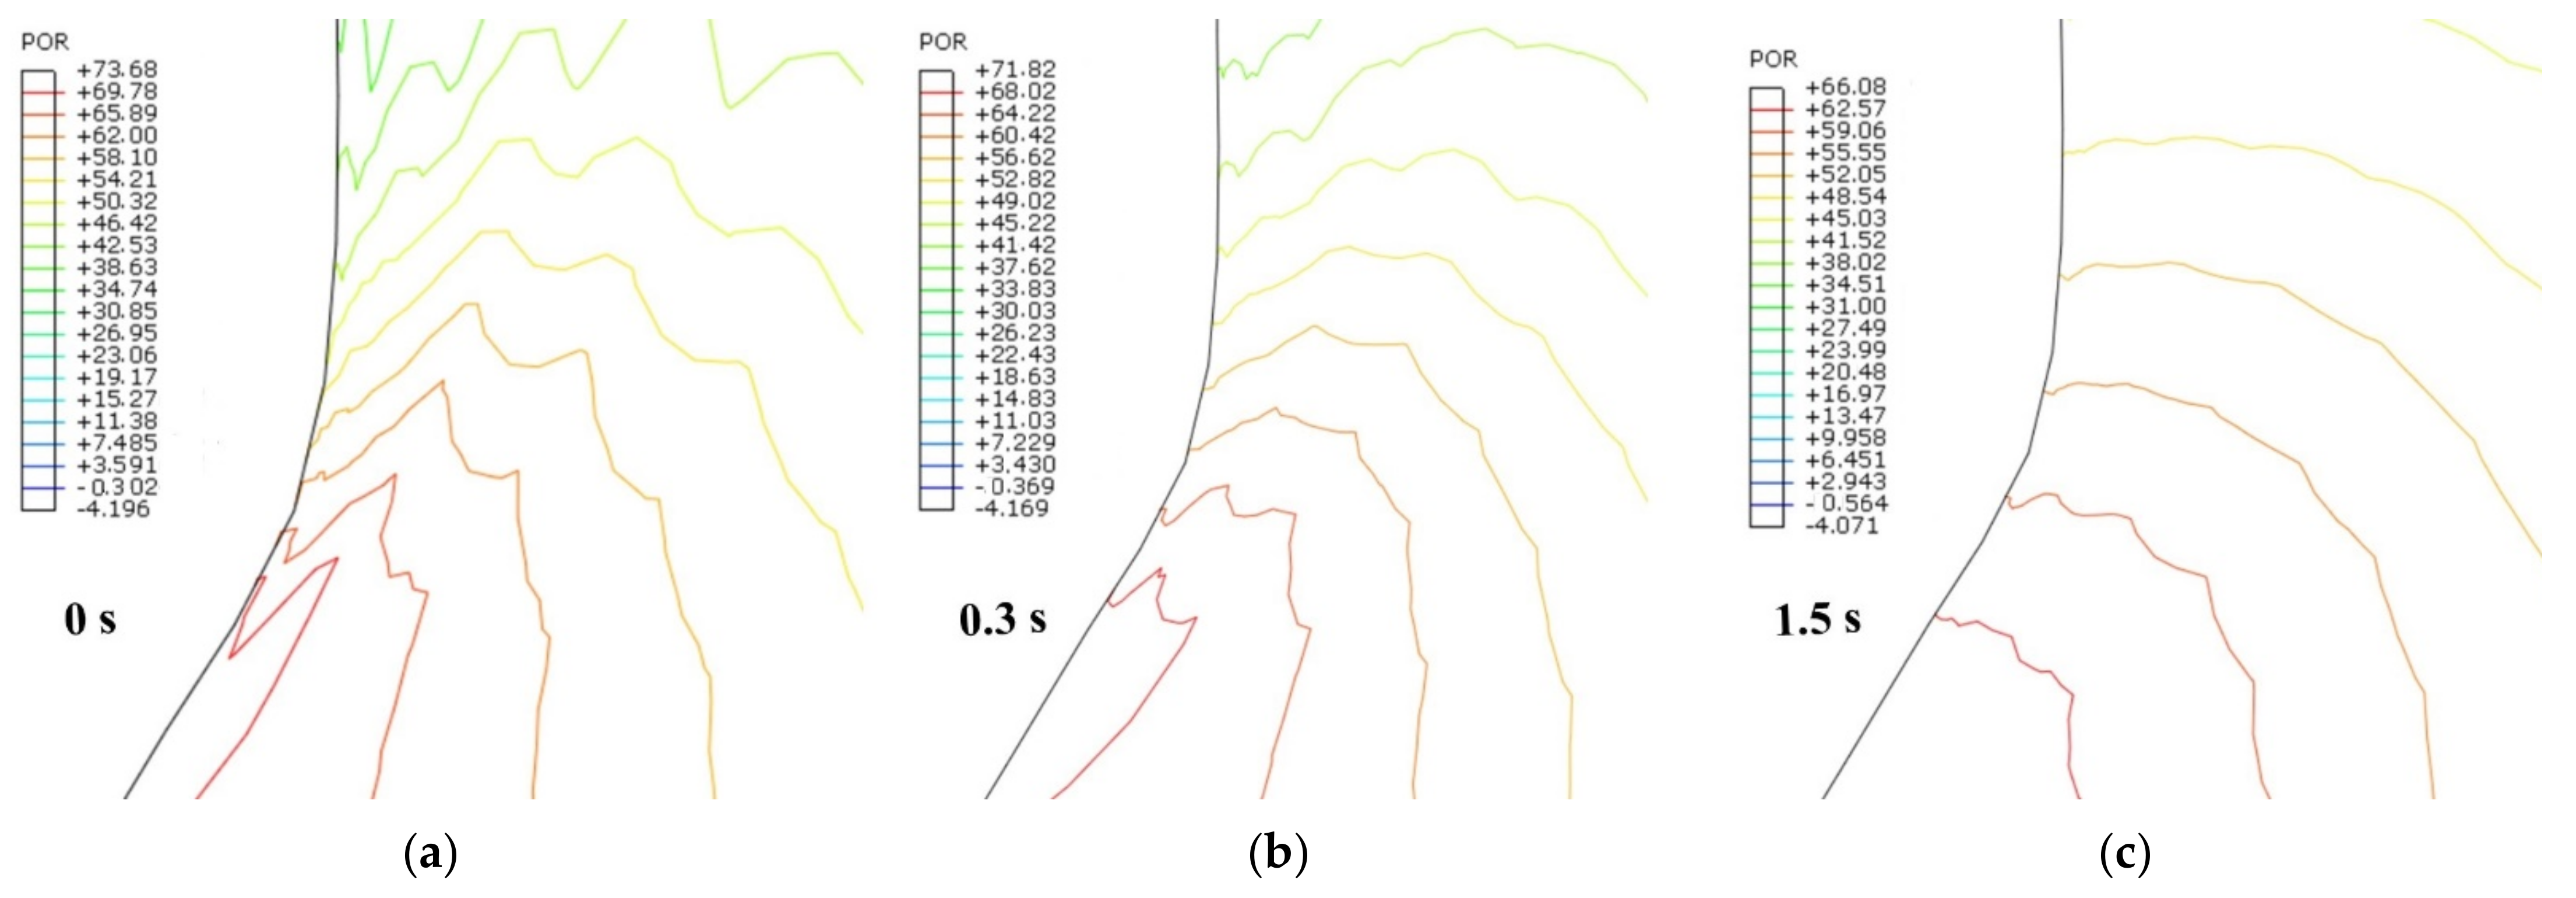
By comparing the Δu contours in Figure 7, it apparent that the variation range of the pore pressure in the horizontal direction is higher than that in the vertical direction. This observation suggests that the soil’s anisotropic behavior, i.e., the difference in its mechanical properties and behavior in different directions, is likely to be a factor in the pore pressure distribution. The dissipation of excess pore pressure in soil during consolidation can occur in different ways depending on the soil properties, boundary conditions, and loading conditions. One factor that affects the dissipation of excess pore pressure is soil properties. The type and characteristics of the soil, such as its permeability, compressibility, and particle size distribution, can influence the rate and mechanism of pore pressure dissipation. At the cone shoulder position (u2), the dissipation of the excess pore pressure was horizontal radial diffusion, corresponding to the problem of axisymmetric consolidation as per Equation (20), and the distribution of the initial pore pressure field affected the solution of Equation (20), so the shape of dissipation curve changed.
where
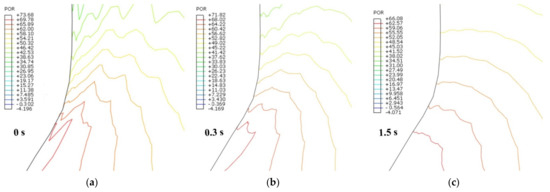
Figure 7.
Δu contours after dissipation for 0 s, 0.3 s and 1.5 s in kaolin silty clays. (a) t = 0 s; (b) t = 0.3 s; (c) t = 1.5 s.
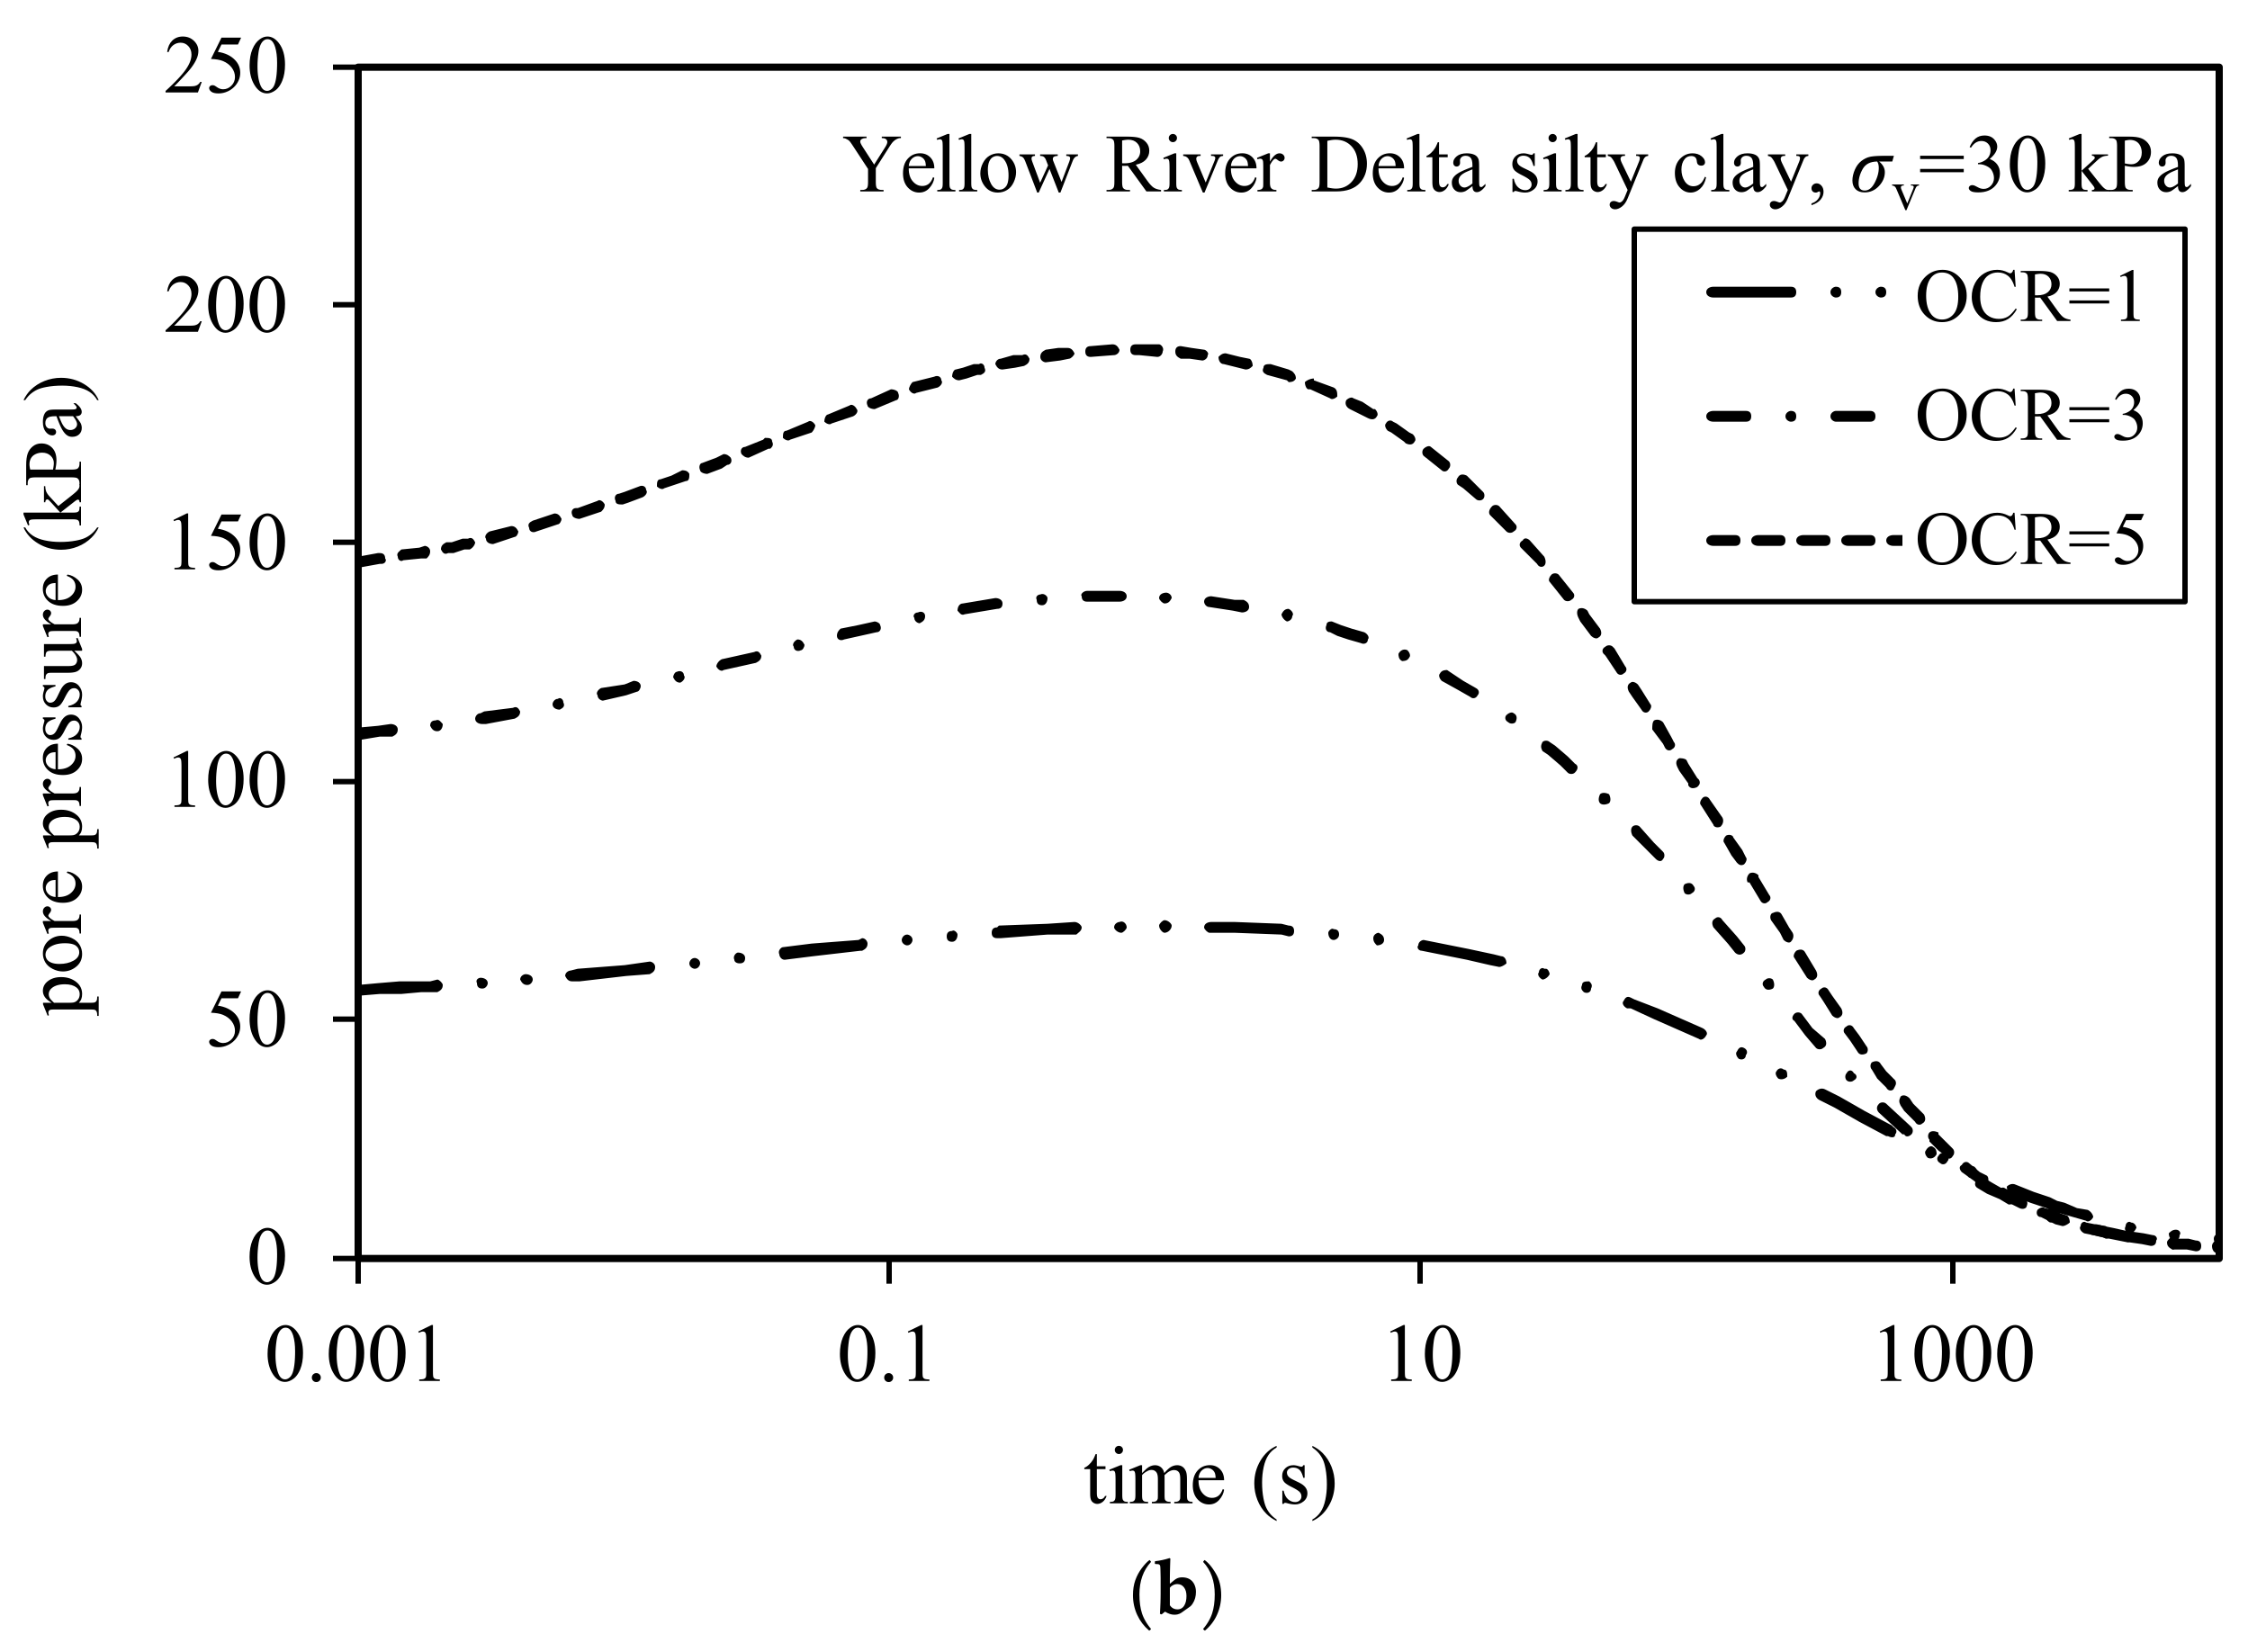
4.2. Effect of OCR on Pore Pressure Dissipation Curve
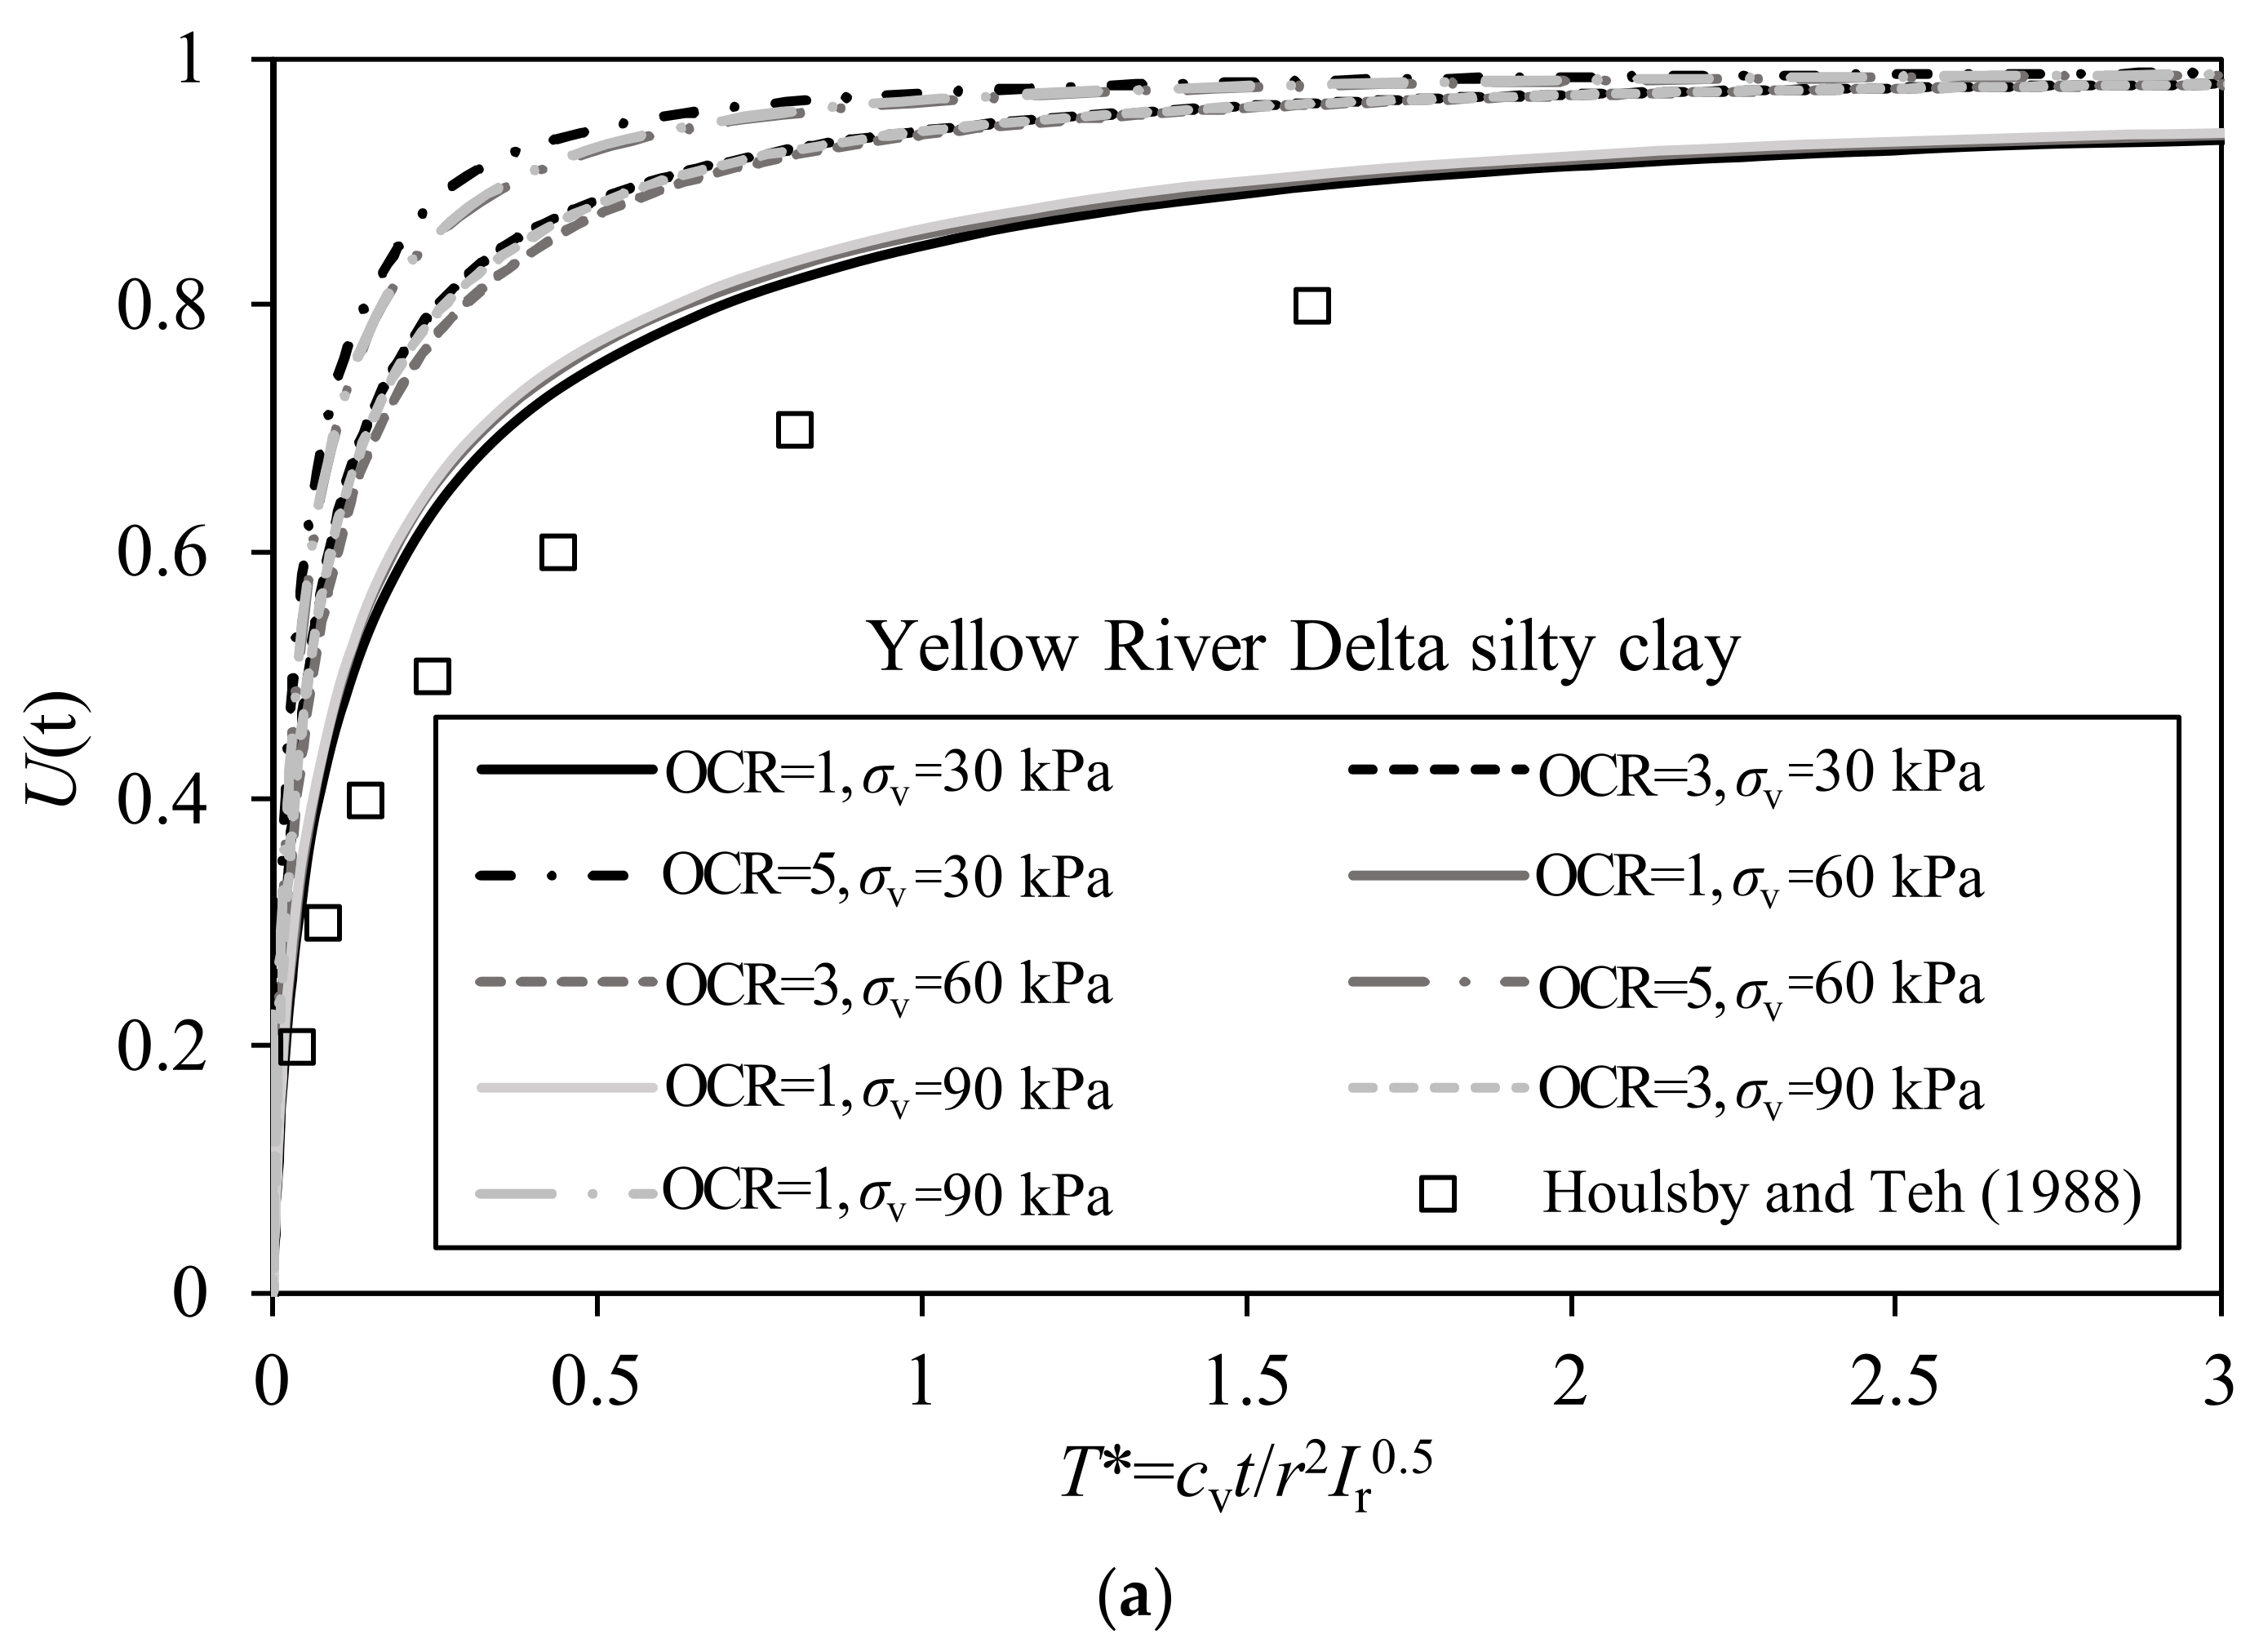
The pore pressure dissipation curve with OCR = 1, 3 and 5 at σv = 30 kPa is shown in Figure 8. It shows that a higher OCR leads to a faster normalized dissipation response, and the same trend was observed at σv = 60 kPa and σv = 90 kPa. Houlsby and Teh [20] suggested the use of T* instead of T and gave the corresponding T* for the cone shoulder position under different consolidation degrees. The consolidation degree and T* are defined as:
where ui is the initial pore pressure; ut is the pore pressure over time; u0 is the hydrostatic pressure; ut = u0 and U(t) = 1 when the dissipation is complete; and ch = cv when the soil is isotropic. However, the stress is anisotropic in this paper. Mahmoodzadeh et al. [21] gave the relationship between ch and cv under stress anisotropy, and the expression of ch, which can also be expressed as
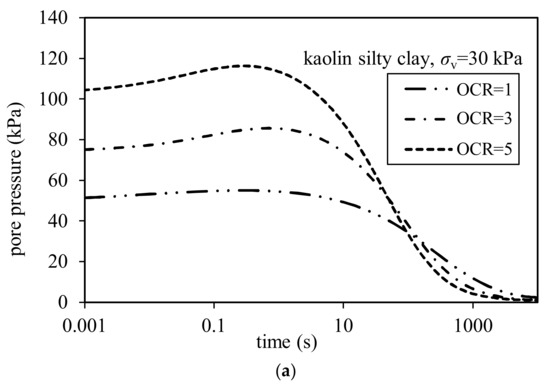

Figure 8.
Pore pressure dissipation curve under different OCR at σv = 30 kPa. (a) Kaolin silty clay; (b) Yellow River Delta silty clay.
Λ is the same as mentioned above, and α is a weighting factor defining the contribution of elastic and plastic behavior with a default value of 0.5. The soil is in a one-dimensional consolidation stress state and on the κ line, so cv can also be used to normalize:
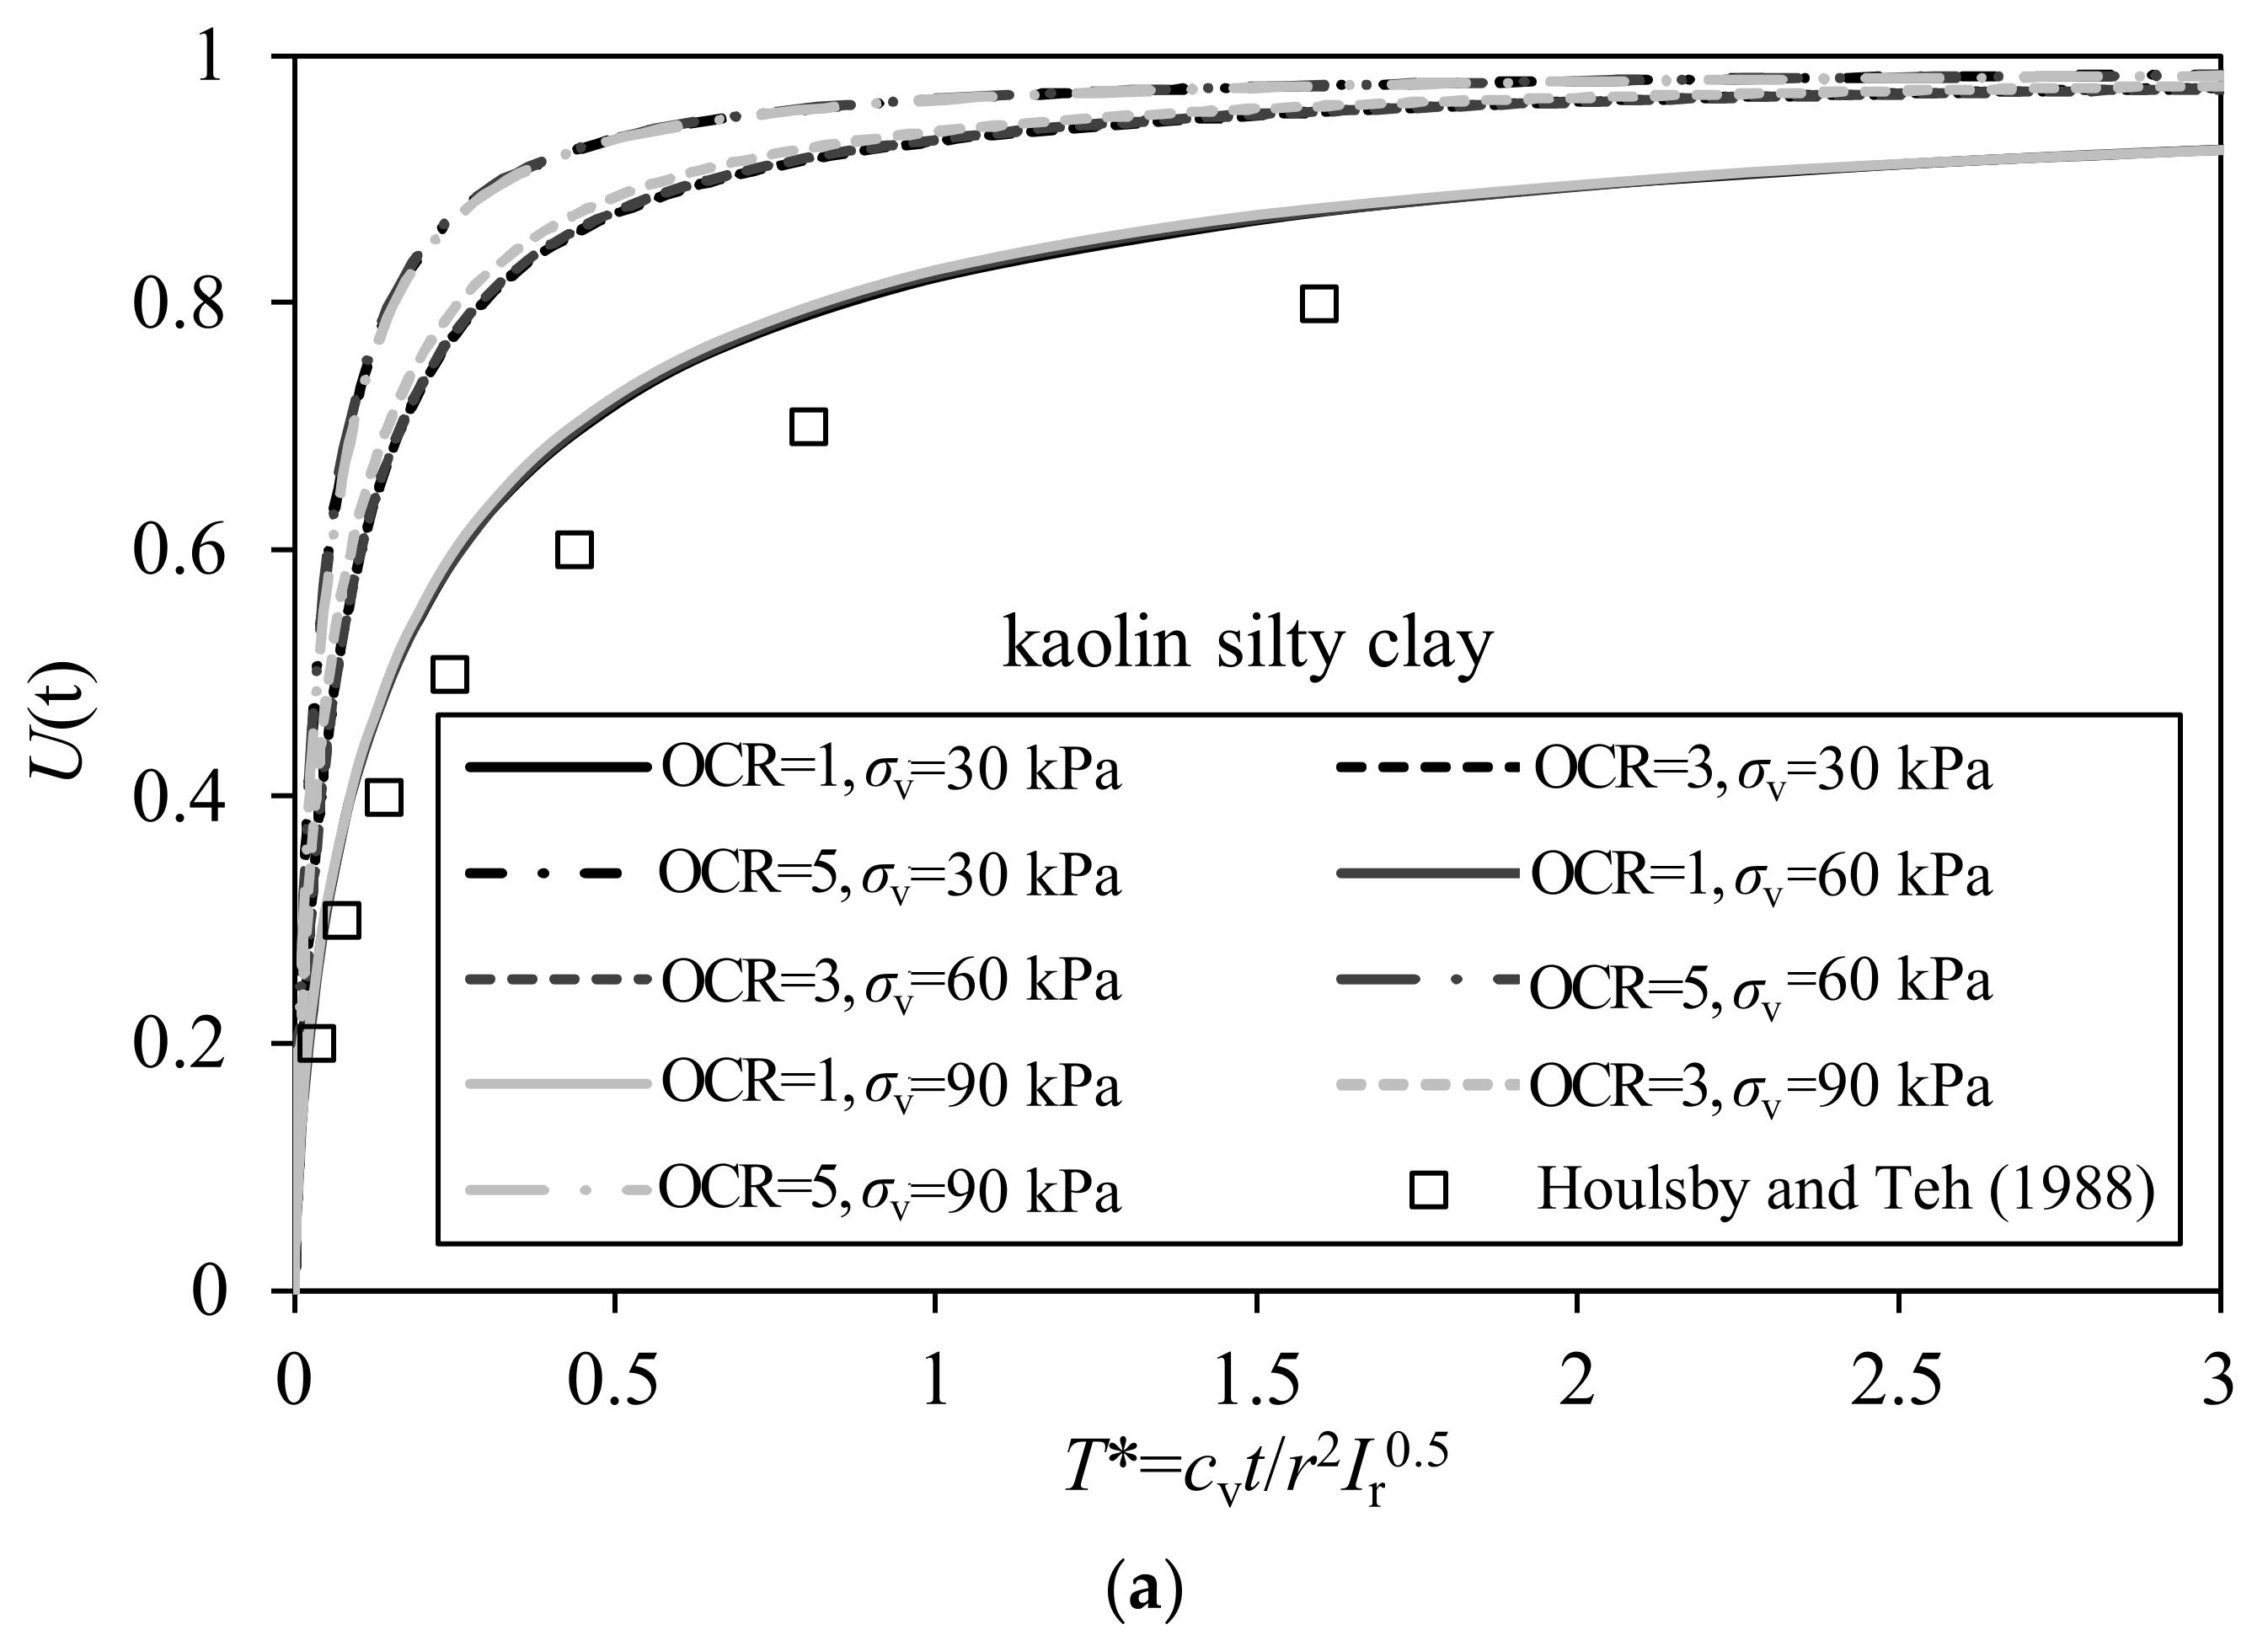
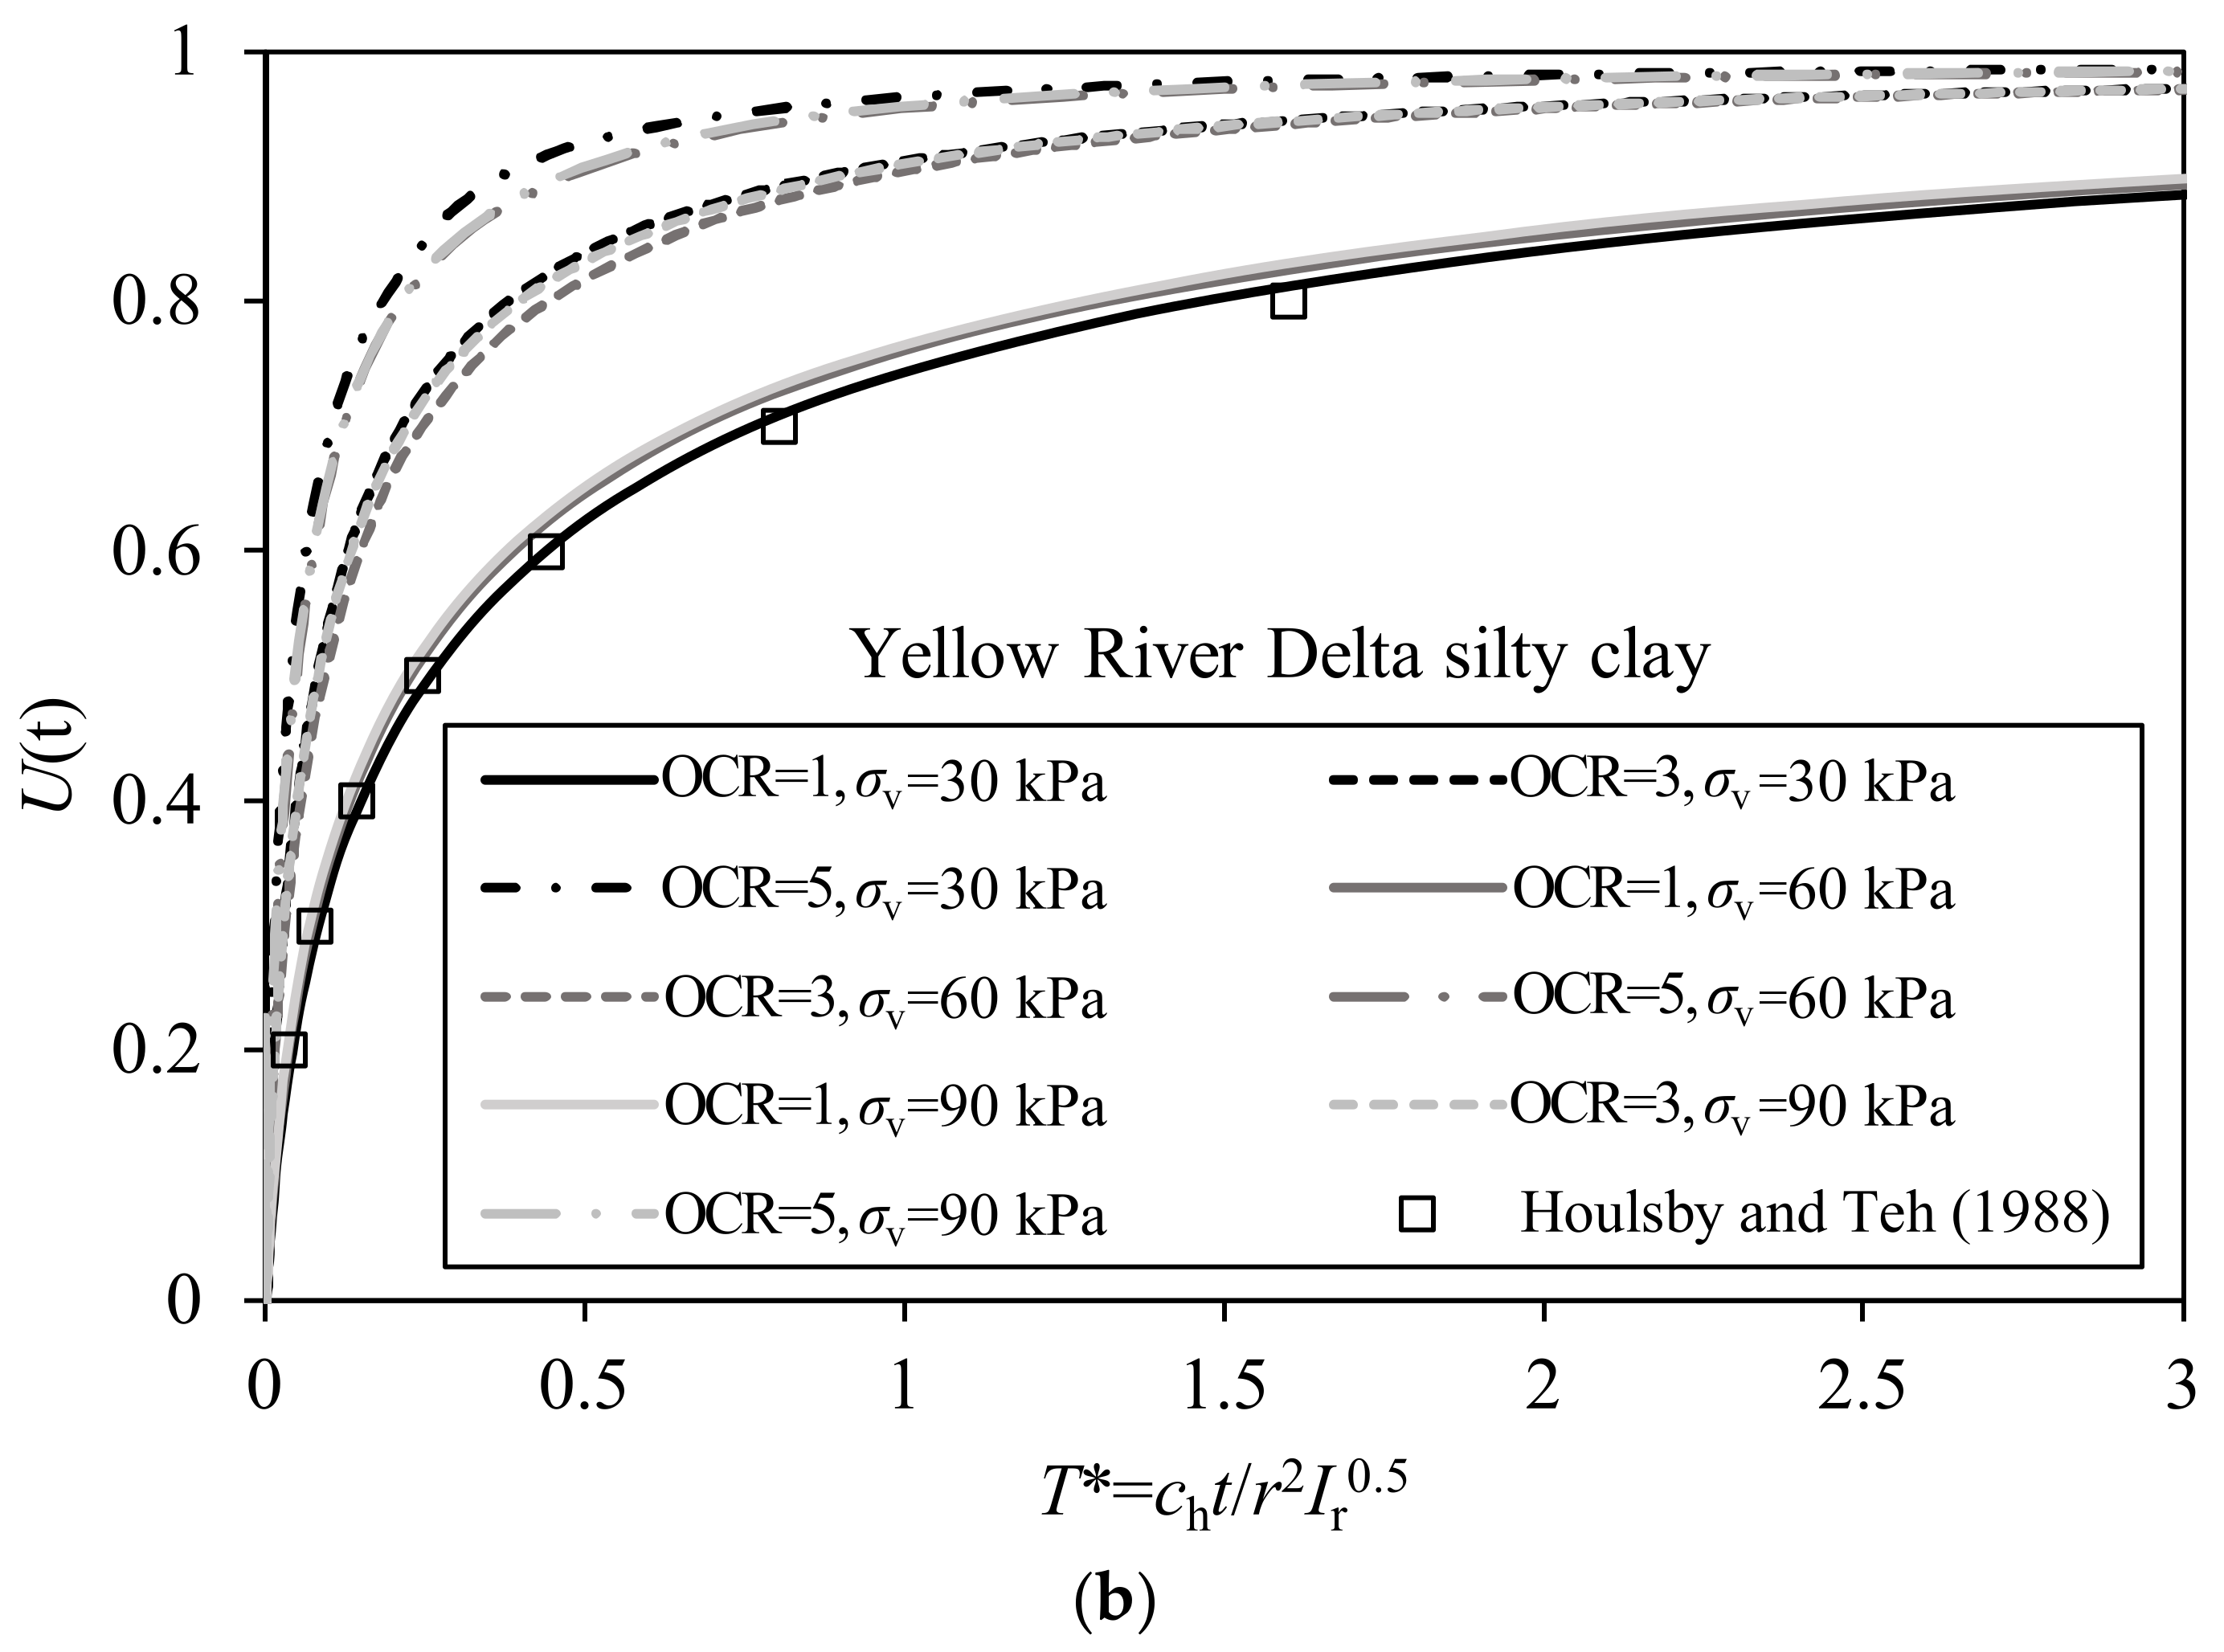
The initial pore pressure distribution in over-consolidated soil has a crucial role in determining the behavior of pore pressure around the cone tip during cone penetration tests. As a result of this initial pore pressure distribution, it has been observed that the pore pressure at the cone shoulder initially increases before it decreases during penetration. The maximum pore pressure was adopted to replace the initial pore pressure. The consolidation degree normalized time curve is shown in Figure 9 and Figure 10 with different normalization methods. Due to the influence of stress anisotropy, the curve normalized by ch was different from that of Houlsby and Teh’s [20] results. Under normal consolidation conditions (OCR = 1), the relationship between the consolidation degree and T* normalized with ch was the same as Houlsby and Teh’s [20] method.
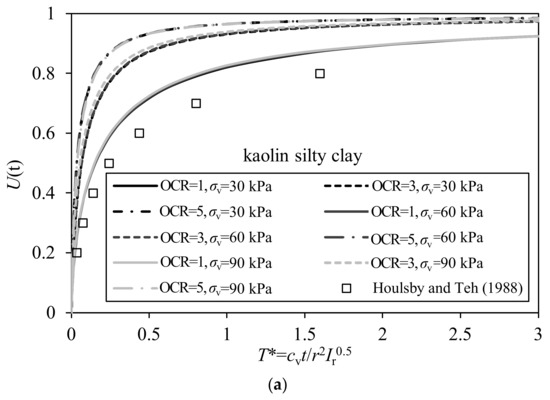
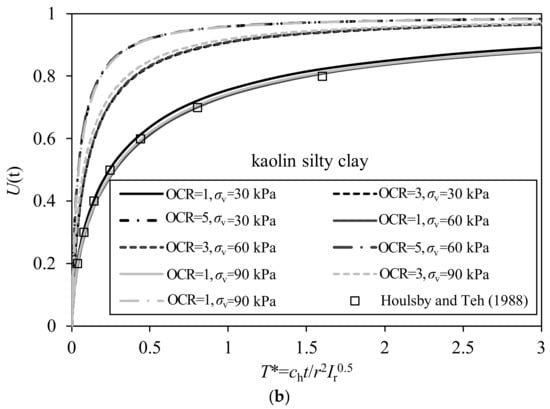
Figure 9.
The consolidation degree normalized time curve under different OCR in kaolin silty clay. (a) T* normalized with cv; (b) T* normalized with ch [20].
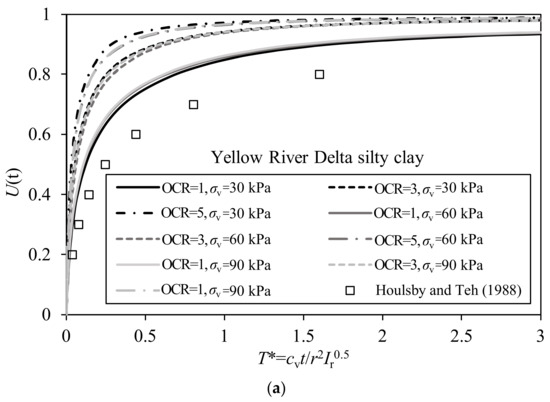

Figure 10.
The consolidation degree normalized time curve under different OCR in Yellow River Delta silty clay. (a) T* normalized with cv; (b) T* normalized with ch [20].
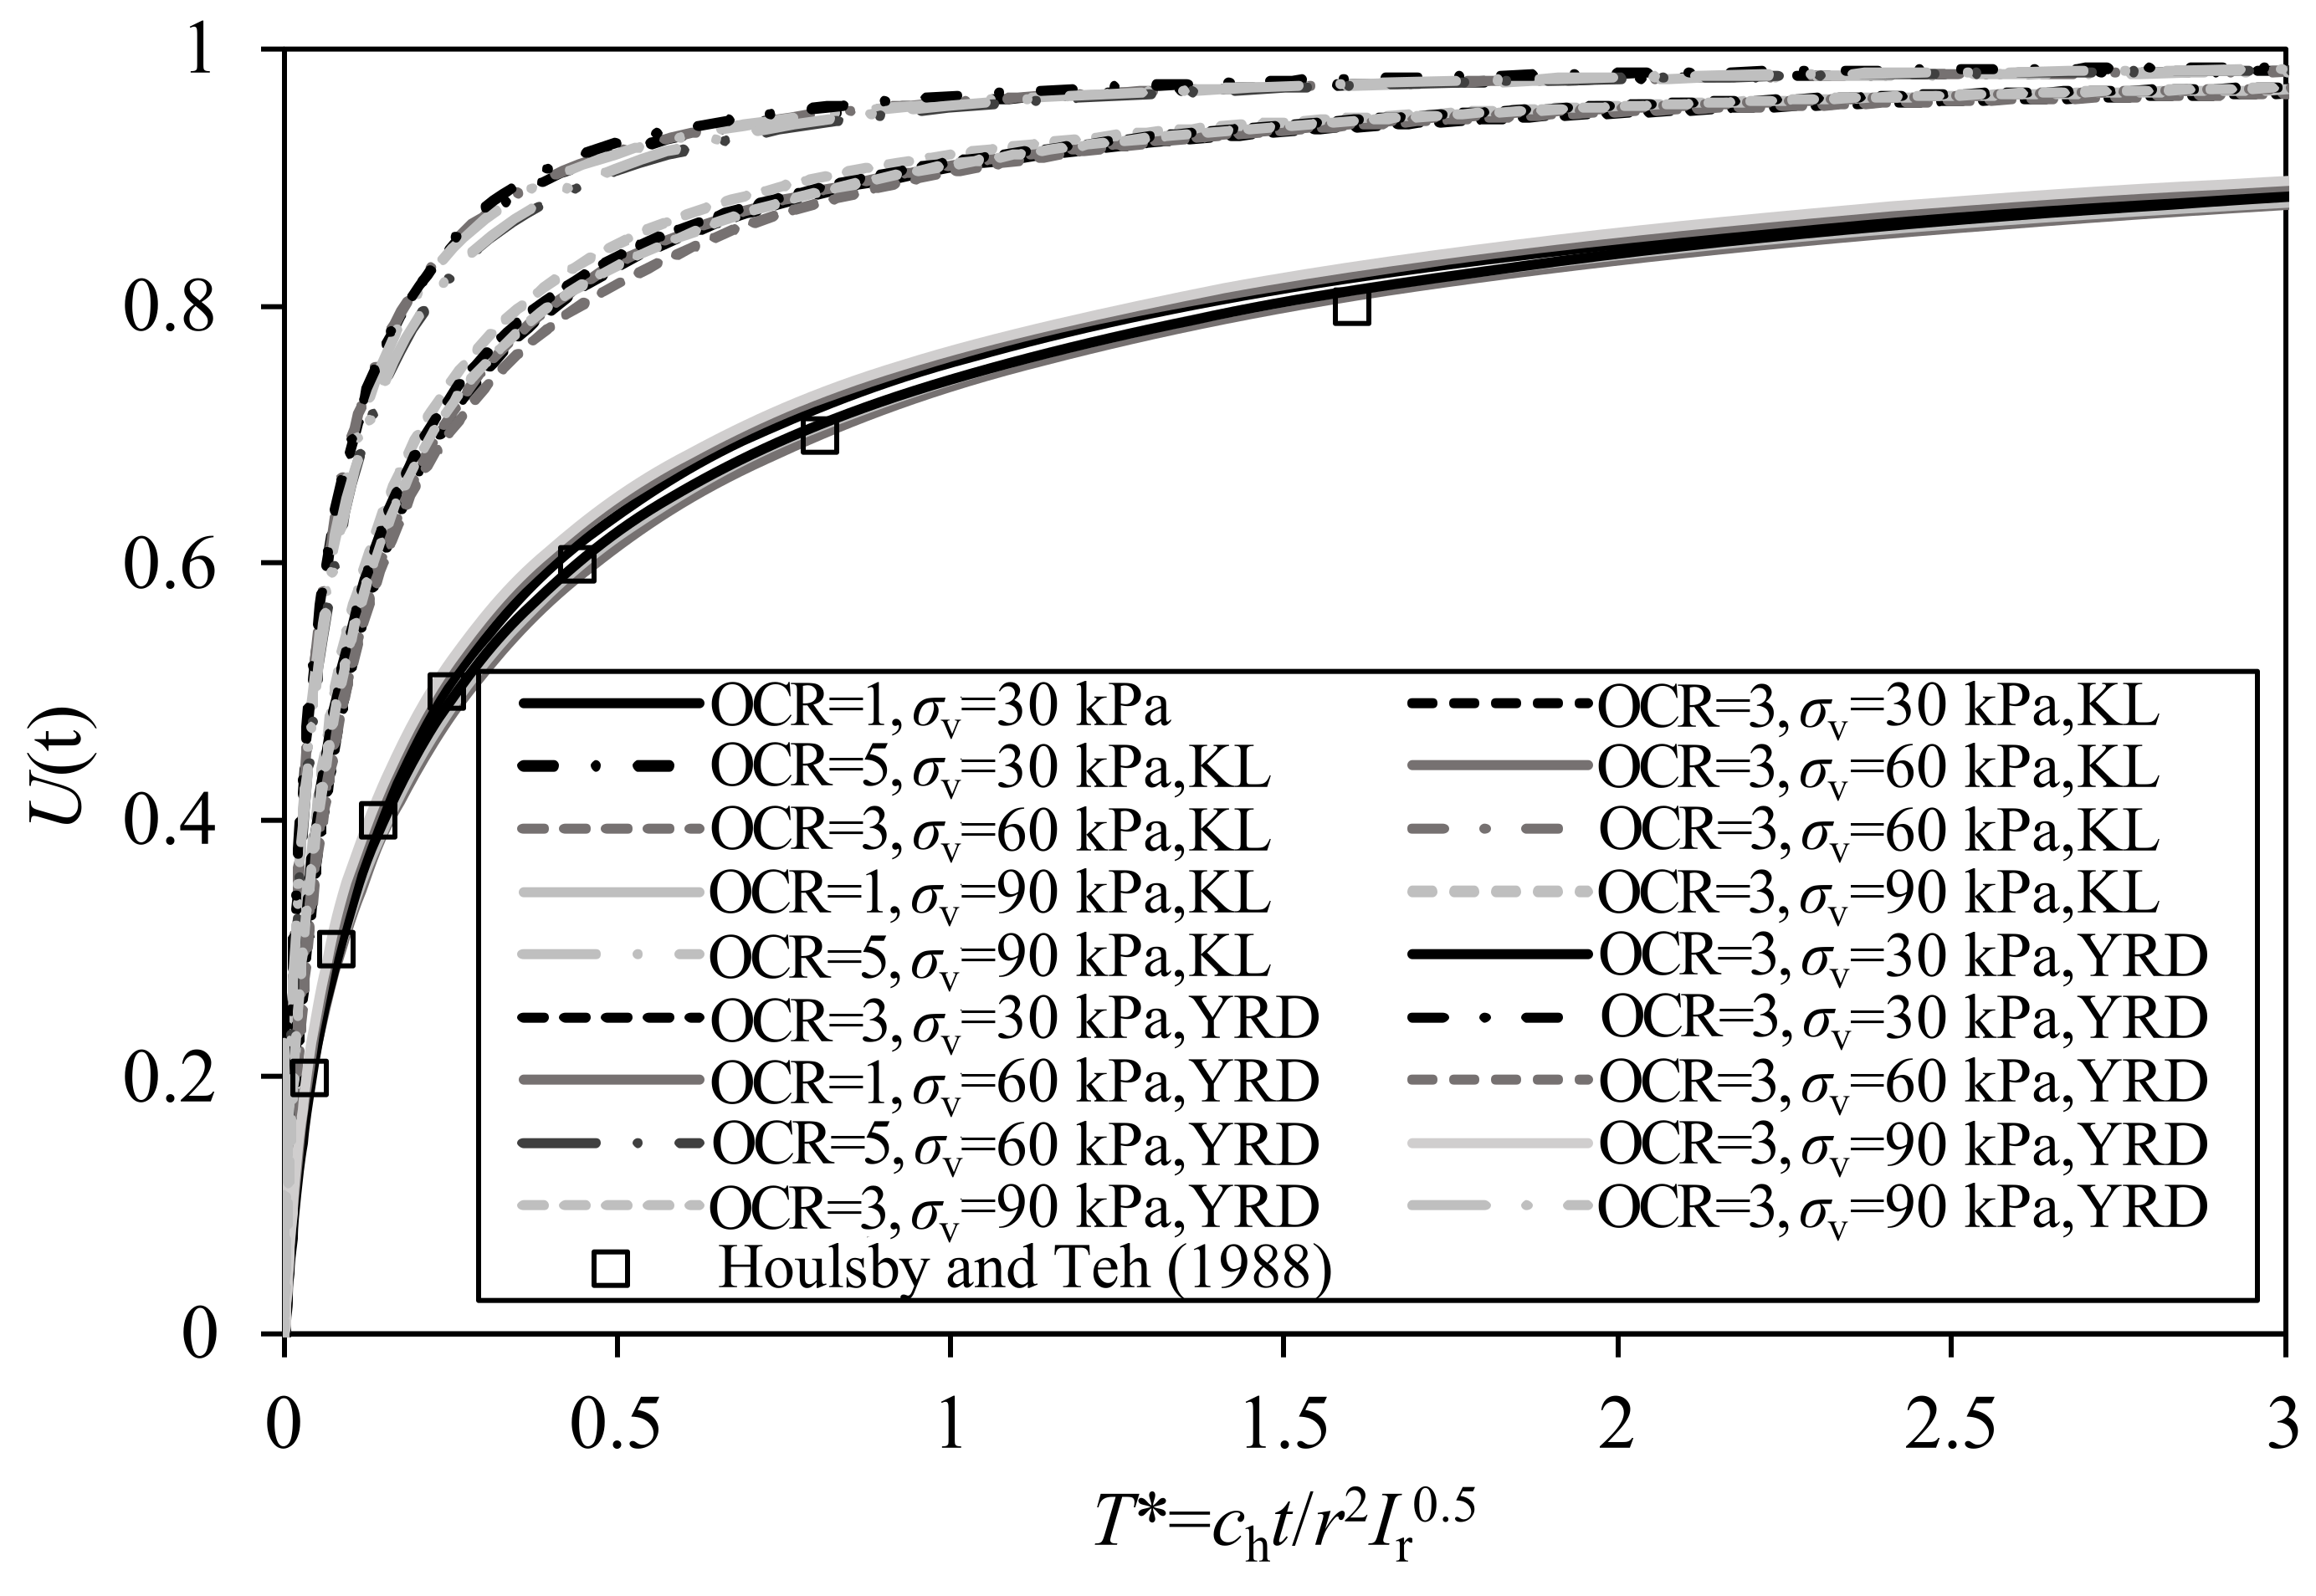
Figure 9 and Figure 10 illustrate that the optical character recognition (OCR) process has had an impact on the calculated value of T*. The results depicted in these two figures suggest that the accuracy of the OCR system may be a critical factor in determining the validity and reliability of T* measurements. It is evident from the figures that the use of OCR technology can lead to errors in the calculated T* values, which can ultimately affect the interpretation and usefulness of the data obtained from this analysis. Therefore, it is essential to evaluate the accuracy and reliability of OCR systems used in T* measurements to ensure the validity of the results obtained. Figure 11 shows the results of ch normalization for kaolin silty clay and Yellow River Delta silty clay. In the site investigation, the pore pressure at the cone shoulder was generally tested, and the recommended value of T* is given in Table 2. As OCR varies, T* undergoes significant changes. When OCR = 1, values match the theoretical solutions proposed by Houlsby and Teh’s [20]. The OCR can be evaluated using penetration resistance, and then the value of T* can be obtained according to the OCR. The horizontal consolidation coefficient ch can be obtained through Equation (24).
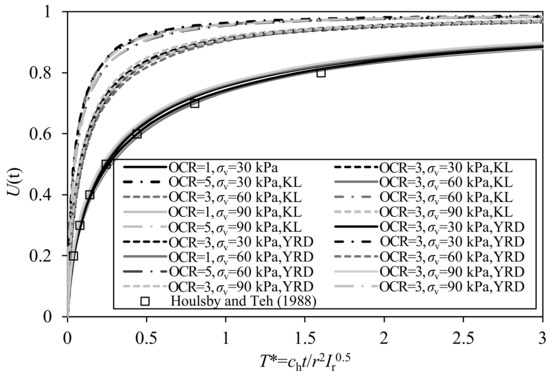
Figure 11.
The consolidation degree normalized time curve under different OCR [20].
Table 2.
Recommended T* values under different OCR at cone shoulder (u2) position.
5. Summary and Conclusions
The present study employed coupled-consolidation analyses with Abaqus to investigate the influence of the over-consolidation ratio on the pore pressure dissipation and penetration behavior of piezocone tests in typical silty soils. Following the parametric study presented above, it is helpful to evaluate the effect of OCR on penetration resistance and pore pressure dissipation test data and establish the OCR and ch calculation formula.
The over-consolidation ratio (OCR) had a significant influence on qc, but almost zero influence on the cone resistance factor Nc. The main reason is that the stress around the cone tip exceeded the preconsolidation pressure, so qc mainly depended on the undrained shear strength of over-consolidated clay, which is related to the preconsolidation pressure. However, Nc mainly depended on plastic zone size and the soil rigidity index outside the plastic zone. Based on the above analysis, the OCR can be estimated by comparing the undrained shear strength of the over-consolidated soil with normally consolidated soil under current stress. The semitheoretical–empirical estimation formula of the OCR in silty clay is given as Equation (19).
The over-consolidation ratio (OCR) influenced the initial pore pressure field, which caused the pore pressure at the cone shoulder to first increase before it decreased in the over-consolidated soil. A higher OCR led to a faster normalized dissipation response and the relation of the consolidation degree and T*. Based on the FE results, the recommended T* values under different OCRs are given as shown in Table 2, and Equation (23) can be used to calculate cv.
Author Contributions
S.D. Project administration, Resources; Y.Z. Writing—original draft, Formal analysis, Investigation, J.H. Software, Visualization; K.W. Visualization; Z.T. Writing-review & editing; T.L. Resources, Project administration. All authors have read and agreed to the published version of the manuscript.
Funding
Natural Science Foundation of China (42207172, U2006213); China Postdoctoral Science Foundation (2022M712989).
Institutional Review Board Statement
Not applicable.
Informed Consent Statement
Written informed consent has been obtained from the patient(s) to publish this paper.
Acknowledgments
This study was supported by the Natural Science Foundation of China (42207172, U2006213), China Postdoctoral Science Foundation (2022M712989), Postdoctoral Applied Research Project of Qingdao and Postdoctoral Innovation Project of Shandong Province.
Conflicts of Interest
The authors declare no conflict of interest.
References
- Feng, X.L.; Lin, L.; Zhuang, Z.Y.; Pan, S. The relationship between geotechnical parameters and sedimentary environment of soil layers since holocene in modern Huanghe subaqueous delta. Coast. Eng. 1999, 18, 1–7. [Google Scholar]
- Jia, Y.G.; Dong, H.G.; Shan, H.X.; Liu, X. Study of characters and formation mechanism of hard crust on tidal flat of Yellow River estuary. Rock Soil Mech. 2007, 28, 2029–2035. [Google Scholar]
- Zhang, Y.; Feng, X.; Ding, C.; Liu, Y.; Liu, T. Study of cone penetration rate effects in the Yellow River delta silty soils with different clay contents and state parameters. Ocean Eng. 2022, 250, 110982. [Google Scholar] [CrossRef]
- Fei, X.U.; Wang, W.M.; Zhang, Q.Q. Monitoring analysis of super large and deep foundation pit in alluvial plain of Yellow River. Chin. J. Geotech. Eng. 2014, 36, 471–478. [Google Scholar]
- ASTM D5778-07; Standard Test Method for Electronic Friction Cone and Piezocone Penetration Testing of Soils. ASTM International: West Conshohocken, PA, USA, 2007.
- Lu, Q.; Randolph, M.F.; Hu, Y.; Bugarski, I.C. A numerical study of cone penetration in clay. Geotechnique 2004, 54, 257–267. [Google Scholar] [CrossRef]
- Bemben, S.M.; Myers, H.J. The influence of rate of penetration on static cone resistance in Connecticut River Valley varved clay. In Proceedings of the European Symposium on Penetration Testing, Stockholm, Sweden, 5–7 June 1974; Volume 2, pp. 33–34. [Google Scholar]
- Senneset, K.; Sandven, R.; Janbu, N. Interpretation of piezocone tests in cohesive soils. In Proceedings of the International Symposium on Penetration Testing, Orlando, FL, USA, 20–24 March 1988; pp. 939–953. [Google Scholar]
- Leroueil, S.; Demers, D.; La Rochelle, P.; Martel, G.; Virely, D. Practical use of the piezocone in eastern Canada clays. In Proceedings of the International Symposium on Cone Penetration Testing, Linkoping, Sweden, 4–5 October 1995; Volume 2, pp. 515–521. [Google Scholar]
- Na, Y.M.; Choa, V.; Teh, C.I.; Chang, M.F. Geotechnical parameters of reclaimed sandfill from the cone penetration test. Can. Geotech. J. 2005, 42, 91–109. [Google Scholar] [CrossRef]
- Schneider, J.A.; Randolph, M.F.; Mayne, P.W.; Ramsey, N.R. Analysis of factors influencing soil classification using normalized piezocone tip resistance and pore pressure parameters. J. Geotech. Geoenviron. Eng. 2008, 134, 1569–1586. [Google Scholar] [CrossRef]
- Song, C.; Bekele, B.; Silvey, A. Pore Pressure Responses of Overconsolidated Soils in a Partially Drained Piezocone Penetration Test. J. Eng. Mech. 2019, 145, 04019017. [Google Scholar] [CrossRef]
- Silva, M.F.; White, D.J.; Bolton, M.D. An analytical study of the effect of penetration rate on piezocone tests in clay. Int. J. Numer. Anal. Methods Geomech. 2010, 30, 501–527. [Google Scholar] [CrossRef]
- Sully, J.P.; Robertson, P.K.; Campanella, R.G.; Woeller, D.J. An approach to evaluation of field CPTu dissipation data in overconsolidated fine-grained soils. Can. Geotech. J. 1999, 36, 369–381. [Google Scholar] [CrossRef]
- Jia, Y.G.; Shan, H.X.; Yang, X.J.; Meng, X.M.; Chang, F.Q.; Zheng, J.W. Sediment Dynamics and Geologic Hazards in the Estuary of Yellow River, China; Science Press: Beijing, China, 2011. [Google Scholar]
- Zheng, G.; Yan, Z.-X.; Lei, H.-Y.; Wang, S.-T. Experimental studies on unloading deformation properties of silty clay of first marine layer in Tianjin urban area. Rock Soil Mech. 2008, 29, 1237–1242. [Google Scholar]
- Mayne, P.W. Determination of OCR in clays by piezocone tests using cavity expansion and critical state concepts. Soils Found. 1991, 31, 65–76. [Google Scholar] [CrossRef] [PubMed]
- Lunne, T.; Robertson, P.K.; Powell, J.J. Cone-Penetration Testing in Geotechnical Practice; Spon Press: London, UK, 2001. [Google Scholar]
- Torstensson, B.A. Pore Pressure Sounding Instrument. In Proceedings of the ASCE Specialty Conference on In-Situ Measurement of Soil Properties ISMOSP, Raleigh, NC, USA, 1–4 June 1975; pp. 48–54. [Google Scholar]
- Houlsby, G.T.; Teh, C.I. Analysis of the Piezocone in Clay. In Proceedings of the International Symposium on Penetration Testing, Orlando, FL, USA, 20–24 March 1988; pp. 777–783. [Google Scholar]
- Mahmoodzadeh, H.; Randolph, M.F.; Wang, D. Numerical simulation of piezocone dissipation test in clays. Geotechnique 2014, 64, 657–666. [Google Scholar] [CrossRef]
- Chai, J.; Sheng, D.; Carter, J.P.; Zhu, H. Coefficient of consolidation from non-standard piezocone dissipation curves. Comput. Geotech. 2012, 41, 13–22. [Google Scholar] [CrossRef]
- Yi, J.T.; Goh, S.; Lee, F. A numerical study of cone penetration in fine-grained soils allowing for consolidation effects. Géotechnique 2012, 62, 707–719. [Google Scholar] [CrossRef]
- Dassault Systemes Simulia Corp. Abaqus Analysis User’s Manual Version 6.14; Dassault Systèmes Simulia Corp: Providence, RI, USA, 2014. [Google Scholar]
- Goh, T.L. Stabilization of an Excavation by an Embedded Improved Soil Layer. Ph.D. Thesis, National University of Singapore, Singapore, 2003. [Google Scholar]
- Purwana, O.A. Centrifuge Model Study on Spudcan Extraction in Soft Clay; University of Western Australia: Crawley, Australia, 2007. [Google Scholar]
- House, A.R.; Oliveira, J.R.M.S.; Randolph, M.F. Evaluating the coefficient of consolidation using penetration tests. Int. J. Phys. Model. Geotech. 2001, 1, 17–25. [Google Scholar] [CrossRef]
- Kim, K.; Prezzi, M.; Salgado, R.; Lee, W. Effect of penetration rate on cone penetration resistance in saturated clayey soils. J. Geotech. Geoenviron. Eng. 2008, 134, 1142–1153. [Google Scholar] [CrossRef]
- Wood, D. Soil Behaviour and Critical State Soil Mechanics; University Press: Cambridge, UK, 1990. [Google Scholar]


Disclaimer/Publisher’s Note: The statements, opinions and data contained in all publications are solely those of the individual author(s) and contributor(s) and not of MDPI and/or the editor(s). MDPI and/or the editor(s) disclaim responsibility for any injury to people or property resulting from any ideas, methods, instructions or products referred to in the content. |
© 2023 by the authors. Licensee MDPI, Basel, Switzerland. This article is an open access article distributed under the terms and conditions of the Creative Commons Attribution (CC BY) license (https://creativecommons.org/licenses/by/4.0/).