Abstract
Contrary to expectations that the coronavirus pandemic would terminate quickly, the number of people infected with the virus did not decrease worldwide and coronavirus-related deaths continue to occur every day. The standard COVID-19 diagnostic test technique used today, PCR testing, requires professional staff and equipment, which is expensive and takes a long time to produce test results. In this paper, we propose a feature set consisting of four features: MFCC, Δ2-MFCC, Δ-MFCC, and spectral contrast as a feature set optimized for the diagnosis of COVID-19, and apply it to a model that combines ResNet-50 and DNN. Crowdsourcing datasets from Cambridge, Coswara, and COUGHVID are used as the cough sound data for our study. Through direct listening and inspection of the dataset, audio recordings that contained only cough sounds were collected and used for training. The model was trained and tested using cough sound features extracted from crowdsourced cough data and had a sensitivity and specificity of 0.95 and 0.96, respectively.
1. Introduction
COVID-19 is an acute respiratory infection that develops from SARS-CoV-2, a new type of coronavirus that was first reported in November 2019. This is a pandemic that continues worldwide as of November 2022, with a cumulative number of confirmed cases of 640 million and fatalities of 6.6 million. A characteristic of coronavirus is that it spreads swiftly and readily. Consequently, studies are being actively conducted on how to analyze how the coronavirus spreads and how to prevent its spread [1,2,3]. The omicron mutation, which has a low fatality rate but a very high transmission rate, has become the dominant variant. As the number of confirmed cases increases quickly, so do the numbers of severely sick patients and fatalities. Additionally, even though the fatality rate is low, an infection of COVID-19 may still be fatal for the elderly or those with underlying illnesses; thus, it is crucial to stop the spread of the disease by obtaining early diagnosis and treatment. The main route of infection is known to be droplets and respiratory secretions in the air produced by infected individuals.
The most frequently used diagnostic test for COVID-19 is real-time reverse transcription polymerase chain reaction (real-time RT-PCR), which is a technique for amplifying and identifying a particular coronavirus gene [4]. Because it has the greatest sensitivity and specificity and can detect even minute amounts of virus in a sample, this test method is used as a worldwide standard. Its drawbacks include the need for specialized tools, reagents, and skilled professionals, as well as the comparatively lengthy turnaround time of roughly 24 h for diagnostic outcomes.
Worldwide studies are being performed to find ways other than genetic testing to identify those who are COVID-19 positive. Chest X-ray or chest computed tomography (CT) images have been offered as the input for deep learning models [5,6]. In a study that used the fact that COVID-19 positive individuals have a specific volatile substance that is distinct from that of non-infected individuals, a COVID-19 detection scheme using the olfactory abilities of dogs was proposed [7]. Another study proposed using heart rate, sleep time, and activity data collected using wearable sensors to detect COVID-19 [8]. In a study that examined correlations with positive COVID-19, from findings using 42 characteristics that included fever, cough, chest CT, and body temperature, the characteristic that showed the strongest positive correlation was cough [9]. Based on this, this study investigates a method for identifying COVID-19-infected people using cough.
Many studies are being conducted to identify COVID-19 through cough sounds in order to allow low-cost and quick large-scale diagnostic testing [10,11,12,13,14,15,16,17,18,19,20,21,22,23]. Respiratory symptoms are one of the features of COVID-19 infection; hence, the data provided by the sound of coughing is used. A sound contains many features [24], and so does the sound of a cough. The deep learning model trained using these features can determine whether a cough sound is from a COVID-19-infected individual.
Looking at previous studies that used cough sounds, the amount of data is not large. Brown et al. [20] used only the Cambridge dataset [20], and Feng et al. [21] used Coswara [25] and Virufy [26] as datasets to study a COVID-19 diagnostic model. Fakhry et al. [22] used only the COUGHVID dataset [27]. In order to improve the stability and accuracy of the results, the quantity and quality of data are very important. Therefore, in this paper, all of the Cambridge, Coswara, and COUGHVID datasets were used, and a high-quality dataset was built through preprocessing.
In addition, when selecting a feature set in previous studies, the model was trained by combining several spectral-based features simply because it was a feature mainly used in speech. In this study, we propose a feature set optimized for COVID-19 diagnosis. By using the Bhattacharyya distance [28], which is a method of calculating the degree of separation between classes, a feature set was constructed by obtaining features that can discriminate well between the cough sounds of COVID-19-positive subjects and those of negative subjects. As a result, the feature set was composed of mel frequency cepstral coefficients (MFCC), Δ2-MFCC, Δ-MFCC, and spectral contrast. With this feature set and a mel spectrogram as input, we trained a model [22] that combined ResNet-50 [29] and a deep neural network (DNN), and the model achieved a 0.95 sensitivity and a 0.96 specificity. The result showed improvement compared with previous studies.
The structure of this paper is as follows. The collection of three crowdsourcing datasets is described in Section 2, along with an earlier study on models for diagnosing COVID-19 infections using each dataset. The current study’s database, database preparation, method for determining the Bhattacharyya distance and creating the feature set, and model are all covered in Section 3. The experimental results compared with previous studies are presented in Section 4. How to apply the constructed model to an application is covered in Section 5. The study’s findings and future directions are covered in Section 6.
2. Related Work
2.1. Cambridge
The Cambridge dataset [20] was collected using an Android/web application and includes the participants’ cough, voice, and breath sounds as well as information on their medical history and symptoms. Participants record three coughing sounds and three breathing sounds after providing their age, gender, a brief medical history, and any symptoms they may be experiencing. A total of 4352 users of the web app and 2261 users of the Android app each contributed to the dataset, resulting in 5634 samples and 4352 samples, respectively. The participants’ gender distribution was as follows: 4525 males, 2056 females, 26 non-respondents, and 6 others. Through the process of directly checking all the samples of COVID-19-positive test cases, 141 samples were retrieved.
Brown et al. [20] trained a classification model by extracting two types of features—handcrafted features and features from transfer learning—from the Cambridge dataset. Gradient boosting trees and support vector machines (SVMs) were used as a classification model. Raw sound waveform data were resampled at a frequency of 22 kHz before handcrafted characteristics were extracted. Handcrafted features were extracted at the frame level and segment level. A total of 477 handcrafted features were used, including duration, MFCC, Δ-MFCC, Δ2-MFCC, onset, period, root mean square (RMS) energy, roll-off frequency, spectral centroid, tempo, and zero-crossing. The features from transfer learning used VGGish [30], which is a convolutional neural network designed for audio classification based on raw audio input. VGGish is a model trained using a large YouTube dataset, and the parameters of the model are public. A pre-trained VGGish model was used to extract 256 dimensional features, and the sampling rate was 16 kHz. As a result of training the SVM model by extracting two types of features using only the cough sound data, the area under the ROC curve (AUC) was 0.82 and the sensitivity was 0.72.
2.2. Coswara
A project named Coswara [25] was carried out in India to develop a tool for diagnosing COVID-19 using audio recordings such as speech, breathing, and coughing. Worldwide data were gathered with an easy-to-use, interactive user interface. Participants recorded samples using a device microphone, such as a laptop or mobile phone, and provided metadata using a web browser application. During recording, participants were instructed to keep a distance of 10 cm between their mouth and the device. Nine audio samples were recorded per person: cough sounds (deep and shallow), breathing sounds (fast and slow), sustained vowel (‘eu’, ‘I’, ‘u’) pronunciation sounds, and counting sounds (slow and fast). The participant’s age, gender, area, history of illness, and current state of health with respect to COVID-19 were all included in the metadata. The sampling frequency of audio samples was 48 kHz. Data from 2747 individuals were made public as of 24 February 2022. Of these, 681 individuals had COVID-19-positive test results.
Feng et al. [21] used Virufy [26], a dataset collected under the supervision of medical professionals in hospitals, along with the Coswara dataset, to study a COVID-19 diagnostic model. In the Coswara dataset, only shallow cough recordings were used, and 200 samples of healthy people’s data were randomly selected and used to balance the training data set. The Virufy dataset consists of 16 recordings: 7 recordings from people diagnosed with COVID-19 and 9 recordings from healthy people. The Coswara dataset was used for training and the Virufy dataset was used for testing. First, silent recordings and noise/speaking recordings were distinguished through the SVM model trained with the energy features of each audio recording, and only the parts containing sound were extracted. Features of the audio signal were then extracted: centroid, energy, entropy of energy, spectral flux, MFCCs, spectral spread, and zero-crossing rate. A k-nearest neighbors (KNN) model was used to distinguish conversational sounds from cough sounds in a recording, and a new recording was created by connecting the cough sounds detected within one recording. The next step was to train four models—the KNN, SVM, random forest, and recurrent neural network (RNN)—to classify coughs in COVID-19-positive participants and healthy individuals. As a result of testing with the RNN model, which had the best results during the training process, the accuracy was 0.81 and the AUC was 0.79.
2.3. COUGHVID
The COUGHVID dataset [27] is a large publicly available cough sound dataset. The dataset contains over 20,000 recordings and contains the labels COVID-19, symptomatic, and healthy. Data collection was conducted using a web application from 1 April 2020 to 10 September 2020. After 10 s of cough sound recording for each person, participants were asked to fill out and submit simple information, including age, gender, and current condition. To remove non-cough recordings from the database, a cough detection model was applied and the cough sound scores of all recordings were analyzed. The scores were indicated by “cough_detected” in the metadata. Audio data were in the WEBM or OGG format, and the sampling frequency was 48 kHz.
Fakhry et al. [22] proposed a multi-branch deep learning network using the COUGHVID dataset as a model for diagnosing COVID-19. Only data with a cough detection score of 0.9 or higher were used, and the filtered data were 4446 recordings from healthy people, 923 recordings from symptomatic people, and 380 recordings from people who tested positive for COVID-19, for a total of 5749 audio files. In order to rectify the imbalance in the number of data, they increased the number of COVID-19-positive recordings to 750 by adding Gaussian noise, pitch shifting, and shifting or increasing the time signal. By selecting an equal number of recordings from symptomatic and healthy people, a total of 2250 audio samples were used. MFCCs and the mel spectrogram, which are commonly used in audio classification and speech recognition, were used as acoustic features for the network training. In addition, clinical features such as respiratory status or fever were used as a one-dimensional vector of binary numbers. The MFCCs were input to a dense layer of 256 and 64 nodes, and the mel spectrograms were input to a ResNet-50 that was pre-trained on the ImageNet dataset. Clinical features were input to a dense layer of 8 nodes. The output values of all results were connected to form a combined multi-branch. The sensitivity and specificity of this model were 0.85 and 0.99, respectively.
3. Proposed Method
3.1. Data
The cough sound databases of Cambridge [20], Coswara [25], and COUGHVID [27] presented in Section 2 were used in the experimental data of this study. From the COUGHVID data, only data with a cough detection score of 0.9 or higher were extracted based on metadata that included score information in relation to the degree of cough sound detection. Because all three databases had more cough sound data from COVID-19-negative participants than from positive individuals, only a portion of the cough sound data from negative participants was used; this was conducted to balance the data. Due to the nature of crowdsourced data, which is collected in various environments, it may contain data that are difficult to use for a study. Therefore, the audio files were directly listened to and inspected. Data were deleted through inspection in the following cases.
- The cough sound is quieter than the noise.
- The recording quality is too poor.
- Background noise (conversation, road noise, music, TV/radio, etc.) is mixed with the cough sound.
- It is difficult to recognize the cough sound.
As indicated in Table 1 and Table 2, 4200 audio files were inspected, and finally 2049 cough sound audio files were selected. The selected database consisted of 1106 audio files of cough sounds from COVID-19-positive participants, 530 audio files of cough sounds from healthy people, and 413 audio files of cough sounds from people with symptoms.

Table 1.
Number of audio files before inspection.
Table 2.
Number of audio files after inspection.
3.2. Preprocessing
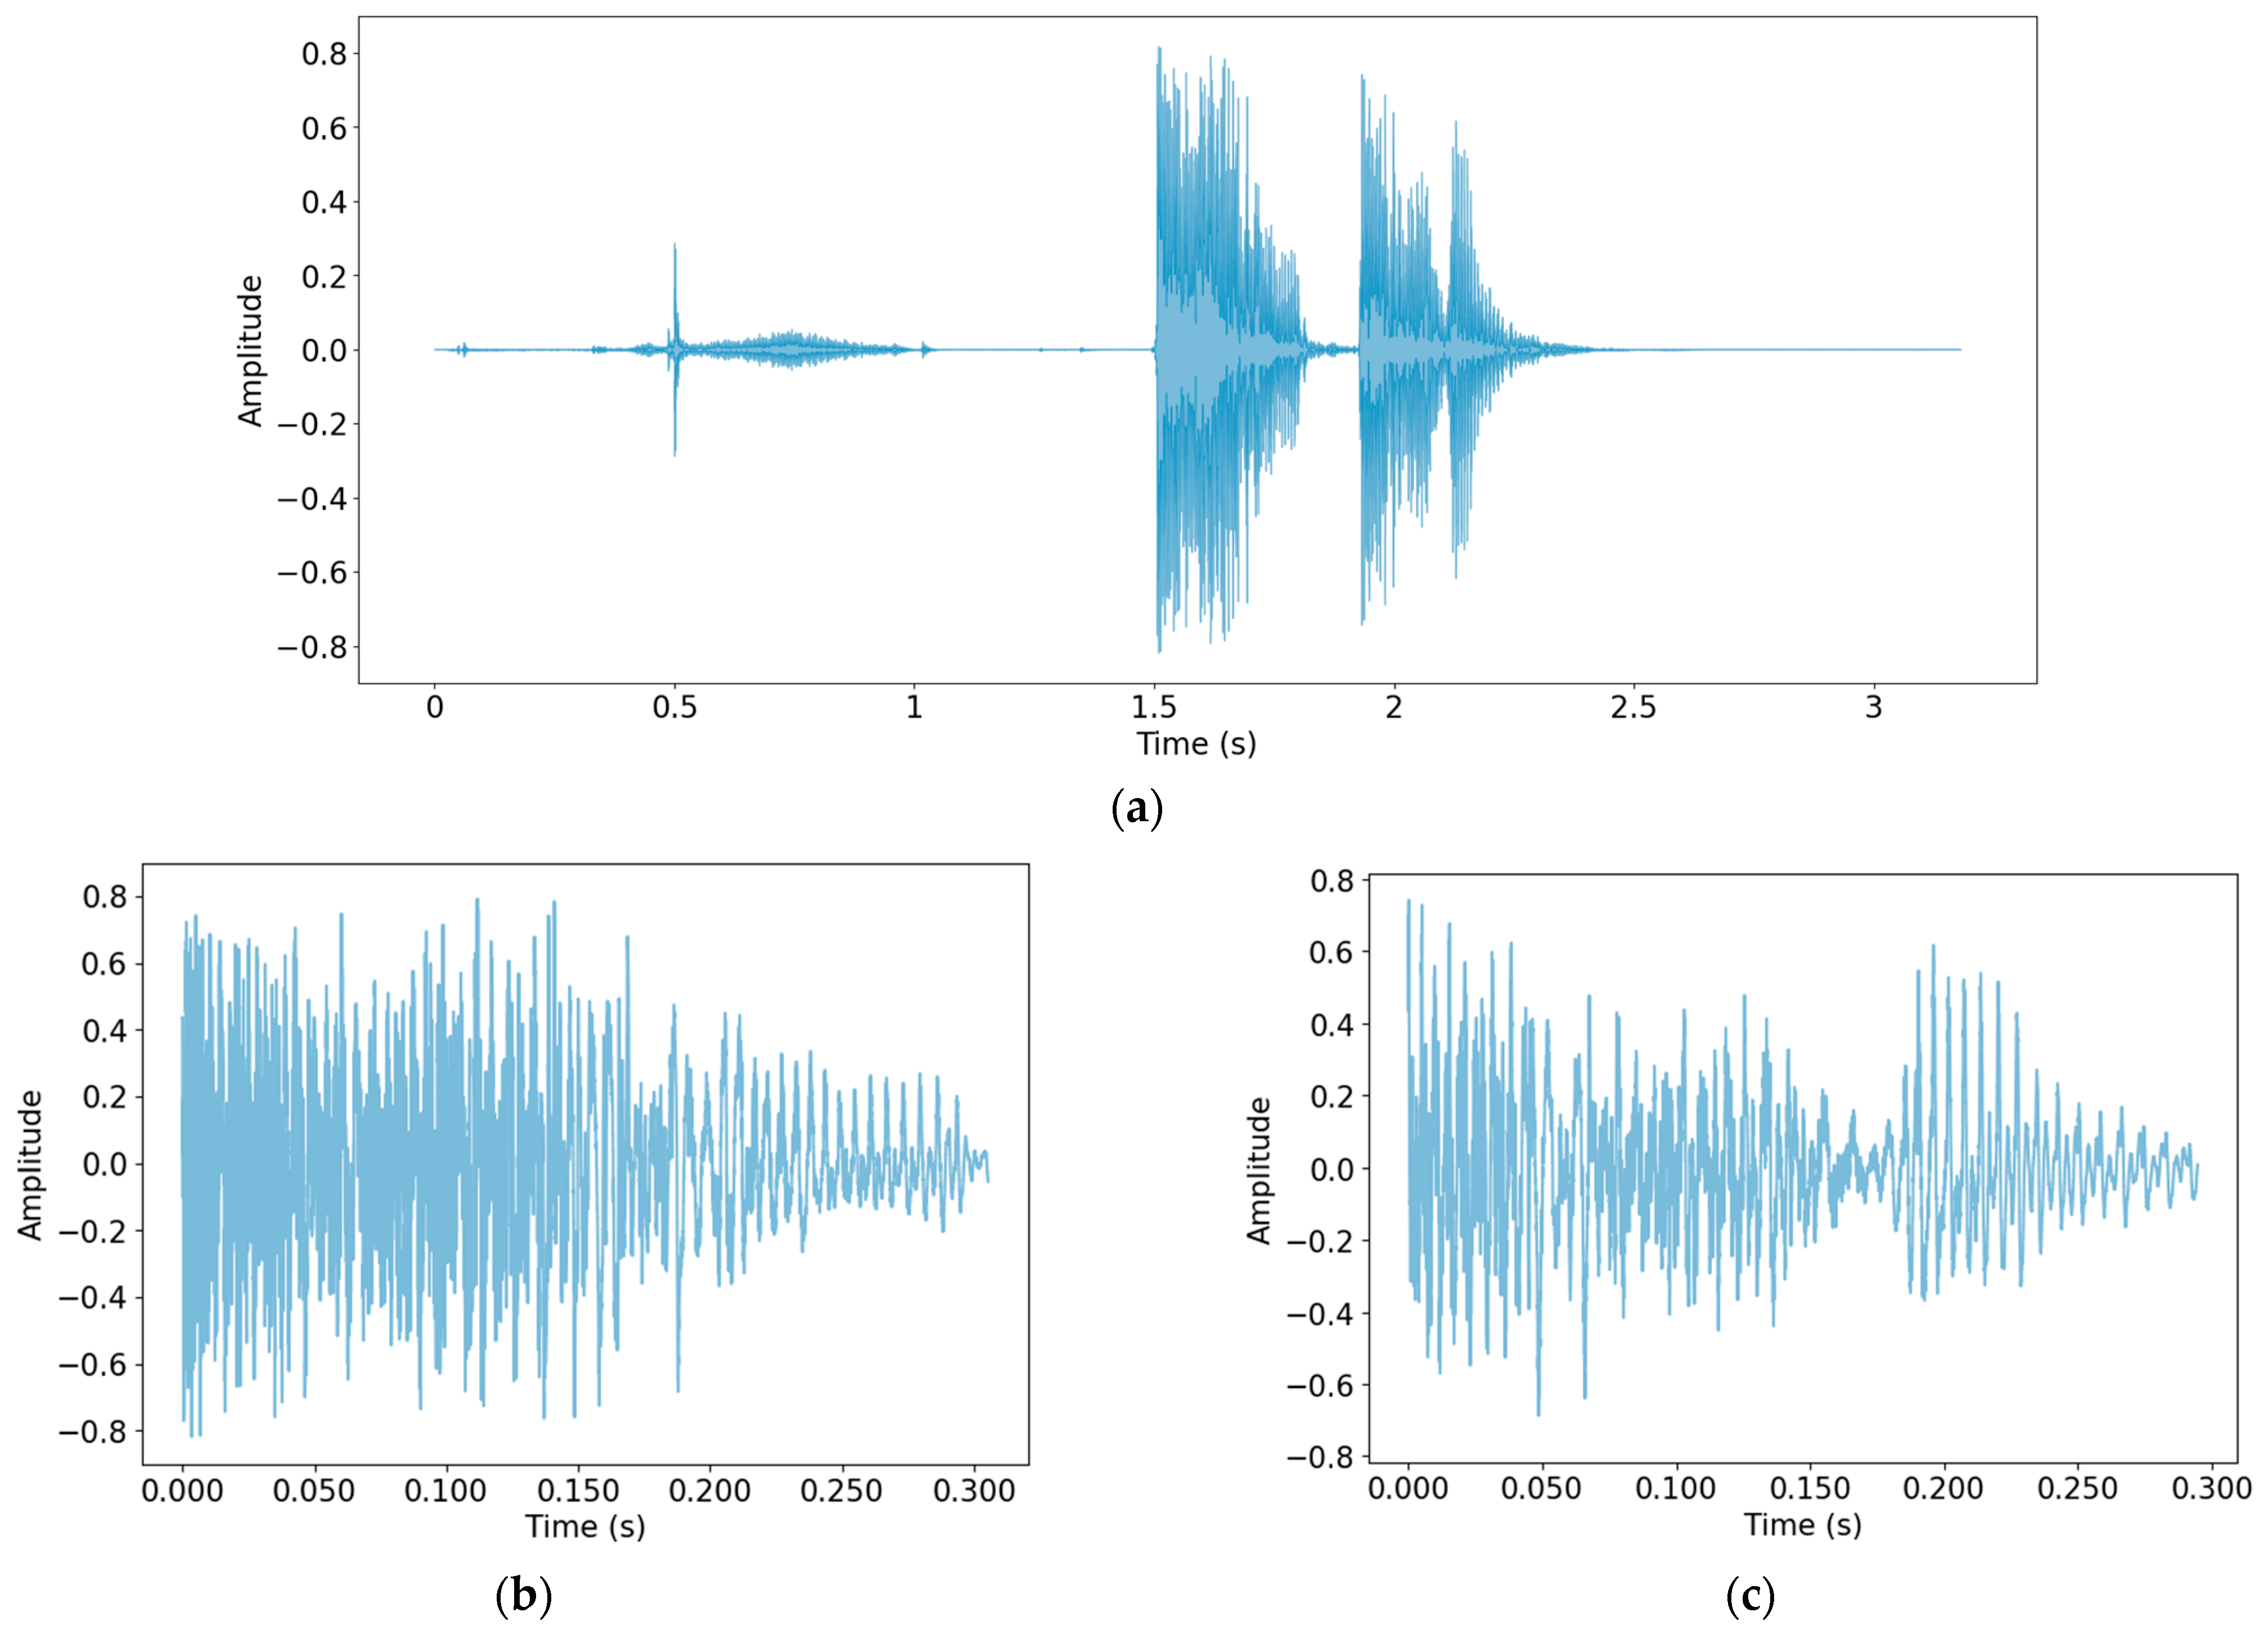
Because the data were collected in a variety of ways and in a wide range of environments, normalization was first performed to make the scale of the data uniform. Then, a process of detecting only cough sounds in the data was carried out. Through this process, unnecessary voices and other noises recorded during the data collection process were removed, and only clear cough sounds, which are useful data for the study, were obtained. The method used for cough detection was that described by Orlandic et al. [27]. In Figure 1, cough detection was performed using one audio file as the original data, and the detected cough segment is shown as an example.
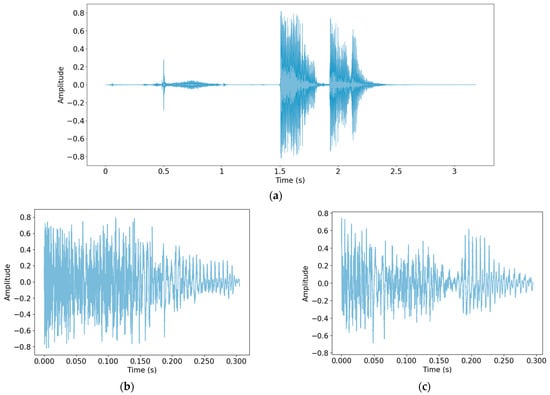
Figure 1.
Performing cough detection: (a) Original audio file data; (b) detected cough segment 1; (c) detected cough segment 2.
As shown in Figure 1, the part of the speech sound in the front part of (a) was not detected. The cough recorded twice in succession was detected by dividing it into two cough segments. Table 3 shows the number of cough segments from each database.
Table 3.
Number of cough segments detected.
3.3. Feature Set
3.3.1. Audio Feature Vector
In this section, a feature set for this study was constructed. In addition to the spectral-based speech features mainly used in speech research, several features were added and used. Twelve features were used: chroma, onset, RMS energy, spectral bandwidth, spectral centroid, spectral contrast, spectral flatness, spectral roll-off, MFCC, Δ-MFCC, Δ2-MFCC, and zero-crossing rate. The 13th order MFCC was used as the MFCC. All features were extracted using the librosa package [31] with a sampling frequency of 24,000 Hz. To form the final feature set, features that were effective for detecting COVID-19 were selected from among the 12 features. In order to do this, the Bhattacharyya distance [28], a method that measures the separability of classes, was used.
3.3.2. Bhattacharyya Distance
The database was divided into two classes, positive and negative, to identify the difference between COVID-19-positive data and negative data. Features were extracted from the cough segment, and the separation between the two classes was calculated for the same feature vector. Equation (1) is the formula for calculating the Bhattacharyya distance, where and represent the averages of each class and and represent the covariances of each class. The larger the difference between the two classes, the larger the distance.
Table 4 presents the results for the Bhattacharyya distance sorted in descending order. The feature with the largest difference between the two classes was MFCC, with a value of 0.207171, and the feature with the smallest difference was onset with a value of 0.002387. The final feature set to be used in this study consisted of the top four features: MFCC, Δ2-MFCC, Δ-MFCC, and spectral contrast.
Table 4.
Bhattacharyya distance of each feature.
3.4. Model
In this study, a model combining ResNet-50 and a DNN proposed by Fakhry et al. [22] was used. ResNet-50 is a convolutional neural network composed of 50 layers that allows for stable learning while the depth of the model increases. The DNN is an artificial neural network (ANN) that consists of several hidden layers between the input layer and the output layer. The mel spectrogram image obtained from the cough segment was input to ResNet-50, the feature set was input to the DNN, and the inputs were trained.
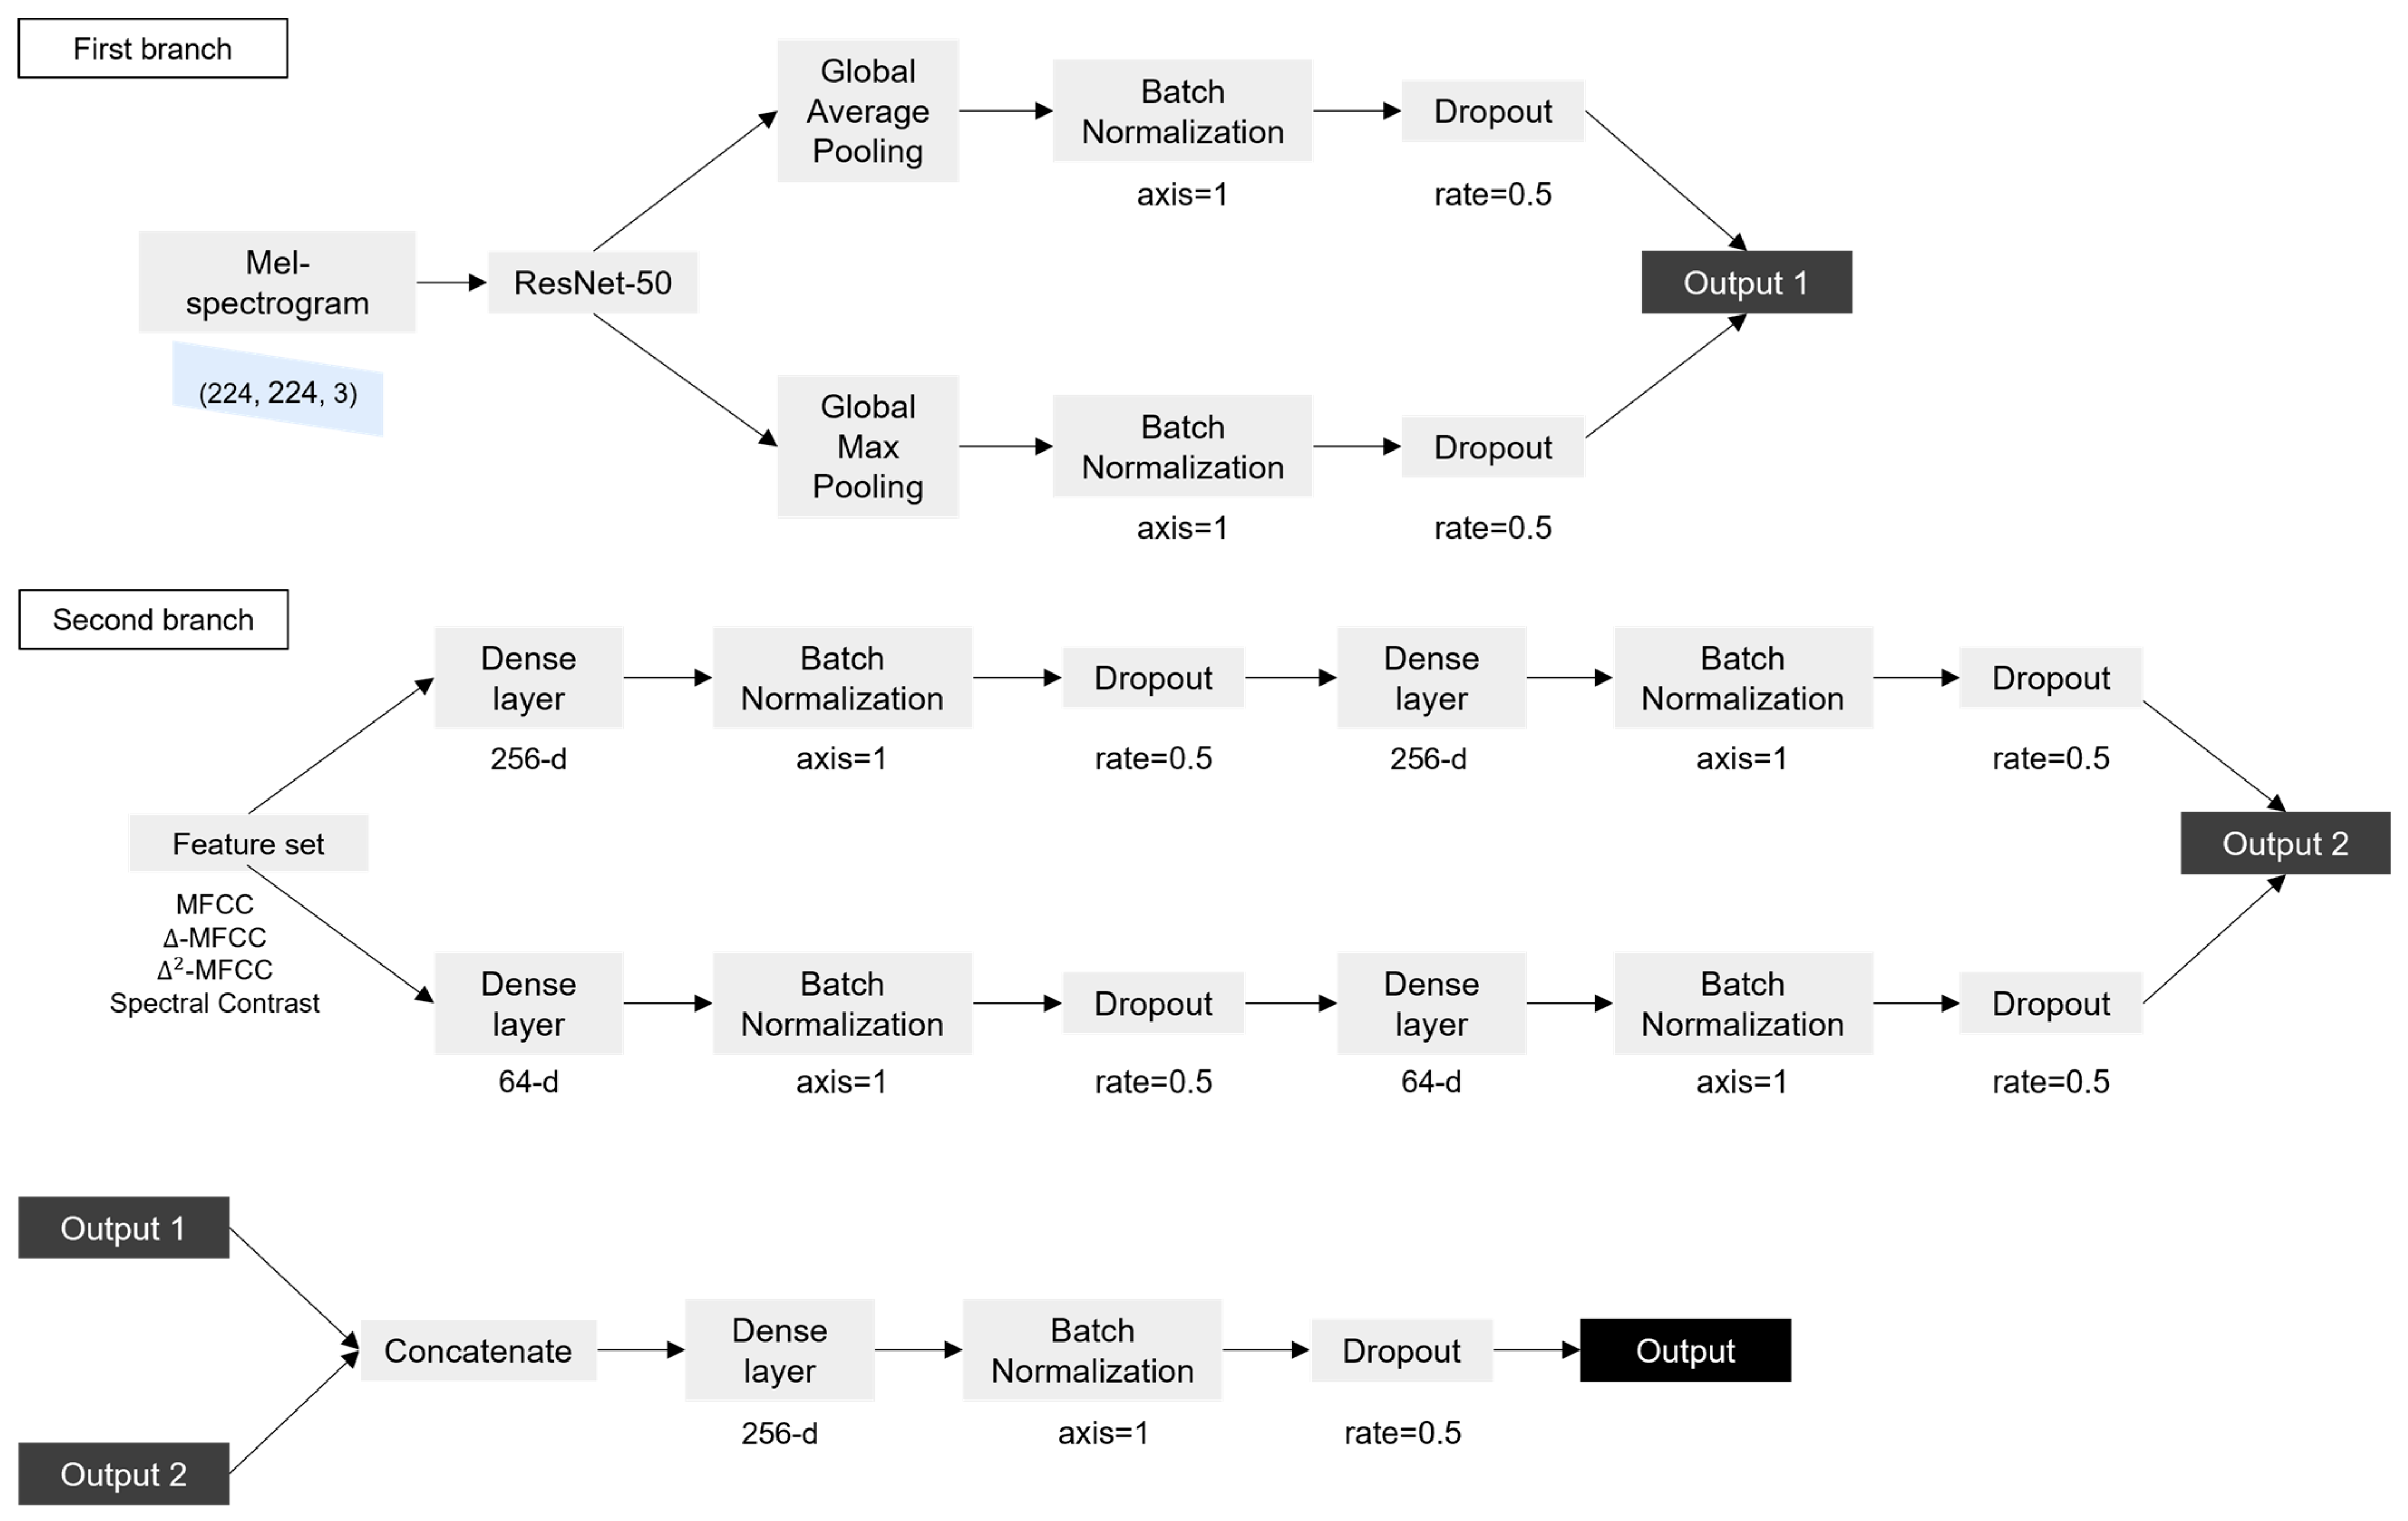
In the first branch, ResNet-50 was trained with the mel spectrogram image of (224, 224, 3) as the input. In ResNet-50, an image of size (224, 224, 3) went through multiple convolutional, activation, and pooling layers to reduce the size of the image while extracting features. This process was repeated multiple times, with each iteration reducing the size of the feature map while increasing the number of filters used by the network. The output of the final pooling layer was a tensor with size (7, 7, 2048), which represented a compact representation of the input image. The output went through global average Pooling and global max pooling separately. The global pooling layer is a method of replacing values of the same channel with one average or maximum value. Overfitting can be prevented because the parameters are reduced. If an input of size (height, width, channel) passes through the global pooling layer, it becomes (1, 1, channel). The two outputs obtained through this process were connected after batch normalization and dropout were performed. In batch normalization, the activations of each neuron in a layer are normalized using the mean and standard deviation of the activations in a subset of the training data. The normalized activations are then scaled and shifted using learned parameters. In dropout, neurons are randomly dropped out during each iteration of training, with a specified probability. These processes help to ensure that the network will be able to generalize new data well, while still being able to learn effectively from the training data. The second branch took a 46-dimensional feature set as input. The feature set was input to a dense layer consisting of 256 nodes, and batch normalization and dropout were performed. The output became the input to a dense layer with the same number of nodes, and batch normalization and dropout were performed once more. The above process was performed in the same way for the dense layer consisting of 64 nodes to obtain another output. The two outputs were then connected. The outputs obtained through the first branch and the second branch were connected and became the input to the dense layer, and batch normalization and dropout were performed. Finally, the sigmoid function was used to calculate the value, to distinguish whether the input was the cough sound of COVID-19-positive individual or negative individual. Figure 2 shows the flow chart of the model.

Figure 2.
Flow chart of the model.
4. Experiment
In the experimental step, we carried out a procedure to verify that the feature set proposed in this study and the combined model of Resnet-50 and DNN were effective at detecting COVID-19. The experiment was conducted by using a combination of the various datasets and feature sets. For example, for the same database, the results of training using ‘A feature set’ and the results of training using ‘B feature set’ were compared. The hyperparameters used in the experiment were set to optimizer Adam, learning rate 0.001, and epoch 50. The experimental results of this study were compared with those of previous studies.
4.1. Evaluation Index
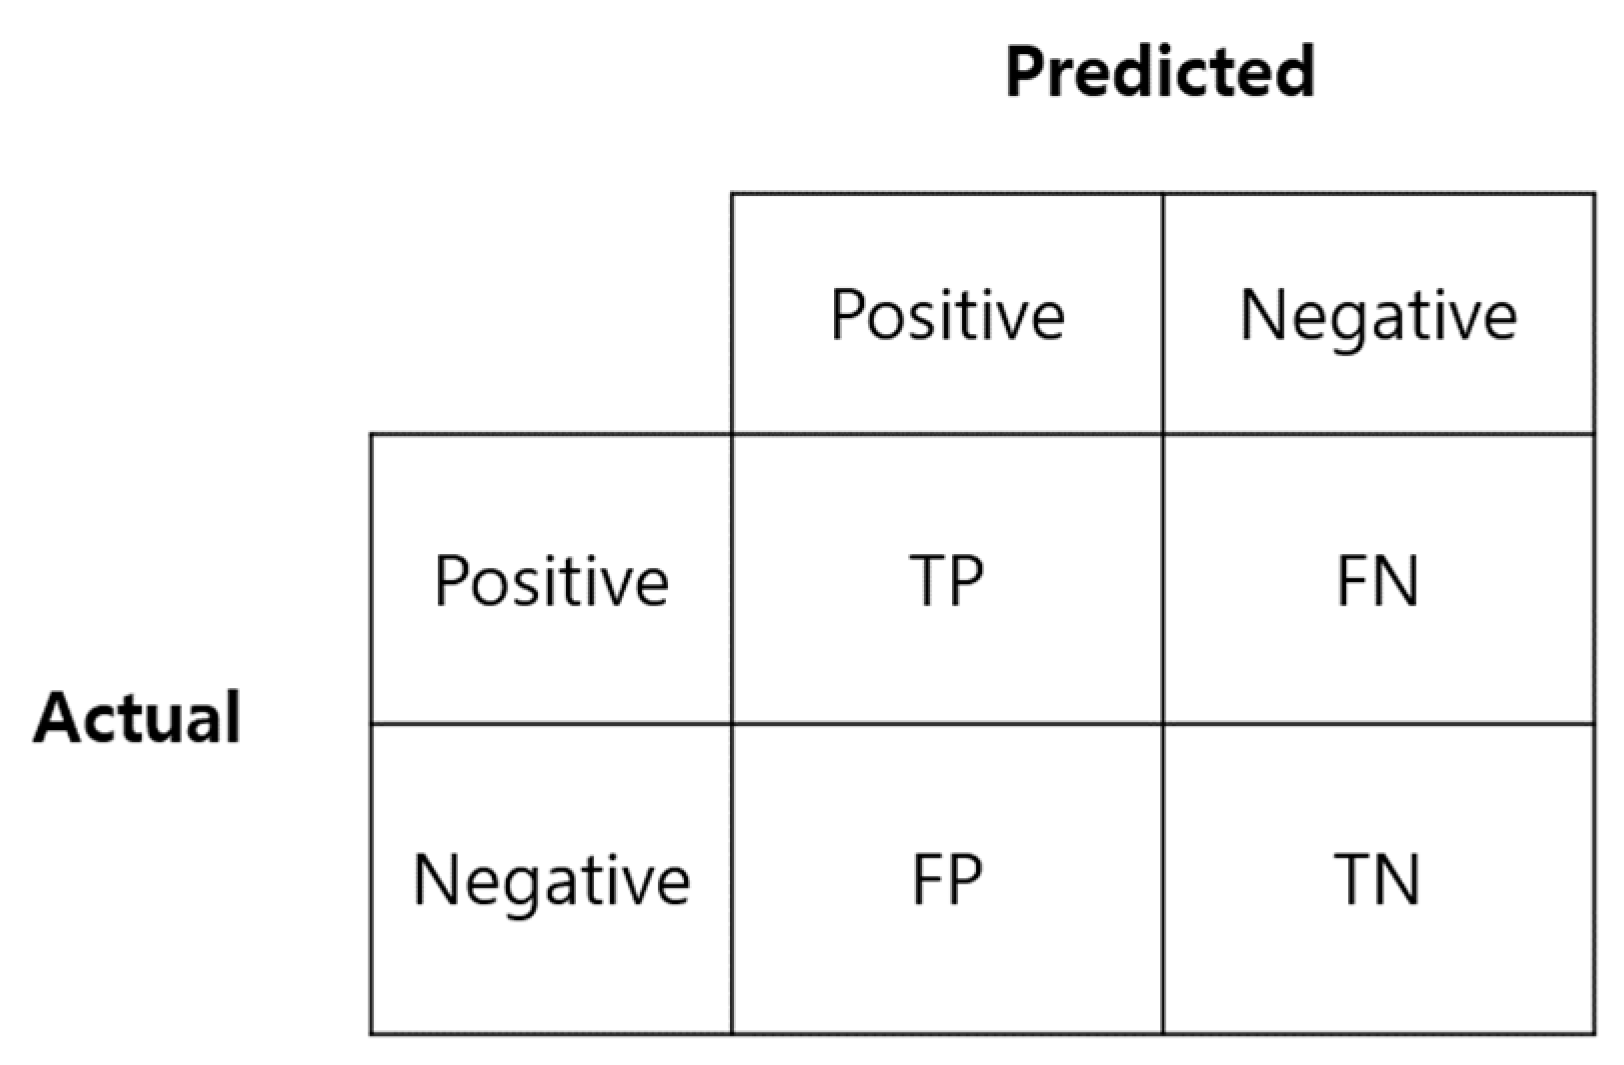
Accuracy, sensitivity, specificity, and precision, which are frequently used to evaluate the performance of classification models, were used to evaluate the training results. The focus was on sensitivity and specificity, which are primarily considered when measuring the reliability of the actual COVID-19 test diagnosis method. Figure 3 is a confusion matrix used to calculate the above indicators.
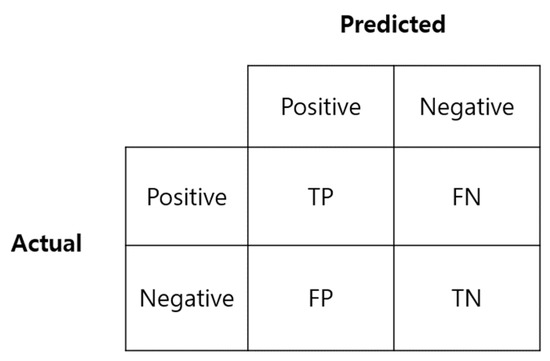
Figure 3.
Confusion matrix.
Sensitivity is the ratio of data predicted as positive (TP) to the actual positive class (TP + FN), and specificity is the ratio of data predicted as negative (TN) to the actual negative class (FP + TN). A high sensitivity means that there is a low probability of a false negative, i.e., a low probability of a positive being falsely classified as negative.
4.2. Results
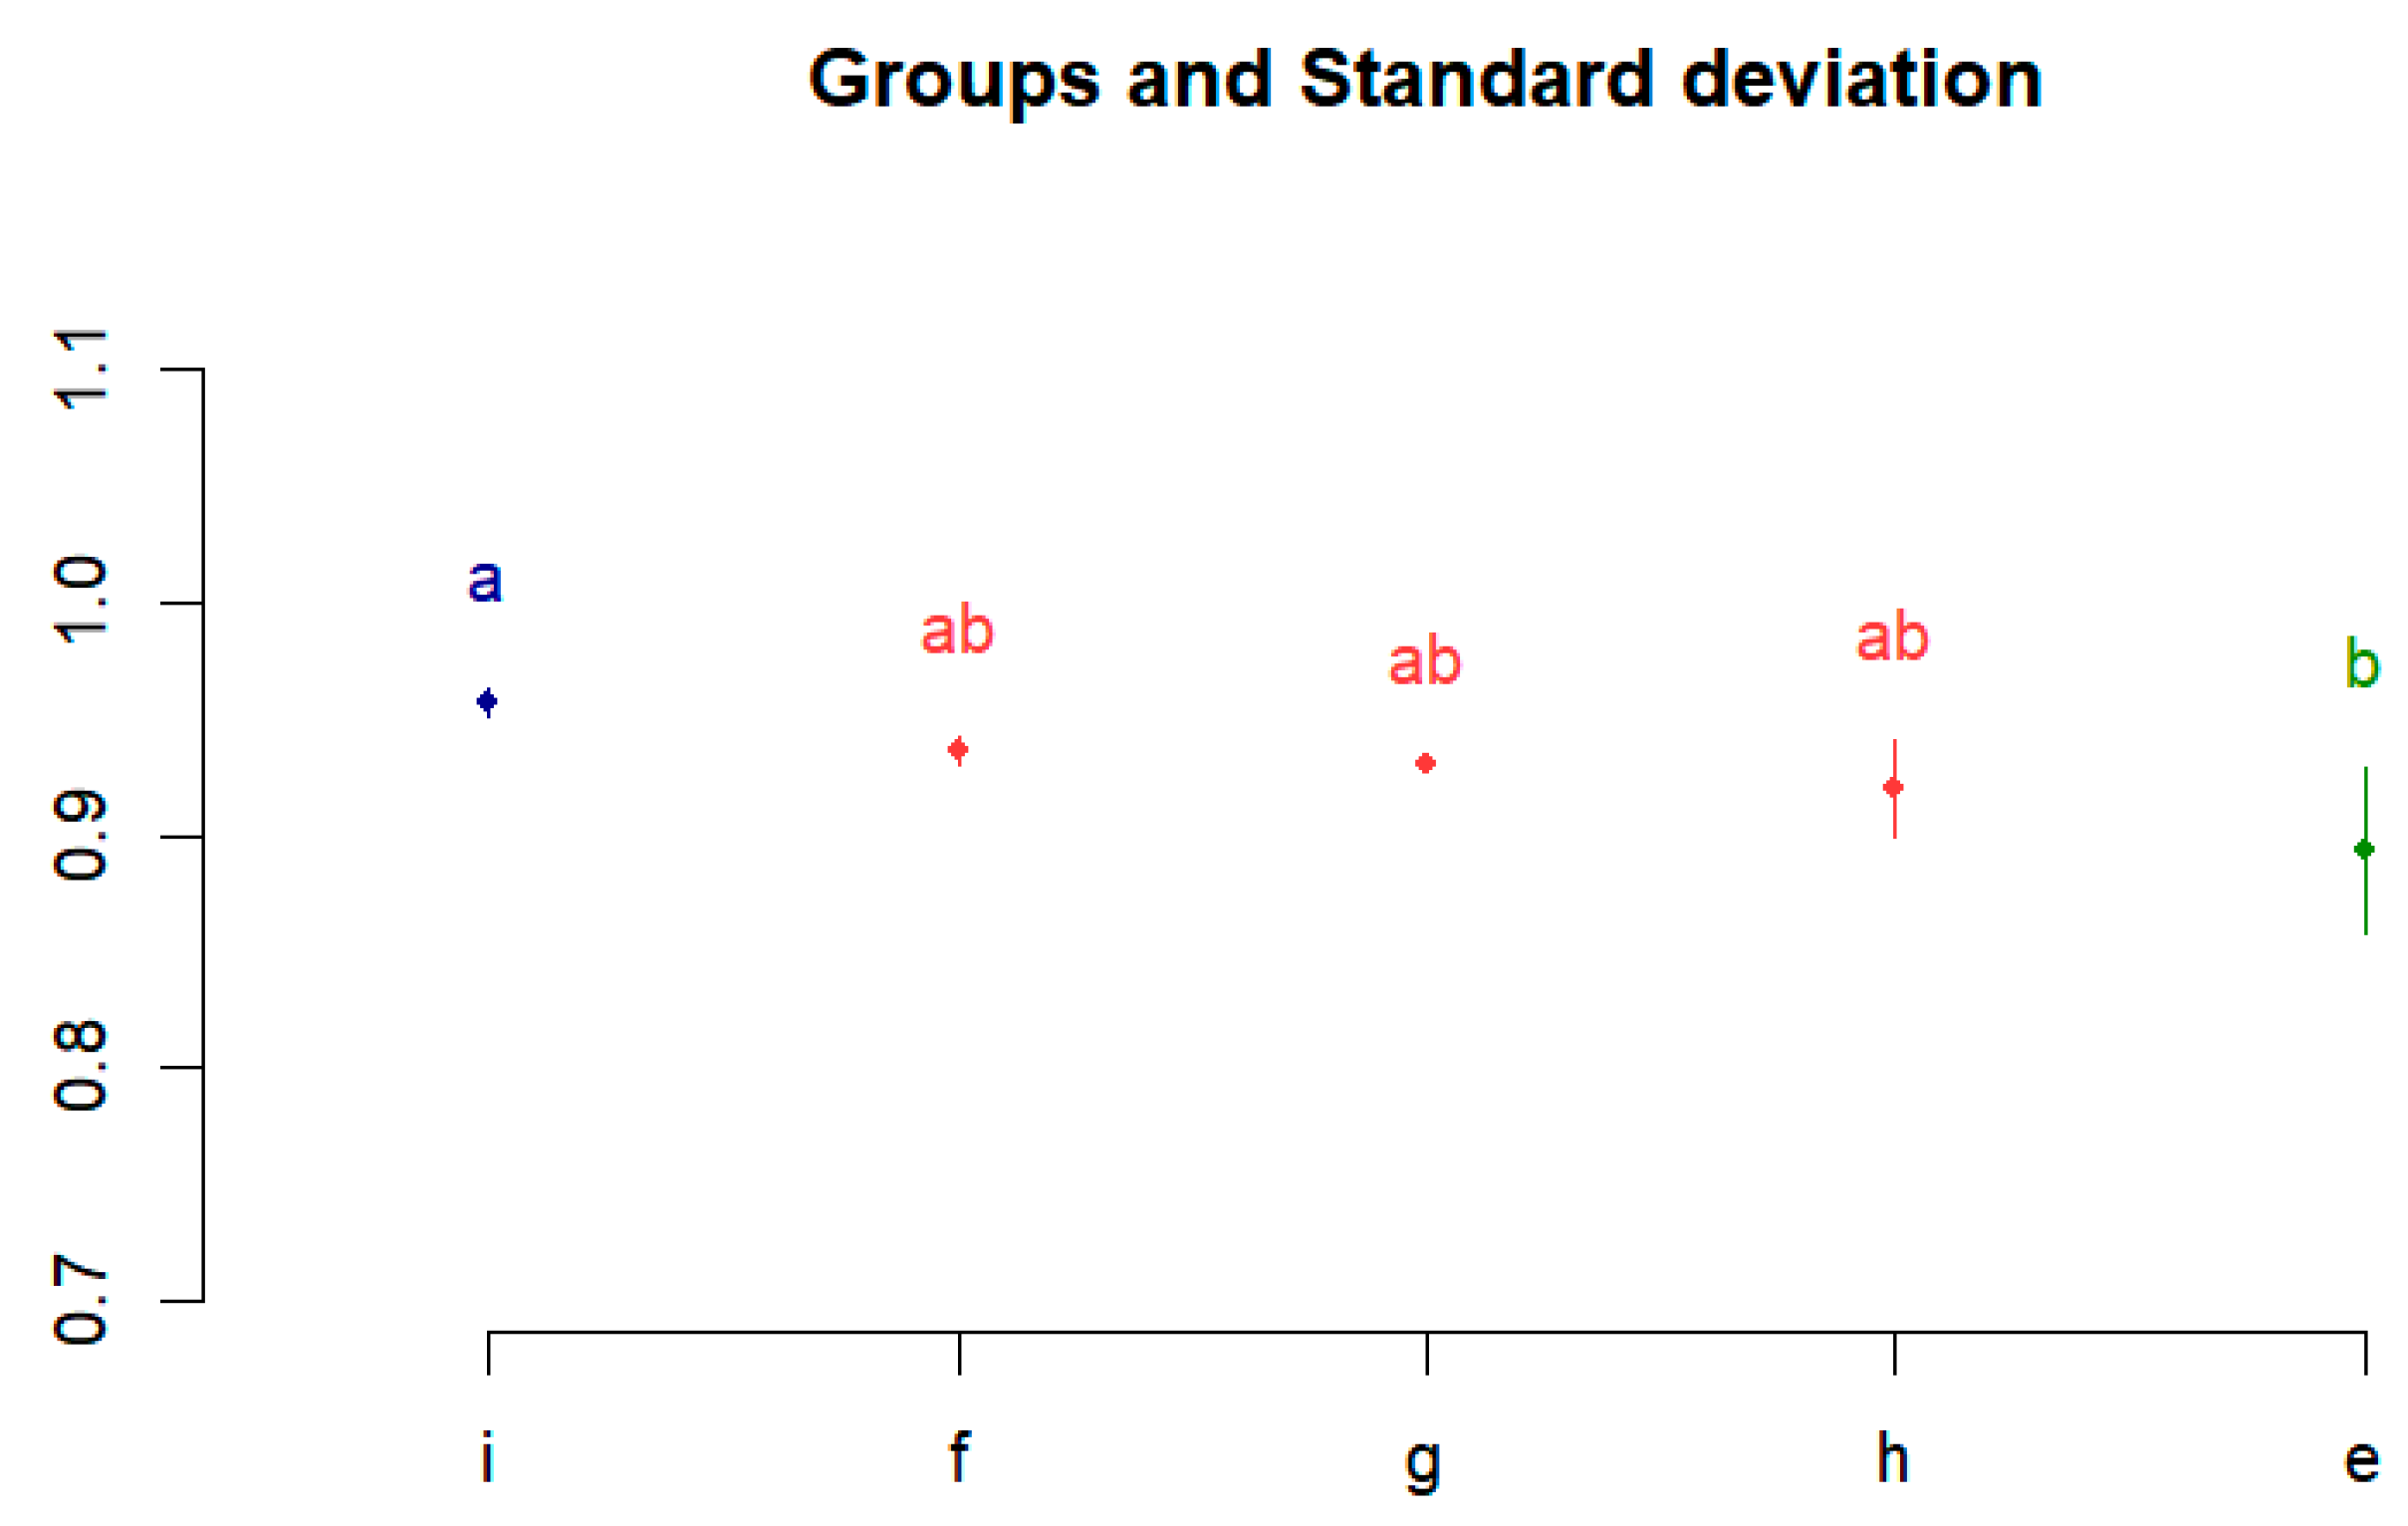
The results of each study are shown in Table 5 (a) to (d) show the results using the LSTM model and the ResNet-50 model, not the model proposed in this study. (a) and (b) are the results of Son [23] using COUGHVID data, and (c) and (d) are the results using the dataset constructed in this study. (e) to (i) are the results verifying the feature set we proposed. All used a model that combined ResNet-50 and DNN. (e) is the result of study by Fakhry et al. [22], using 13 MFCCs and a mel spectrogram as features from the COUGHVID dataset only, and the accuracy, sensitivity, and specificity was 0.89, 0.93, and 0.86, respectively. (f) is the result of Son et al. [23], using seven features (13 MFCCs, spectral centroid, spectral bandwidth, spectral contrast features, spectral flatness, spectral roll-off, and chroma), and a mel spectrogram. The accuracy, sensitivity, and specificity of Son’s study were 0.94, 0.93, and 0.94, respectively. (g) to (i) are the experimental results obtained in this study, and the model was trained using data from Cambridge, Coswara, and COUGHVID. (g) is an extension of only the database in Fakhry’s study, with the others remaining the same. The result had an accuracy of 0.93, a sensitivity of 0.93, a specificity of 0.93, and a precision of 0.93. (h) shows the model trained with the feature set proposed by Son’s study, and the result gave an accuracy of 0.92, a sensitivity of 0.90, a specificity of 0.94, and a precision of 0.90. (i) is the method proposed in this study. The model was trained using the configured feature set, MFCC, Δ-MFCC, Δ2-MFCC, and spectral contrast. The result had an accuracy of 0.96, a sensitivity of 0.95, a specificity of 0.96, and a precision of 0.95. This performance showed a better result than the previous studies mentioned above.
Table 5.
Comparison of the results.
To statistically verify the above results, a statistical analysis method was used. For the results of (e) to (i), which are experiments using the proposed model, one-way analysis of variance (ANOVA) was used to confirm whether the differences in performances are statistically significant. Table 6 shows the ANOVA results. The p-value was 0.0205, which is less than 0.05. This indicates that the difference in performance between each experiment is statistically significant.
Table 6.
Results of ANOVA.
Thereafter, as a post hoc analysis, differences between performances were confirmed using the Bonferroni multiple comparison analysis method. It was executed using R studio, which is widely used for data analysis and statistical computing. Figure 4 shows the Bonferroni correction results. The performances of (e) to (i) are divided into groups a, ab, and b, and the difference between the performances is visualized.
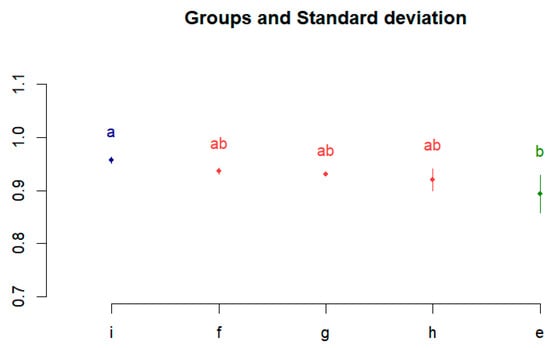
Figure 4.
Post hoc test results using Bonferroni correction.
5. COVID-19 Detecting Application
We developed an application using the proposed model so that it could be used to diagnose COVID-19 in many people. An application for Android, which is a mobile operating system based on open-source software produced and released by Google, was produced. Figure 5 shows the execution process of the developed application.

Figure 5.
Execution process of the application.
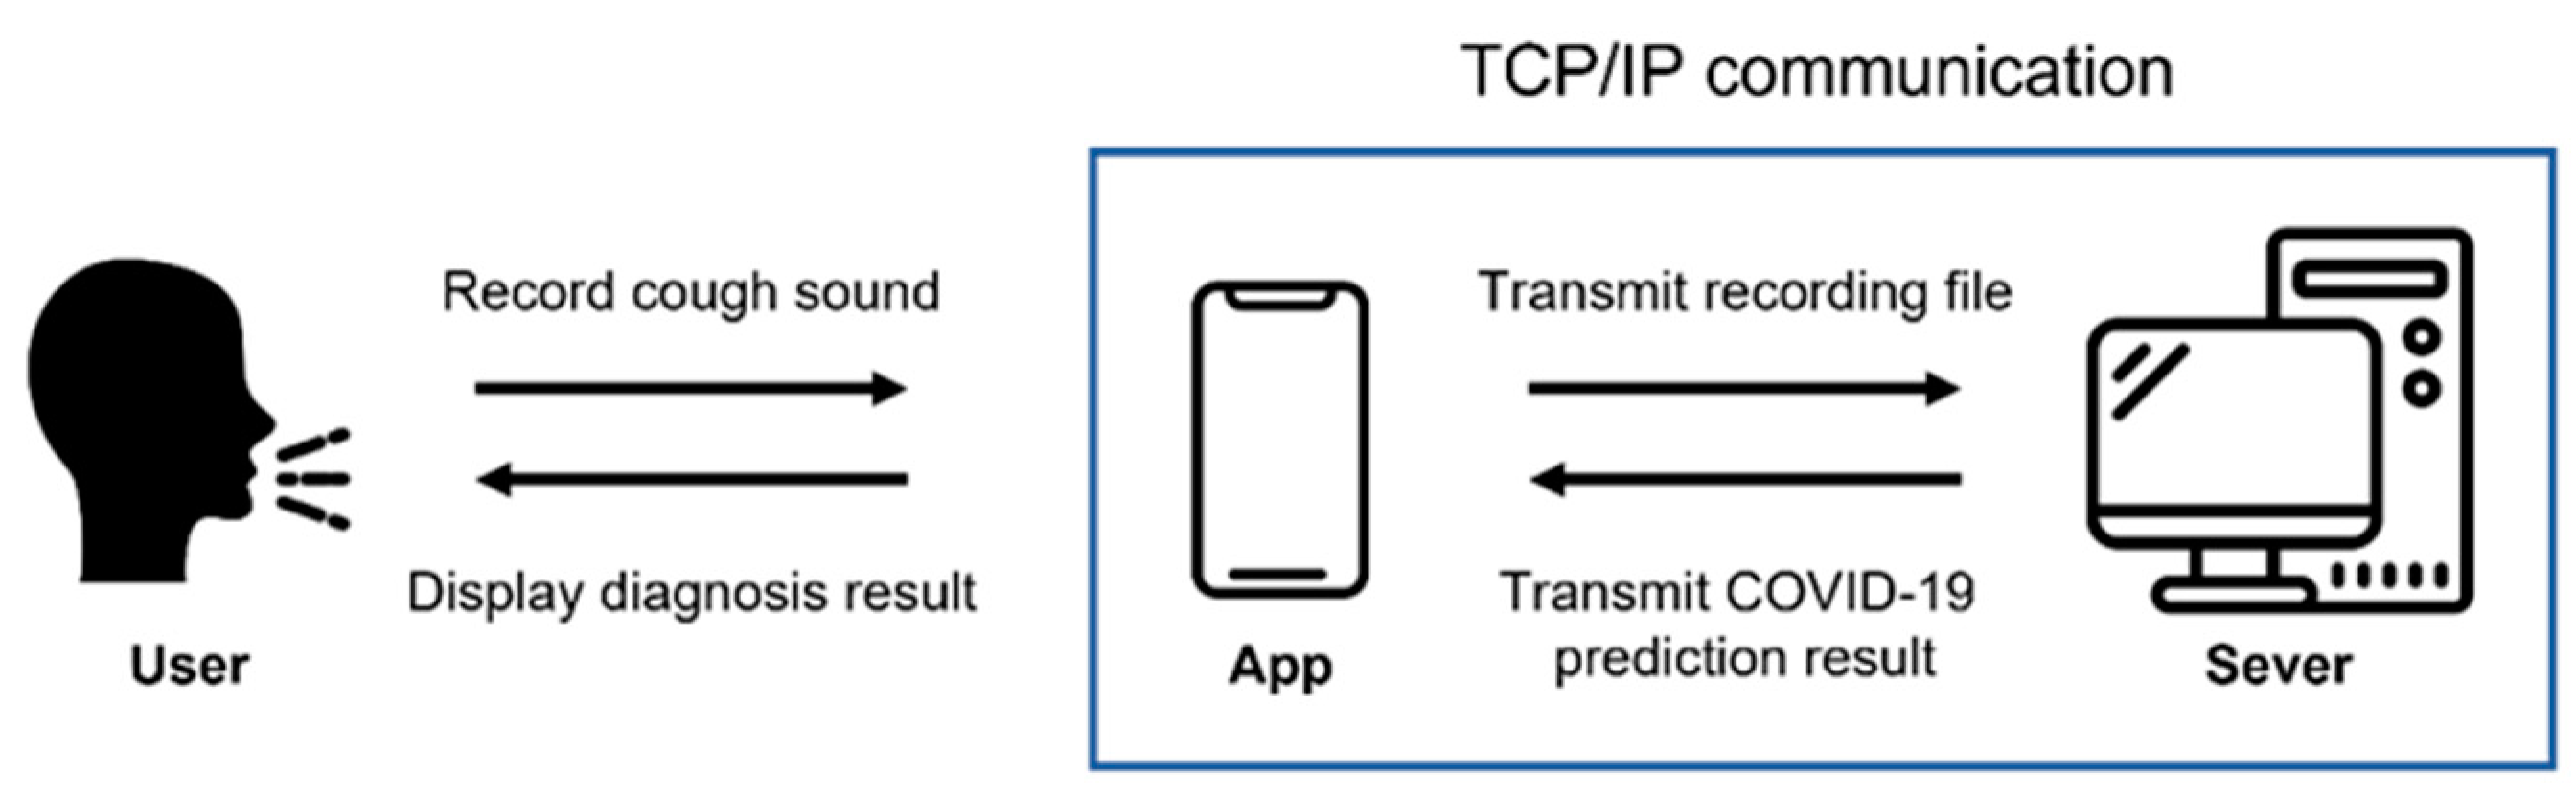
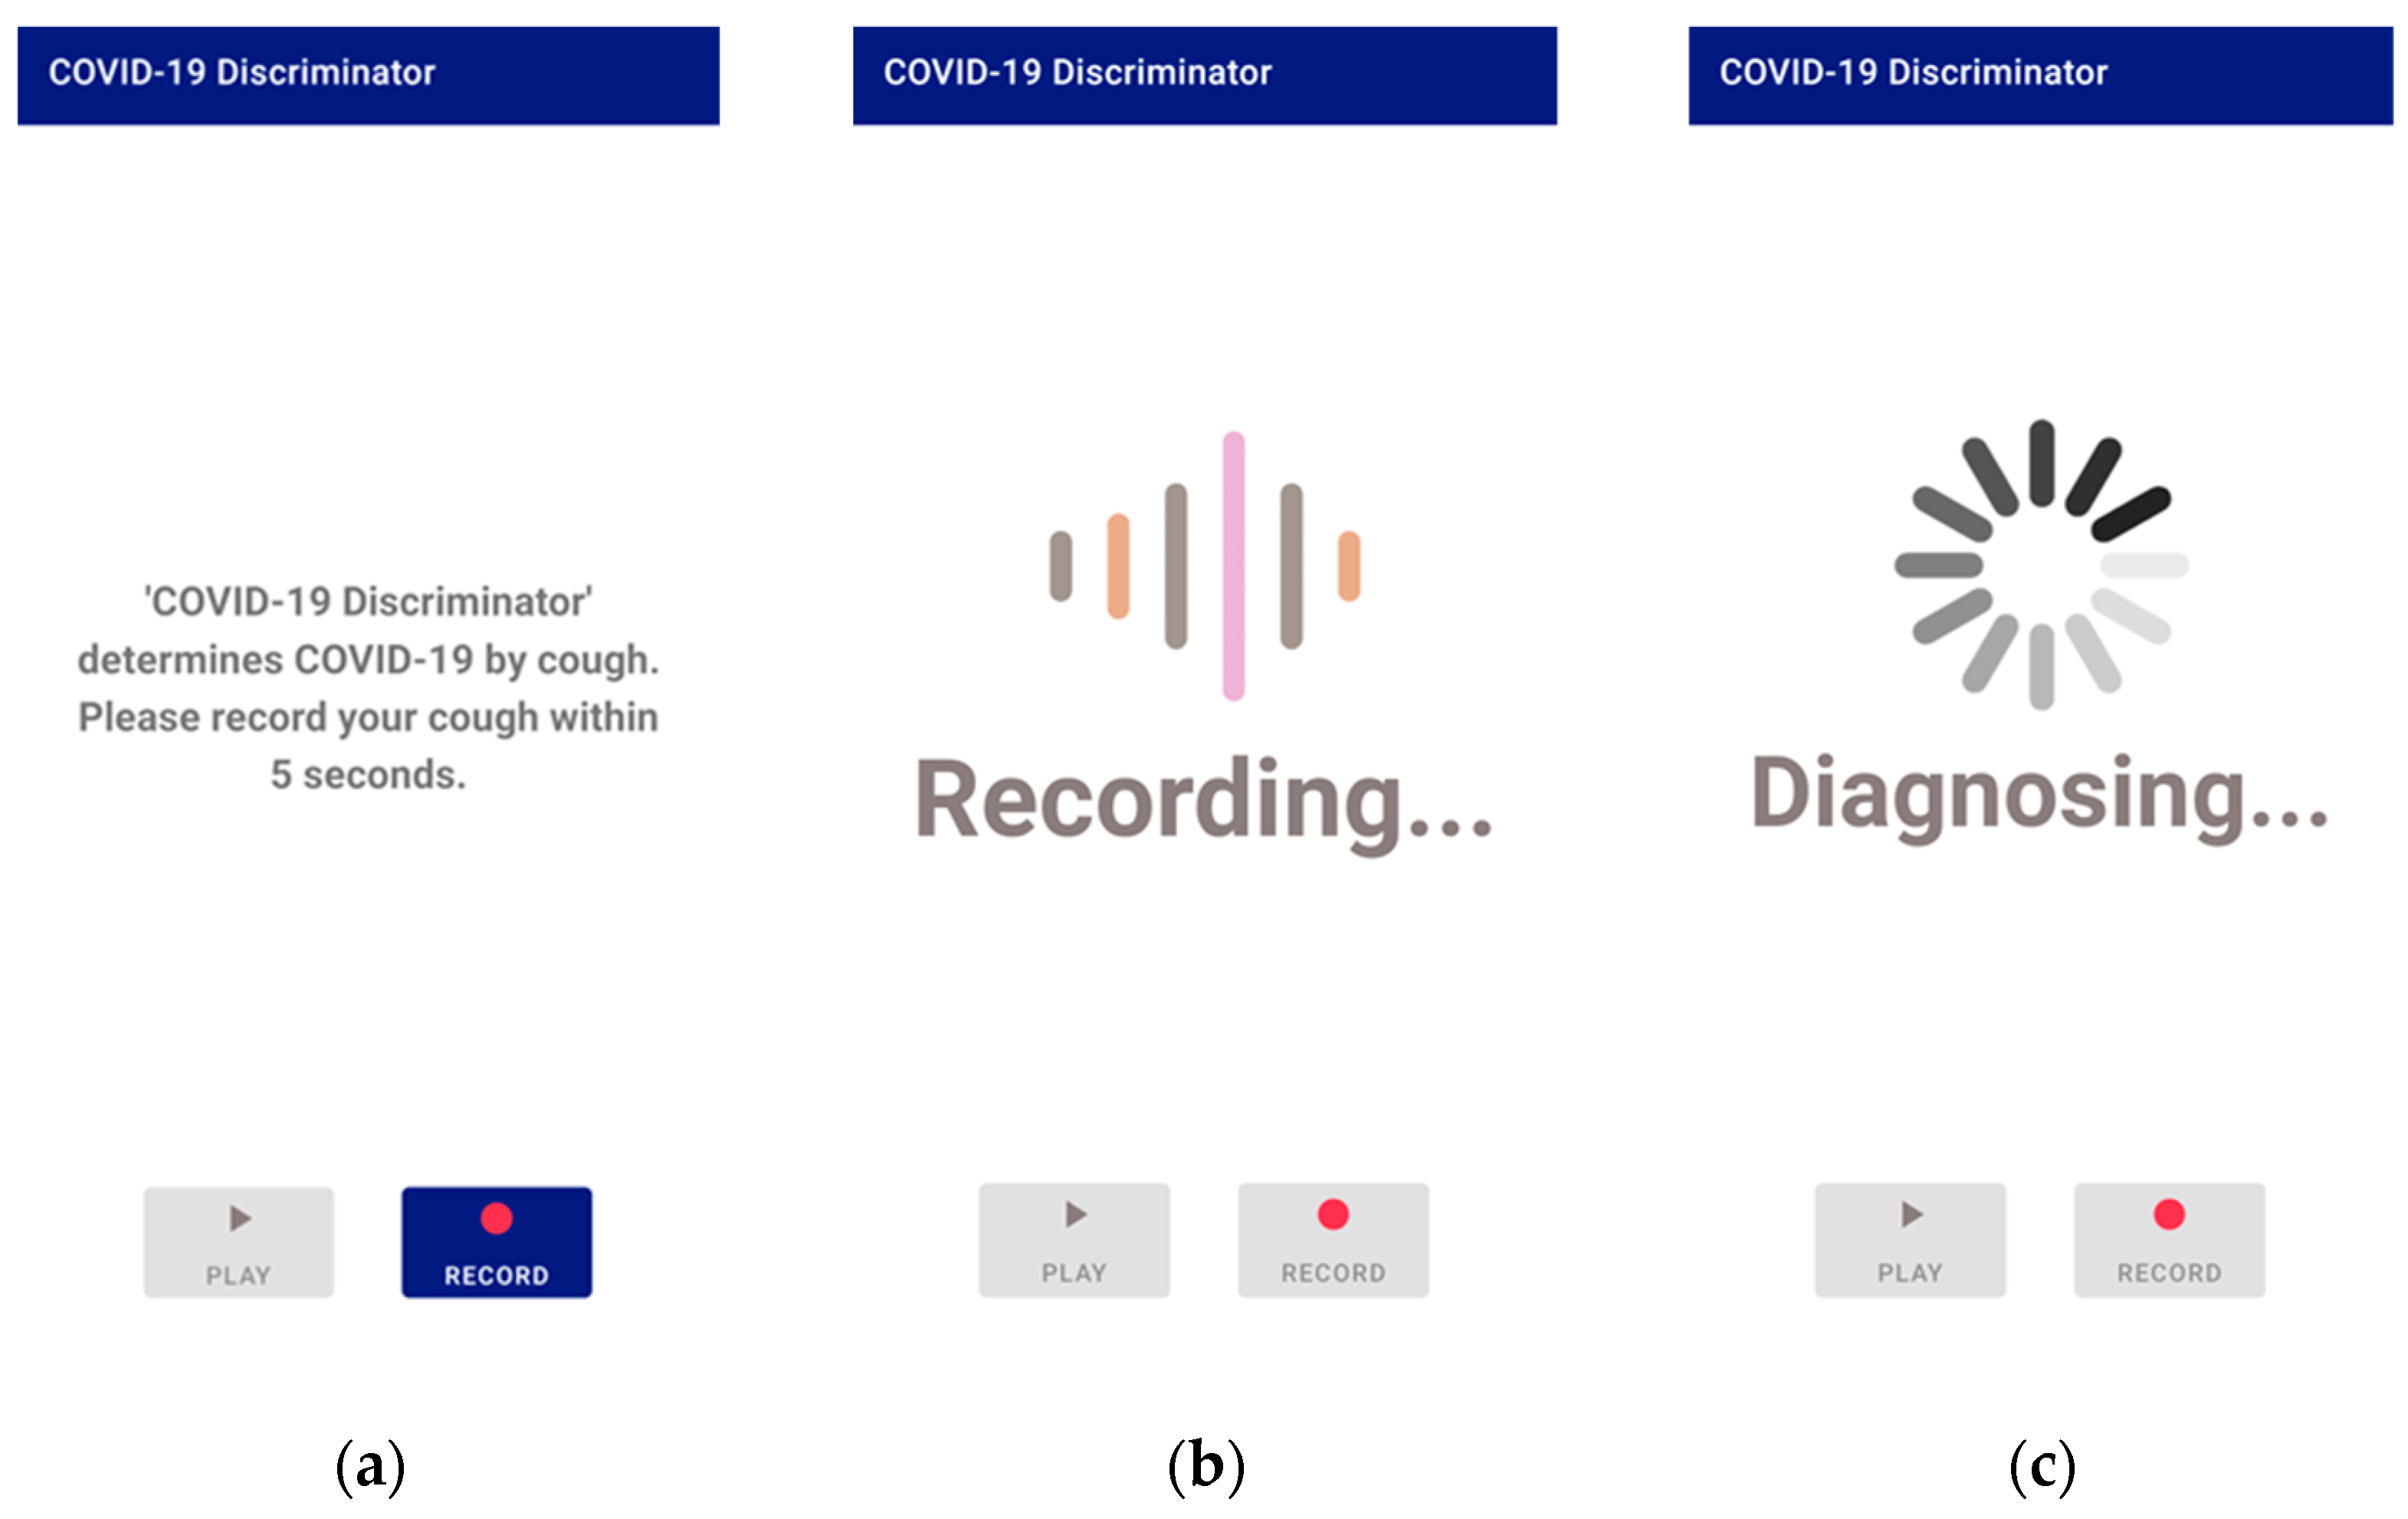
When the application is executed and recorded, the recording is transmitted to the server using Transmission Control Protocol (TCP)/Internet protocol (IP) socket communication. The user’s voice is recorded as a binary pulse-code modulation (PCM) file using the Android AudioRecord API [32]. In order for the user to play and listen to the recorded file in the application, the AudioTrack API [33] provided by Android was used. The recording format is designated as a sampling rate of 48 kHz, stereo channels, PCM 16 bit. The main screen of application, the screen during recording, and the screen when the recorded voice is transmitted to the server and processed are all shown in Figure 6.
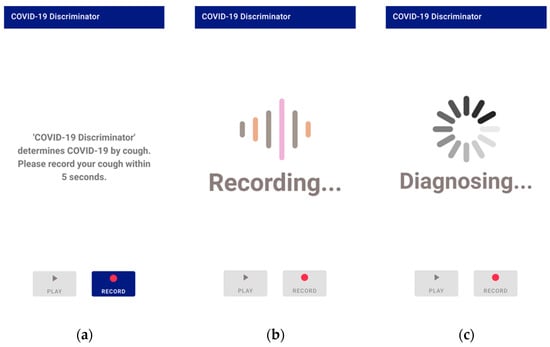
Figure 6.
Application screen 1: (a) the main screen; (b) the screen during recording; (c) the screen during processing.
After receiving the data, the server converts it to a mono-channel WAV file, which is the same format used by the database data used in this study. Then, the cough segment is extracted through the preprocessing process described in Section 3.1. The extracted cough segments are input into the trained model to measure a COVID-19 diagnosis prediction value, and the result is transmitted to the application. There are three types of results: positive, negative, and retry. A retry occurs when a cough is not detected during preprocessing. The application shows the diagnosis result screen based on the results transmitted from the server. Figure 7 shows a screen displaying diagnostic results from the application.
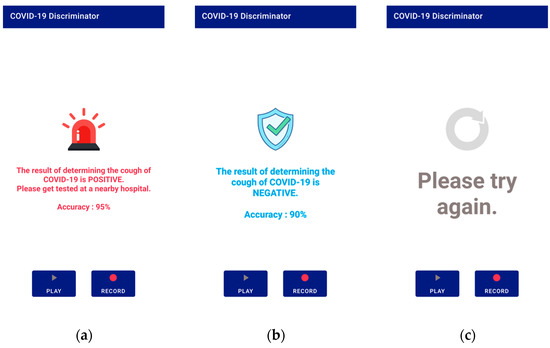
Figure 7.
Application screen 2: (a) positive result; (b) negative result; (c) if no cough is detected.
6. Conclusions
In this study, we proposed a COVID-19 diagnostic model and its application based on an artificial intelligence (AI) model with optimized feature vectors using cough sounds. The Bhattacharyya distance was used to measure the separability of features from COVID-19-positive cough data and negative cough data. MFCC, Δ-MFCC, Δ2-MFCC, spectral contrast, chroma, spectral flatness, spectral bandwidth, spectral roll-off, RMS energy, spectral centroid, zero-crossing rate, and onset showed high values, in that order. The highest-valued MFCC had a value of 0.207171. Subsequently, Δ2-MFCC had a value of 0.149195, Δ-MFCC had a value of 0.099828, and spectral contrast had a value of 0.090616. These top four features made up the feature set that this study proposed. After training the combined ResNet-50 and DNN model, the result had an accuracy of 0.96, a sensitivity of 0.95, a specificity of 0.96, and a precision of 0.95. Using this model, an application for Android was developed so that many people could use it for COVID-19 testing. The COVID-19 test model using cough sounds, the result of this study, has a simpler procedure and lower cost than the polymerase chain reaction (PCR) test that analyzes genes. Moreover, it is expected that this application will be a useful tool for those who are unable to do a PCR test, as it is difficult to insert a cotton swab into the nasopharynx due to anatomical or medical issues. In future studies, the model can be upgraded by using not only cough sound data but also clinical information data, including information on fever, headache, and other symptoms. In addition, if more quality cough sound data are collected and utilised, improved results can be expected.
Author Contributions
Conceptualization, S.-P.L.; methodology, S.K. and J.-Y.B.; investigation, S.K. and J.-Y.B.; writing—original draft preparation, S.K.; writing—review and editing, S.-P.L.; project administration, S.-P.L. All authors have read and agreed to the published version of the manuscript.
Funding
This work was supported by Sangmyung University.
Institutional Review Board Statement
Not applicable.
Informed Consent Statement
Informed consent was obtained from all subjects involved in the study.
Data Availability Statement
Experiments used publicly available datasets.
Acknowledgments
This work was supported by the 2022 Research Grant from Sangmyung University.
Conflicts of Interest
The authors declare no conflict of interest.
Abbreviation
| AI | Artificial intelligence |
| ANN | Artificial neural network |
| ANOVA | Analysis of variance |
| AUC | Area under the ROC curve |
| CT | Computed tomography |
| DNN | Deep neural network |
| FN | False negative |
| FP | False positive |
| IP | Internet protocol |
| KNN | K-Nearest neighbors |
| MFCC | Mel frequency cepstral coefficients |
| PCM | Pulse code modulation |
| PCR | Polymerase chain reaction |
| RMS | Root mean square |
| RNN | Recurrent neural network |
| ROC | Receiver operating characteristic |
| RT-PCR | Reverse transcription polymerase chain reaction |
| SVM | Support vector machine |
| TCP | Transmission control protocol |
| TN | True negative |
| TP | True positive |
References
- IHME COVID-19 Forecasting Team. Modeling COVID-19 scenarios for the United States. Nat. Med. 2021, 27, 94–105. [Google Scholar] [CrossRef]
- Ma, W.; Zhao, Y.; Guo, L.; Chen, Y.Q. Qualitative and quantitative analysis of the COVID-19 pandemic by a two-side fractional-order compartmental model. ISA Trans. 2022, 124, 144–156. [Google Scholar] [CrossRef] [PubMed]
- Baleanu, D.; Mohammadi, H.; Rezapour, S. A fractional differential equation model for the COVID-19 transmission by using the Caputo–Fabrizio derivative. Adv. Differ. Equ. 2020, 299, 1–27. [Google Scholar] [CrossRef] [PubMed]
- Tahamtan, A.; Ardebili, A. Real-time RT-PCR in COVID-19 detection: Issues affecting the results. Expert Rev. Mol. Diagn. 2020, 20, 453–454. [Google Scholar] [CrossRef]
- Luz, E.; Silva, P.; Silva, R.; Silva, L.; Guimarães, J.; Miozzo, G.; Moreira, G.; Menotti, D. Towards an effective and efficient deep learning model for COVID-19 patterns detection in X-ray images. Res. Biomed. Eng. 2022, 38, 149–162. [Google Scholar] [CrossRef]
- Alshazly, H.; Linse, C.; Barth, E.; Martinetz, T. Explainable COVID-19 detection using chest CT scans and deep learning. Sensors 2021, 21, 455. [Google Scholar] [CrossRef] [PubMed]
- Sakr, R.; Ghsoub, C.; Rbeiz, C.; Lattouf, V.; Riachy, R.; Haddad, C.; Zoghbi, M. COVID-19 detection by dogs: From physiology to field application—A review article. Postgrad. Med. J. 2022, 98, 212–218. [Google Scholar] [CrossRef] [PubMed]
- Quer, G.; Radin, J.M.; Gadaleta, M.; Baca-Motes, K.; Ariniello, L.; Ramos, E.; Kheterpal, V.; Topol, E.J.; Steinhubl, S.R. Wearable sensor data and self-reported symptoms for COVID-19 detection. Nat. Med. 2021, 27, 73–77. [Google Scholar] [CrossRef]
- Gorji, F.; Shafiekhani, S.; Namdar, P.; Abdollahzade, S.; Rafiei, S. Machine learning-based COVID-19 diagnosis by demographic characteristics and clinical data. Adv. Respir. Med. 2022, 90, 171–183. [Google Scholar] [CrossRef]
- Agbley, B.L.Y.; Li, J.; Haq, A.; Cobbinah, B.; Kulevome, D.; Agbefu, P.A.; Eleeza, B. Wavelet-based cough signal decomposition for multimodal classification. In Proceedings of the 2020 17th International Computer Conference on Wavelet Active Media Technology and Information Processing (ICCWAMTIP), Chengdu, China, 18–20 December 2020; IEEE: Piscataway, NJ, USA, 2021; pp. 5–9. [Google Scholar] [CrossRef]
- Laguarta, J.; Hueto, F.; Subirana, B. COVID-19 artificial intelligence diagnosis using only cough recordings. IEEE Open J. Eng. Med. Biol. 2020, 1, 275–281. [Google Scholar] [CrossRef]
- Coppock, H.; Gaskell, A.; Tzirakis, P.; Baird, A.; Jones, L.; Schuller, B. End-to-end convolutional neural network enables COVID-19 detection from breath and cough audio: A pilot study. BMJ Innov. 2021, 7, 356–362. [Google Scholar] [CrossRef] [PubMed]
- Chetupalli, S.R.; Krishnan, P.; Sharma, N.; Muguli, A.; Kumar, R.; Nanda, V.; Pinto, L.M.; Ghosh, P.K.; Ganapathy, S. Multi-modal point-of-care diagnostics for COVID-19 based on acoustics and symptoms. arXiv 2021, arXiv:2106.00639. [Google Scholar] [CrossRef]
- Mohammed, E.A.; Keyhani, M.; Sanati-Nezhad, A.; Hejazi, S.H.; Far, B.H. An ensemble learning approach to digital corona virus preliminary screening from cough sounds. Sci. Rep. 2021, 11, 15404. [Google Scholar] [CrossRef] [PubMed]
- Tris Atmaja, B.; Sasou, A. Cross-dataset COVID-19 Transfer Learning with Cough Detection, Cough Segmentation, and Data Augmentation. arXiv 2022, arXiv:2210.05843. [Google Scholar] [CrossRef]
- Mahanta, S.K.; Kaushik, D.; Van Truong, H.; Jain, S.; Guha, K. COVID-19 diagnosis from cough acoustics using convnets and data augmentation. In Proceedings of the 2021 First International Conference on Advances in Computing and Future Communication Technologies (ICACFCT), Meerut, India, 16–17 December 2021; IEEE: Piscataway, NJ, USA, 2022; pp. 33–38. [Google Scholar] [CrossRef]
- Sunitha, G.; Arunachalam, R.; Abd-Elnaby, M.; Eid, M.M.; Rashed, A.N.Z. A comparative analysis of deep neural network architectures for the dynamic diagnosis of COVID-19 based on acoustic cough features. Int. J. Imaging Syst. Technol. 2022, 32, 1433–1446. [Google Scholar] [CrossRef]
- Sabet, M.; Ramezani, A.; Ghasemi, S.M. COVID-19 Detection in Cough Audio Dataset Using Deep Learning Model. In Proceedings of the 2022 8th International Conference on Control, Instrumentation and Automation (ICCIA), Tehran, Iran, 2–3 March 2022; IEEE: Piscataway, NJ, USA, 2022; pp. 1–5. [Google Scholar] [CrossRef]
- Arif, A.; Alanazi, E.; Zeb, A.; Qureshi, W.S. Analysis of rule-based and shallow statistical models for COVID-19 cough detection for a preliminary diagnosis. In Proceedings of the 2022 13th Asian Control Conference (ASCC), Jeju, Republic of Korea, 4–7 May 2022; IEEE: Piscataway, NJ, USA, 2022; pp. 465–469. [Google Scholar] [CrossRef]
- Brown, C.; Chauhan, J.; Grammenos, A.; Han, J.; Hasthanasombat, A.; Spathis, D.; Xia, T.; Cicuta, P.; Mascolo, C. Exploring automatic diagnosis of COVID-19 from crowdsourced respiratory sound data. arXiv 2020, arXiv:2006.05919. [Google Scholar] [CrossRef]
- Feng, K.; He, F.; Steinmann, J.; Demirkiran, I. Deep-learning based approach to identify COVID-19. In Proceedings of the Southeast Conference 2021, Atlanta, GA, USA, 10–13 March 2021; IEEE: Piscataway, NJ, USA, 2021; pp. 1–4. [Google Scholar] [CrossRef]
- Fakhry, A.; Jiang, X.; Xiao, J.; Chaudhari, G.; Han, A. A multi-branch deep learning network for automated detection of COVID-19. In Proceedings of the 22nd Annual Conference of the International Speech Communication Association 2021, Brno, Czechi, 30 August–3 September 2021; pp. 3641–3645. [Google Scholar] [CrossRef]
- Son, M.J.; Lee, S.P. COVID-19 Diagnosis from Crowdsourced Cough Sound Data. Appl. Sci. 2022, 12, 1795. [Google Scholar] [CrossRef]
- Muda, L.; Begam, M.; Elamvazuthi, I. Voice recognition algorithms using mel frequency cepstral coefficient (MFCC) and dynamic time warping (DTW) techniques. arXiv 2010, arXiv:1003.4083. [Google Scholar] [CrossRef]
- Sharma, N.; Krishnan, P.; Kumar, R.; Ramoji, S.; Chetupalli, S.R.; Ghosh, P.K.; Ganapathy, S. Coswara--a database of breathing, cough, and voice sounds for COVID-19 diagnosis. arXiv 2020, arXiv:2005.10548. [Google Scholar] [CrossRef]
- Chaudhari, G.; Jiang, X.; Fakhry, A.; Han, A.; Xiao, J.; Shen, S.; Khanzada, A. Virufy: Global applicability of crowdsourced and clinical datasets for AI detection of COVID-19 from cough. arXiv 2020, arXiv:2011.13320. [Google Scholar] [CrossRef]
- Orlandic, L.; Teijeiro, T.; Atienza, D. The COUGHVID crowdsourcing dataset, a corpus for the study of large-scale cough analysis algorithms. Sci. Data 2021, 8, 156. [Google Scholar] [CrossRef] [PubMed]
- Kailath, T. The divergence and Bhattacharyya distance measures in signal selection. IEEE Trans. Commun. Technol. 1967, 15, 52–60. [Google Scholar] [CrossRef]
- He, K.; Zhang, X.; Ren, S.; Sun, J. Deep residual learning for image recognition. In Proceedings of the IEEE conference on computer vision and pattern recognition, Las Vegas, NV, USA, 27–30 June 2016; pp. 770–778. [Google Scholar]
- Dan, E. Github. Available online: https://github.com/tensorflow/models/tree/master/research/audioset/vggish (accessed on 9 June 2021).
- Librosa. Available online: https://librosa.org (accessed on 13 December 2022).
- Android Developers. Available online: https://developer.android.com/reference/android/media/AudioRecord (accessed on 13 July 2022).
- Android Developers. Available online: https://developer.android.com/reference/android/media/AudioTrack (accessed on 13 July 2022).

Disclaimer/Publisher’s Note: The statements, opinions and data contained in all publications are solely those of the individual author(s) and contributor(s) and not of MDPI and/or the editor(s). MDPI and/or the editor(s) disclaim responsibility for any injury to people or property resulting from any ideas, methods, instructions or products referred to in the content. |
© 2023 by the authors. Licensee MDPI, Basel, Switzerland. This article is an open access article distributed under the terms and conditions of the Creative Commons Attribution (CC BY) license (https://creativecommons.org/licenses/by/4.0/).