Abstract
Background: The diagnosis and therapy of heart failure are guided mainly by a single imaging parameter, the left ventricular ejection fraction (LVEF). Recent studies have reported on the value of machine learning in characterising the various phenotypes of heart failure patients. Therefore, this study aims to use unsupervised machine learning algorithms to phenotype heart failure patients into different clusters using multiple clinical parameters. Methods: Seven unsupervised machine learning clustering algorithms were used to cluster heart failure patients hospitalised with acute and chronic heart failure. Results: The agglomerative clustering algorithm identified three clusters with a silhouette score of 0.72. Cluster 1 (uraemic cluster) comprised 229 (36.0%) patients with a mean age of 56.2 ± 17.2 years and a serum urea of 14.5 ± 31.3 mmol/L. Cluster 2 (hypotensive cluster) comprised 117 (18.4%) patients with a minimum systolic and diastolic blood pressure of 91 and 60 mmHg, respectively. In cluster 3 (congestive cluster), patients predominantly had symptoms of fluid overload, and 93 (64.6%) patients had ascites. Among the 636 heart failure patients studied, the median LVEF was 32% (interquartile range: 25–45), and the rate of in-hospital all-cause mortality was 14.5%. Systolic and diastolic blood pressure, age, and the LVEF had the most substantial impact on discriminating between the three clusters. Conclusions: Clinicians without access to echocardiography could potentially rely on blood pressure measurements and age to risk stratify heart failure patients. However, larger prospective studies are mandatory for the validation of these clinical parameters.
1. Introduction
Unsupervised machine learning algorithms autonomously learn patterns in a dataset without human guidance or input. For example, clustering is an unsupervised machine learning technique that groups data points with similar attributes. A wide spectrum of algorithms are used to cluster data using dimension reduction, partitioning, hierarchical, density-based, and model-based methods [1]. Unsupervised machine algorithms may reveal risk factors in patients with complex clinical syndromes such as heart failure, a clinical syndrome characterised by a constellation of symptoms and signs of fluid overload, mainly in patients with underlying cardiovascular disease. The global prevalence and incidence of heart failure continue to rise to the extent that heart failure has been declared a global pandemic [2]. Therefore, innovative strategies that may assist in improving the management of heart failure patients should be sought.
The current approach to the diagnosis, risk stratification, management, and prognosis of heart failure is fundamentally determined by a single imaging parameter, the left ventricular ejection fraction (LVEF) [3]. The LVEF is a measurement that estimates the fraction of blood volume ejected by the heart’s left ventricle with each contraction [4]. Among a wide range of non-invasive cardiac imaging modalities, the echocardiogram is one of the widely applied techniques for measuring the LVEF. However, the results obtained are generally influenced by the experience of the echocardiogram operator and the patient’s body habitus. In addition, the echocardiography machine is not readily accessible in most hospitals in low-and-middle-income countries (LMICs). Therefore, its use is mainly restricted to the private sector and state-owned hospitals affiliated with academic institutions.
A recent systematic review identified 81 articles reporting the utility of both supervised and unsupervised machine learning algorithms in heart failure. Of the articles reviewed, 11 (13%) studies used classification or clustering algorithms, and 25 (31%) used machine learning for the detection of the onset of heart failure, 18 (21%) for predicting rehospitalisation, 20 (26%) for predicting mortality, and the rest (6%) for predicting outcomes and response to implantable cardiac devices [5]. Another systematic review identified 27 studies using unsupervised machine learning for heart failure subtype definition [6]. However, there are limited or no papers published from LMICs describing heart failure phenotypes using machine learning algorithms. This study aims to describe baseline demographic and clinical characteristics of heart failure patients hospitalised in a tertiary-level hospital in Johannesburg, South Africa. Furthermore, this study describes the utility of unsupervised machine learning in clustering heart failure patients using a constellation of clinical parameters, instead of a single imaging parameter, the LVEF.
2. Methods
2.1. Study Design and Participants
Data were exported from the PMRCardio database, a Microsoft Structured Query Language Server Management Studio (version 15.0.18330.0) that stores clinical data of patients hospitalised in cardiology wards at the Charlotte Maxeke Johannesburg Academic Hospital (CMJAH, Johannesburg, South Africa). The CMJAH is a quaternary-level state-owned institution equipped with a cardiac intensive care unit, a cardiac catheterisation and electrophysiology laboratory, and outpatient services. All acutely and chronically ill patients with cardiovascular diseases are hospitalised in cardiac wards. Their admission data are stored digitally in the PMRCardio database by registrars or residents rotating in the cardiology wards. Clinical parameters available in the dataset (features) include demographic data, clinical history and examination findings, laboratory indices, electrocardiogram (ECG), echocardiogram, angiography, and in-hospital all-cause mortality status.
The tenth revision of the international classification of diseases (ICD-10) code was used to select patients diagnosed with heart failure. The following ICD-10 diagnoses were used to select patients included in the analysis: “heart failure unspecified” or “congestive heart failure or “left ventricular failure”, or “dilated cardiomyopathy”, or “ischaemic cardiomyopathy.” Heart failure patients who are 18 years of age and older with a documented left ventricular ejection fraction (LVEF) hospitalised between October 2009 and December 2018 were included.
Data exported from the database were merged into a single Microsoft Excel Sheet. All retrospective patient data used in the final analysis were further verified by comparing hard copies of medical records with electronic data. Patients were subsequently stratified into three groups based on the baseline LVEF: heart failure with reduced ejection fraction—HFrEF (LVEF < 40%), heart failure with midrange ejection fraction—HFmEF (LVEF = 40–49%), and heart failure with preserved ejection fraction—HFpEF (LVEF ≥ 50%) [3].
Admission biochemical results were obtained from the National Health Laboratory Service (NHLS, Johannesburg, South Africa). Approval to conduct the study was received from the University of the Witwatersrand Human Research Ethics Committee (clearance certificate number: M190515). Permission was also obtained from NHLS senior authorities.
2.2. Descriptive Statistics
Descriptive statistics were used to compare clinical parameters in the LVEF categories and clusters. Categorical features are expressed as numbers and percentages and were compared using the Chi-square test, and continuous features with a normal distribution were expressed as mean and standard deviation. The median and interquartile ranges (IQR) were used for continuous features with a non-normal distribution. We compared continuous features in each LVEF category and cluster using the one-way analysis of variance (ANOVA). Confidence intervals were calculated at 95% interval levels, and differences were considered statistically significant at a p-value < 0.05. The Tukey test (or Tukey procedure), also called Tukey’s Honest Significant Difference post hoc analysis, was performed if ANOVA showed statistically significant differences when comparing the means in the LVEF categories and clusters. Python version 3.10.0 and Jupyter notebook (version 6.0.3) were used for descriptive data analysis and for the clustering of heart failure patients using various unsupervised machine learning algorithms. Kaplan–Meier survival curves were plotted to evaluate survival in each cluster.
2.3. Data Pre-Processing for Clustering of Heart Failure Patients
Packages and libraries required for data analysis and visualisation were imported into a Jupyter notebook (version 6.0.3). These included sklearn (version 1.0.2), pandas (version 1.3.5), numpy (version 1.21.6), matplotlib (version 3.1.2), seaborn (version 0.11.2), statsmodels (version 0.13.2), lifelines (version 0.27.0), and researchpy (version 0.3.2). Features with more than 20% missing values, patient identifiers, and column data without variation were removed from the dataset. The remaining columns with missing data were imputed using the mean or median. Categorical features with missing values were ascribed with zero. The data were subsequently scaled, standardised, and normalised prior to the clustering of patients. The Jupyter notebook script is attached as a Supplementary file.
2.4. Cluster Analysis
Clustering is a form of unsupervised machine learning where data are categorised into groups based on similarities within data points in each group. Before clustering the heart failure data, the feature “mortality” that characterises the vitality status of each patient upon discharge (dead or alive) from the dataset was removed. The rationale for removing the outcome “mortality” lies behind the premise that unsupervised machine learning clusters unlabelled data without a clearly defined outcome. As a result, mortality did not influence the creation of clusters. Clustering was conducted using a dataset with and without the LVEF. This was carried out to evaluate the true importance of the LVEF in categorising heart failure patients.
Seven clustering algorithms were used to cluster heart failure patients: a partitioning method (K-prototype and K-means), a hierarchical method (agglomerative and Balanced Iterative Reducing and Clustering Hierarchies—BIRCH), density-based (Ordering Points To Identify the Clustering Structure—OPTICS and density-based spatial clustering of applications with noise—DBSCAN), and a model-based clustering method, a Gaussian mixture model.
Distance-based algorithms use K-means, K-modes, or both to estimate the distance between data points. Agglomerative clustering, also referred to a “bottom-up” approach, initially treats each observation (patient) as a single cluster. The algorithm then successively agglomerates pairs of clusters until a single cluster is formed.
The DBSCAN algorithm groups data points close to each other based on the density of data points in a particular region, marking outliers as points in a low-density region. The Gaussian mixture model uses multiple Gaussian distributions to identify various clusters, with the assumption that each modal distribution represents a particular structure.
Using the dataset that includes the LVEF, agglomerative clustering was chosen as the best algorithm for clustering heart failure patients since it achieved the highest silhouette score. Using the ward linkage method, the agglomerative clustering algorithm identified three clusters with a silhouette score of 0.72 (Table 1). A silhouette score measures the goodness of fit of clusters by measuring the distance between points within a cluster and spacing between each cluster. This score ranges between −1 and +1, where the best score, +1, suggests that clusters are far from each other and −1 infers that clusters are poorly describing patterns in the dataset. A dendrogram was also plotted to represent the clusters visually. Shapley additive explanations (SHAP) was used to identify and rank features that played a prominent role in the segmentation of the heart failure cohort into three clusters using the agglomerative clustering algorithm. Both the DBSCAN and OPTICS algorithms were unsuccessful in clustering the data.

Table 1.
Number of clusters vs. silhouette score for the algorithms used in the study.
After removing the LVEF from the dataset, the Gaussian mixture model had the highest silhouette score of 0.30. This silhouette score corresponded to three clusters. These clusters were subsequently compared with the LVEF categories (HFrEF, HFmEF, and HFpEF). The SHAP values for the Gaussian mixture model were also generated.
3. Results
3.1. Baseline Demographics and Clinical Characteristics
Between October 2009 and December 2018, there were 10737 admissions, of which 4730 were heart failure-related (Figure 1). After excluding patients with incomplete data, particularly the LVEF, the final heart failure cohort comprised 636 patients, of which 352 (55.3%) were males. The mean age in the entire cohort was 55.6 ± 16.9 years, and patients with HFmEF were older, with a mean age of 58.0 ± 17.1 years. The baseline median LVEF in the entire study cohort was 32% (25–45), 409 (64.3%) had a LVEF less than 40% (HFrEF), 91 (14.3%) had a LVEF between 40 and 49% (HFmEF), and 136 (21.4%) had a LVEF ≥ 50% (HFpEF). Heart failure patients had a mean systolic and diastolic pressure of 128 ± 30.1 mmHg and 82 ± 19.7 mmHg, respectively. The rest of the baseline clinical characteristics in the study cohort are depicted in Table 2.
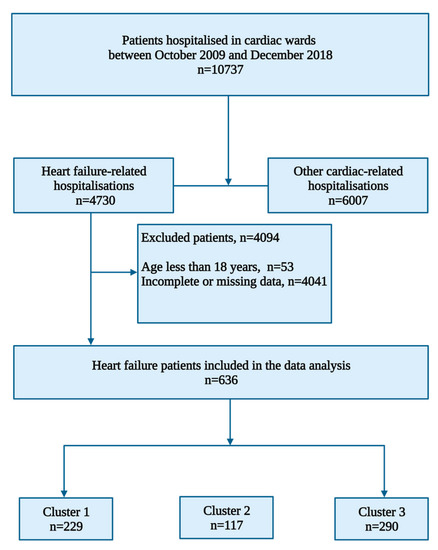
Figure 1.
Flow chart showing heart failure patient selection for clustering.
Table 2.
Baseline demographic and clinical characteristics of the study patients stratified according to the left ventricular ejection fraction.
3.2. Cluster Analysis
The agglomerative clustering hierarchical algorithm identified three clusters of heart failure patients (Figure 2). Cluster 1 (uraemic cluster) comprised 229 (36.0%) patients with a mean age of 56.2 ± 17.2 years (Table 3). Patients in Cluster 1 had a relatively higher mean LVEF of 45 ± 17.6 (p < 0.001). Forty-six (50.5%) patients with HFmEF were in cluster 1 and 83 (61.0%) patients with HFpEF were also in cluster 1. The patients in the uraemic cluster also had a smaller mean left ventricular internal diameter in end-systole (LVIDs) of 4.1 ± 1.3 cm (p < 0.001) and mean left ventricular internal diameter end-diastole (LVIDd) of 5.2 ± 1.1 cm.
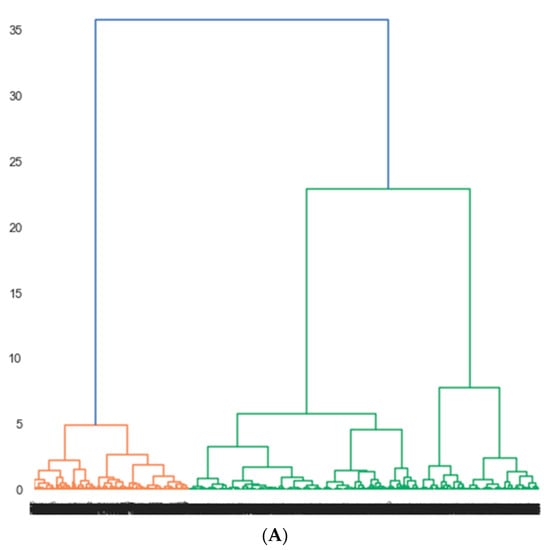
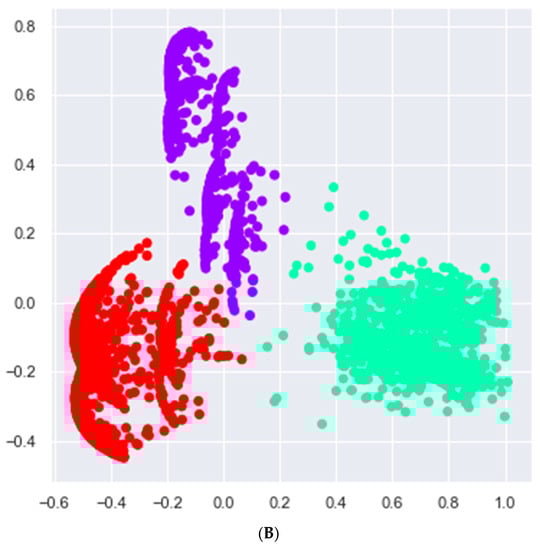
Figure 2.
Clusters of heart failure patients identified by agglomerative clustering. (A) Dendrogram showing three clusters. Cluster 1 (orange), cluster 2 and 3 (green). Three clusters were selected based on the silhouette score of 0.7, which is a measure of goodness of fit of patients into each cluster. The x-axis shows various clusters, and the y-axis shows the average distance between clusters. (B) A two-dimensional scatterplot of the three clusters of heart failure patients identified by the agglomerative clustering algorithm. The x- and y-axis represent principal component 1 and 2, respectively. Each component represents a constellation of clinical features that were used to cluster data points.
Table 3.
Baseline demographic and clinical characteristics of the study patients stratified according to clusters.
Cluster 2 (hypotensive) comprised 117 (18.4%) patients with a mean age of 54.3 ± 15.9 years. Patients in cluster 2 had a lower mean systolic and diastolic blood pressure of 117 ± 26.5 (p = 0.0135) and 76 ± 16.8 mmHg, respectively. The minimum systolic and diastolic blood pressure were 91 and 60 mmHg, respectively. In cluster 3 (congestive cluster), there was a predominance of patients with symptoms of fluid overload, and 93 (64.6%) patients had ascites. A total of 216 (52.8%) of patients with HFrEF were in cluster 3. The post hoc analyses for all statistically significant values are depicted in Table 4 and Table 5.
Table 4.
Post hoc analysis (showing p-values) of clinical parameters in the study patients stratified according to the left ventricular ejection fraction.
Table 5.
Post hoc analysis (showing p-values) of clinical parameters in the study patients stratified according to clusters.
The SHAP values were used to estimate the contribution of each feature in the clustering of heart failure patients. Both low and high values of systolic blood pressure, age, the LVEF, and diastolic blood pressure were the top four features that played a role in discriminating between the three clusters (Figure 3). The mean SHAP value of the systolic blood pressure (SHAP value = 0.36) was approximately 2.6 times higher than that of the LVEF (SHAP value = 0.14).
Figure 3.
Features identified with Shapley additive explanations (SHAP) that played a role in the segmentation of the heart failure cohort into three clusters using the agglomerative clustering algorithm. (A) Bar plot depicting the importance of each feature. The higher the mean weight, the higher the contribution of the feature. (B) Bee swarm plot showing the contribution of the top eight features. Each dot represents a single patient. Red and blue refer to high and low feature values, respectively. Both high and low values of the systolic and diastolic blood pressure, age, and LVEF contributed towards clustering patients. Hb = haemoglobin; LVEF = left ventricular ejection fraction; S2 = second heart sound.
3.3. Outcomes
Among the 636 patients hospitalised with heart failure, 92 patients died. The rate of in-hospital all-cause mortality was 14.5%. The rate of death was the highest in patients with HFrEF (63%), followed by patients with HFpEF (19.6%) and HFmEF (17.4%). The median length of stay in the hospital in the entire heart failure cohort was 6 (IQR: 4–11) days, and it did not differ based on the LVEF category (p = 0.4441).
Cluster analysis revealed a higher mortality rate (39.1%) in patients in cluster 3 (congested cluster), followed by cluster 2, the hypotensive cluster (38%), and cluster 1 (22.8%), the uraemic cluster. Patients in cluster 3 were hospitalised for 9.0 ± 7.8 days, whereas patients in cluster 1 and 2 were both hospitalised for a mean duration of 9.6 ± 8.9 and 8.6 ± 7.7 days, respectively. Survival was shorter in the congestive cluster, and none of the patients in this cluster survived beyond 42 days (log rank test: p-value 0.39) (Figure 4).
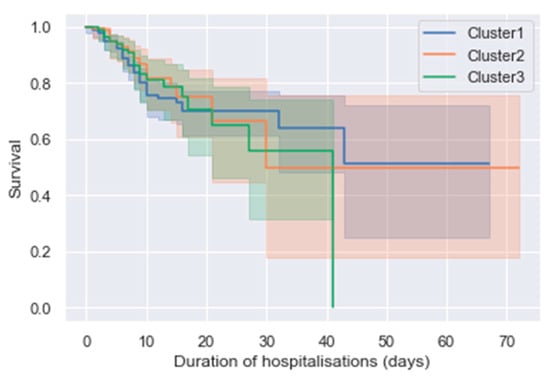
Figure 4.
Kaplan–Meier survival curves for the three clusters of heart failure patients. The x-axis shows the duration of hospitalisation in days, and the survival rate is on the y-axis. Patients in cluster 3 (congested cluster) did not survive beyond 42 days, while the survival rate in cluster 1 and 2 is comparable.
3.4. Cluster Analysis on a Dataset without the Left Ventricular Ejection Fraction
Using a dataset without the LVEF, the algorithm that achieved the highest silhouette score of 0.37 was the Gaussian mixture model with seven clusters (Table 6). The most distinct clinical findings were venous hypertension in cluster 1, with 100% of patients in the cluster hospitalised with raised jugular venous pressure.
Table 6.
Baseline demographic and clinical characteristics of the study patients stratified according to clusters identified by the Gaussian mixture model using the dataset without the left ventricular ejection parameter.
Cluster 6 (hyponatraemic cluster) had the lowest mean serum sodium of 138 ± 5.8 (confidence interval: 137–138) mmol/L, while cluster 7 (hyperuraemic cluster) had 118 patients and the highest mean urea of 16.8 ± 39.8 mmol/L. Clinical parameters that had a significant impact on model output included systolic blood pressure (mean SHAP value = 0.27), diastolic blood pressure (mean SHAP value = 0.16), and age (mean SHAP value = 0.14). Serum sodium levels were the only clinical parameter that showed statistical significance on the post hoc analysis, confirming low sodium levels in cluster 6.
4. Discussion
In this study, we used retrospective data of consecutive patients hospitalised with new-onset heart failure symptoms or decompensated chronic heart failure to describe demographic and clinical characteristics and categorise heart failure phenotypes using unsupervised machine algorithms. The mean age in our cohort was 55.6 ± 16.9 years, and 14.5% of all patients hospitalised with the diagnosis of heart failure died.
Heart failure is commonly associated with poorer outcomes in LMICs, and the onset of heart failure occurs at a younger age of 53 years, affecting economic productivity in this region [7,8]. The most plausible explanations for poorer outcomes include, but are not limited to, the unavailability of life-prolonging therapy such as cardiac resynchronisation defibrillators and heart transplant services. Furthermore, our hospital is a quartenary-level institution, implying that there might be a delay in the referral of patients, resulting our patients being hospitalised with advanced stages of heart failure. The younger age of onset may be partly related to the dominance of non-ischaemic cardiomyopathy, possibly with a genetic aetiology, considering that in sub-Saharan Africa (SSA), the most common cardiovascular diseases are still hypertensive heart disease, cardiomyopathies, rheumatic heart disease, and congenital heart disease [7,8], unlike in high-income countries, where ischaemic heart disease is the primary cause of heart failure.
After subjecting our heart failure dataset to unsupervised machine learning algorithms, the agglomerative clustering algorithm identified three clusters: the uraemic cluster, with relatively high urea levels; the hypotensive cluster, with lower systolic and diastolic blood pressure; and the congested cluster, with a high burden of heart failure symptoms and signs of fluid overload. The uraemic cluster had slightly older patients, potentially with underlying acute kidney injury or chronic renal dysfunction.
The heart is responsible for maintaining adequate perfusion to all organs. Low systolic and diastolic pressure were a dominant finding in cluster 2, the hypotensive cluster. The reduction in myocardial contractility in this cluster likely caused a decrease in cardiac output, systemic vasoconstriction, and hypotension in the hypotensive cluster [9]. This finding resonates with the importance of preventing hypotension in heart failure patients, considering that hypoperfusion may lead to cardiogenic shock and subsequent mortality. The in-hospital all-cause mortality rate in the hypotensive cluster was 38%, similar to the congestive cluster, with the highest mortality rate of 39.1%. It is well established that patients who present with severe symptoms of acute decompensated heart failure experience poor outcomes, suggesting the need to expedite their management, irrespective of the LVEF.
Most studies have confirmed the utility of supervised machine learning algorithms for classification tasks [10,11,12,13,14,15,16,17,18]. However, few studies have since been published on phenotyping heart failure patients using unsupervised machine learning algorithms [19,20,21,22,23,24,25]. In a paper summarising 40 studies on heart failure subtype definition using unsupervised machine learning, hierarchical clustering was used in 25 studies. Most clusters were derived based on heart failure symptoms only (n = 20) [6]. Harada et al. used K-Means clustering to stratify heart failure patients with an LVEF above 40% and found four distinct groups. They concluded that older patients might be at a higher risk of right ventricular afterload mismatch and renal dysfunction [26]. In addition, in Russia, 25952 heart failure patients were clustered using K-Means, and 15 distinct heart failure phenotypes were identified. The clusters identified in the study from Russia were characterised and labelled based on comorbidities and causes of heart failure only.
Clustering algorithms have the potential to unravel distinct phenotypes of heart failure that may assist clinicians in triaging or risk profiling patients, therefore positively influencing the management of heart failure patients. Our study is unique since it offers insights into the role of machine learning in better understanding heart failure phenotypes in our region. The systolic blood pressure had a 2.6 times higher impact on differentiating between clusters, followed by the age at the time of admission with a mean SHAP value of 0.16, and the LVEF had a lower SHAP value of 0.14. These findings suggest that blood pressure and age may play a role in the diagnosis, risk stratification, and management of heart failure patients in centres without access to echocardiography. Despite removing the LVEF from the dataset, both systolic and diastolic blood pressure still had a significant impact on model output.
Each institution should attempt to cluster its heart failure patients and discover new clinical patterns. For example, our study’s findings could motivate for the design and implementation of protocols that guide the management of heart failure patients, specifically with hyperuricaemia, hypotension, and severe symptoms of fluid overload in our institution. However, we are mindful of the fact that clusters formed will differ across regions, partly due to the variation in the causes of heart failure and the availability of clinical parameters used to create clusters.
Newer unsupervised machine learning techniques should take data analysis to the next level by creating a code that allows algorithms to interrogate the data and predict the risk of complications. Future studies should use larger, prospective cohorts of patients and subsequently train and test the performance of clustering algorithms using new data that were not used to create original clusters of patients. Most importantly, the prognostic value of the unsupervised machine learning algorithms should be verified by measuring clinical outcomes and comparing them with outcomes obtained from patients classified solely with the LVEF.
A larger dataset would have provided more perspective into the characteristics of patients in each cluster. The study is also limited by its retrospective nature and was a single-centre study. As such, the findings from this study may not be generalisable to all heart failures treated in LMICs. In addition, pertinent features such as the cause of mortality were not available in the dataset. Most clinical history findings were documented in free text format and were not analysed. Furthermore, a significant number of patients diagnosed with heart failure with missing echocardiogram findings were not included in the analysis. Moreover, discharge oral medications were not captured for all patients, and were not included in the final analysis. Overall, the lack of electronic health records and dedicated data capturers are major hindrances in LMICs, such that patients may only partially benefit from the capabilities of artificial intelligence.
5. Conclusions
Agglomerative clustering is an unsupervised machine learning algorithm that identified three clusters of heart failure phenotypes in Johannesburg. The most important features that had an impact on the creation of clusters were blood pressure, age, and the LVEF. Clinicians without access to echocardiography could rely on blood pressure measurements and age to risk stratify and identify heart failure patients that require referral to centres equipped with cardiology services. However, larger prospective studies are mandatory for validating the role of these clinical parameters.
Supplementary Materials
The following are available online at https://www.mdpi.com/article/10.3390/app13031509/s1, The Jupyter notebook script.
Author Contributions
Conceptualization, H.N., T.C. and D.M.; methodology, D.M., T.C. and H.N.; software, D.M. and T.C.; validation, T.C. and H.N.; formal analysis, D.M. and T.C. investigation, H.N., T.C. and D.M.; data curation, T.C. and D.M.; writing—original draft preparation, D.M.; writing—review and editing, H.N.; T.C.; E.K. and D.M; visualization, T.C. and D.M.; supervision, H.N. and T.C.; project administration, D.M.; funding acquisition, D.M. All authors have read and agreed to the published version of the manuscript.
Funding
D.M. was a full-time PhD student funded by the Bongani Mayosi Netcare Clinical Scholarship, the Discovery Academic Fellowship (Grant No. 03902), the Carnegie Corporation of New York (Grant No. b8749), the South African Heart Association, and the University of the Witwatersrand Chancellor’s Female Academic Leaders Fellowship (NPC) Grant.
Institutional Review Board Statement
The study was conducted in accordance with the Declaration of Helsinki, and approved by the University of the Witwatersrand Human Research Ethics Committee (protocol code M190515, 18/07/2019).
Informed Consent Statement
Patient consent was waived since the study entailed a retrospective chart review.
Data Availability Statement
Data is unavailable due to ethical restrictions.
Acknowledgments
The authors would like to thank Pravin Manga for implementing the PMRCardio database; the staff members in the Division of Cardiology at the CMJAH; Marheb Badianyama, Jenna Damelin, Ashlee Firer, Thakgalo Thibeng, Yemurai Muchenge, Michaela Gough, and Mpumelelo Ngadla, who assisted with verifying patient data before the analysis; and Karl Basson, Geethan Singh, and Ntuthuko Mngomezulu for assisting with the technical data queries.
Conflicts of Interest
EK has received speaker honorarium, travel assistance from Astra Zeneca, Servier, Novartis, and has been the head of ethics and guideline committee of the South African Heart Association. The rest of the authors declare no other competing interests.
References
- Jovel, J.; Greiner, R. An Introduction to Machine Learning Approaches for Biomedical Research. Front. Med. 2021, 8, 771607. [Google Scholar] [CrossRef] [PubMed]
- Ponikowski, P.; Anker, S.D.; AlHabib, K.F.; Cowie, M.R.; Force, T.L.; Hu, S.; Jaarsma, T.; Krum, H.; Rastogi, V.; Rohde, L.E.; et al. Heart failure: Preventing disease and death worldwide. ESC Heart Fail. 2014, 1, 4–25. [Google Scholar] [CrossRef] [PubMed]
- Ponikowski, P.; Voors, A.A.; Anker, S.D.; Bueno, H.; Cleland, J.G.; Coats, A.J.; Falk, V.; González-Juanatey, J.R.; Harjola, V.-P.; Jankowska, E.A.; et al. 2016 ESC Guidelines for the diagnosis and treatment of acute and chronic heart failure: The Task Force for the diagnosis and treatment of acute and chronic heart failure of the European Society of Cardiology (ESC). Developed with the special contribution of the Heart Failure Association (HFA) of the ESC. Eur. J. Heart Fail. 2016, 18, 891–975. [Google Scholar] [CrossRef] [PubMed]
- Kosaraju, A.; Goyal, A.; Grigorova, Y.; Makaryus, A.N. Left Ventricular Ejection Fraction. In StatPearls. Treasure Island (FL); StatPearls Publishing: Online, January 2022. Available online: https://www.ncbi.nlm.nih.gov/books/NBK459131/ (accessed on 1 July 2022).
- Jasinska-Piadlo, A.; Bond, R.; Biglarbeigi, P.; Brisk, R.; Campbell, P.; McEneaneny, D. What can machines learn about heart failure? A systematic literature review. Int. J. Data Sci. Anal. 2022, 13, 163–183. [Google Scholar] [CrossRef]
- Banerjee, A.; Chen, S.; Fatemifar, G.; Zeina, M.; Lumbers, R.T.; Mielke, J.; Gill, S.; Kotecha, D.; Freitag, D.F.; Denaxas, S.; et al. Machine learning for subtype definition and risk prediction in heart failure, acute coronary syndromes and atrial fibrillation: Systematic review of validity and clinical utility. BMC Med. 2021, 19, 85. [Google Scholar] [CrossRef] [PubMed]
- Dokainish, H.; Teo, K.; Zhu, J.; Roy, A.; AlHabib, K.F.; ElSayed, A.; Palileo-Villaneuva, L.; Lopez-Jaramillo, P.; Karaye, K.; Yusoff, K.; et al. Heart Failure in Africa, Asia, the Middle East and South America: The INTER-CHF study. Int. J. Cardiol. 2016, 204, 133–141. [Google Scholar] [CrossRef]
- Ajayi, A.A.; Sofowora, G.G.; Ladipo, G.O. Explaining Heart Failure Hyper-mortality in Sub Saharan Africa: Global Genomic and Environmental Contribution Review. J. Natl. Med. Assoc. 2020, 112, 141–157. [Google Scholar] [CrossRef]
- Van Diepen, S.; Katz, J.N.; Albert, N.M.; Henry, T.D.; Jacobs, A.K.; Kapur, N.K.; Kilic, A.; Menon, V.; Ohman, E.M.; Sweitzer, N.K.; et al. Contemporary Management of Cardiogenic Shock: A Scientific Statement from the American Heart Association. Circulation 2017, 136, e232–e268. [Google Scholar] [CrossRef]
- Kwon, J.M.; Kim, K.H.; Jeon, K.H.; Park, J. Deep learning for predicting in-hospital mortality among heart disease patients based on echocardiography. Echocardiography 2019, 36, 213–218. [Google Scholar] [CrossRef]
- Segar, M.W.; Jaeger, B.C.; Patel, K.V.; Nambi, V.; Ndumele, C.E.; Correa, A.; Butler, J.; Chandra, A.; Ayers, C.; Rao, S.; et al. Development and Validation of Machine Learning-Based Race-Specific Models to Predict 10-Year Risk of Heart Failure: A Multi-Cohort Analysis. Circulation 2021, 143, 2370–2383. [Google Scholar] [CrossRef]
- Su, Z.; Brecht, T.; O’Donovan, F.; Boussios, C.; Menon, V.; Gliklich, R.; Fonarow, G. Machine Learning Enhanced Predictions of Hospital Readmission or Death in Heart Failure. Circulation 2017, 136, A16941. [Google Scholar]
- Ahmad, T.; Lund, L.H.; Rao, P.; Ghosh, R.; Warier, P.; Vaccaro, B.; Dahlström, U.; O’Connor, C.M.; Felker, G.M.; Desai, N.R. Machine Learning Methods Improve Prognostication, Identify Clinically Distinct Phenotypes, and Detect Heterogeneity in Response to Therapy in a Large Cohort of Heart Failure Patients. J. Am. Heart Assoc. 2018, 7, e008081. [Google Scholar] [CrossRef]
- Shameer, K.; Johnson, K.W.; Yahi, A.; Miotto, R.; Li, L.I.; Ricks, D.; Jebakaran, J.; Kovatch, P.; Sengupta, P.P.; Gelijns, S.; et al. Predictive modeling of hospital readmission rates using electronic medical record-wide machine learning: A case-study using mount sinai heart failure cohort. Pac. Symp. Biocomput. 2017, 22, 276–287. [Google Scholar] [CrossRef]
- Golas, S.B.; Shibahara, T.; Agboola, S.; Otaki, H.; Sato, J.; Nakae, T.; Hisamitsu, T.; Kojima, G.; Felsted, J.; Kakarmath, S.; et al. A machine learning model to predict the risk of 30-day readmissions in patients with heart failure: A retrospective analysis of electronic medical records data. BMC Med. Inform. Decis. Mak. 2018, 18, 44. [Google Scholar] [CrossRef]
- Miao, F.; Cai, Y.P.; Zhang, Y.X.; Fan, X.M.; Li, Y. Predictive modeling of hospital mortality for patients with heart failure by using an improved random survival forest. IEEE Access 2018, 6, 7244–7253. [Google Scholar] [CrossRef]
- Meng, F.; Zhang, Z.; Hou, X.; Qian, Z.; Wang, Y.; Chen, Y.; Wang, Y.; Zhou, Y.; Chen, Z.; Zhang, X.; et al. Machine learning for prediction of sudden cardiac death in heart failure patients with low left ventricular ejection fraction: Study protocol for a retroprospective multicentre registry in China. BMJ Open 2019, 9, e023724. [Google Scholar] [CrossRef]
- Liu, W.; Stansbury, C.; Singh, K.; Ryan, A.M.; Sukul, D.; Mahmoudi, E.; Waljee, A.; Zhu, J.; Nallamothu, B.K. Predicting 30-day hospital readmissions using artificial neural networks with medical code embedding. PLoS ONE 2020, 15, e0221606. [Google Scholar] [CrossRef]
- Ahmad, T.; Pencina, M.J.; Schulte, P.J.; O’Brien, E.; Whellan, D.J.; Pina, I.L.; Kitzman, D.W.; Lee, K.L.; O’Connor, C.M.; Felker, G.M. Clinical implications of chronic heart failure phenotypes defined by cluster analysis. J. Am. Coll. Cardiol. 2014, 64, 1765–1774. [Google Scholar] [CrossRef]
- Ieva, F.; Paganoni, A.M.; Pietrabissa, T. Dynamic clustering of hazard functions: An application to disease progression in chronic heart failure. Health Care Manag. Sci. 2017, 20, 353–364. [Google Scholar] [CrossRef]
- Moser, D.K.; Lee, K.S.; Wu, J.-R.; Mudd-Martin, G.; Jaarsma, T.; Huang, T.-Y.; Fan, X.; Strömberg, A.; Lennie, T.A.; Riegel, B. Identification of symptom clusters among patients with heart failure: An international observational study. Int. J. Nurs. Stud. 2014, 51, 1366–1372. [Google Scholar] [CrossRef]
- Bose, E.; Radhakrishnan, K. Using Unsupervised Machine Learning to Identify Subgroups among Home Health Patients with Heart Failure Using Telehealth. Comput. Inform. Nurs. 2018, 36, 242–248. [Google Scholar] [CrossRef] [PubMed]
- Segar, M.W.; Patel, K.V.; Ayers, C.; Basit, M.; Tang, W.H.W.; Willett, D.; Berry, J.; Grodin, J.L.; Pandey, A. Phenomapping of patients with heart failure with preserved ejection fraction using machine learning-based unsupervised cluster analysis. Eur. J. Heart Fail. 2020, 22, 148–158. [Google Scholar] [CrossRef] [PubMed]
- Nouraei, H.; Nouraei, H.; Rabkin, S.W. Comparison of Unsupervised Machine Learning Approaches for Cluster Analysis to Define Subgroups of Heart Failure with Preserved Ejection Fraction with Different Outcomes. Bioengineering 2022, 9, 175. [Google Scholar] [CrossRef] [PubMed]
- Perry, A.; Loh, F.; Adamo, L.; Zhang, K.W.; Deych, E.; Foraker, R.; Mann, D.L. Unsupervised cluster analysis of patients with recovered left ventricular ejection fraction identifies unique clinical phenotypes. PLoS ONE 2021, 16, e0248317. [Google Scholar] [CrossRef]
- Harada, D.; Asanoi, H.; Noto, T.; Takagawa, J. Different Pathophysiology and Outcomes of Heart Failure with Preserved Ejection Fraction Stratified by K-Means Clustering. Front. Cardiovasc. Med. 2020, 7, 607760. [Google Scholar] [CrossRef]


Disclaimer/Publisher’s Note: The statements, opinions and data contained in all publications are solely those of the individual author(s) and contributor(s) and not of MDPI and/or the editor(s). MDPI and/or the editor(s) disclaim responsibility for any injury to people or property resulting from any ideas, methods, instructions or products referred to in the content. |
© 2023 by the authors. Licensee MDPI, Basel, Switzerland. This article is an open access article distributed under the terms and conditions of the Creative Commons Attribution (CC BY) license (https://creativecommons.org/licenses/by/4.0/).