Article

Corrosion Effects on the Mechanical Properties of Spun Pile Materials

1
Department of Civil Infrastructure Engineering, Faculty of Vocational, Institut Teknologi Sepuluh Nopember, Surabaya 60111, Indonesia
2
Research Center for Urban Safety and Security, Kobe University, Kobe City 657-8501, Japan
*
Author to whom correspondence should be addressed.
Appl. Sci. 2023, 13(3), 1507; https://doi.org/10.3390/app13031507
Submission received: 21 December 2022 / Revised: 17 January 2023 / Accepted: 20 January 2023 / Published: 23 January 2023
(This article belongs to the Special Issue Multi-Performance Analysis of Concrete from Life Cycle Perspective)

Abstract

:
Prestressed concrete piles with closed-ended circular hollow sections (spun piles) are sometimes used as foundations for pile-supported wharves. Due to a reduction in the rebar area, concrete compressive strength, yield strength of PC-bar, and bond strength between PC-bar and concrete, corrosion attacks typically lower the performance of spun piles in the marine environment. A comprehensive analysis of the corrosion effect on the mechanical properties of the spun pile materials is crucial to assess the performance of corroded spun plies. Using a three-dimensional finite element analysis (FEA), this study aimed to evaluate the impact of corrosion on the mechanical properties of the material used in spun pile construction. We simulated the effect of nonuniformly distributed corrosion products using a volumetric strain expansion over 0–75 years. The FEA results provided the stress–strain relationship of the corroded spun pile materials and the bond–slip relationship between the corroded PC-bar and concrete. We proposed equations for predicting the deterioration degree of the mechanical properties of corroded spun pile materials and compared them to those presented in previous studies. It was shown that the compressive strength of the corroded cover concrete decreased significantly after the corrosion degree reached 12%, which the previous research had not expected. The bond strength reduction was inverse exponential against the elapsed years after the corrosion degree reached 1.3%. Moreover, the yield strength of PC-bars decreased linearly with the increase in the corrosion degree.

1. Introduction

Spun piles or prestressed concrete piles with closed-ended circular hollow sections are widely used in the construction of pile-supported wharves (PSWs), which serve as the foundations for small feeder ports. Spun piles range from 7 to 15 m and have an outer diameter of 300–1200 mm [1]. High-grade prestressed concrete rebars (PC-bars) and helix-shaped transverse rebars are used in the spinning and pretensioning operations to create spun piles. Unfortunately, PSWs are highly susceptible to corrosion attacks from sea salt spray and repeated wetting and drying cycles, resulting in severe damage to the PSW foundation [2].
Structures made of reinforced concrete typically experience two stages of corrosion: initiation and propagation. During the initiation stage, chloride ions gradually diffuse through the cover concrete. When the chloride content reaches a critical chloride concentration at a specific cover concrete depth [3], rust (a corrosion product) forms, and the rebar area is lost, which starts the propagation stage. The rust expands over time, placing internal pressure on the concrete and initiating cracks [4]. The formation of the rust and cracks cause bond strength degradation between the rebar and the concrete [5]. Uniform or nonuniform models can be used to estimate the rust distribution in the rebar [6]; nonuniform rust distribution is more damaging and significantly reduces the performance of reinforced concrete components [7].
Numerous studies have been conducted to investigate the damaging effects of corrosion on the mechanical properties of rebar, either by experiment or numerical simulation [8,9,10,11,12,13]. The previous studies employed plain and deformed rebars with various diameters and yield strengths and indicated that the corrosion effect caused the reduction in the tensile strength and elasticity of the rebar. By creating cubic specimens of regular concrete with and without rebar, an experimental study was conducted to investigate the impacts of corrosion on the degradation of the compressive strength of concrete [14]. Other experimental studies [5,15,16] have investigated the corrosion effect on bond strength reduction by conducting pull-out tests on rectangular and cylindrical specimens of regular concrete. In all the studies mentioned above, corrosion effects on the mechanical properties of concrete, rebar, and bond strength have been investigated individually. There are few comprehensive studies of the impact of corrosion on the mechanical properties of reinforced concrete, especially for structural elements with circular hollow sections like spun piles. The corrosion attack may lead to early brittle failure of PSW foundations due to material deterioration over time, as shown by Mirzaeefard et al. [17] and Schmuhl et al. [18], who investigated the capacity of hexagonal and cylindrical corroded piles, respectively. It should be noted that those studies used mechanical properties of the pile material obtained from other studies carried out independently. Therefore, a comprehensive observation of the corrosion effect on the mechanical properties of spun pile materials is necessary to determine the performance of the corroded spun piles accurately. Changes in the mechanical properties of the material result in changes in the dynamical response of PSW. Several studies have investigated techniques to evaluate the dynamic response of structures [19,20].
This study aims to comprehensively evaluate the corrosion effect on the mechanical properties of spun pile materials using a three-dimensional (3D) finite element analysis (FEA). Throughout 0–75 years, the impacts of nonuniformly distributed rust on the rebar area loss, the concrete compressive strength, the yield strength of PC-bars, and the bond strength were all thoroughly examined. The 3D FEA results were reviewed to determine the stress–strain relationship of corroded spun pile materials and the bond–slip relationship between the corrosion-damaged PC-bar and concrete. Equations to predict the deterioration degree of the mechanical properties of corroded spun pile materials were proposed and compared to the equations presented in the previous studies.

2. Methods

2.1. Model Geometry and Material Properties

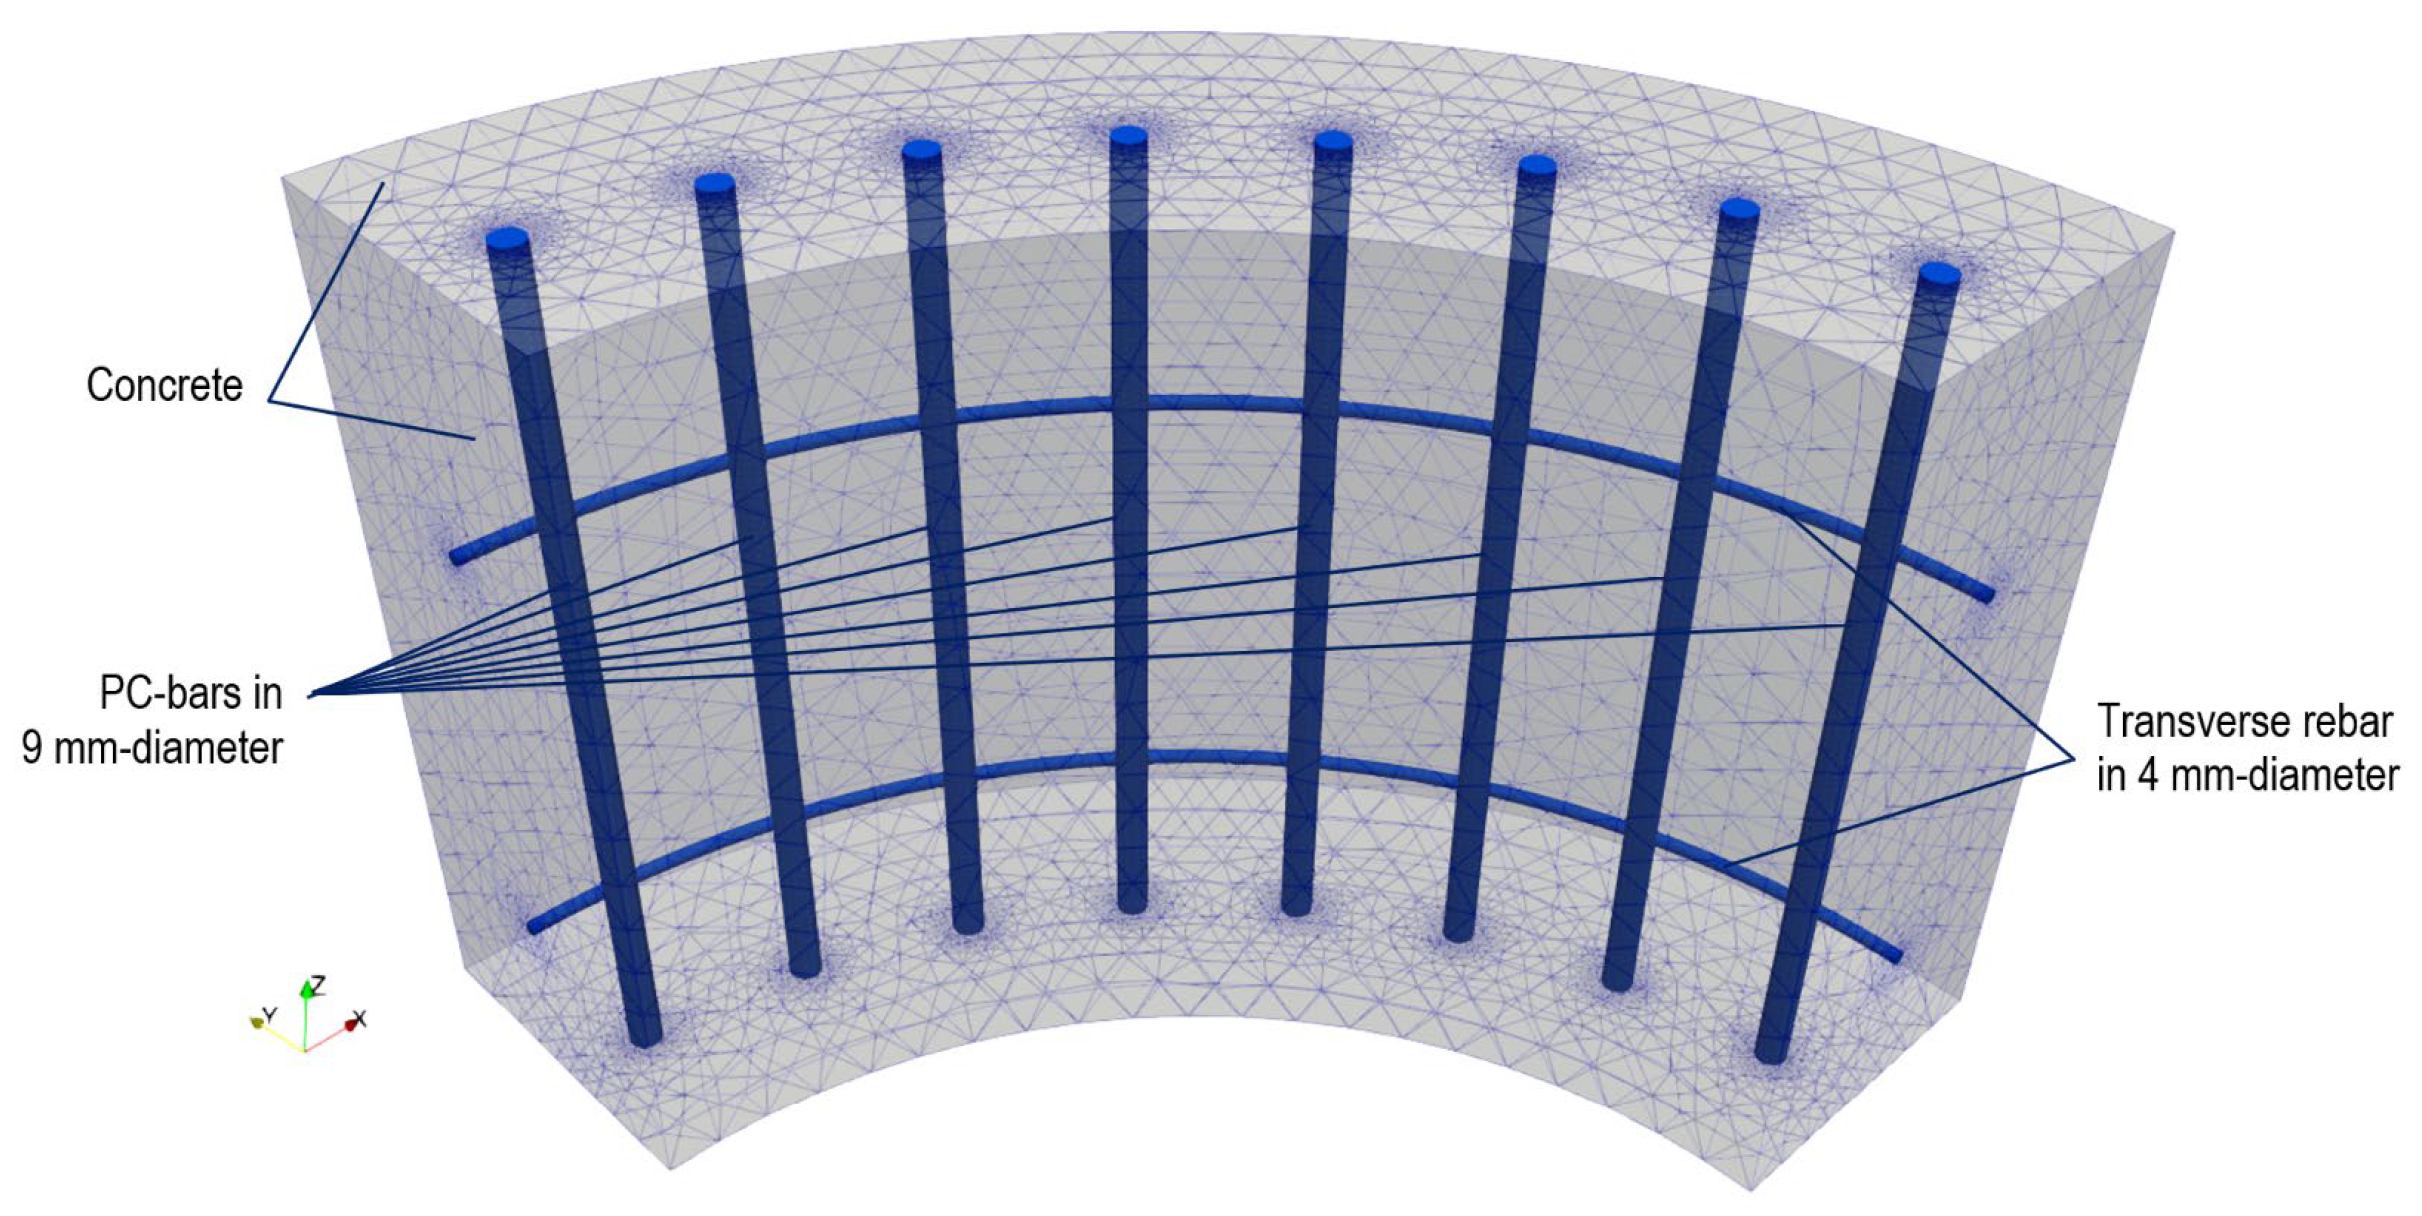
The hollow section of the target spun pile had a wall thickness of 100 mm and an outer diameter of 600 mm (Figure 1). The thickness of the cover concrete was 50 mm. The spun pile was made up of a single layer of 32 PC-bars, each 9 mm in diameter, and helix-shaped transverse rebars 120 mm apart, each 4 mm in diameter. The concrete consisted of cover concrete and core concrete. The cover concrete is the concrete outside the transverse rebar, whereas the core concrete is the concrete inside the transverse rebar. The mechanical properties of the spun pile materials are shown in Table 1.

2.2. Corrosion Model

This study employed a nonuniform rust distribution which is expressed in terms of the rust thickness [ T c l θ ]. The rust thickness is calculated as [21]:
T c l θ = λ e k c o s θ π 2 π   i c o r r ( t )
λ = α   π   r   η    
η = A s l , c o r r A 0  
where λ is a fitting parameter; θ is the angle of the rust distribution; k is the concentration coefficient defining the level of nonuniformity of the rust distribution (=0.555 in this study based on [21]); i c o r r is the time-dependent corrosion rate; t is the corresponding year; α is the rust expansion ratio; r is the rebar radius; η is the relative area loss of rebar; A 0 is the initial cross-section area of rebar; and A s l , c o r r is the cross-section area loss of corroded rebar, which can be determined as follows [22]:
A s l , c o r r = 2 r 2 θ sin θ cos θ  
  θ = a r c c o s 1 d p 2 r ;   2 / 3 π     d p     4 / 3 π
d p = 0.0116 i c o r r   R   t  
where R is a pitting factor variable ranging from 4 to 8 (=5.65 in this study based on [7]), and dp is the maximum rust thickness in the radial direction [7]. The time-dependent corrosion rate was determined as follows [23]:
i c o r r t = 0.85 i c o r r 1   t 0.29  
i c o r r 1 = 3.78   ( 1   w c ) 1 . 64 x  
where i c o r r 1 is the corrosion rate at the beginning of the corrosion propagation; x is the spun pile cover concrete thickness; and w c is the water–cement ratio of the concrete, which was set to 0.28 based on the material specifications of the spun piles [24].
Since the spun pile section was closed-ended, it was assumed that the irregular rust distribution spread from the surface inward. The impacts of the rust’s nonuniform distribution were also considered using volumetric strain expansion in the FEA. A corrosion degree, the ratio of the corroded rebar’s mass loss to the rebar’s initial mass, was used to describe the material properties of the corroded spun pile. The corrosion degree might be equated to the rebar area loss if the rebar area loss was evenly distributed along the rebar. On the other hand, the corrosion rate represents the increased rate of rust thickness and can be measured in amperes per unit rebar area.

2.3. Material Model

The plasticity-based concrete model developed by Piscesa et al. [25] was applied for the concrete elements. The PC-bars and transverse rebar were modeled as uniaxial bilinear-steel materials [26]. A perfect bond between the rebar and the concrete was assumed [27,28]. The rust was modeled as a modified steel material with the rust elasticity modulus [29].

2.4. Finite Element Model

A 3D FEA of the corroded spun pile was implemented using the 3D-NLFEA package. The package was verified to analyze various high-strength and steel-fiber reinforced concrete columns [30,31,32,33]. The analysis model was constructed as one quarter of the spun pile section with a height of 250 mm because it had a horizontally axisymmetric shape (Figure 2). Solid elements were used to model the concrete, PC-bars, and transverse rebar elements (Figure 3). A hexahedral formulation was employed for the solid-element mesh [34]. The modified initial stiffness method accelerated convergence in the global nonlinear iteration process [35]. The rust was modeled as part of a PC-bars and transverse rebars element with a 1 mm thickness. Lateral (x and y-directions) and vertical (z-direction) constraints were employed on the side surface and the bottom surface of the model, respectively.
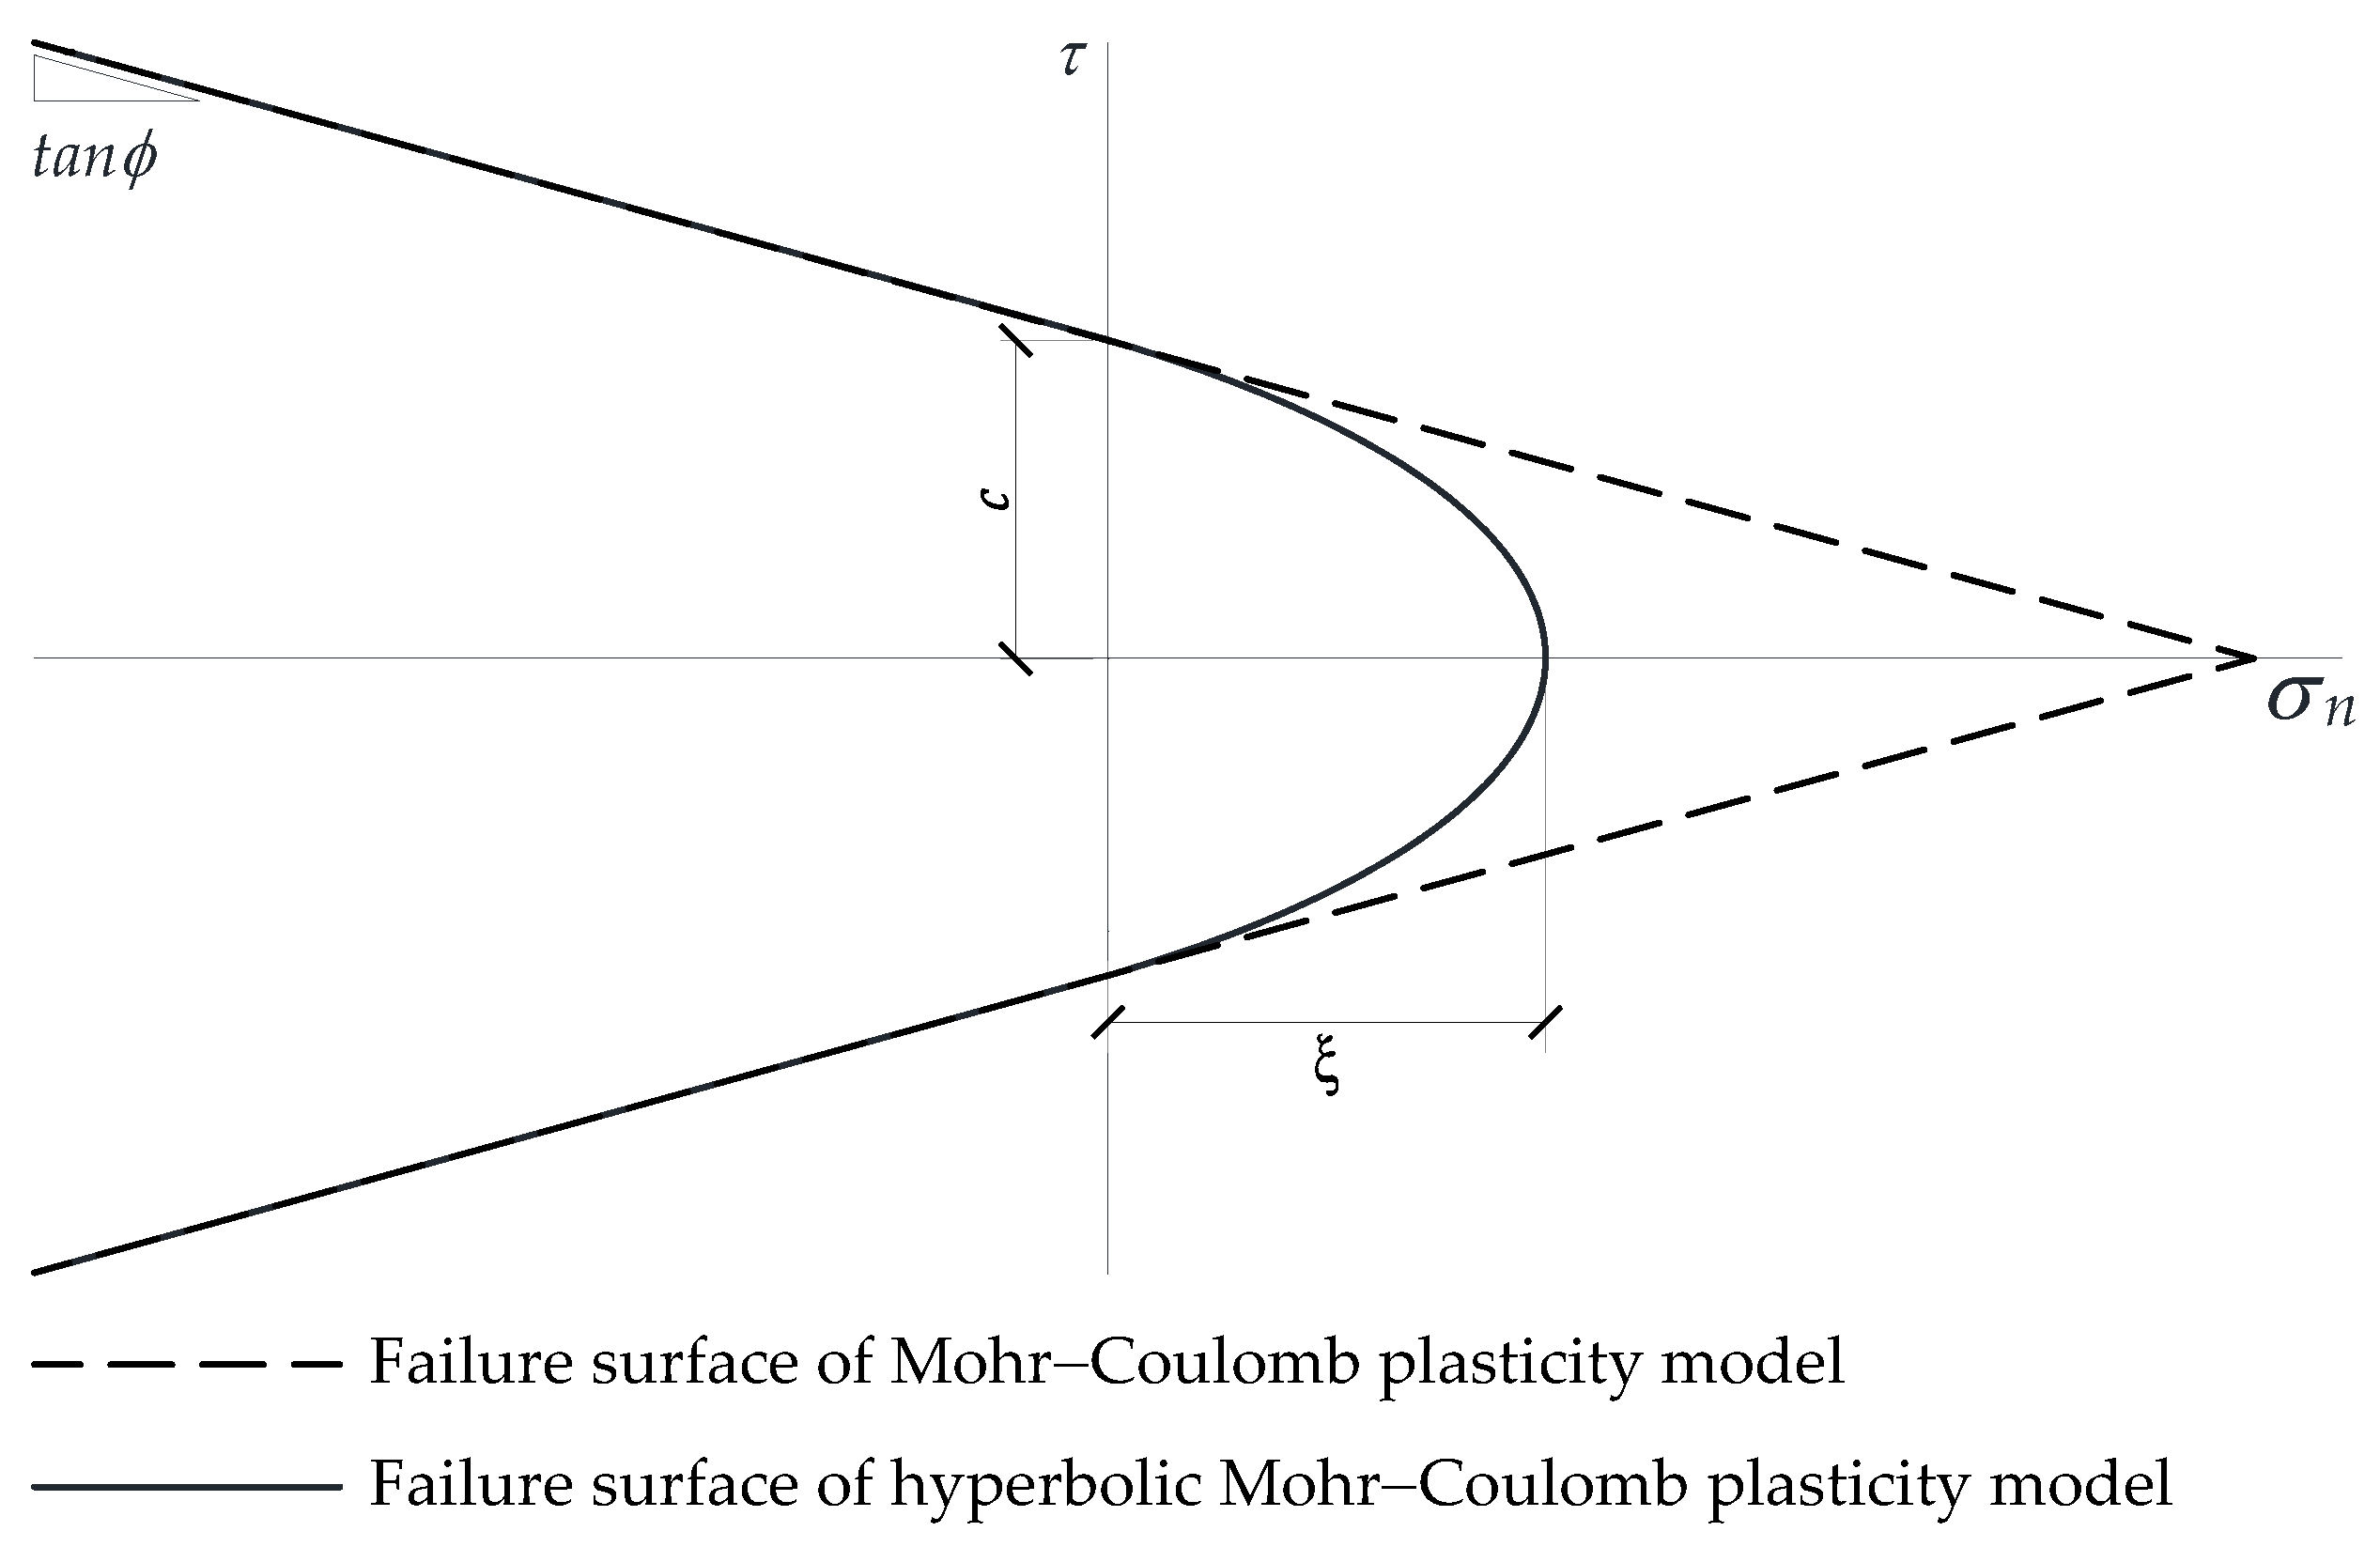
A zero-thickness element [36] was used to simulate the bond–slip behavior of the concrete and PC-bars in three (i.e., two transverse and one longitudinal) directions. The PC-bars were assumed to only slip longitudinally, and the occurrence of the slip was determined using a nonassociated flow rule and the hyperbolic Mohr–Coulomb plasticity model. The stress integration algorithm applied the tangent cutting plane method [35]. Figure 4 shows the hyperbolic Mohr–Coulomb plasticity failure model and the Mohr–Coulomb plasticity failure model as a reference. The failure surface (f) of the hyperbolic Mohr–Coulomb plasticity model is expressed as follows [37]:
f = τ 1 2 + τ 2 2 ( c σ n tan ϕ ) 2 + ( c ξ tan ϕ ) 2
where τ 1 is the shear stress in the first principal direction; τ 2 is the shear stress in the second principal direction; c is the cohesive shear strength at the onset of slip occurrence; ϕ is the friction angle, which is related to the roughness of the surface between the concrete and the rebar; ξ is the bond strength between the concrete and the rebar; and σ n is the stress rate vector defined in the expected directions of the interface.
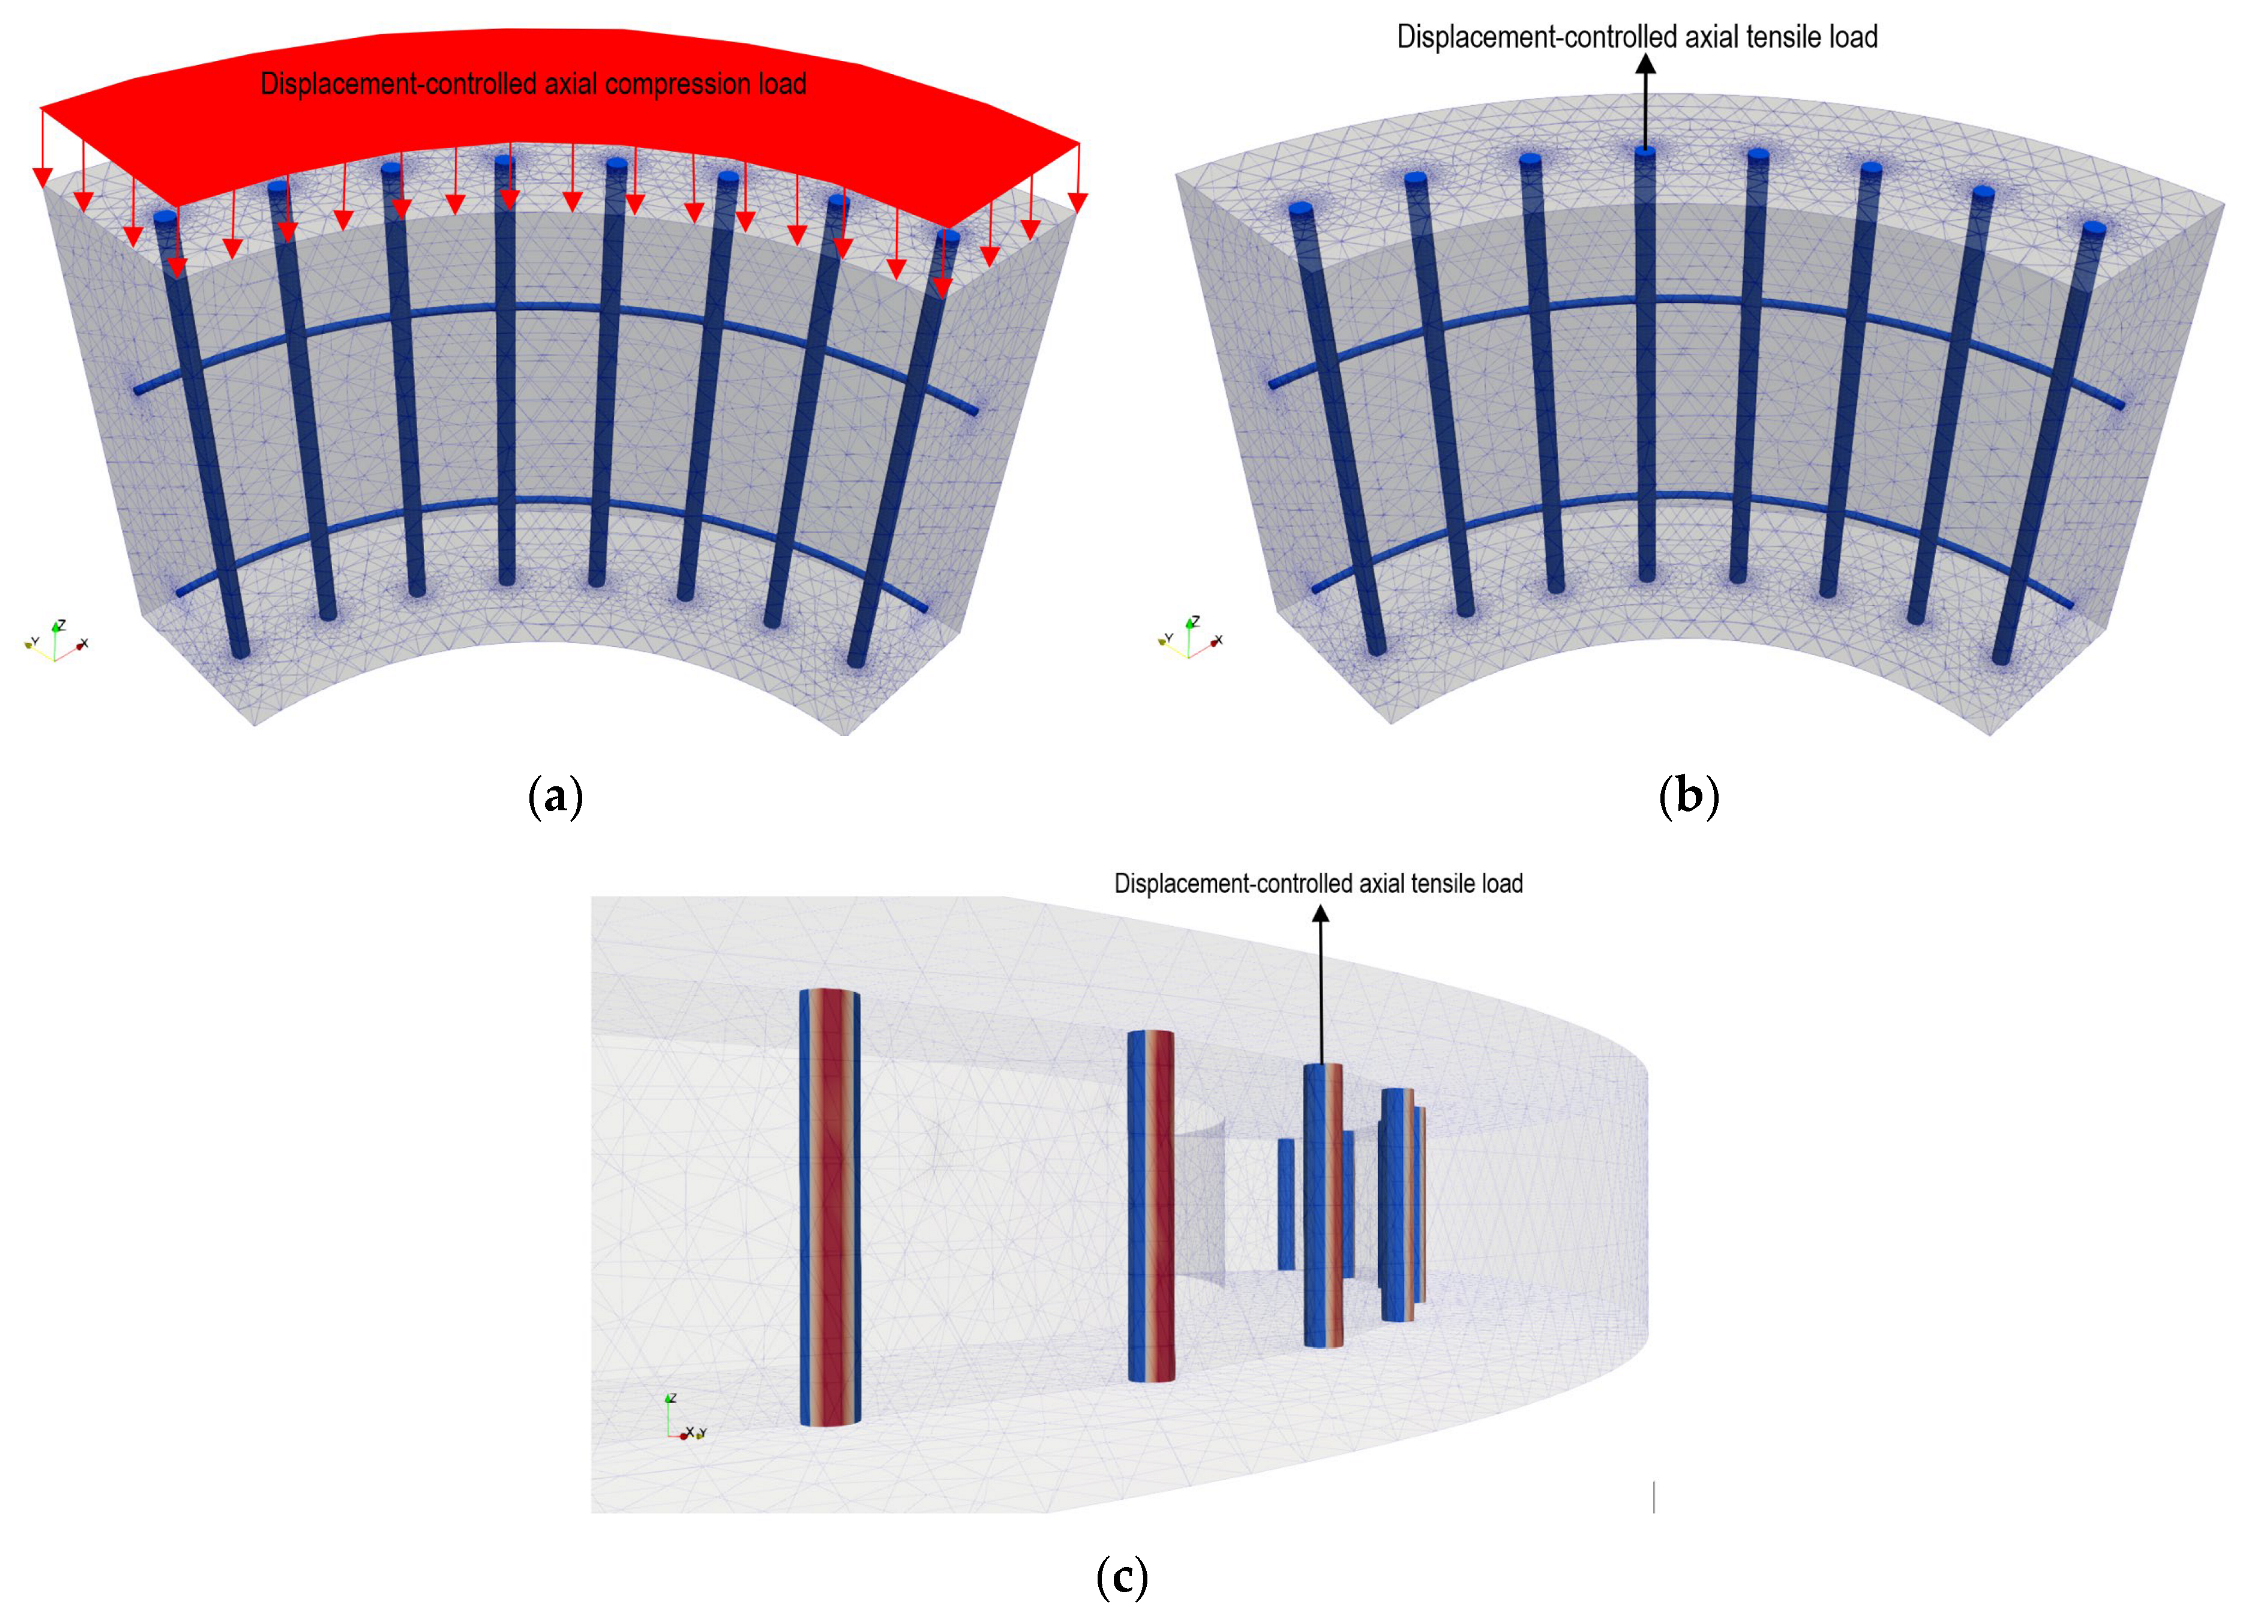
As shown in Figure 5, three different types of analyses were carried out in this study to discuss the impacts of corrosion on the deterioration of the mechanical properties of spun pile materials. Each involved two loading steps. To model the state of a corroded spun pile, the volumetric strain expansion of rust was initially applied to the PC-bar and transverse rebar as a standard loading phase. The magnitude of volumetric strain expansion was determined following the nonuniform rust distribution for the corresponding years, and the strain was applied in an equal increment of 10 steps.
In the first analysis case (Case 1), concrete was subjected to a displacement-controlled axial compression load to assess the impacts of corrosion on the deterioration of the compressive strength of concrete. In order to determine the stress–strain relationships between the corroded cover and core concrete, the compression load was uniformly applied in an increment of 0.01 mm in 100 steps to the top edge of the model (Figure 5a).
In the second analysis case (Case 2), one of the PC-bar elements was subjected to a displacement-controlled axial tensile load with 100 steps of 0.1 mm increment to observe the corrosion effect on the deterioration of the bond strength between the PC-bar and concrete (Figure 5b). Corroded PC-bar and concrete bond–slip relationships were obtained.
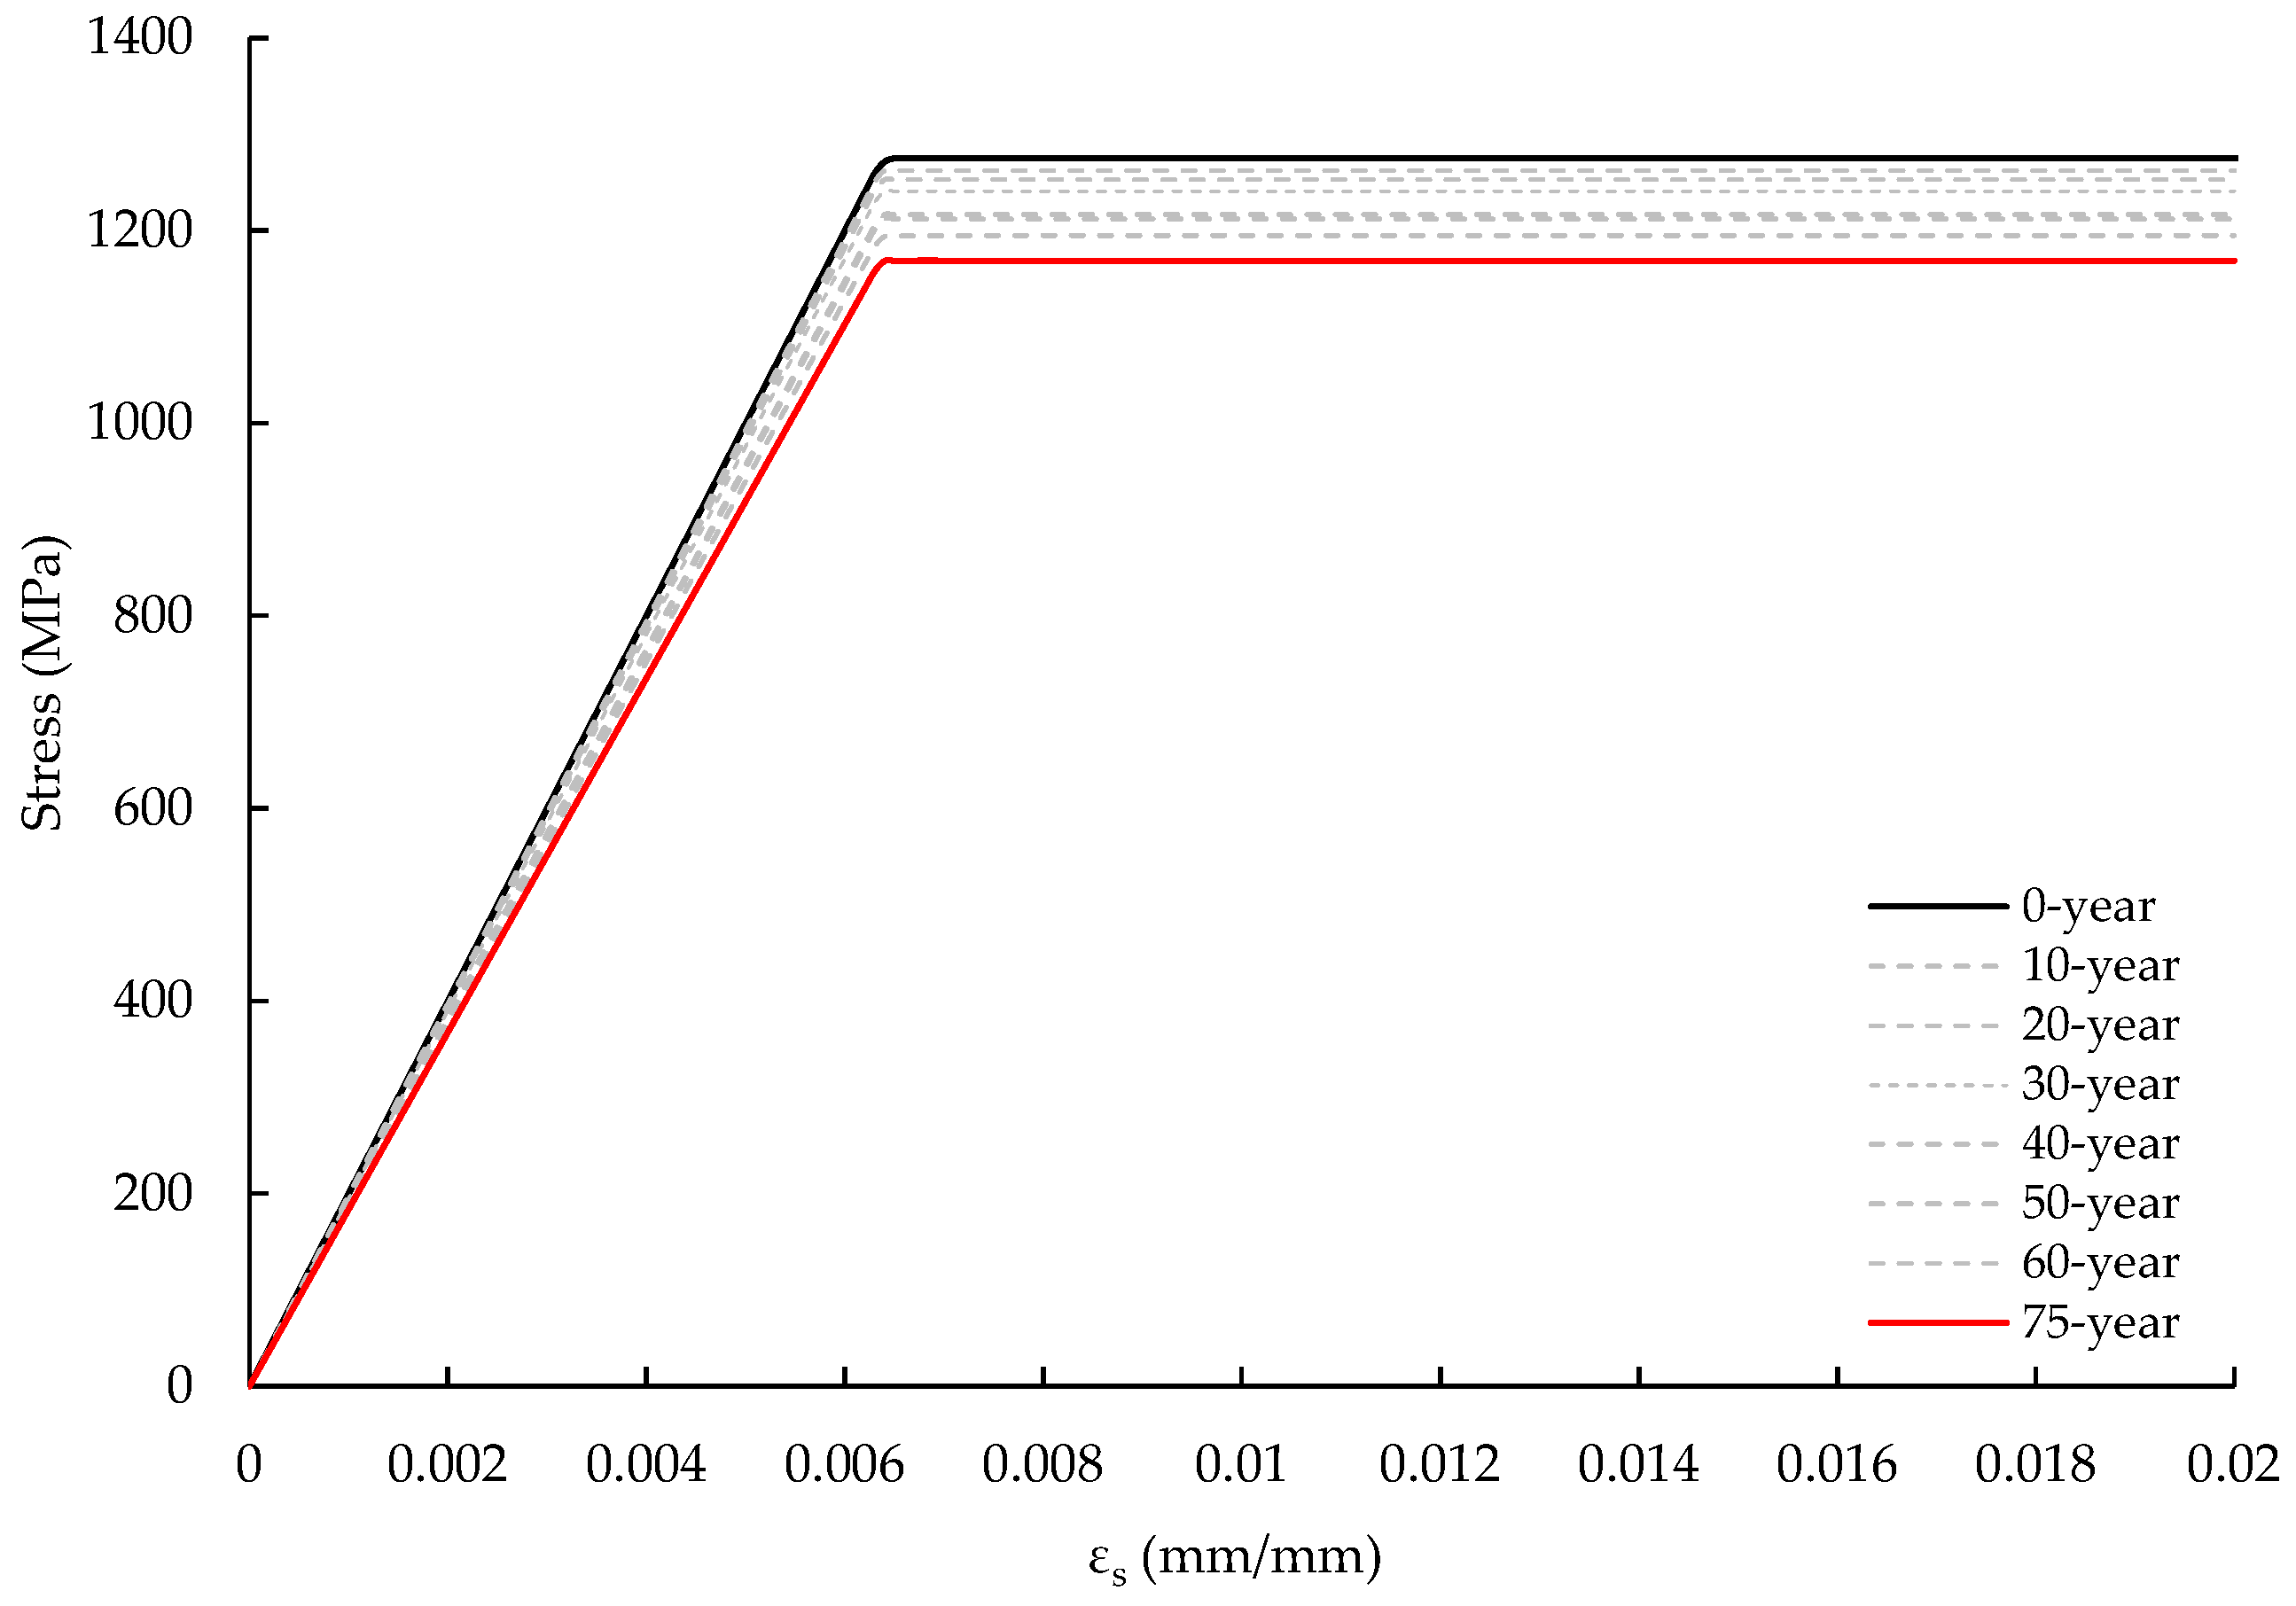
Moreover, in the third analysis case (Case 3), the displacement-controlled axial tensile load with 100 steps of 0.1 mm increment was applied to one of the PC-bar elements to observe the corrosion effect on the decrease in the yield strength of the PC-bar (Figure 5c). In Case 3, only the PC-bar elements were activated, and the side boundary condition became unconstrained. The stress–strain relationships of the corroded PC-bars were generated.

3. Results and Discussion

3.1. Nonuniform Rust Distribution

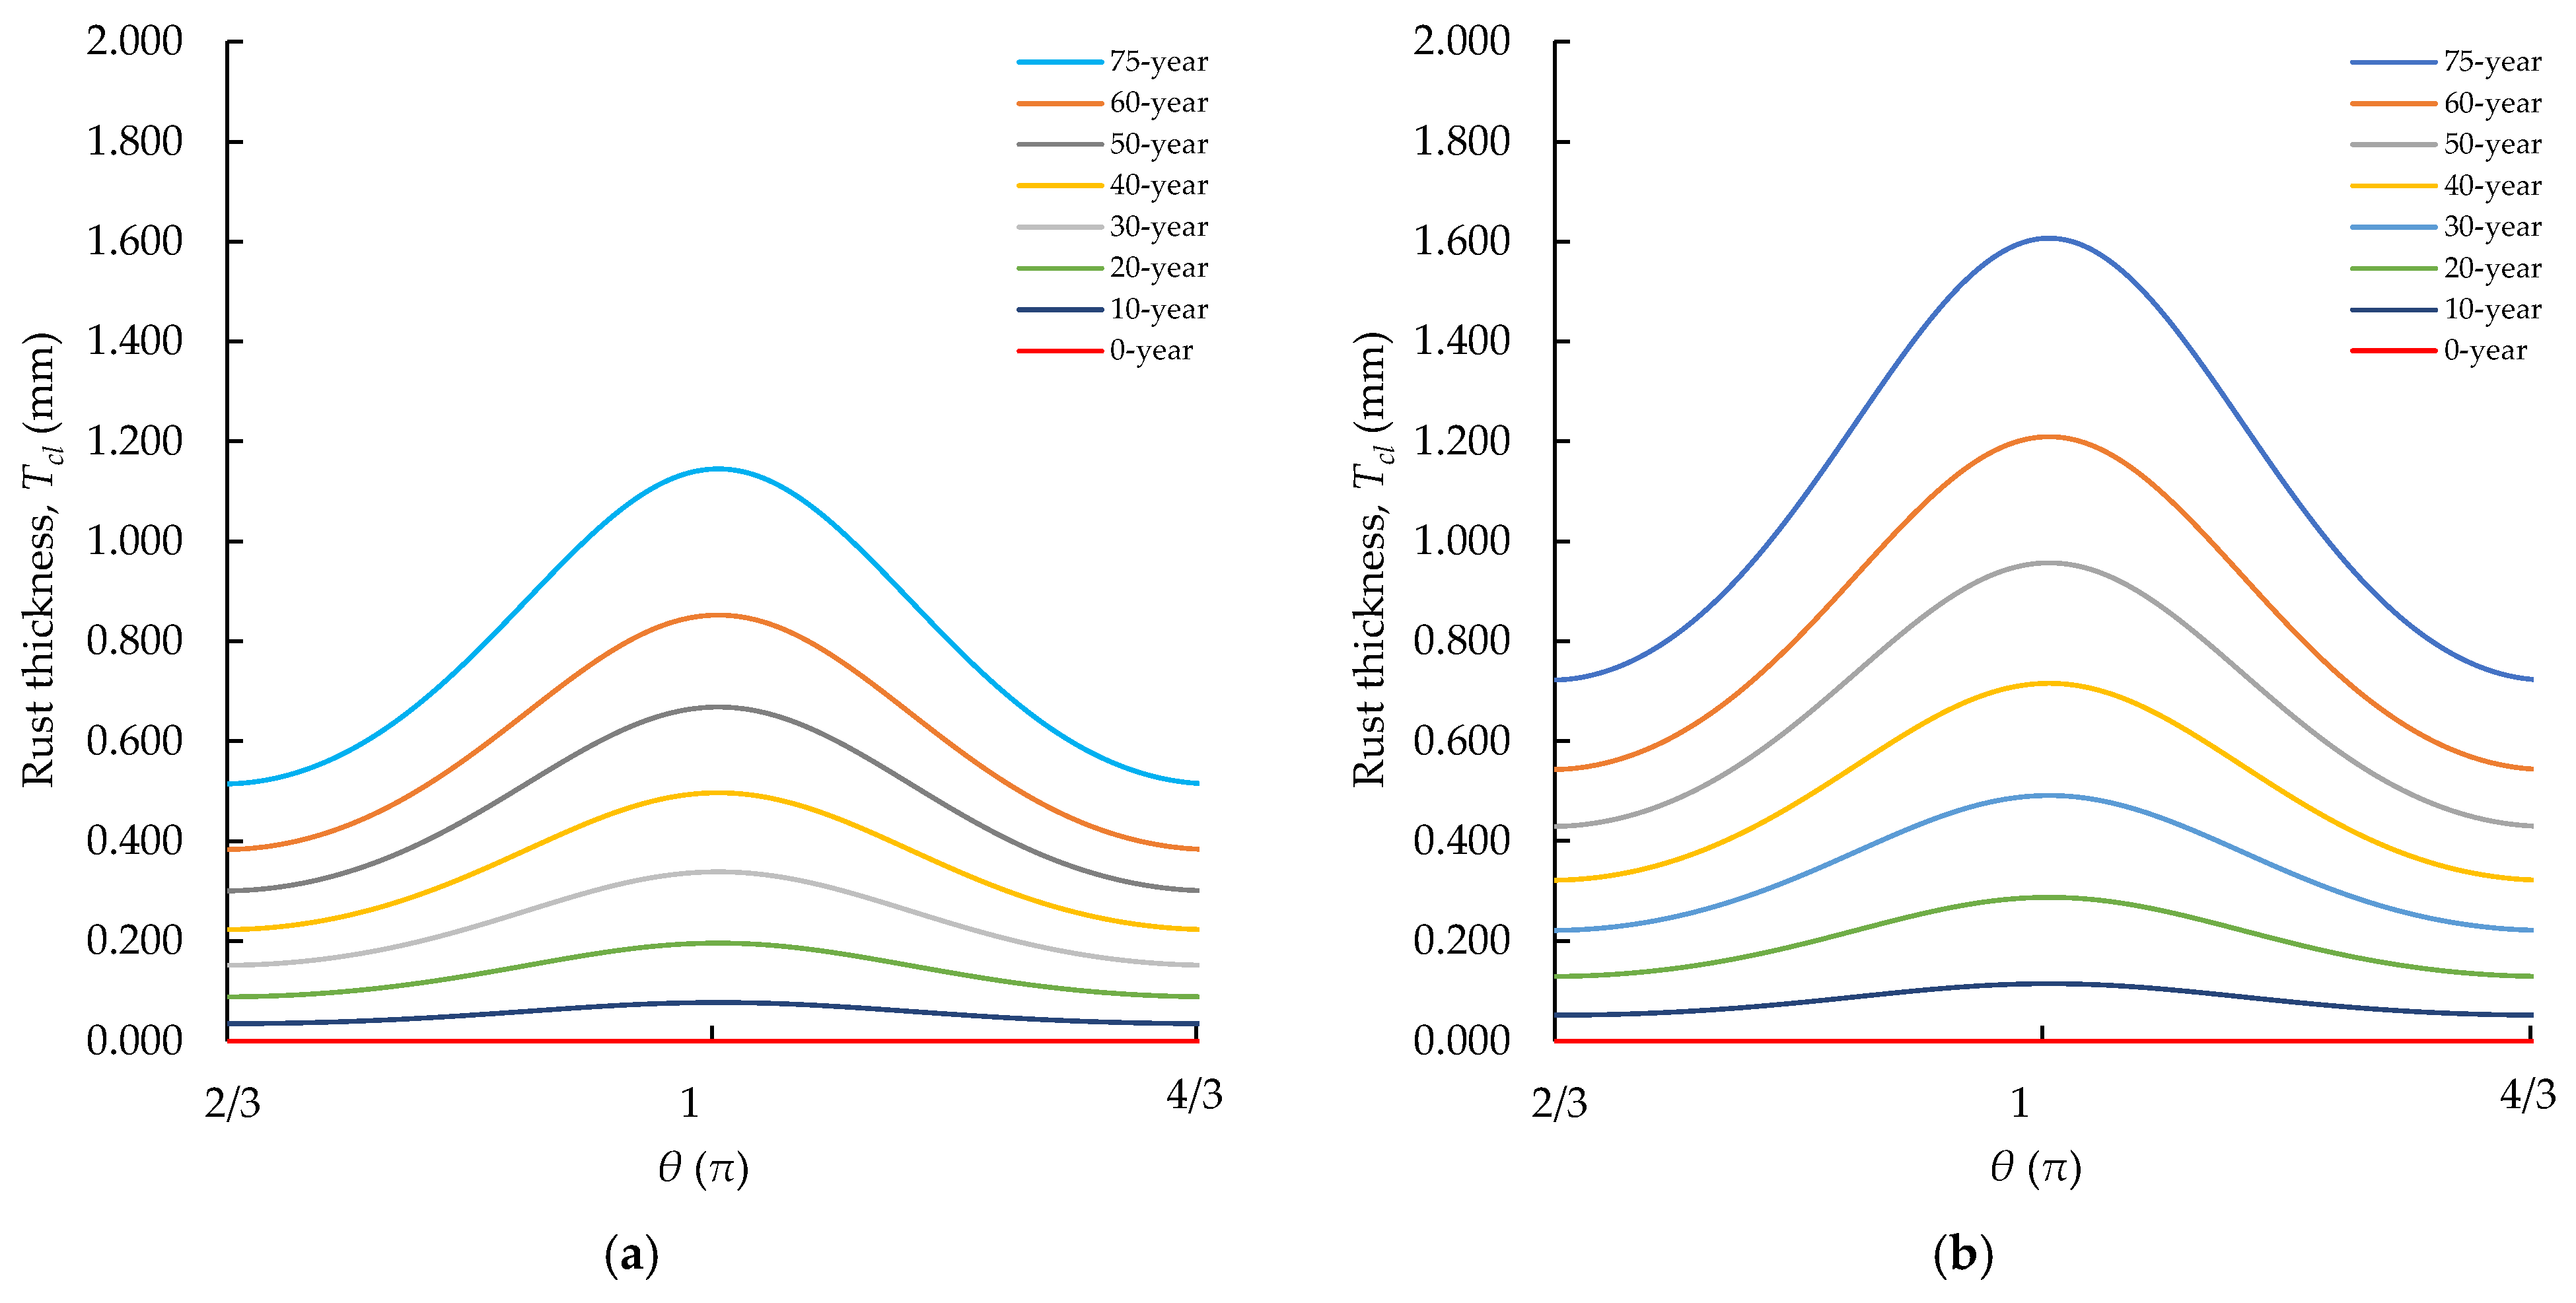
Figure 6 illustrates the nonuniform rust distribution in the PC-bar and transverse rebar cross-sections from 0 to 75 years based on Equations (1)–(8). The rust thickness increased over time, forming a symmetrical distribution across the cross-sections. The maximum rust thicknesses of the PC-bar and transverse rebar in the 75 years were 1.1448 mm and 1.6061 mm, respectively. These results illustrate that transverse rebar, which had a smaller diameter (4 mm), produced a larger rust thickness than PC-bar, which was 9 mm in diameter, for the same corrosion rate.
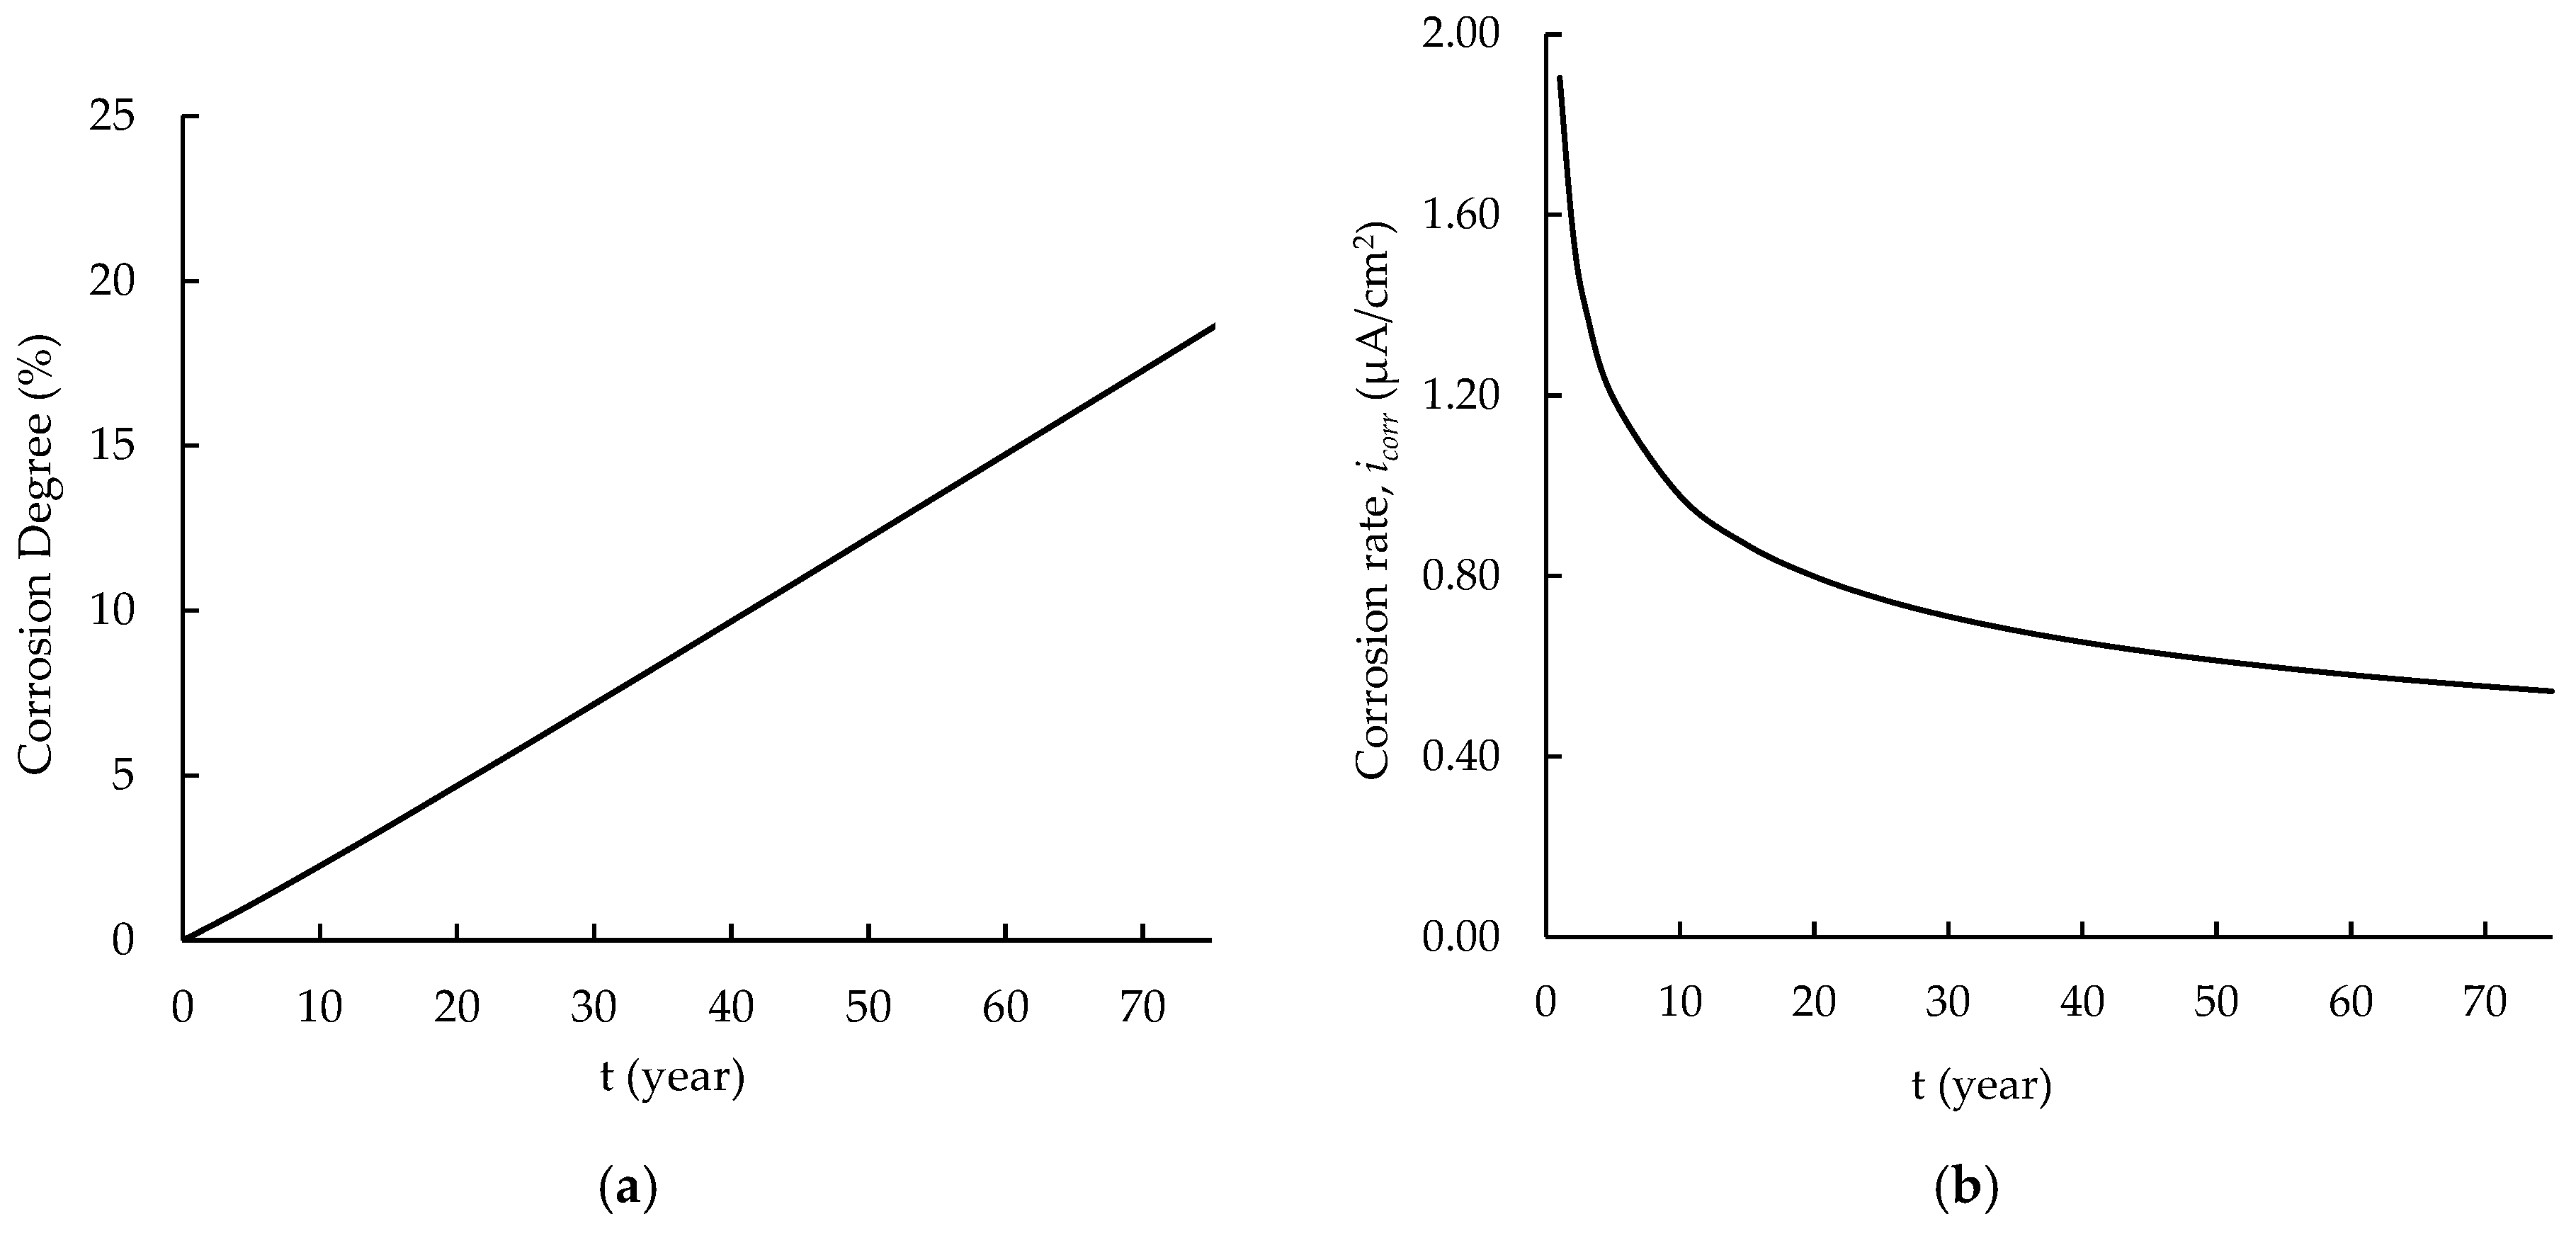
Figure 7 illustrates the PC-bar’s corrosion degree and corrosion rate over time. After 75 years, the corrosion degree reached 18.56%. The corrosion rate was found to decrease exponentially over time. A year after the beginning of the corrosion propagation, the corrosion rate was 1.9033 μA/cm2, and it had decreased to 0.5442 μA/cm2 at 75 years later.
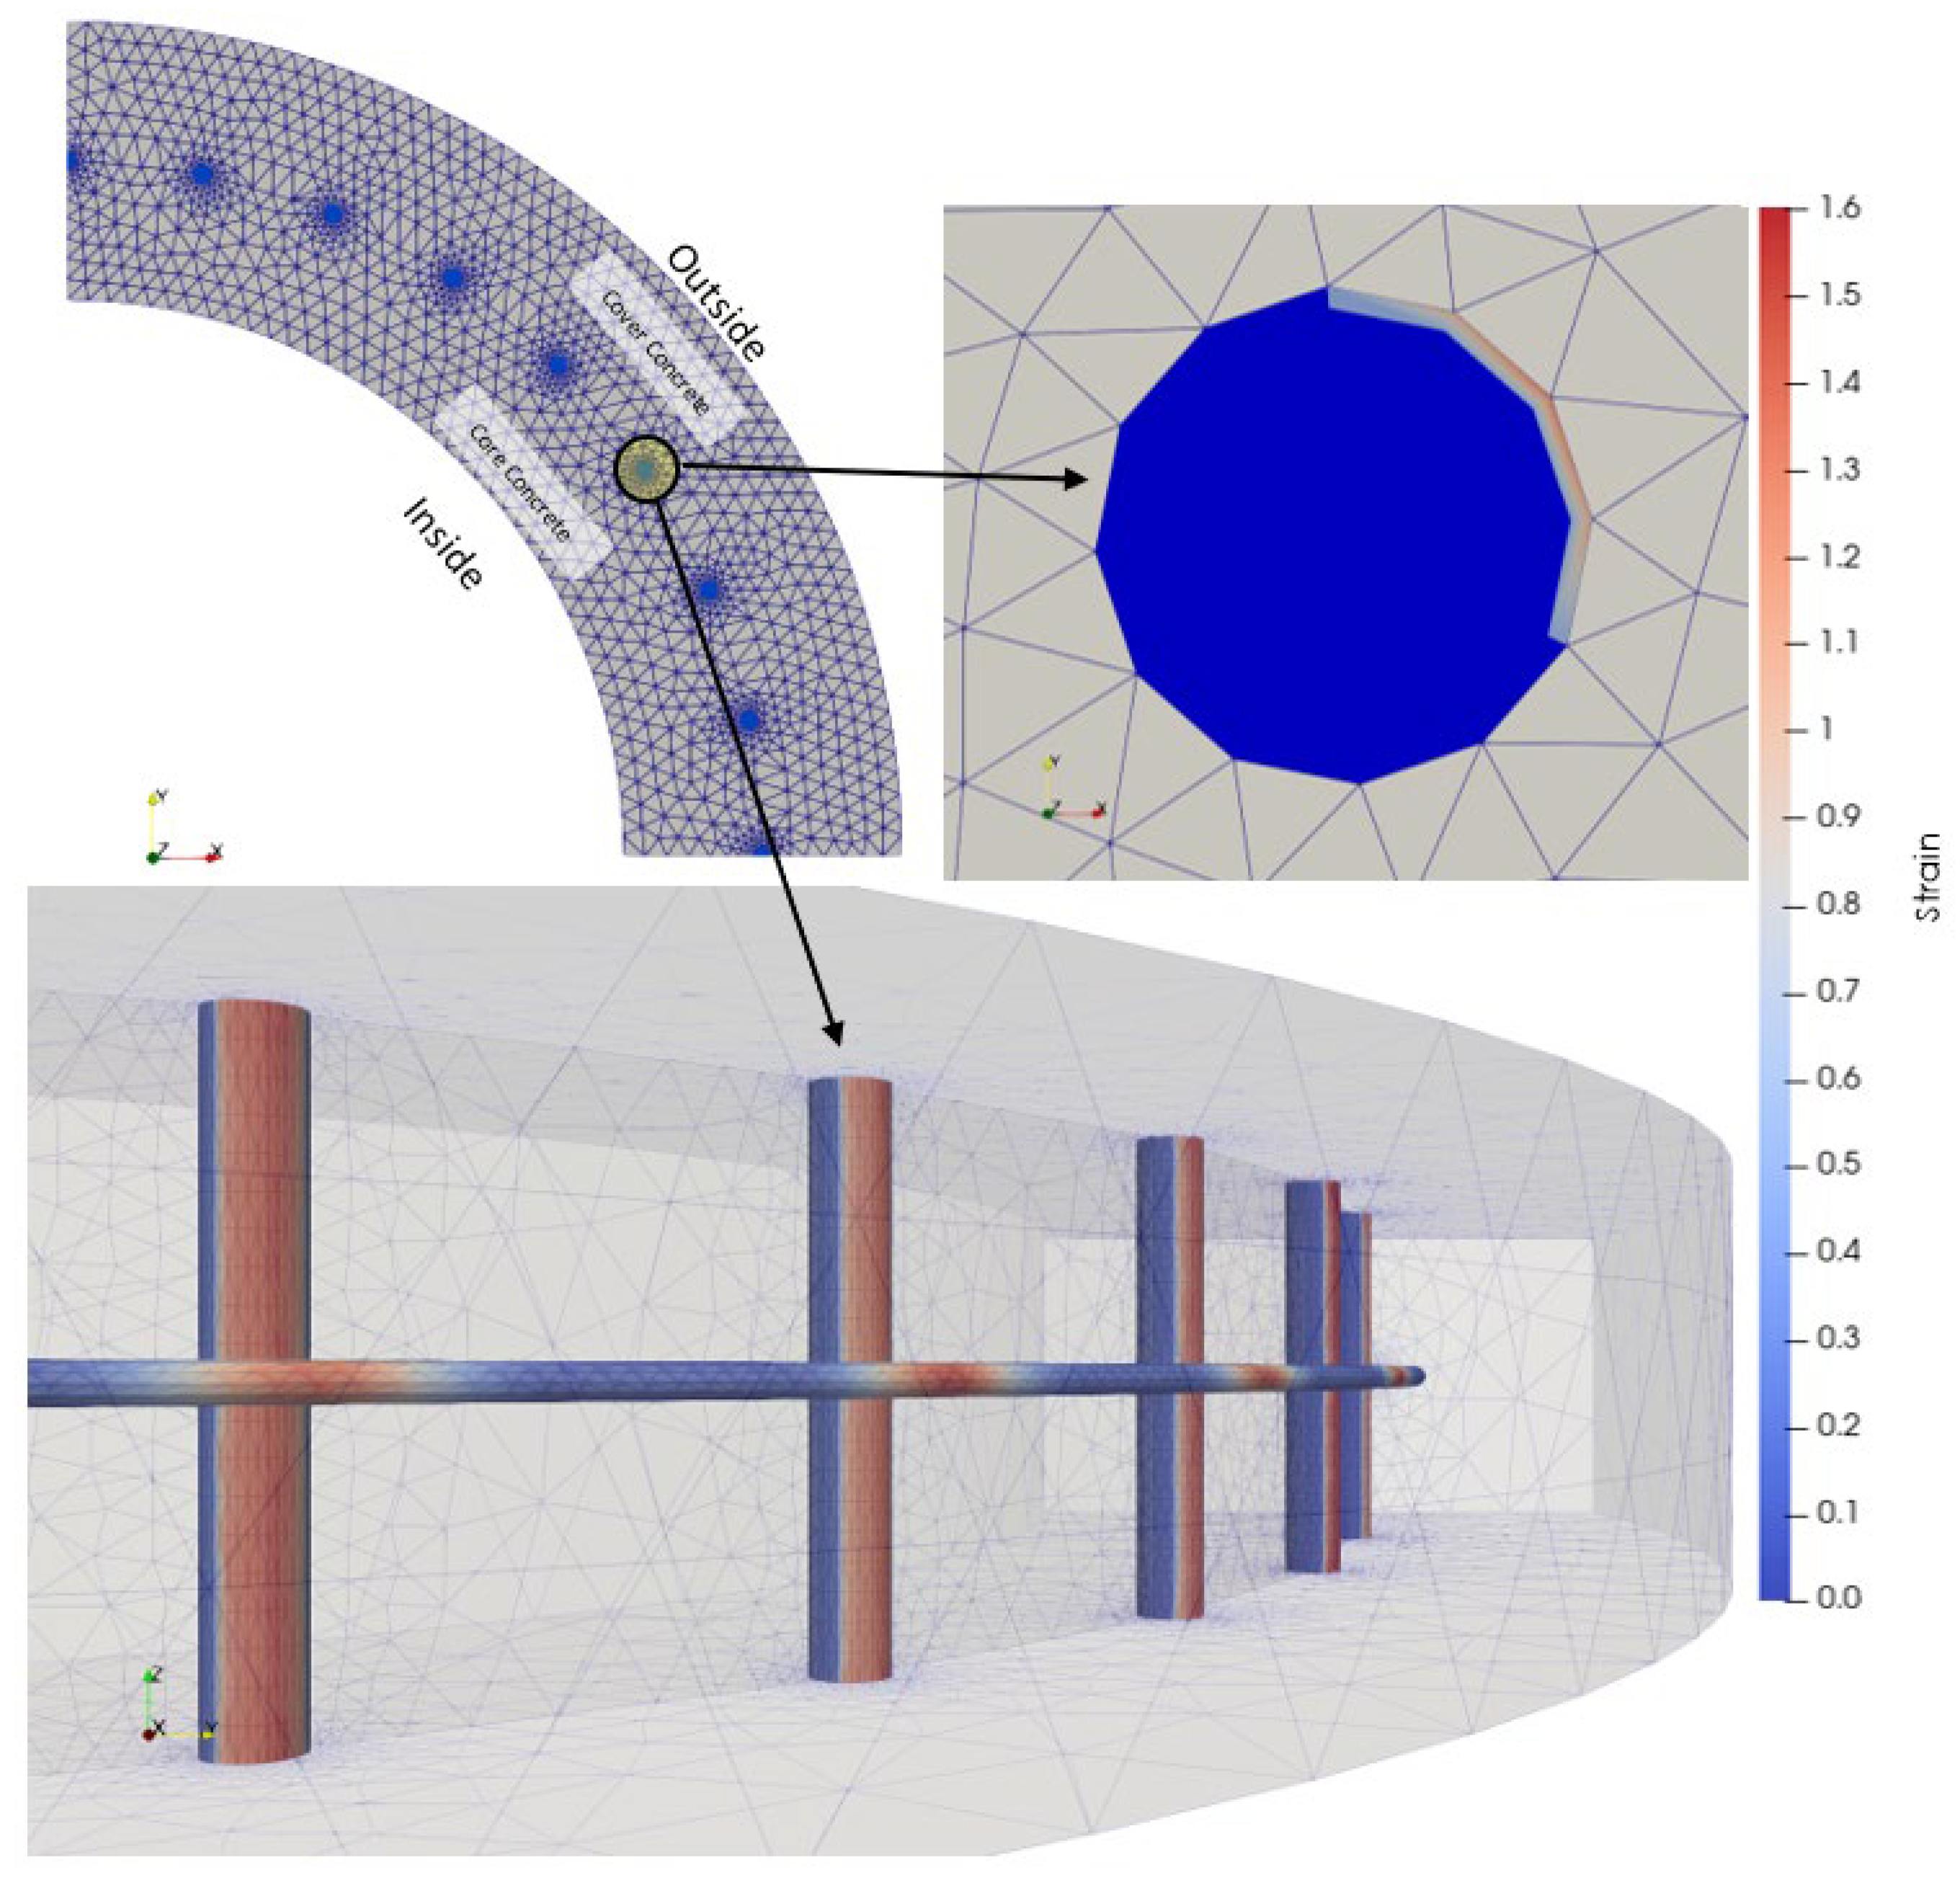
Figure 8 shows volumetric strain expansion in the model representing the 75-year rust expansion. The maximum strain expansions of the PC-bar and transverse rebar in the 75 years were 1.1448 mm and 1.6061 mm, respectively.

3.2. Corrosion Effect on the Concrete Strain Distribution

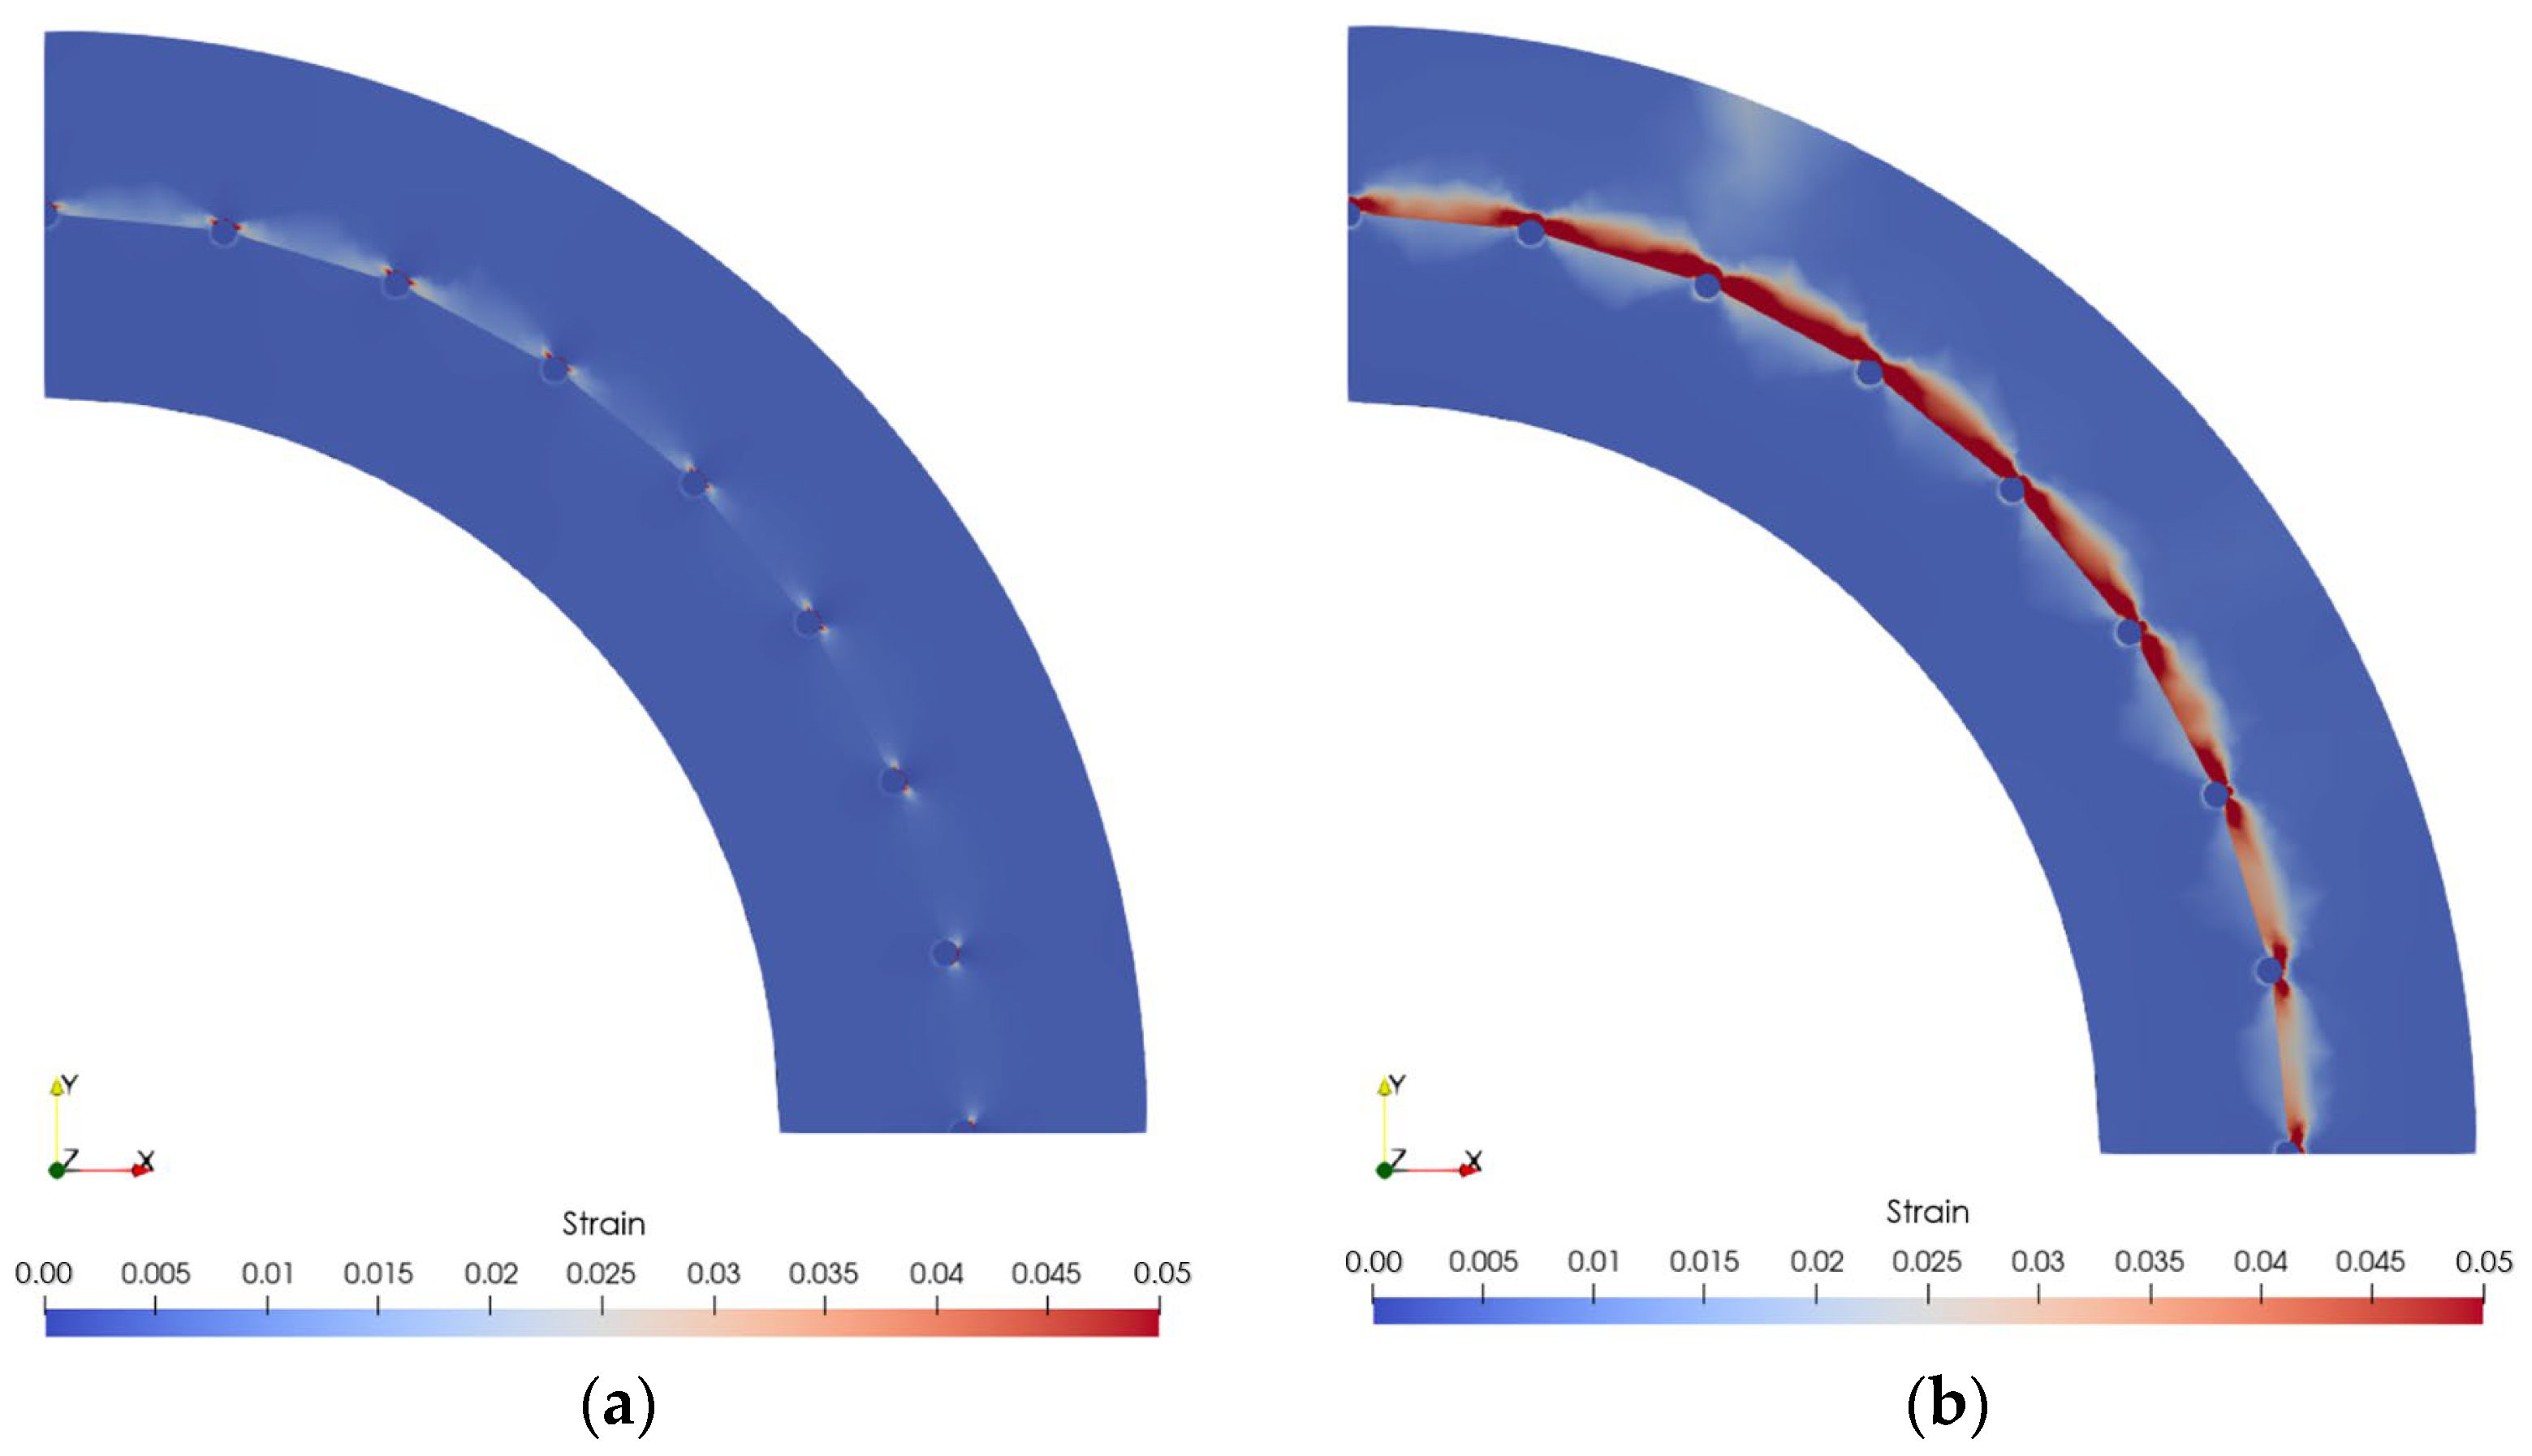
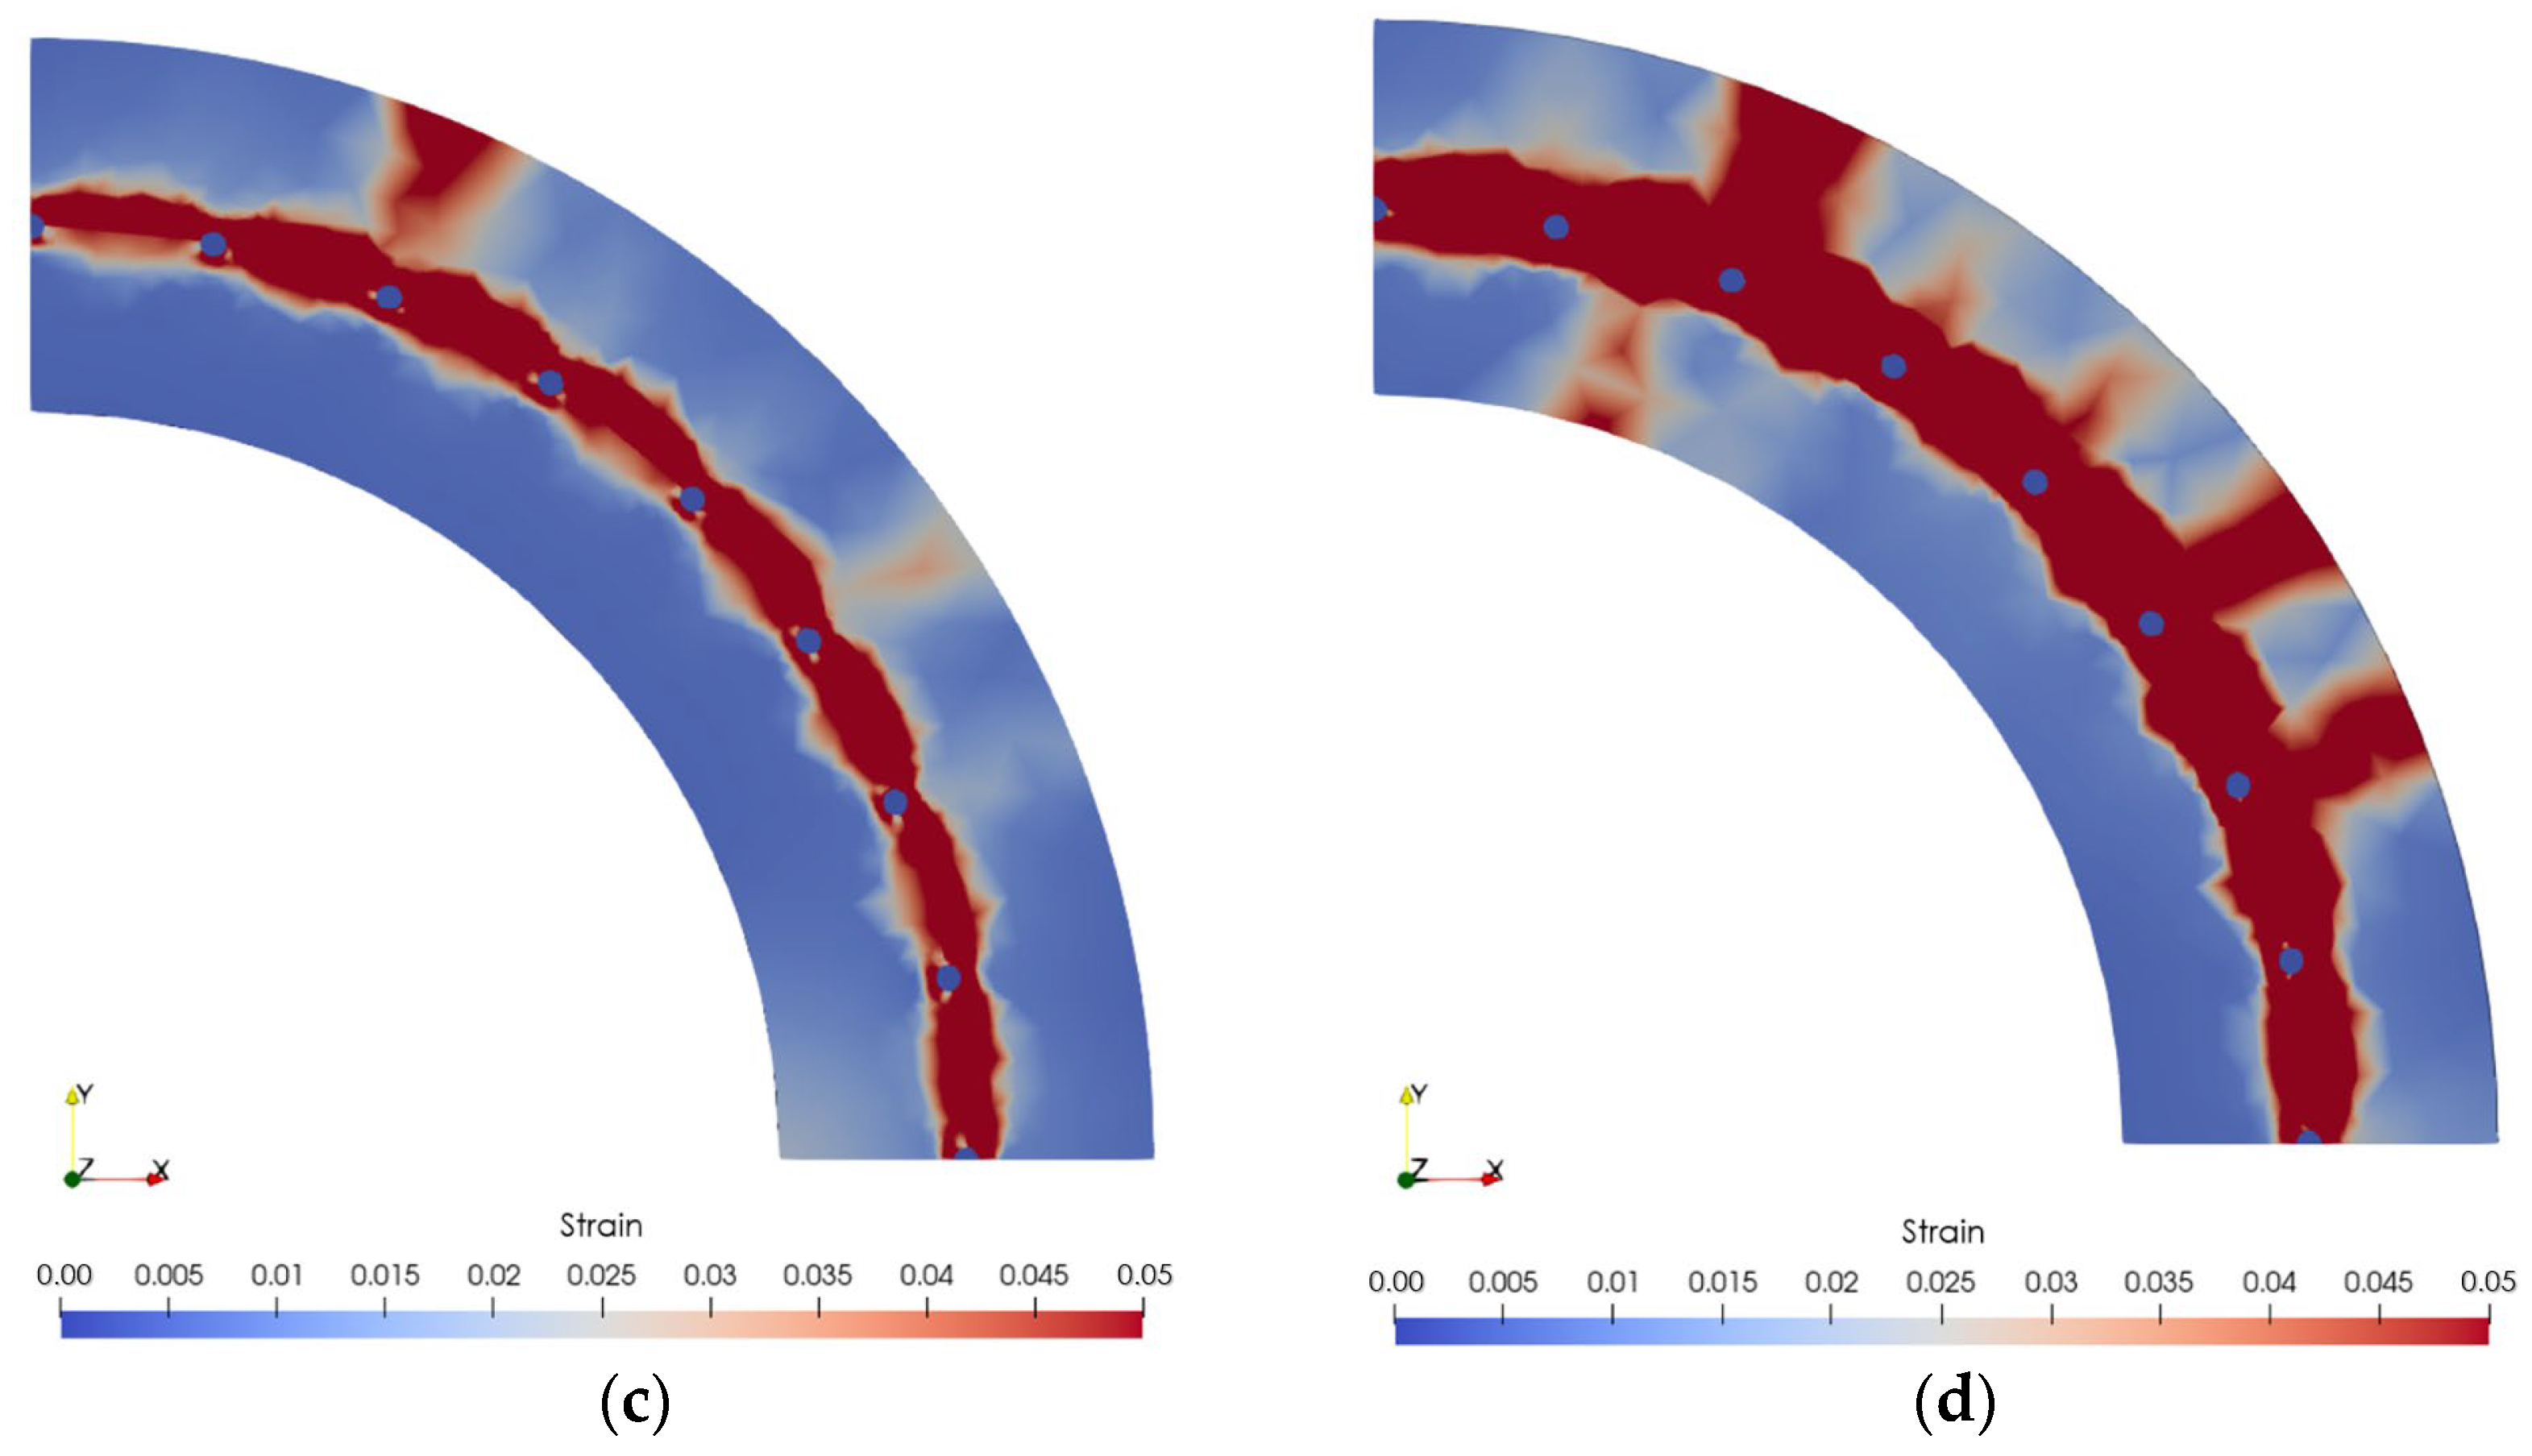
Figure 9 illustrates the principal strain distribution under the peak axial stress of corroded concrete. At a 9.67% corrosion degree, the concrete strain exceeded 0.03, and along with the interconnection of the PC-bar position, the cover concrete was predicted to start spalling. The cover concrete had spalled at a 14.74% corrosion degree, triggering cracking in other locations. More regions were cracked and spalled at an 18.56% corrosion degree. Rust expansion caused cracks around corroded PC-bars as the degree of corrosion increased. The cracks became interconnected over time, resulting in the cover concrete spalling. Moreover, the cracks caused a decrease in the compressive strength of concrete and bond strength.

3.3. Corrosion Effect on Concrete Compressive Strength

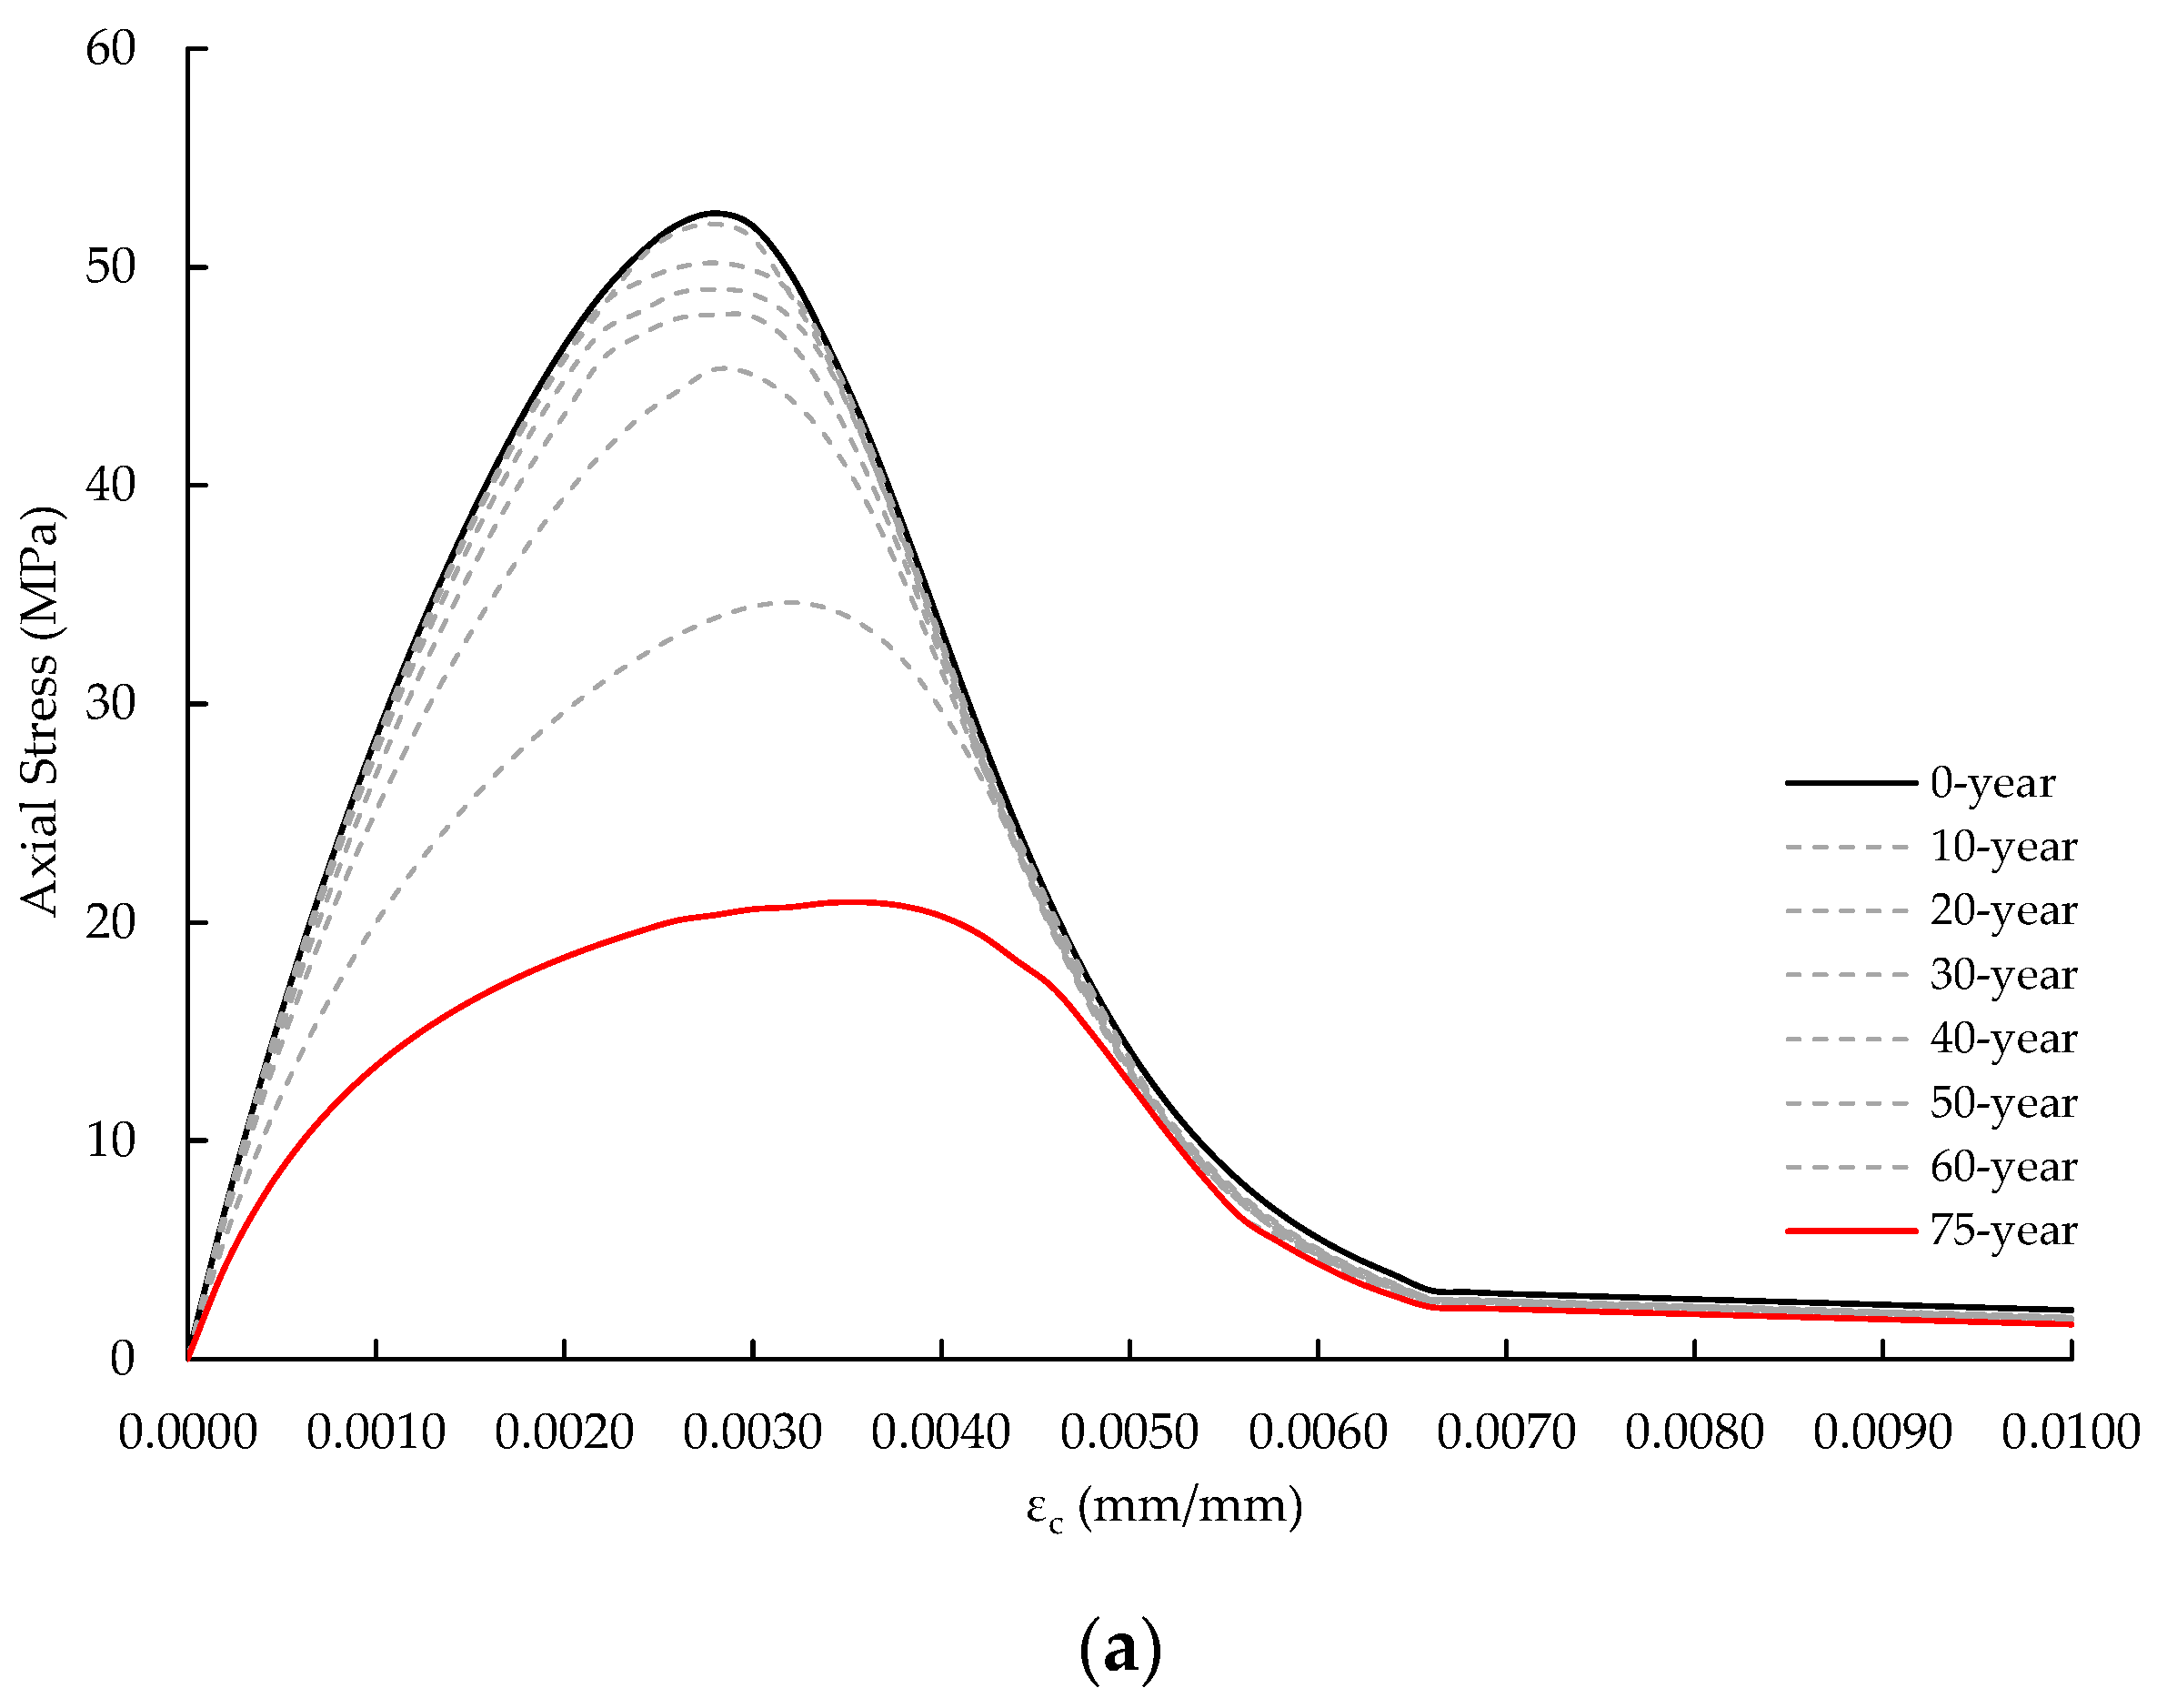
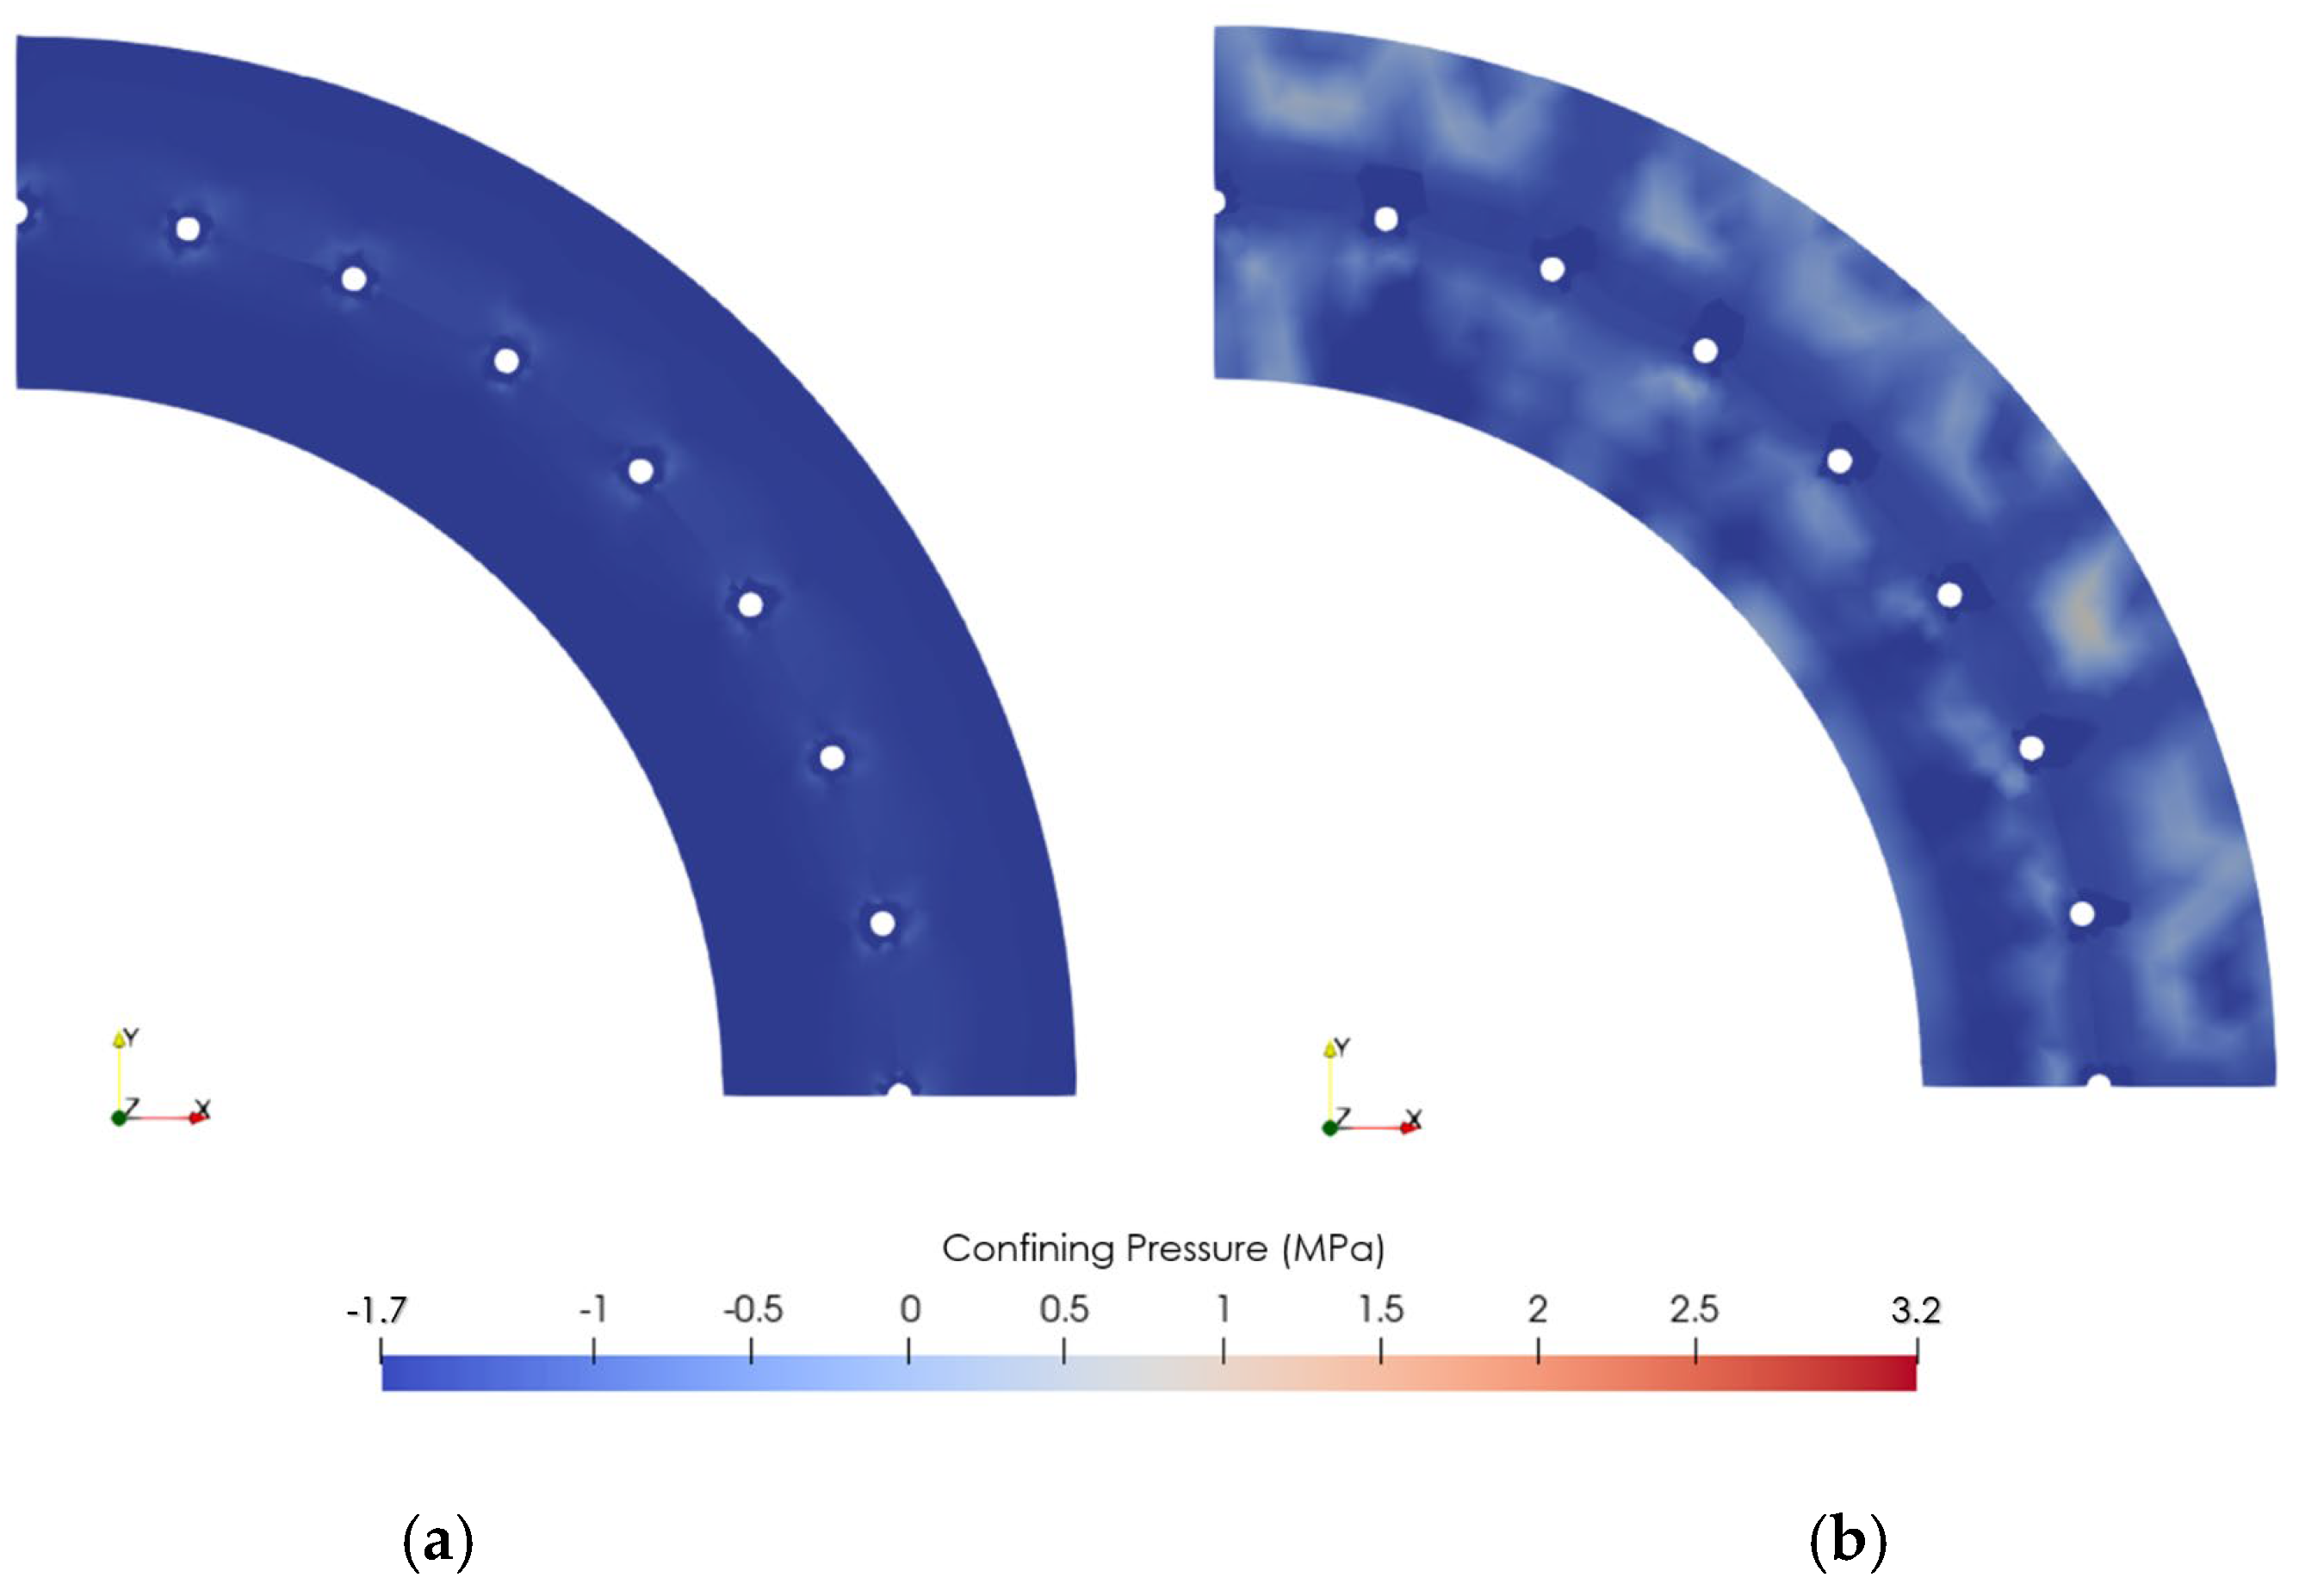
Figure 10 depicts the stress–strain relationships of the concrete. The cover concrete compressive strength decreased slightly from 10 to 40 years but significantly from 50 to 75 years. Compared to the cover concrete, the compressive strength of the core concrete decreased less. After 75 years, the compressive strength of the cover concrete decreased to 40.21% of the initial condition, whereas the core concrete’s strength dropped to just 82.87%. The nonuniform rust distribution was more detrimental to the cover concrete than the core concrete. As the corrosion degree rose, the nonuniform distribution of rust exerted internal pressure on the spun pile’s outer side, causing extensive cracking of the cover concrete and a significant decrease in the cover concrete’s comprehensive strength. Figure 11 shows the confining pressure for ages 0 and 75. The confining pressure of the spun pile reached a maximum value of 1.68 MPa, which was relatively low. It caused the stress–strain relationship of the core concrete to exhibit a brittle failure pattern, as shown in Figure 10b.
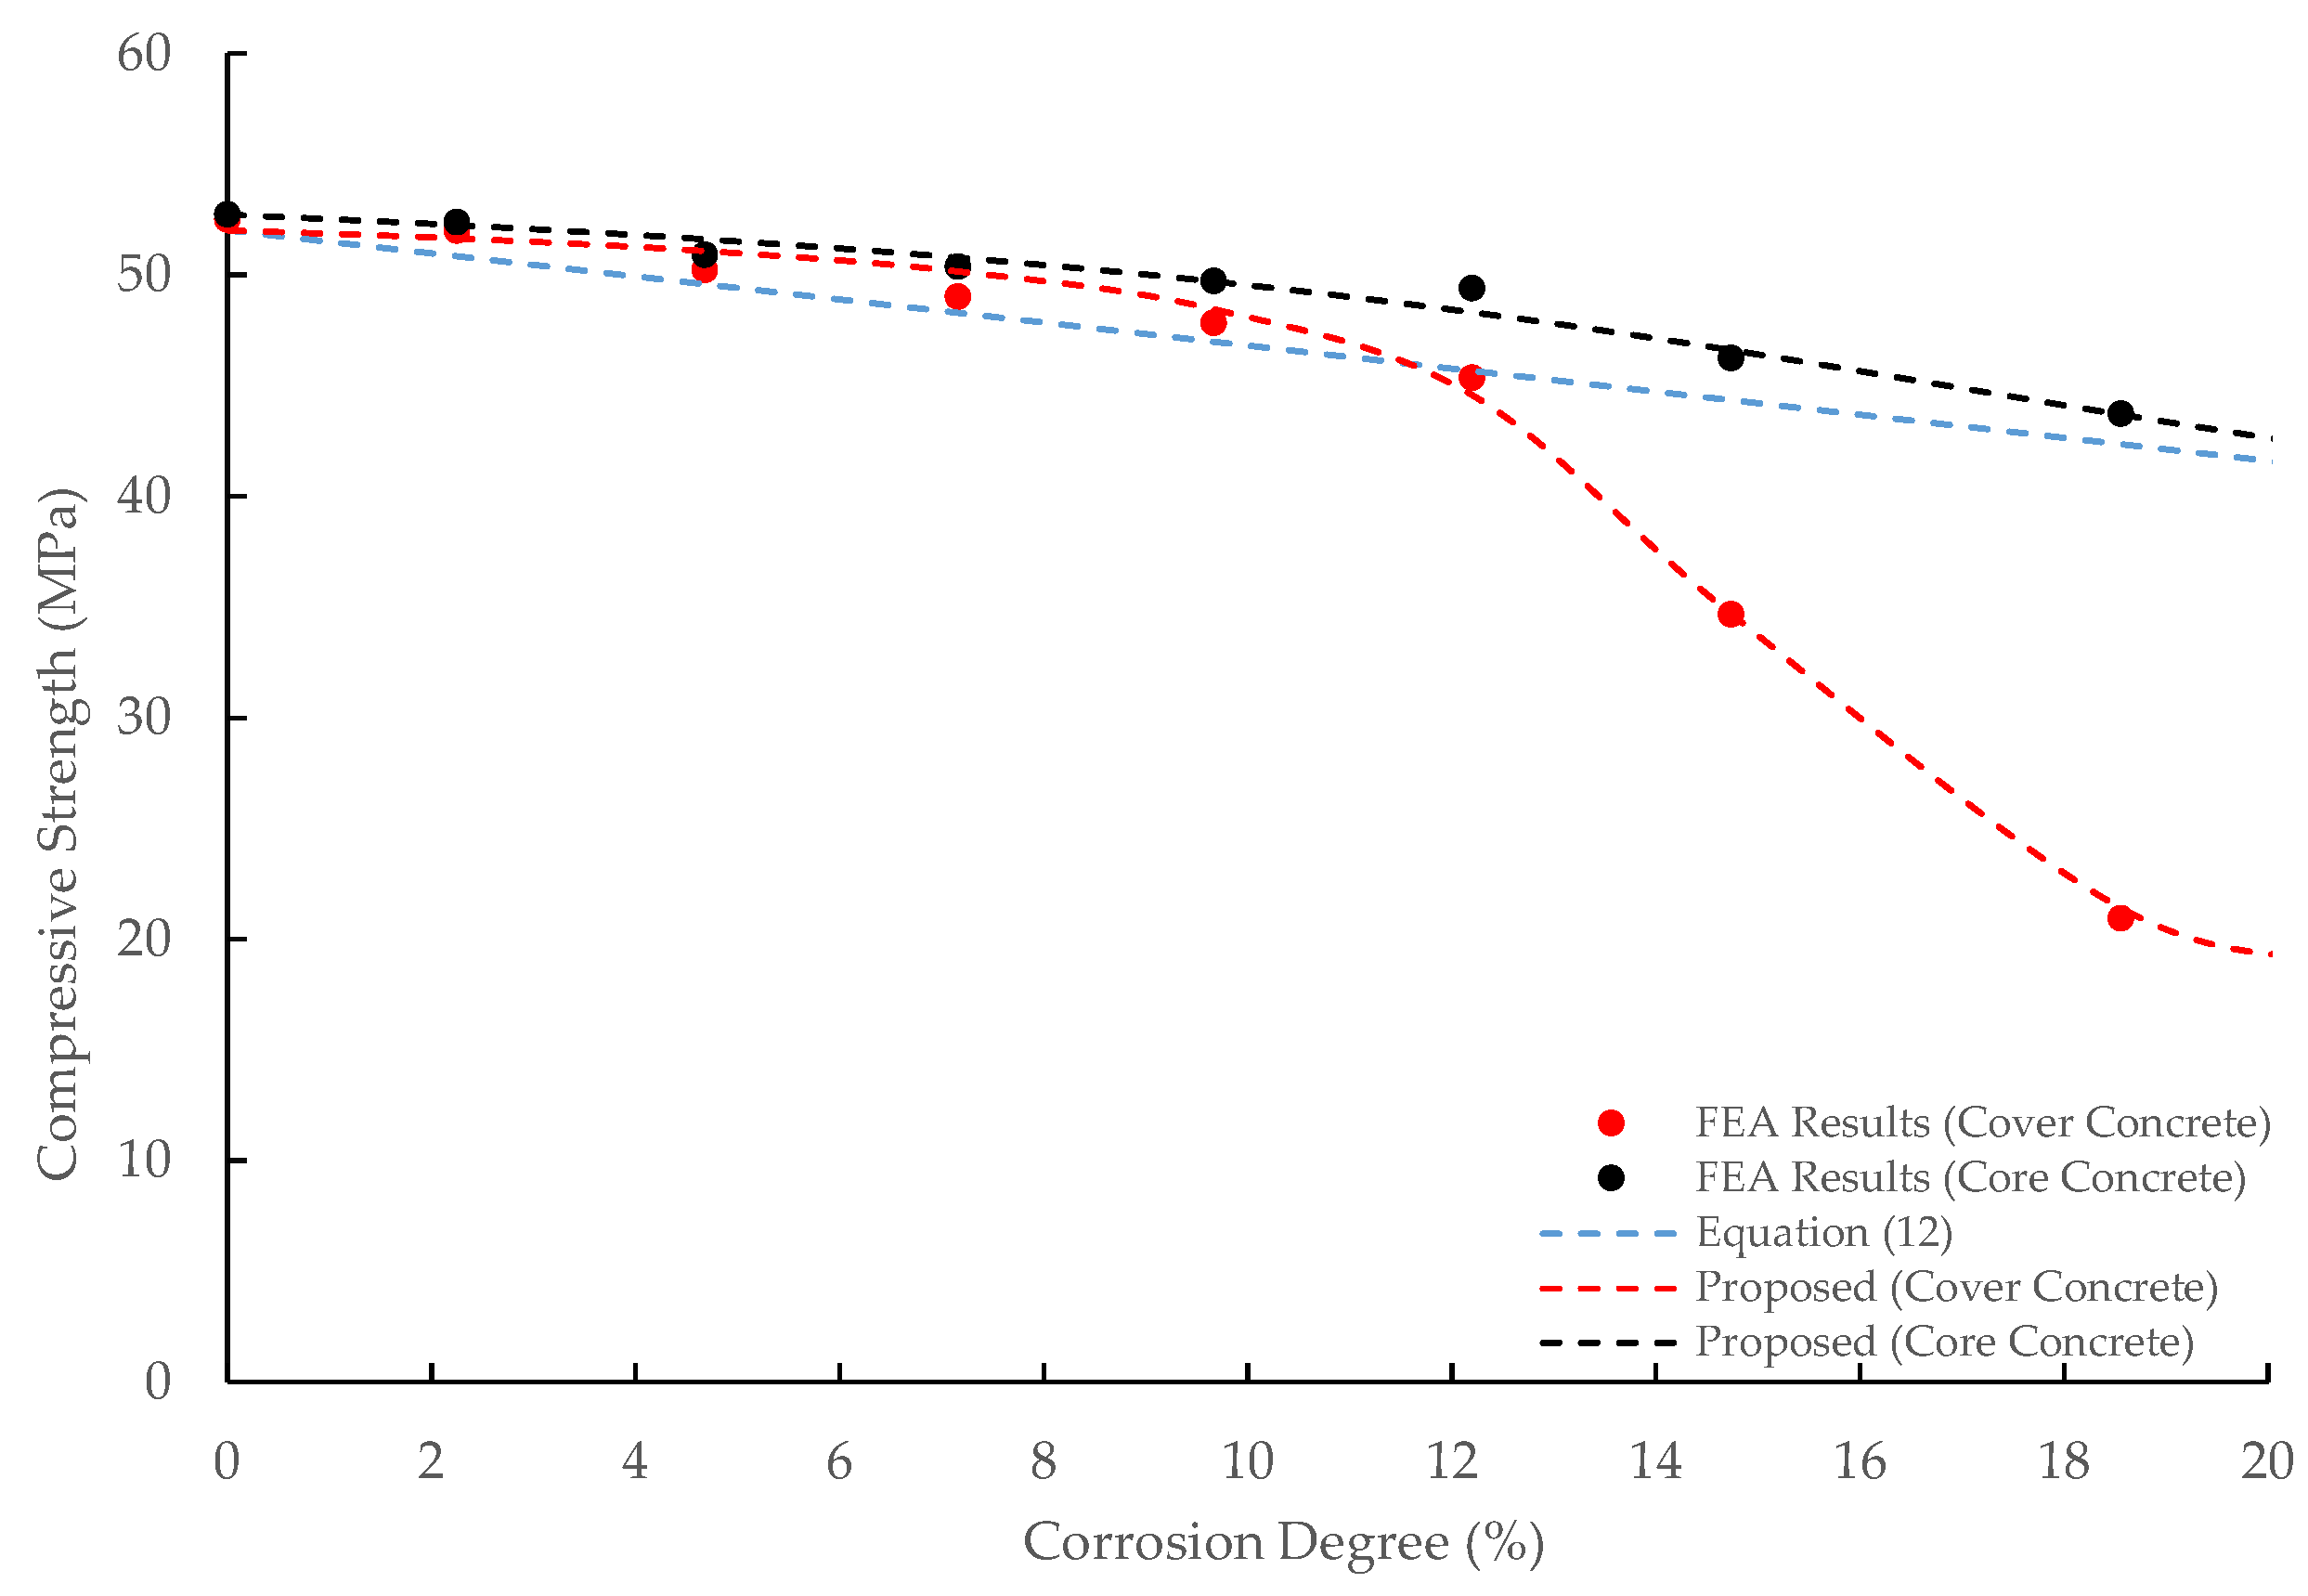
Figure 12 illustrates the relationship between the corrosion degree and the concrete compressive strength. The compressive strengths of the core and cover concrete were obtained by taking the ultimate axial stress values referred to in Figure 10. When the corrosion degree reached 18.56% (75 years), the compressive strength of core concrete decreased to 82.87% of its initial value, continuously dropping with the corrosion degree. The compressive strength of the cover concrete also gradually decreased with the increase in the corrosion degree in the range of the corrosion degree 11.50% or less. In contrast to the core concrete, after the corrosion degree reached 11.50%, the compressive strength of the cover concrete significantly dropped. When the corrosion degree reached 18.56%, the compressive strength of the cover concrete was 40.21% of its initial value.
Evaluation equations for the cover and core concrete compressive strengths following the corrosion degree were proposed as follows:
f c , c o r r = 0.25 tan 1   0.149 ψ 0.025   + 0.65 f c , 0
f c c , c o r r = 0.14 tan 1   0.17 ψ 0.1   + 0 . 848 f c c , 0
where f c , c o r r is the corroded cover concrete compressive strength; f c c , c o r r is the corroded core concrete compressive strength; f c , 0 is the initial cover concrete compressive strength; f c c , 0 is the initial core concrete compressive strength; and ψ is the corrosion degree.
Figure 12 also shows the concrete compressive strength predicted by Shayanfar et al. [14], which is expressed as follows:
f c , c o r r = 1 λ f c , 0
λ = 2.288 ψ 1.733
where f c , c o r r is the corroded concrete compressive strength; f c , 0 is the initial concrete compressive strength; λ is the percentage of compressive strength reduction; and ψ is the corrosion degree.
As regards the core concrete, the equation by Shayanfar et al. slightly underestimated the compressive strength. The explanation is that Shayanfar et al. considered normal concrete without considering the confinement effect. As for the cover concrete, the equation by Shayanfar et al. significantly overestimated the compressive strength in the range of the corrosion degree 11.50% or larger. Shayanfar et al. proposed the equation by referring to the data for the corrosion degree of 10% or less; therefore, their equation cannot predict the drastic decrease in the compressive strength of the cover concrete in the extensive corrosion degree range.

3.4. Corrosion Effect on Bond Strength

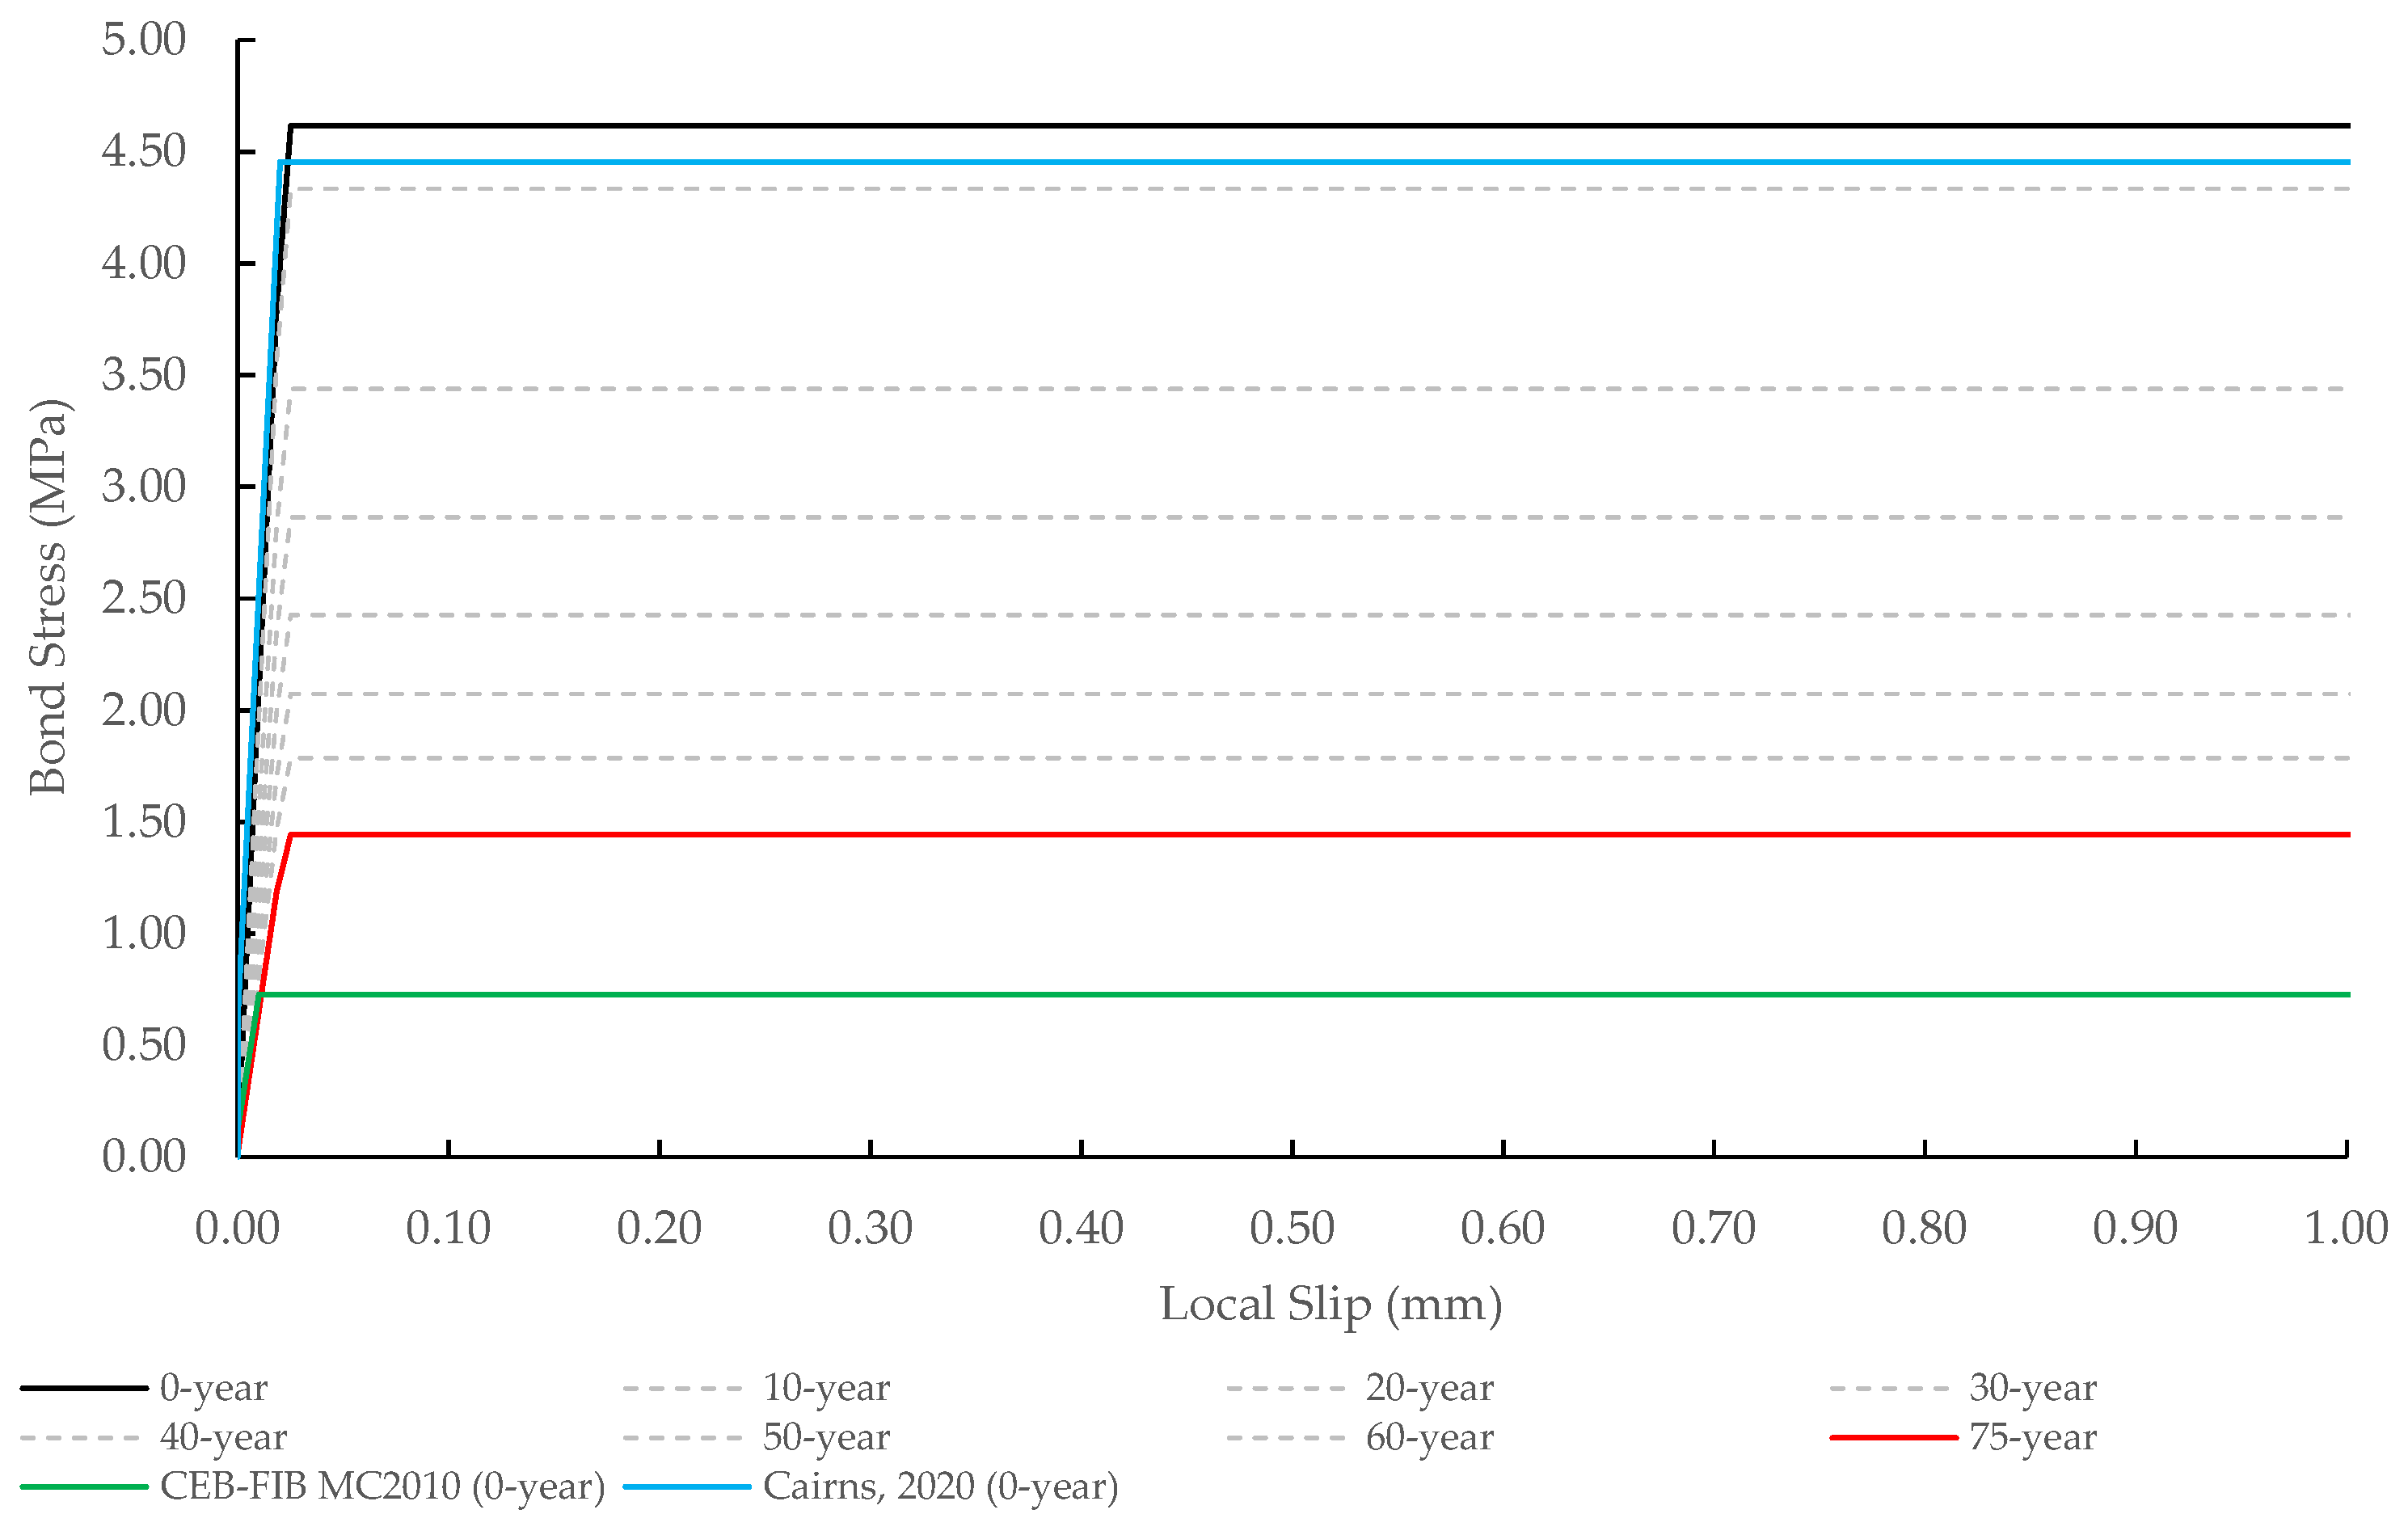
Figure 13 illustrates the local bond–slip relationship for the PC-bars. The black line is the bond–slip without corrosion (0 years), while the red line represents the bond–slip at 75 years. The dotted lines between these two solid lines show the bond–slip relationship corresponding to points in time from 10 years to 60 years. In the case without corrosion, the PC-bar began to slip when the bond stress reached 4.62 MPa. At 75 years, the bond stress decreased to 31.3% of the initial value due to cracks around the corroded PC-bar and concrete. Figure 13 also depicts the bond–slip relationship by using FIB Model Code 2010 [38] and Cairns [39]. The bond strength by using Cairns was similar to that of this study; however, Cairns did not examine the bond strength reduction with the progress of the corroding of the rebar. Furthermore, the bond strength by using the FIB Model Code 2010 was very conservative compared to the results of this study. The explanation is that the FIB Model Code 2010 equation was derived from the average value of their test results for various compressive strengths of standard concrete, rebar diameters, and anchorage depths.
The following equations were proposed for the bond strength of corroded PC-bar as a function of the corrosion degree:
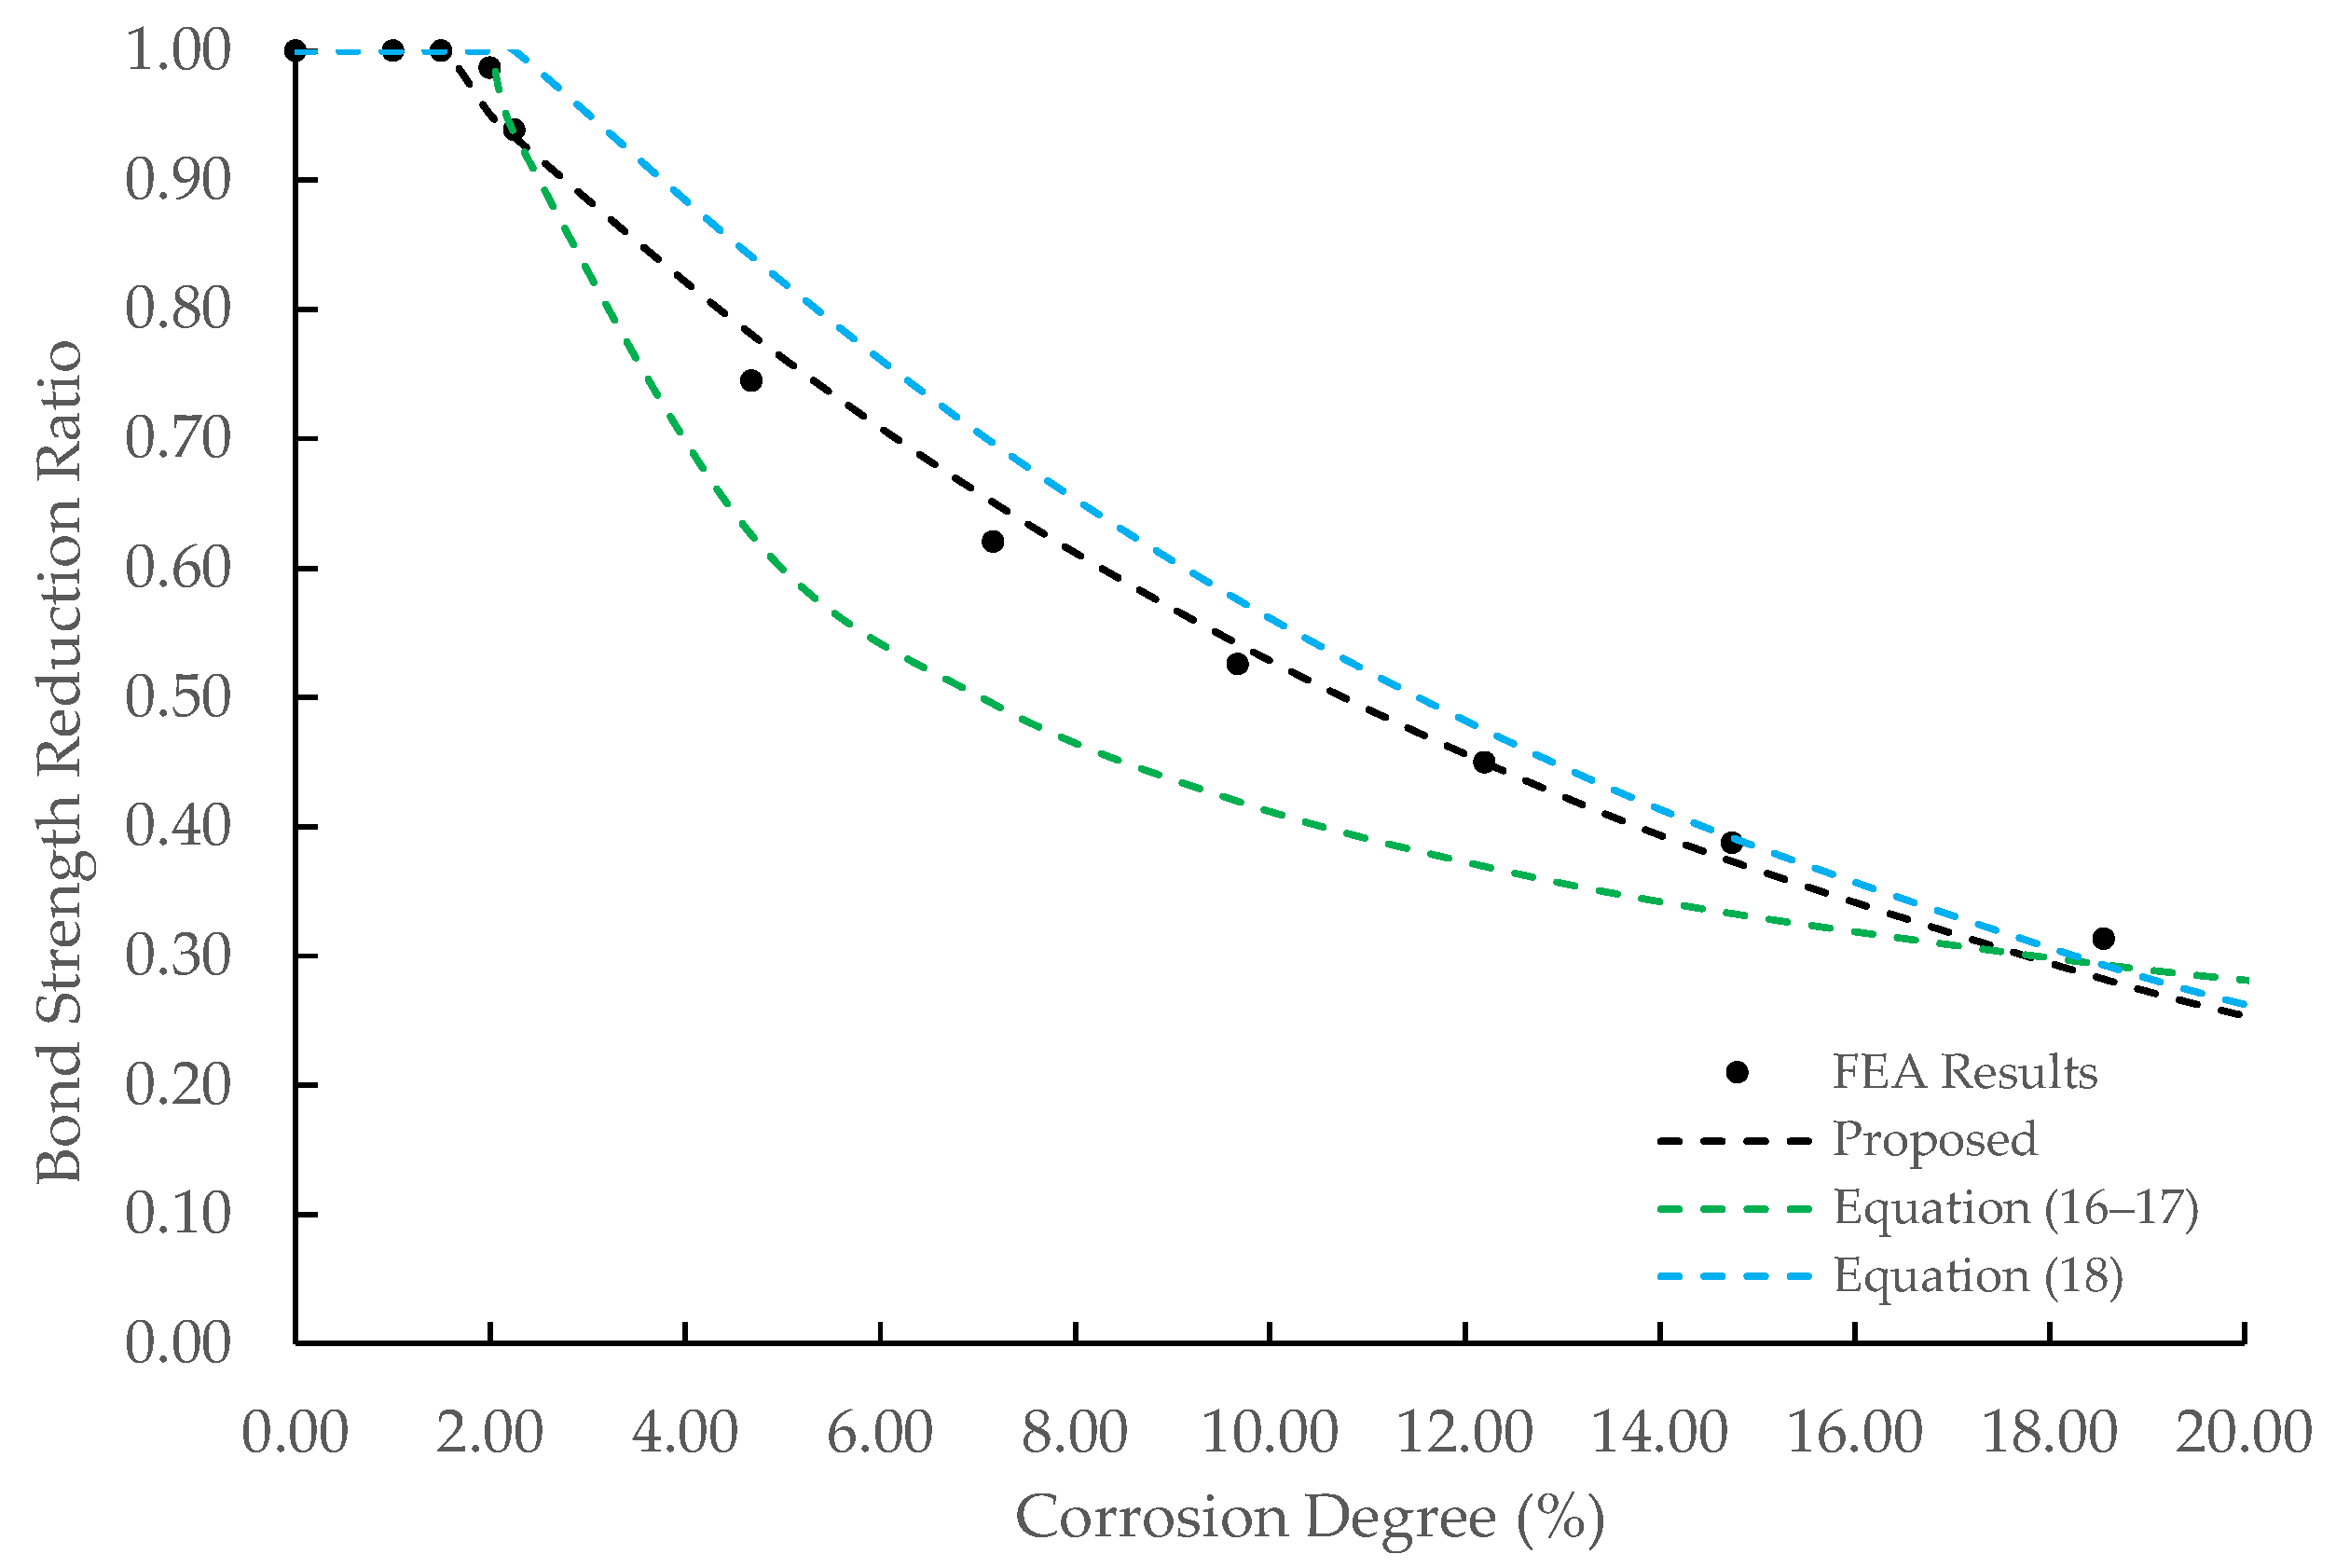
τ b , c o r r = ( 1.1 e 7.335 ψ ) τ b , 0   for   ψ   >   1.3 %
τ b , c o r r = τ b , 0   for   ψ     1.3 %
where τ b , c o r r is the bond strength of a corroded PC-bar; τ b , 0 is the initial PC-bar bond strength; and ψ is the corrosion degree.
The ratio of the bond strength of the corroded PC-bar to its initial bond strength was defined as the bond strength reduction ratio. Figure 14 shows the relationship between the corrosion degree and the bond strength reduction ratio. The bond strength decreased inverse-exponentially against the corrosion degree after the corrosion degree reached 1.3%. Figure 14 also compares the bond strength reduction ratio in this study to those in previous studies (Chung et al. [15] and Kivell [5]). Chung et al. proposed the bond strength as a function of corrosion degree as follows:
u b = 24.7 ψ 0.55   for   ψ   >   2.0
u b = 16.87   for   ψ     2.0
where u b is the bond strength and ψ is the corrosion degree in %. Kivell proposed the bond strength as an exponential function with corrosion degree as a variable, which is expressed as follows:
τ b , c o r r τ b , 0 = 1.2 e 0.076 ψ     1.0
where τ b , c o r r is the bond strength of a corroded rebar; τ b , 0 is the initial bond strength; and ψ is the corrosion degree in %.
Chung et al. discovered a smaller bond strength reduction ratio, while Kivell discovered a larger bond strength reduction ratio than the results of this study. Chung et al. conducted pull-out tests on specimens using deformed rebar and regular concrete, while Kivell considered high-strength concrete and bent rebar with confinement effects. Differences in specimen specifications (i.e., the concrete strength, the shape of the rebar’s surface, and the confinement effect) caused differences in bond strength between their study and the present study. Furthermore, the concrete rupture failure mechanism influenced the bond strength between the deformed rebar and the concrete due to the influence of the rebar ribs and the subsequent bond–slip failure mechanism. In contrast, the bond strength between concrete and plain-surface PC-bar was only affected by the bond–slip failure mechanism.

3.5. Corrosion Effect on Yield Strength of PC-Bar

Figure 15 depicts the stress–strain relationship for PC-bars. The rust posed the volumetric strain expansion to the PC-bar; therefore, stress concentration occurred on the PC-bar close to the rust when the tensile load was applied. As a result, the yield strength of the PC-bar decreased with time. After 75 years, the corrosion attacks had reduced the yield strength to 91.64% of its initial value.
The following equation was proposed to predict the yield strength of the corroded PC-bar:
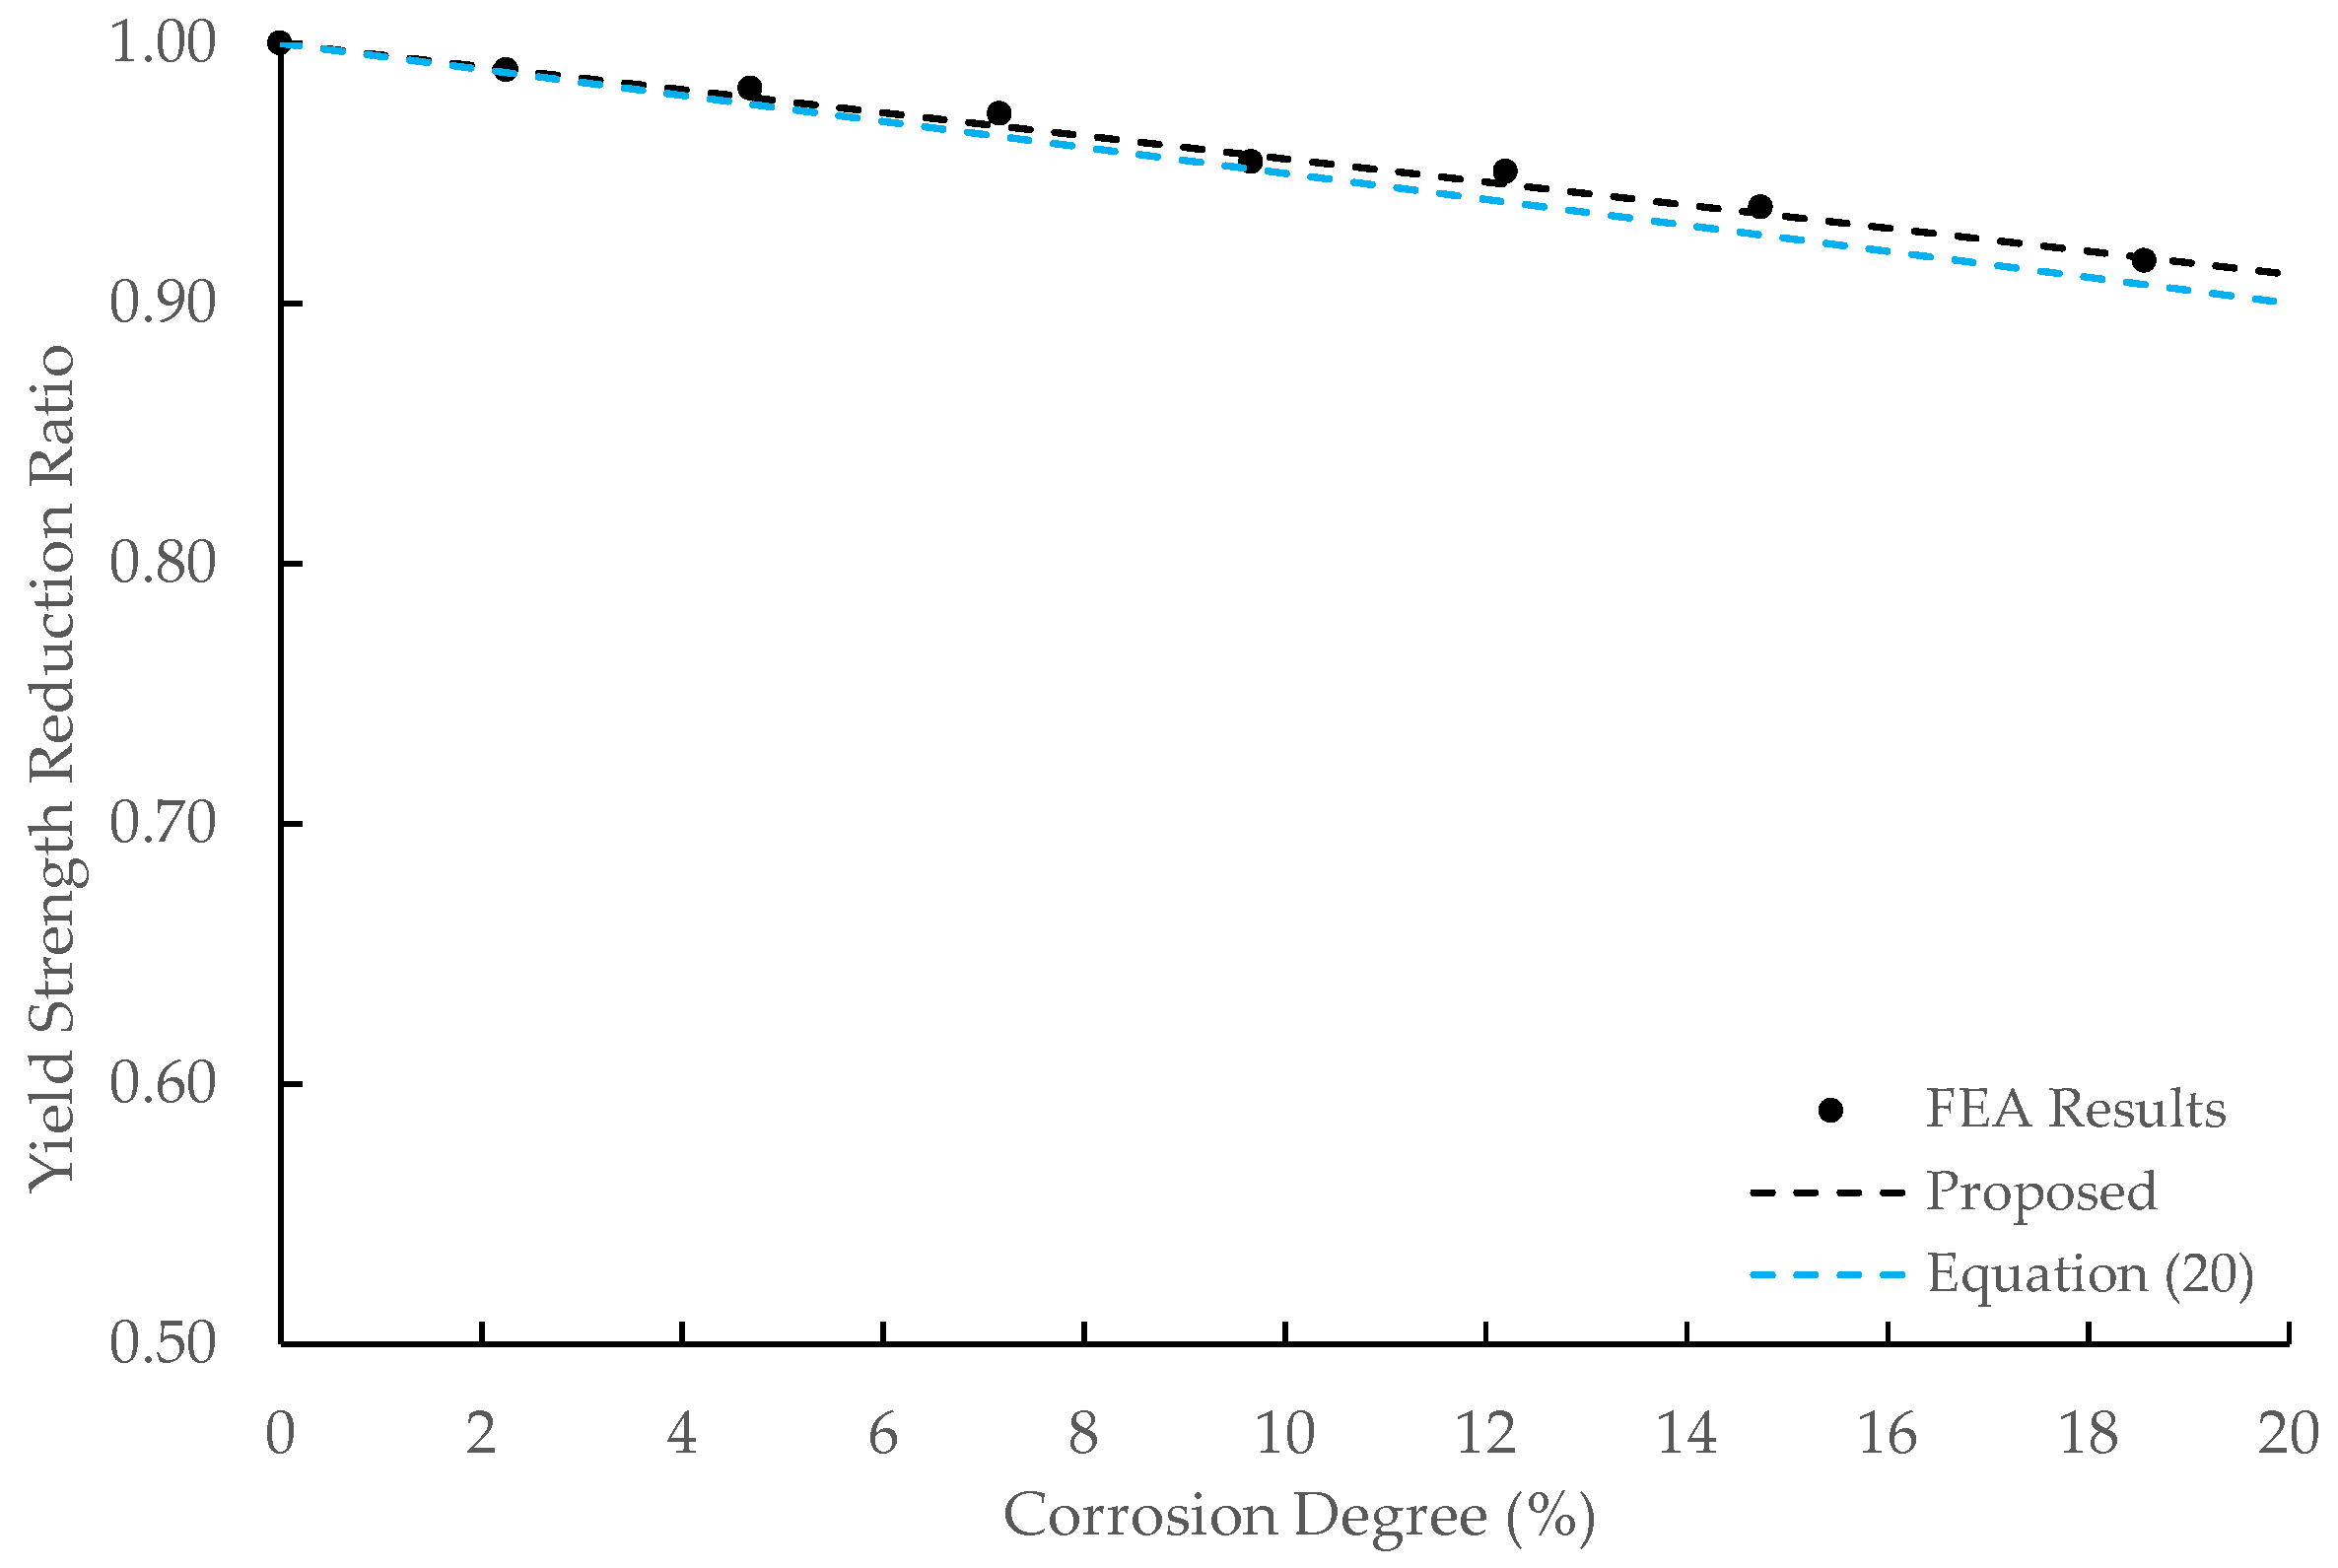
f y , c o r r = 1 0.4448 ψ f y , 0
where f y , c o r r is the yield strength of a corroded PC-bar; f y , 0 is the initial PC-bar yield strength; and ψ is the corrosion degree.
The yield strength reduction ratio was defined as the ratio of the yield strength of the corroded PC-bar to the initial yield strength. The relationship between the corrosion degree and the yield strength reduction ratio is shown in Figure 16. Additionally, Figure 16 shows the yield strength reduction ratio predicted by Du et al. [9], which is expressed as follows:
f y , c o r r = 1 0.005 ψ f y , 0
where f y , c o r r is the yield strength of a corroded rebar; f y , 0 is the initial yield strength of a rebar; and ψ is the corrosion degree in %.
The yield strength reduction ratio decreased linearly against the corrosion degree, which was in line with the result by Du et al. The high degree of fit of Equation (19) to the FEA results was indicated by a determination coefficient (R2) value of 0.987.

4. Conclusions

The mechanical properties of spun pile materials decrease due to corrosion attacks. This study comprehensively discussed the corrosion effect on the mechanical properties of spun pile materials using a 3D FEA. Additionally, the deterioration degrees of the concrete compressive strength, yield strength of PC-bar, and bond strength between PC-bar and concrete were investigated following the corrosion degree. The following conclusions were drawn from this study:
  • The diameter of the rebar affects the magnitude of the rust thickness. At the same corrosion degree, the rust thickness that occurred on the transverse rebar was more significant than the rust on the PC-bar.
  • The nonuniform rust distribution exerts an internal pressure on the outer side of the spun pile and influences the crack distribution in a spun pile section. As a result, interconnection cracks were predicted to form along the PC-bars at a corrosion degree larger than 10%. Cover concrete spalling was anticipated after the corrosion degree reached 14.74%.
  • The nonuniform rust distribution caused a significant compressive strength reduction in the cover concrete compared to the core concrete, primarily at corrosion degrees larger than 12%. The proposed equations successfully predicted the decline of the concrete compressive strength for the cover and core concrete. In contrast, the previous study’s equation slightly underestimated the core concrete compressive strength reduction. In addition, it significantly overestimated the cover concrete compressive strength reduction in the extensive corrosion degree range.
  • The bond strength was reduced inverse-exponentially against the corrosion degree due to cracks in the concrete around the corroded rebar. The proposed equation could predict the bond strength decrease precisely, while the equations proposed by previous studies overestimated or underestimated the FEA results.
  • The yield strength of the PC-bar was reduced linearly against the corrosion degree. The equation to predict the yield strength reduction ratio was proposed and was found in line with that suggested by a previous study.

Author Contributions

Conceptualization, A.N.R. and T.N.; methodology, A.N.R. and T.N.; software, A.N.R.; validation, A.N.R. and T.N.; formal analysis, A.N.R. and T.N.; investigation, A.N.R. and T.N.; resources, A.N.R. and T.N.; data curation, A.N.R.; writing—original draft preparation, A.N.R.; writing—review and editing, T.N.; visualization, A.N.R.; supervision, T.N.; project administration, A.N.R.; funding acquisition, A.N.R. All authors have read and agreed to the published version of the manuscript.

Funding

This research was funded by PT. Inti Teknik Solusi Cemerlang (ITSC), grant number 037/ADM.ITSC/VIII/2019, and the APC was funded by PT. ITSC.

Institutional Review Board Statement

Not applicable.

Informed Consent Statement

Not applicable.

Data Availability Statement

The datasets generated and/or analysed during the current study are available from the corresponding author upon reasonable request.

Acknowledgments

The authors would like to express their gratitude to Bambang Piscesa from Institut Teknologi Sepuluh Nopember for providing the 3D-NLFEA software package.

Conflicts of Interest

The authors declare no conflict of interest.

References

  1. JIS A 5335-1987; Pretensioned Spun Concrete Piles. Japanese Industrial Standards Committee: Tokyo, Japan, 1987.
  2. Apostolopoulos, C.A.; Papadakis, V.G. Consequences of Steel Corrosion on the Ductility Properties of Reinforcement Bar. Constr. Build. Mater. 2008, 22, 2316–2324. [Google Scholar] [CrossRef]
  3. Tuutti, K. Corrosion of Steel in Concrete; Swedish Cement and Concrete Research Institute: Stockholm, Sweden, 1982. [Google Scholar]
  4. Ge, X.; Dietz, M.S.; Alexander, N.A.; Kashani, M.M. Nonlinear Dynamic Behaviour of Severely Corroded Reinforced Concrete Columns: Shaking Table Study. Bull. Earthq. Eng. 2020, 18, 1417–1443. [Google Scholar] [CrossRef] [Green Version]
  5. Kivell, A. Effects of Bond Deterioration Due to Corrosion on Seismic Performance of Reinforced Concrete Structures; University of Canterbury: Christchurch, New Zealand, 2012. [Google Scholar]
  6. Zhao, Y.; Karimi, A.R.; Wong, H.S.; Hu, B.; Buenfeld, N.R.; Jin, W. Comparison of Uniform and Non-Uniform Corrosion Induced Damage in Reinforced Concrete Based on a Gaussian Description of the Corrosion Layer. Corros. Sci. 2011, 53, 2803–2814. [Google Scholar] [CrossRef] [Green Version]
  7. Stewart, M.G. Spatial Variability of Pitting Corrosion and Its Influence on Structural Fragility and Reliability of RC Beams in Flexure. Struct. Saf. 2004, 26, 453–470. [Google Scholar] [CrossRef]
  8. Ou, Y.C.; Susanto, Y.T.T.; Roh, H. Tensile Behavior of Naturally and Artificially Corroded Steel Bars. Constr. Build. Mater. 2016, 103, 93–104. [Google Scholar] [CrossRef]
  9. Du, Y.G.; Clark, L.A.; Chan, A.H.C. Residual Capacity of Corroded Reinforcing Bars. Mag. Concr. Res. 2005, 57, 135–147. [Google Scholar] [CrossRef]
  10. Kashani, M.M.; Crewe, A.J.; Alexander, N.A. Nonlinear Cyclic Response of Corrosion-Damaged Reinforcing Bars with the Effect of Buckling. Constr. Build. Mater. 2013, 41, 388–400. [Google Scholar] [CrossRef]
  11. Zhu, W.; François, R.; Poon, C.S.; Dai, J.G. Influences of Corrosion Degree and Corrosion Morphology on the Ductility of Steel Reinforcement. Constr. Build. Mater. 2017, 148, 297–306. [Google Scholar] [CrossRef]
  12. Fernandez, I.; Bairán, J.M.; Marí, A.R. Mechanical Model to Evaluate Steel Reinforcement Corrosion Effects on σ-ε and Fatigue Curves. Experimental Calibration and Validation. Eng. Struct. 2016, 118, 320–333. [Google Scholar] [CrossRef] [Green Version]
  13. Almusallam, A.A. Effect of Degree of Corrosion on the Properties of Reinforcing Steel Bars. Constr. Build. Mater. 2001, 15, 361–368. [Google Scholar] [CrossRef]
  14. Shayanfar, M.A.; Barkhordari, M.A.; Ghanooni-Bagha, M. Effect of Longitudinal Rebar Corrosion on the Compressive Strength Reduction of Concrete in Reinforced Concrete Structure. Adv. Struct. Eng. 2016, 19, 897–907. [Google Scholar] [CrossRef]
  15. Chung, L.; Jay Kim, J.H.; Yi, S.T. Bond Strength Prediction for Reinforced Concrete Members with Highly Corroded Reinforcing Bars. Cem. Concr. Compos. 2008, 30, 603–611. [Google Scholar] [CrossRef]
  16. Bhargava, K.; Ghosh, A.K.; Mori, Y.; Ramanujam, S. Corrosion-Induced Bond Strength Degradation in Reinforced Concrete-Analytical and Empirical Models. Nucl. Eng. Des. 2007, 237, 1140–1157. [Google Scholar] [CrossRef]
  17. Mirzaeefard, H.; Hariri-Ardebili, M.A.; Mirtaheri, M. Time-Dependent Seismic Fragility Analysis of Corroded Pile-Supported Wharves with Updating Limit States. Soil Dyn. Earthq. Eng. 2021, 142, 106551. [Google Scholar] [CrossRef]
  18. Schmuhl, D.T.; Loos, S.; Hur, J.; Shafieezadeh, A. Time-Dependent Probabilistic Capacity Degradation Assessment of Prestressed Concrete Piles in Marine Environment. Struct. Infrastruct. Eng. 2018, 14, 1372–1385. [Google Scholar] [CrossRef]
  19. Qu, C.X.; Yi, T.H.; Li, H.N.; Chen, B. Closely Spaced Modes Identification through Modified Frequency Domain Decomposition. Meas. J. Int. Meas. Confed. 2018, 128, 388–392. [Google Scholar] [CrossRef]
  20. Qu, C.X.; Yi, T.H.; Li, H.N. Mode Identification by Eigensystem Realization Algorithm through Virtual Frequency Response Function. Struct. Control Heal. Monit. 2019, 26, e2429. [Google Scholar] [CrossRef]
  21. Xi, X.; Yang, S.; Li, C.Q. A Non-Uniform Corrosion Model and Meso-Scale Fracture Modelling of Concrete. Cem. Concr. Res. 2018, 108, 87–102. [Google Scholar] [CrossRef] [Green Version]
  22. Jeon, C.H.; Lee, J.B.; Lon, S.; Shim, C.S. Equivalent Material Model of Corroded Prestressing Steel Strand. J. Mater. Res. Technol. 2019, 8, 2450–2460. [Google Scholar] [CrossRef]
  23. Vu, K.A.T.; Stewart, M.G. Structural Reliability of Concrete Bridges Including Improved Chloride-Induced Corrosion Models. Struct. Saf. 2000, 22, 313–333. [Google Scholar] [CrossRef]
  24. PT. Wijaya Karya Beton. Wika Beton Brochure—The Precast Concrete Manufacturer; PT. Wijaya Karya Beton: Bekasi, Indonesia, 2017. [Google Scholar]
  25. Piscesa, B.; Attard, M.M.; Samani, A.K.; Tangaramvong, S. Plasticity Constitutive Model for Stress-Strain Relationship of Confined Concrete. ACI Mater. J. 2017, 114, 361–371. [Google Scholar] [CrossRef]
  26. Chen, W.F.; Han, D.J. Plasticity for Structural Engineers; Springer: New York, NY, USA, 1988. [Google Scholar]
  27. Ranjbaran, A. Embedding of Reinforcements in Reinforced Concrete Elements Implemented in DENA. Comput. Struct. 1991, 40, 925–930. [Google Scholar] [CrossRef]
  28. Ranjbaran, A. Mathematical Formulation of Embedded Reinforcements in 3D Brick Elements. Commun. Numer. Methods Eng. 1996, 12, 897–903. [Google Scholar] [CrossRef]
  29. Xu, G.; Liu, L.; Bao, H.; Wang, Q.; Zhao, J. Mechanical Properties of Steel Corrosion Products in Reinforced Concrete. Mater. Struct. Constr. 2017, 50, 115. [Google Scholar] [CrossRef]
  30. Piscesa, B.; Attard, M.M.; Samani, A.K. 3D Finite Element Modeling of Circular Reinforced Concrete Columns Confined with FRP Using a Plasticity Based Formulation. Compos. Struct. 2018, 194, 478–493. [Google Scholar] [CrossRef]
  31. Piscesa, B.; Attard, M.M.; Prasetya, D.; Samani, A.K. Modeling Cover Spalling Behavior in High Strength Reinforced Concrete Columns Using a Plasticity-Fracture Model. Eng. Struct. 2019, 196, 109336. [Google Scholar] [CrossRef]
  32. Dwi Puspitasari, N.; Piscesa, B.; Mario, M.A.; Prasetya, D.; Faimun, F.; Aji, P.; Suprobo, P. Parameter Identification for Modeling Steel Fiber Reinforced Concrete under Compression to Prevent Concrete Cover Spalling under Severe Earthquake Loading Condition. E3S Web Conf. 2020, 156, 05028. [Google Scholar] [CrossRef] [Green Version]
  33. Piscesa, B.; Attard, M.M.; Samani, A.K. Three-Dimensional Finite Element Analysis of Circular Reinforced Concrete Column Confined with FRP Using Plasticity Model. Procedia Eng. 2017, 171, 847–856. [Google Scholar] [CrossRef]
  34. Hughes, T.J.R. The Finite Element Method—Linear Static and Dynamic Finite Element Analysis; Prentice-Hall Inc.: Englewood Cliffs, NJ, USA, 1987. [Google Scholar]
  35. Dang, H.K.; Yacoub, T.; Curran, J.; Visser, M.; Wai, D. Evaluate the Performance of an Accelerated Initial Stiffness Method in Three Dimensional Finite Element Analysis. Comput. Geotech. 2014, 62, 293–303. [Google Scholar] [CrossRef]
  36. Cerfontaine, B.; Dieudonné, A.C.; Radu, J.P.; Collin, F.; Charlier, R. 3D Zero-Thickness Coupled Interface Finite Element: Formulation and Application. Comput. Geotech. 2015, 69, 124–140. [Google Scholar] [CrossRef] [Green Version]
  37. Carol, I.; Prat, P.C.; Lopez, C.M. Normal/Shear Cracking Model: Application to Discrete Crack Analysis. J. Eng. Mech. 1997, 123, 765–773. [Google Scholar] [CrossRef]
  38. Fédération internationale du béton (fib). CEB-FIP Model Code 2010; International Federation for Structural Concrete (fib): Lausanne, Switzerland, 2010; ISBN 978-2-88394-095-6. [Google Scholar]
  39. Cairns, J. Local Bond–Slip Model for Plain Surface Reinforcement. Struct. Concr. 2021, 22, 666–675. [Google Scholar] [CrossRef]
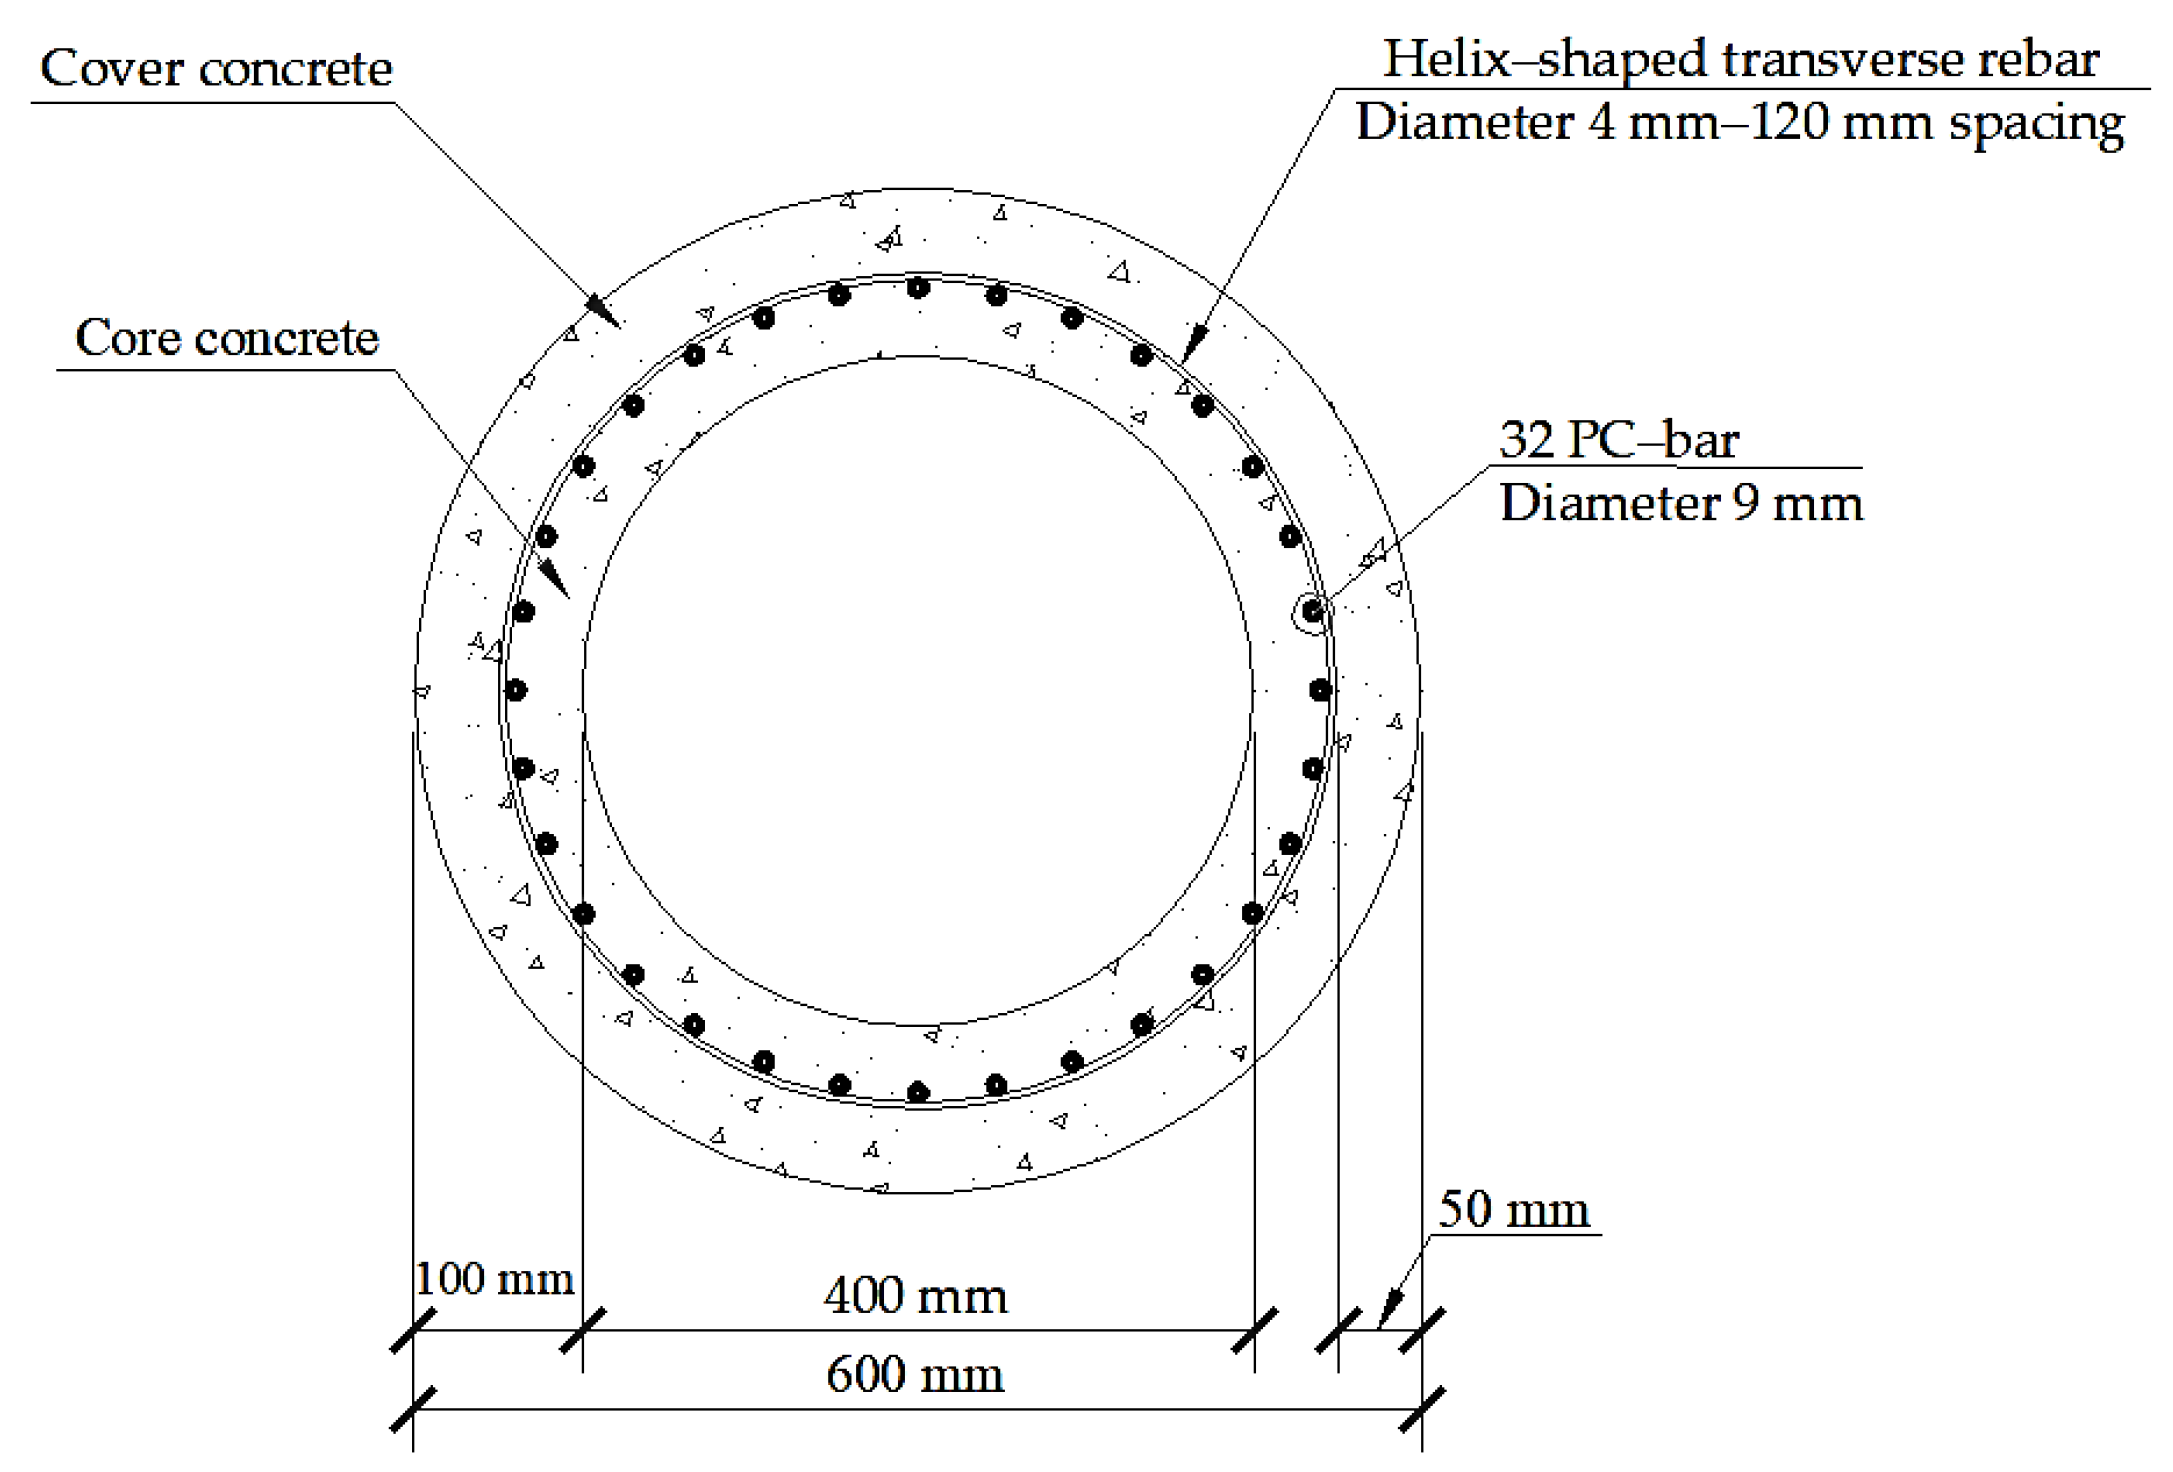
Figure 1. Spun pile dimensions.
Applsci 13 01507 g001
Figure 2. Three-dimensional finite element model of one quarter of the spun pile section.
Applsci 13 01507 g002
Figure 3. PC-bars and transverse rebars embedded in spun pile model.
Applsci 13 01507 g003
Figure 4. Failure surface of hyperbolic Mohr–Coulomb plasticity model illustration.
Applsci 13 01507 g004
Figure 5. Three kinds of analyses considered in this study: (a) Case 1; (b) Case 2; (c) Case 3.
Applsci 13 01507 g005
Figure 6. Nonuniform rust distribution. (a) PC-bar. (b) Transverse rebar.
Applsci 13 01507 g006
Figure 7. Time-dependent corrosion parameter. (a) Corrosion degree. (b) Corrosion rate.
Applsci 13 01507 g007
Figure 8. Rust expansion implemented as a volumetric strain expansion.
Applsci 13 01507 g008
Figure 9. Concrete strain distributions of the corroded spun pile. (a) 4.68% corrosion degree. (b) 9.67% corrosion degree. (c) 14.74% corrosion degree. (d) 18.56% corrosion degree.
Applsci 13 01507 g009aApplsci 13 01507 g009b
Figure 10. Concrete stress–strain relationships. (a) Cover concrete. (b) Core concrete.
Applsci 13 01507 g010aApplsci 13 01507 g010b
Figure 11. Confining pressure of the spun pile. (a) 0 years. (b) 75 years.
Applsci 13 01507 g011
Figure 12. Relationship between corrosion degree and concrete compressive strength.
Applsci 13 01507 g012
Figure 13. Local bond–slip relationship.
Applsci 13 01507 g013
Figure 14. Relationship between corrosion degree and bond strength reduction ratio.
Applsci 13 01507 g014
Figure 15. PC-bar stress–strain relationship.
Applsci 13 01507 g015
Figure 16. Relationship between corrosion degree and yield strength reduction ratio.
Applsci 13 01507 g016
Table 1. Mechanical properties of the spun pile materials.
Concrete Material Properties
f c Cover concrete compressive strength (MPa)52
εcStrain at cover concrete peak strength0.00275
f c c Core concrete compressive strength (MPa)52
εccStrain at core concrete peak strength0.00323
PC-Bar and Transverse Rebar Material Properties
f y PC-bar yield strength (MPa)1275
f u PC-bar ultimate strength (MPa)1420
EsPC-bar elastic modulus (MPa)196,500
σiniPC-bar initial stress (MPa)781
f y s Transverse rebar yield strength (MPa)360
f u s Transverse rebar ultimate strength (MPa)540
EssTransverse rebar elastic modulus (MPa)196,500
Disclaimer/Publisher’s Note: The statements, opinions and data contained in all publications are solely those of the individual author(s) and contributor(s) and not of MDPI and/or the editor(s). MDPI and/or the editor(s) disclaim responsibility for any injury to people or property resulting from any ideas, methods, instructions or products referred to in the content.