Abstract
Concrete sandwich walls are commonly used as the exterior wall panels of a structure, in which the wall suffers out-of-plane bending under strong wind conditions. This paper aims to investigate the bending performance of concrete sandwich walls under actual boundary conditions through experimental and analytical methods. In total, four concrete sandwich walls were tested to detect the influence of openings and loading direction. Typical failure patterns were characterized and discussed. The load-displacement curves of four test specimens were analyzed. It was indicated that the bearing capacity of the walls under negative bending conditions was higher than that under positive bending conditions, owing to the additional constraints provided by the steel beams. Strain distributions of wall specimens were also discussed in order to obtain the composite action of the sandwich walls between the upper and lower layers of concrete. In addition, the finite element model (FEM) was developed by ABAQUS to provide insights into the bending performance of the sandwich walls. Through comparison with the test results, the FEM was verified with a good level of accuracy. Subsequently, the degree of composite action of the sandwich walls was assessed in terms of both the moment of inertia and bearing capacity. From the experimental and numerical results, it demonstrated that the bearing capacity of concrete sandwiched wall under negative direction was higher than that under positive direction owing to the constraints of steel beam. The derived composite action degree could be employed to evaluate the out-plane bending stiffness and strength of sandwiched concrete wall. Both the experimental and analytical results in this paper are beneficial for the design of sandwich walls under bending conditions.
1. Introduction
Exterior wall panels are important parts of a structure, playing an indispensable role in sheltering against environmental conditions such as wind and rain. In the meantime, it is necessary for the wall panel to have satisfactory thermal and sound insulation, which is beneficial in providing a comfortable living environment for human beings. Moreover, a low self-weight is also expected for sandwich walls, especially in steel structures. Therefore, various lightweight and thermal insulation materials have been employed for use in the sandwich layer within the wall panel. Moreover, many other structural components also adopted sandwiched configurations [1,2,3]. However, these materials have a low bearing capacity. This also leads to more challenges for sandwich walls under bending conditions.
Many scholars have carried out experimental and numerical programs in order to analyze the performance of concrete sandwich walls under various loading conditions [4,5,6,7,8,9,10,11,12,13,14]. Among them, Xu et al. [5], Rao and Poluraju [8] and Xue et al. [9] performed experimental investigations on concrete sandwich wall panels in order to analyze their seismic performance. Lee and Pessiki [6] and Yu et al. [11] analyzed the thermal behavior of the concrete sandwich walls based on experimental and numerical approaches. Kumar et al., [4] reported the test results of FRP-reinforced concrete sandwich walls under concentric axial loading. Kontoleon et al., [10] discussed the vulnerability of concrete sandwich walls to fire, and Garhwal et al. [13] studied the corrosion performance of the concrete sandwich wall panels. In addition, Jensen et al. [7] developed an analytical model to predict the mechanical behavior of concrete sandwich walls under various loadings. It can be concluded that sandwich wall panels have attracted the attention of many scholars, and are widely employed in engineering practice.
Until now, great attention has been paid to the bending performance of various sandwich walls [15,16,17,18,19,20,21,22]. For example, Mercedes et al. [19] presented an experimental and numerical investigation of sandwich panels with a vegetal-fabric-reinforced cementitious matrix layer. Galletti et al. [20] proposed the design of a sandwich panel under bending conditions. McCann [21] examined the behavior of recycled glass bead sandwich panels under bending conditions. Liu et al. [22] reported the bending performance of curved sandwich panels. From these studies, it was revealed that the sandwich wall panels exhibited satisfactory bending performance. Among these studies, the sandwich panels were subjected to bending loads with pinned supports. The sandwich panels were generally employed as exterior walls and were connected to the main structure, usually based on angled steel connectors, in which the actual constraint of the sandwich wall panel used as an exterior wall was significantly different from the pinned supports. Therefore, it is necessary to detect the bending performance of sandwich walls under actual boundary conditions.
Against the background, current investigations mainly explored the bending performance of the concrete sandwiched wall under pinned supports. Little attention has been paid on the bending behavior of concrete sandwiched wall under actual support constraints. This paper attempts to discuss the out-of-plane bending performance of sandwich walls connected to the top and bottom beams, in which the sandwich wall analyzed in this paper did not bear vertical loads. In total, four sandwich wall specimens with extruded polystyrene foam (XPS) layers were prefabricated. Different loading directions and opening details were designed for the various specimens. Out-of-plane bending tests were performed to detect the bending behavior, and typical failure modes were discussed. Load–deflection curves were also characterized in some key points. Strain distributions of the sandwich walls along their thicknesses were analyzed to reveal the composite action between the concrete and XPS layers. Subsequently, finite element modeling (FEM) was also established, of which the accuracy of the FEM was validated by the test results. Stresses of the steel truss and reinforcement wires were also discussed. Furthermore, the degree of composite action between the two layers of concrete was assessed in terms of the moment of inertia and bearing capacity. The experimental and analytical performance could provide a reference for the bending performance of sandwich walls connected to the steel beams.
2. Experimental Program
2.1. Test Specimens
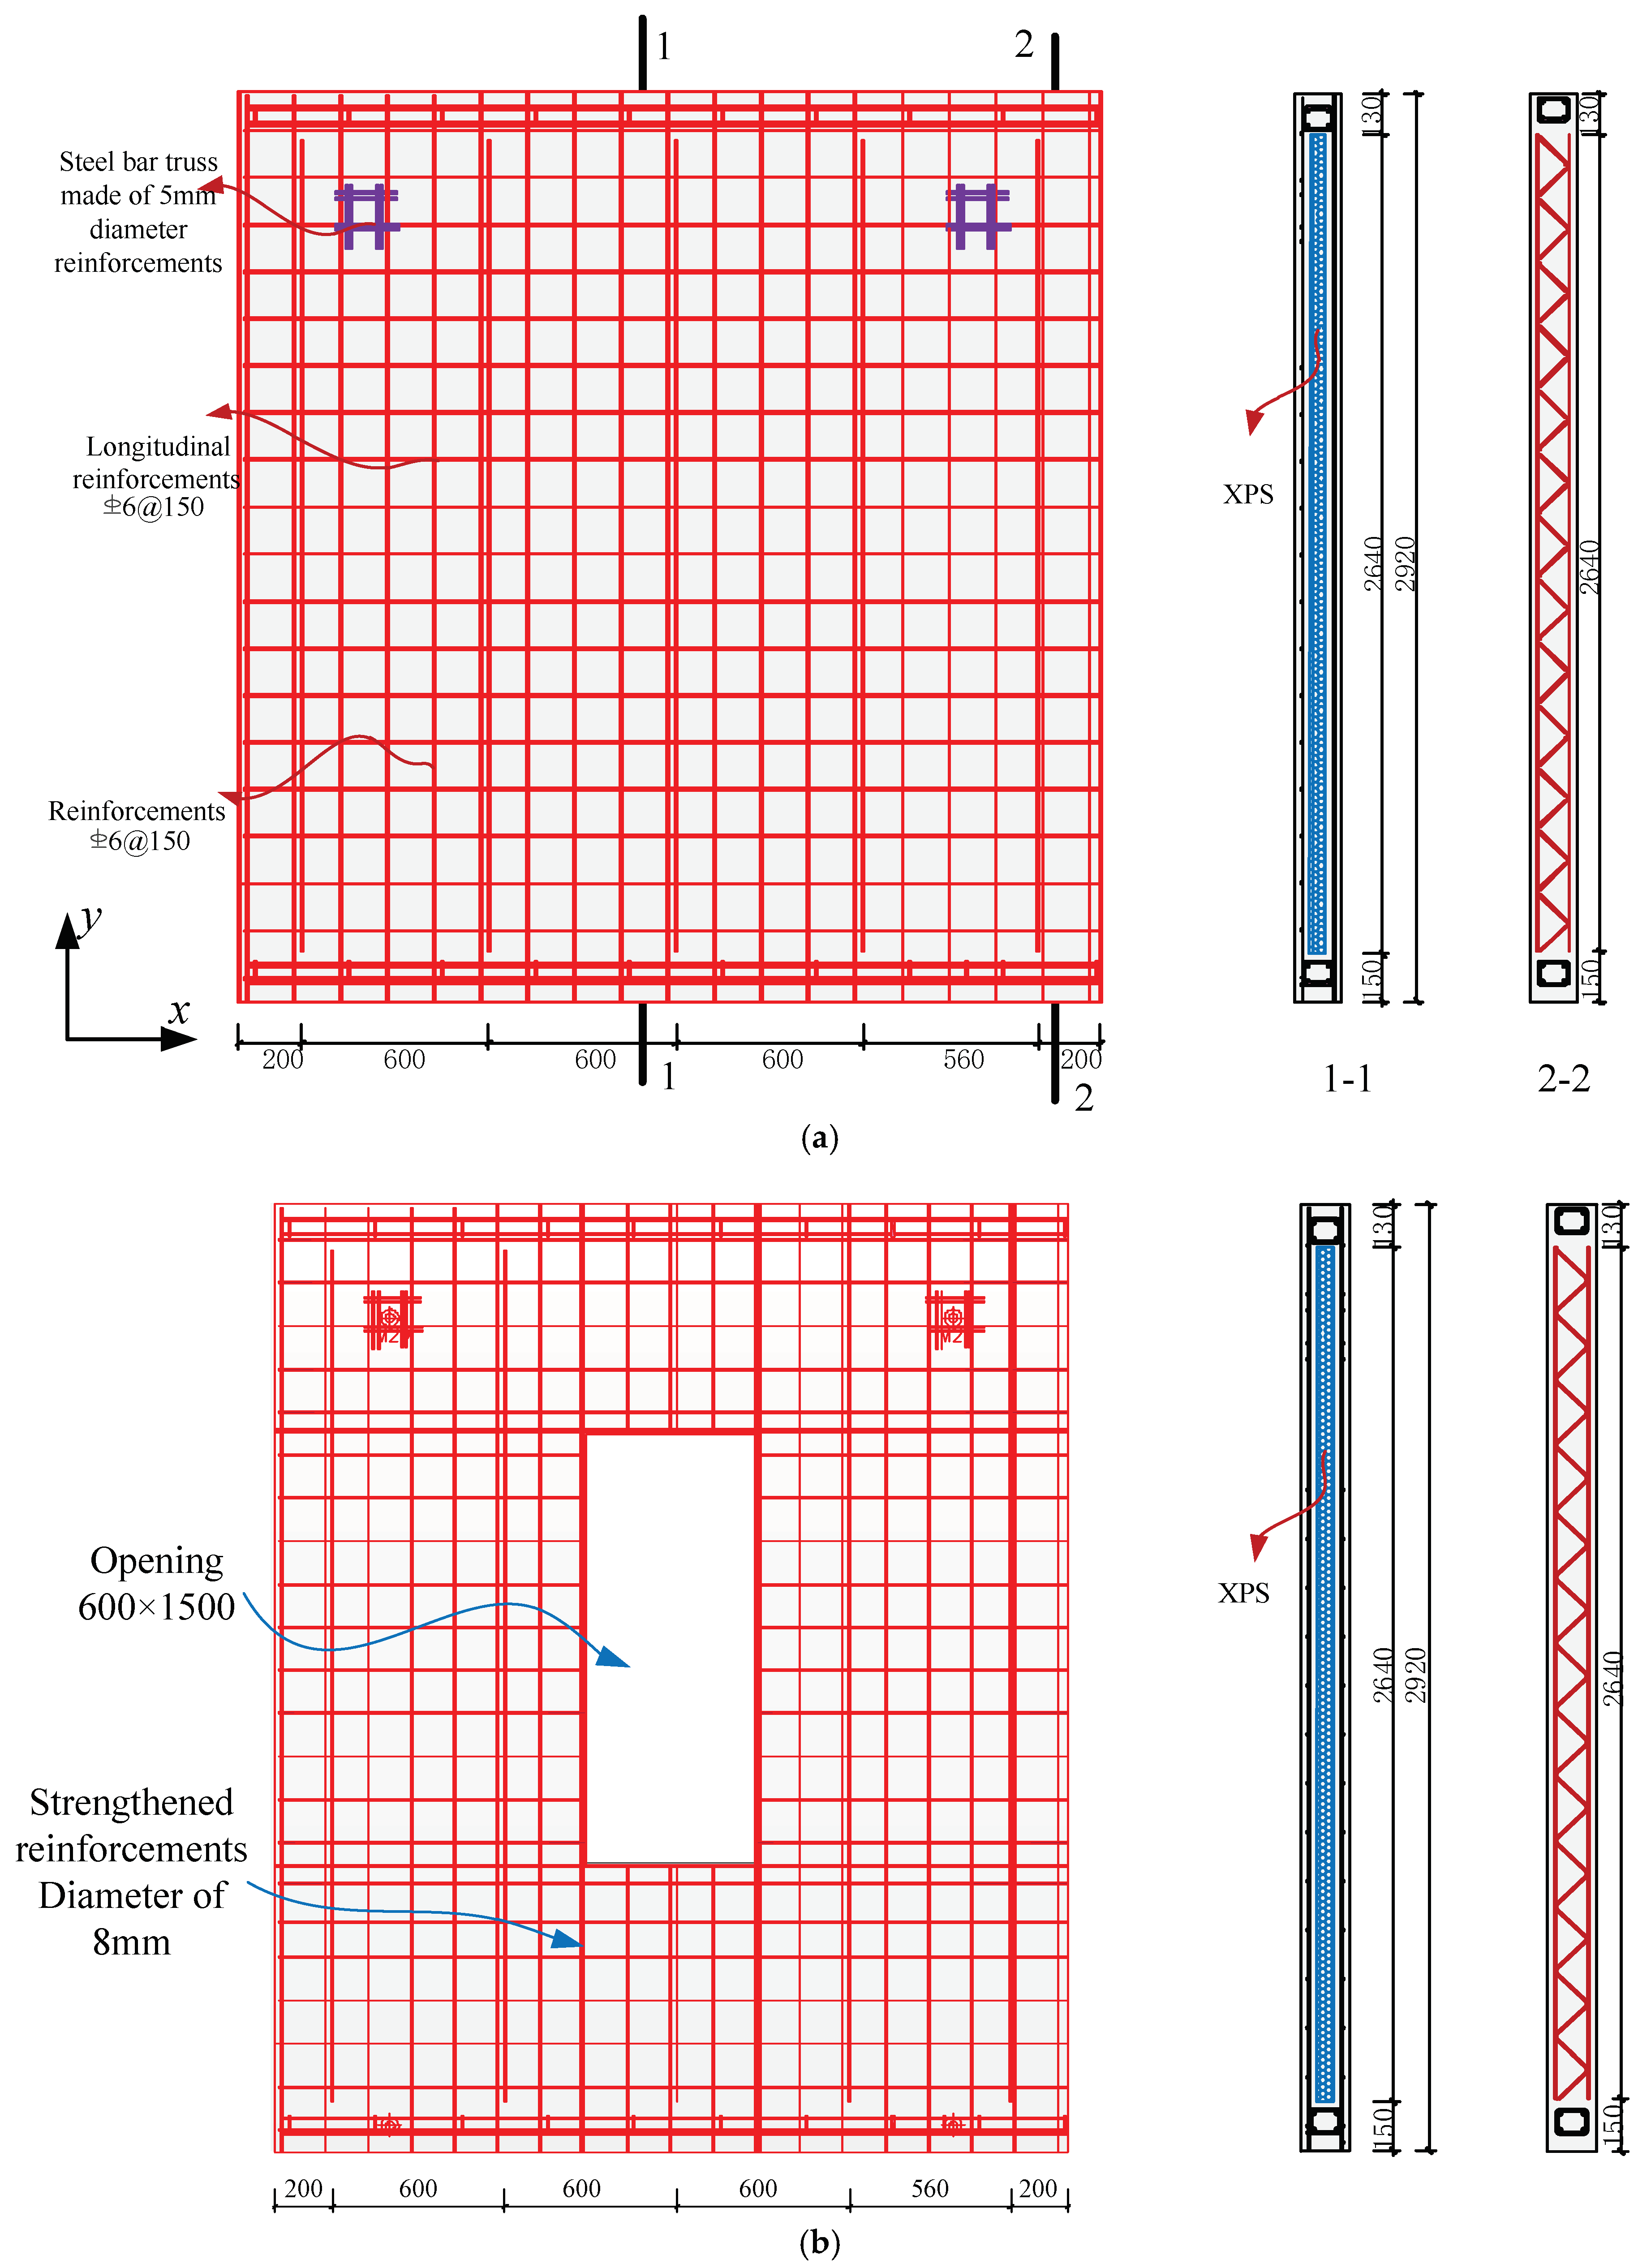
Two groups of wall test specimens were prefabricated with various opening configurations. Each group consisted of two test specimens with the same constructional details. There were four test specimens overall, namely WP, WN, WPO, and WNO, in which P and N represent positive loading and negative loading, respectively; O referred to the test specimen with an opening. The total height and width of wall specimens were set at 2920 mm and 2760, respectively. Extruded polystyrene (XPS) was employed as the insulation material, and two layers of concrete were clamped on both sides of XPS, forming a concrete sandwich wall panel, as shown in Figure 1. The thickness of the two layers of concrete and XPS was 50 mm. To avoid any cracking of the concrete sandwich walls, the thickness of the concrete layer was chosen at 50 mm, with a nominal compression strength of 30 MPa. The steel bar truss was embedded in the concrete layer, in which the reinforcements with a diameter of 6 mm were placed at average spaces of 150 mm. In addition, the steel bar truss deck, composed of short reinforcements with diameters of 6 mm, was used to firmly connect the two layers of concrete without passing through the XPS layer.
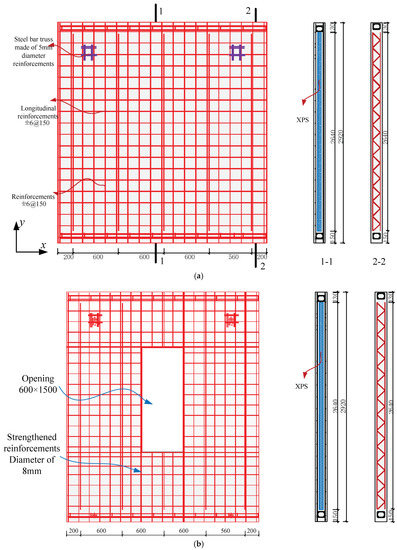
Figure 1.
Details of test specimens. (a) Specimens WP and WN. (b) Specimens WPO and WNO.
In the construction process, the bottom layer of concrete was first poured with the reinforcements embedded in it. Subsequently, the XPS layer was placed on top of the bottom layer of concrete. Finally, the upper layer of concrete was poured.
2.2. Material Properties
The density and thermal conductivity of XPS used in this paper were 30 kg/m3 and 0.03 W/(m.k), respectively. Key reinforcements were extracted to conduct material tests in order to accurately capture the necessary properties from the material according to the tensile tests method for reinforcements shown in GB/T2975 [23]. Test results from the reinforcement components are shown in Table 1. Material tests were also performed to acquire the concrete material properties, as depicted in Table 2.

Table 1.
Material properties of reinforcement.
Table 2.
Material properties of concrete.
2.3. Loading Procedure
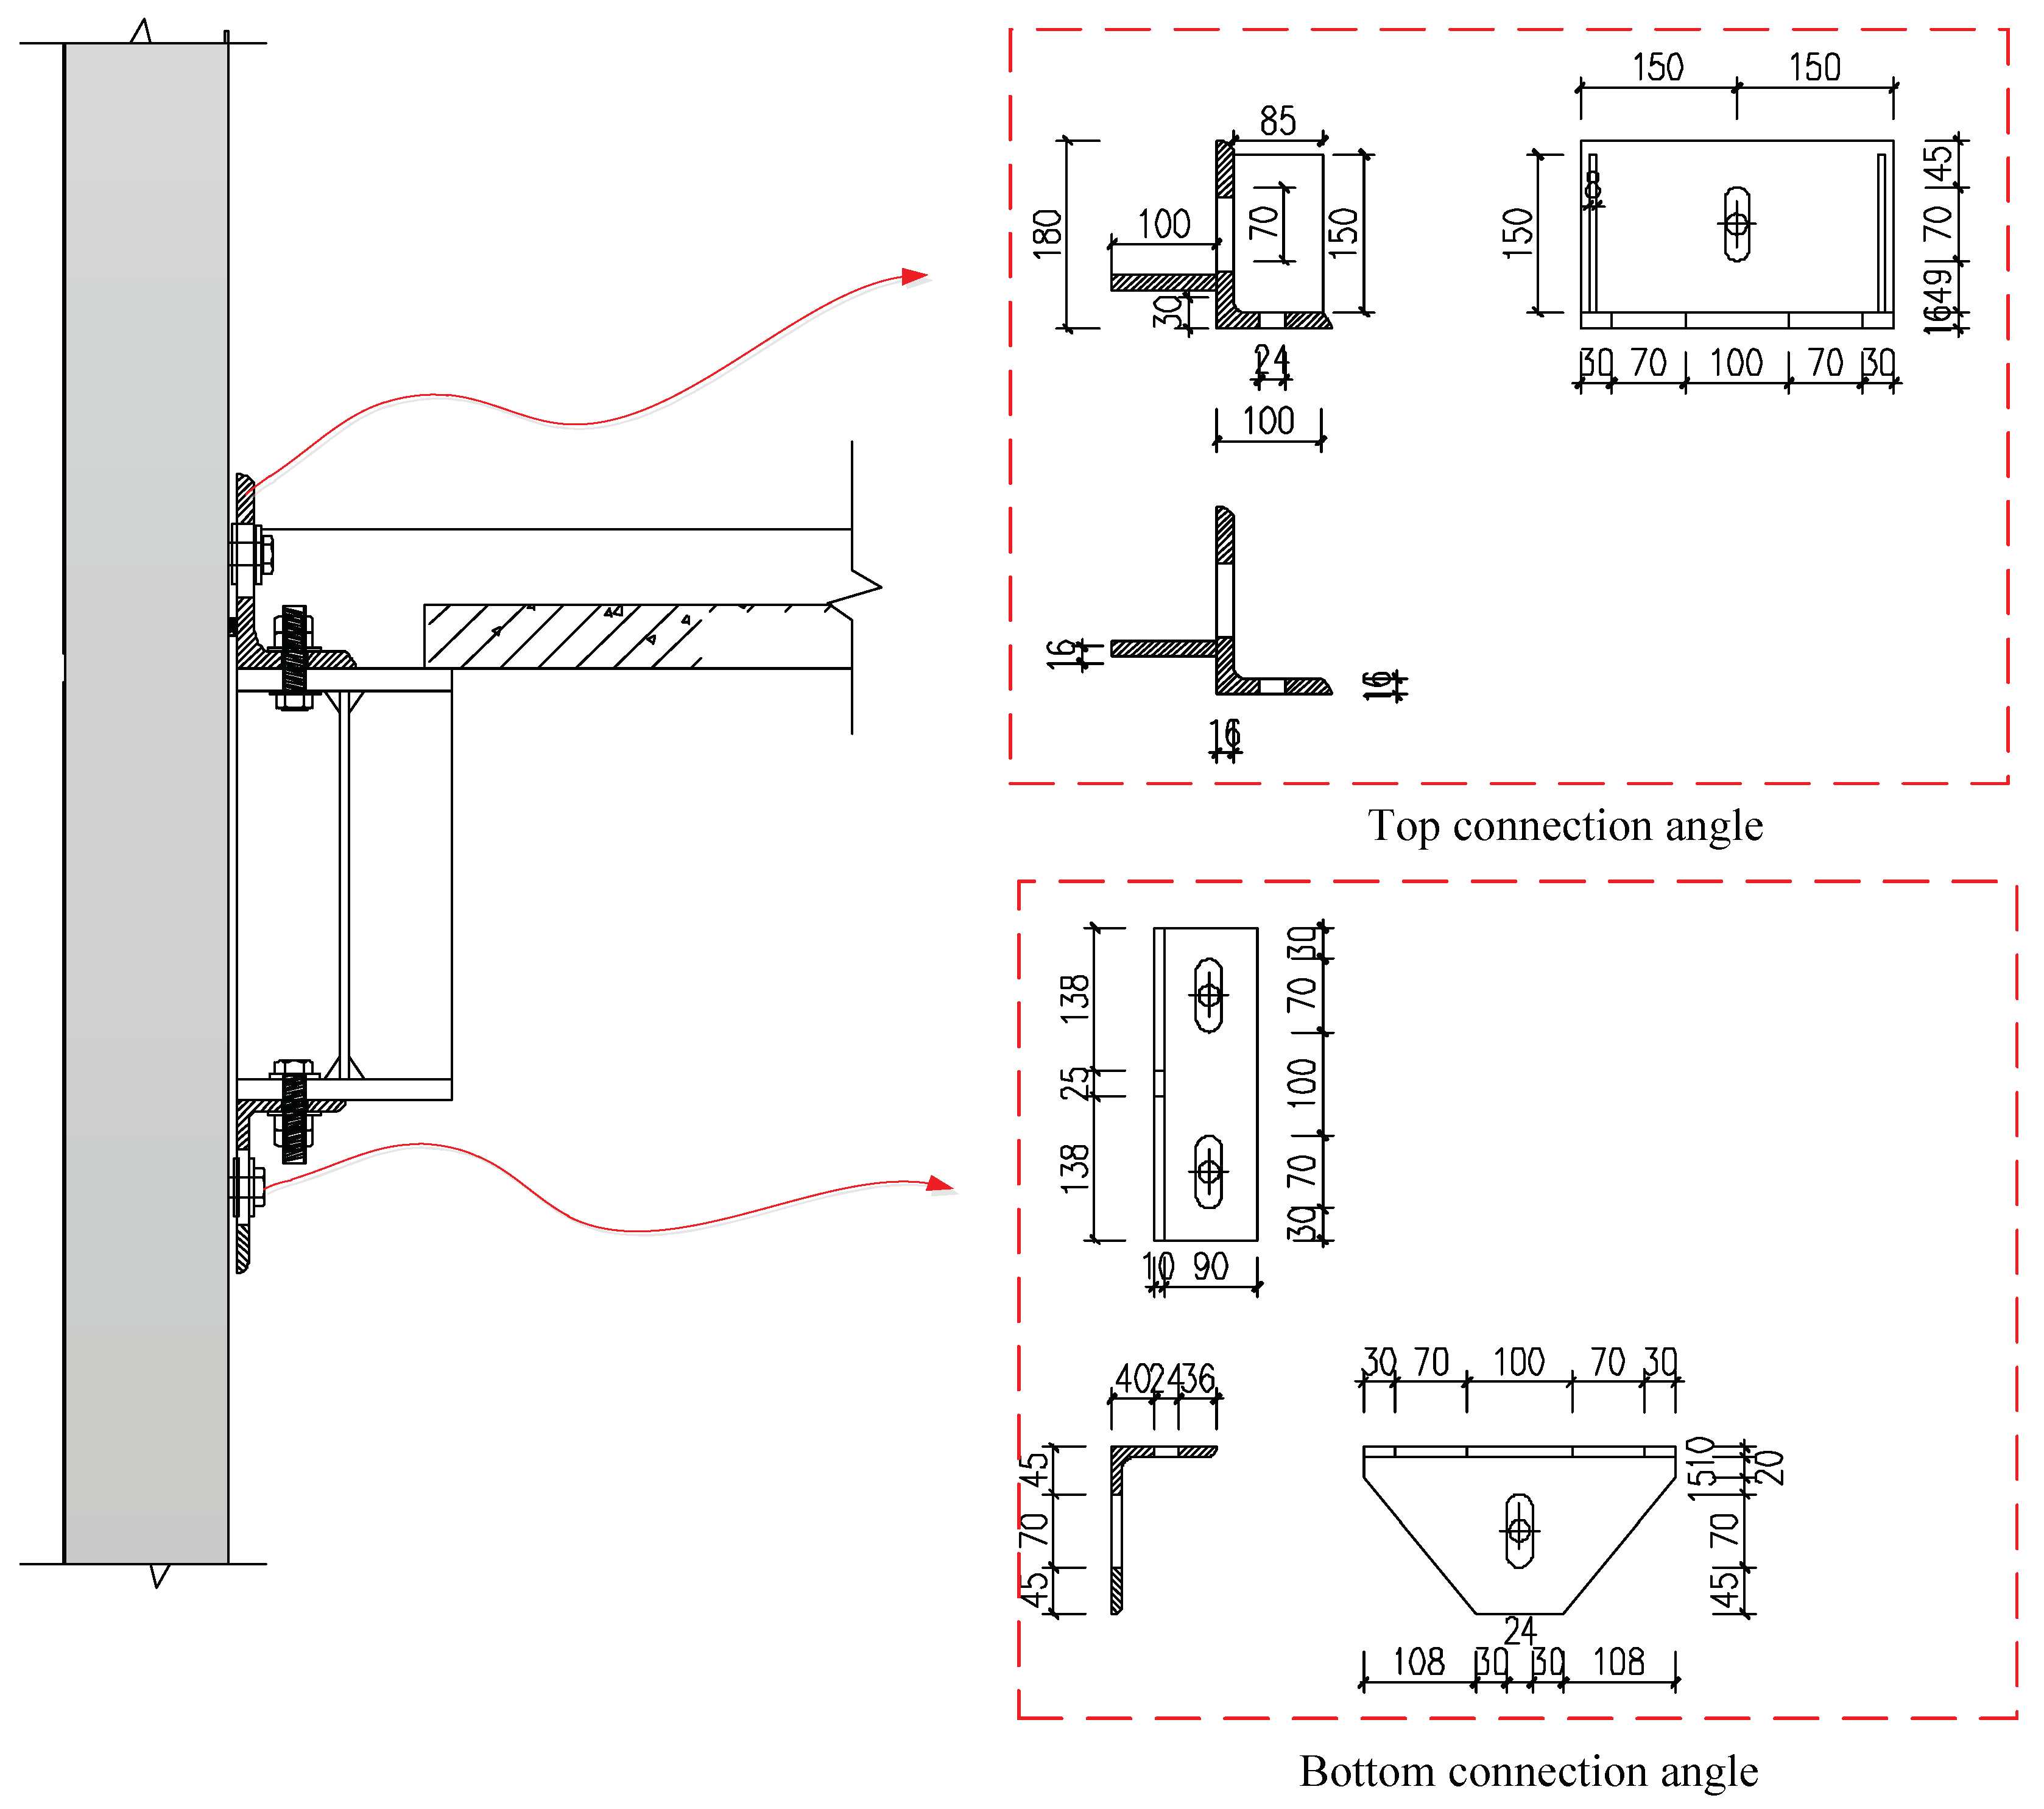
To investigate the performance of the wall specimens under both positive and negative bending conditions, specimens WP and WPO were tested under positive bending conditions, whereas specimens WN and WNO were subjected to negative bending conditions. Test specimens were connected to the steel beam using top and bottom angle connectors, as shown in Figure 2.
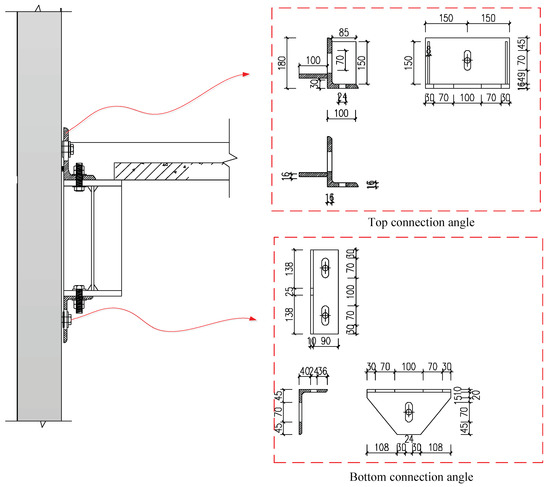
Figure 2.
Connection details (Unit: mm).
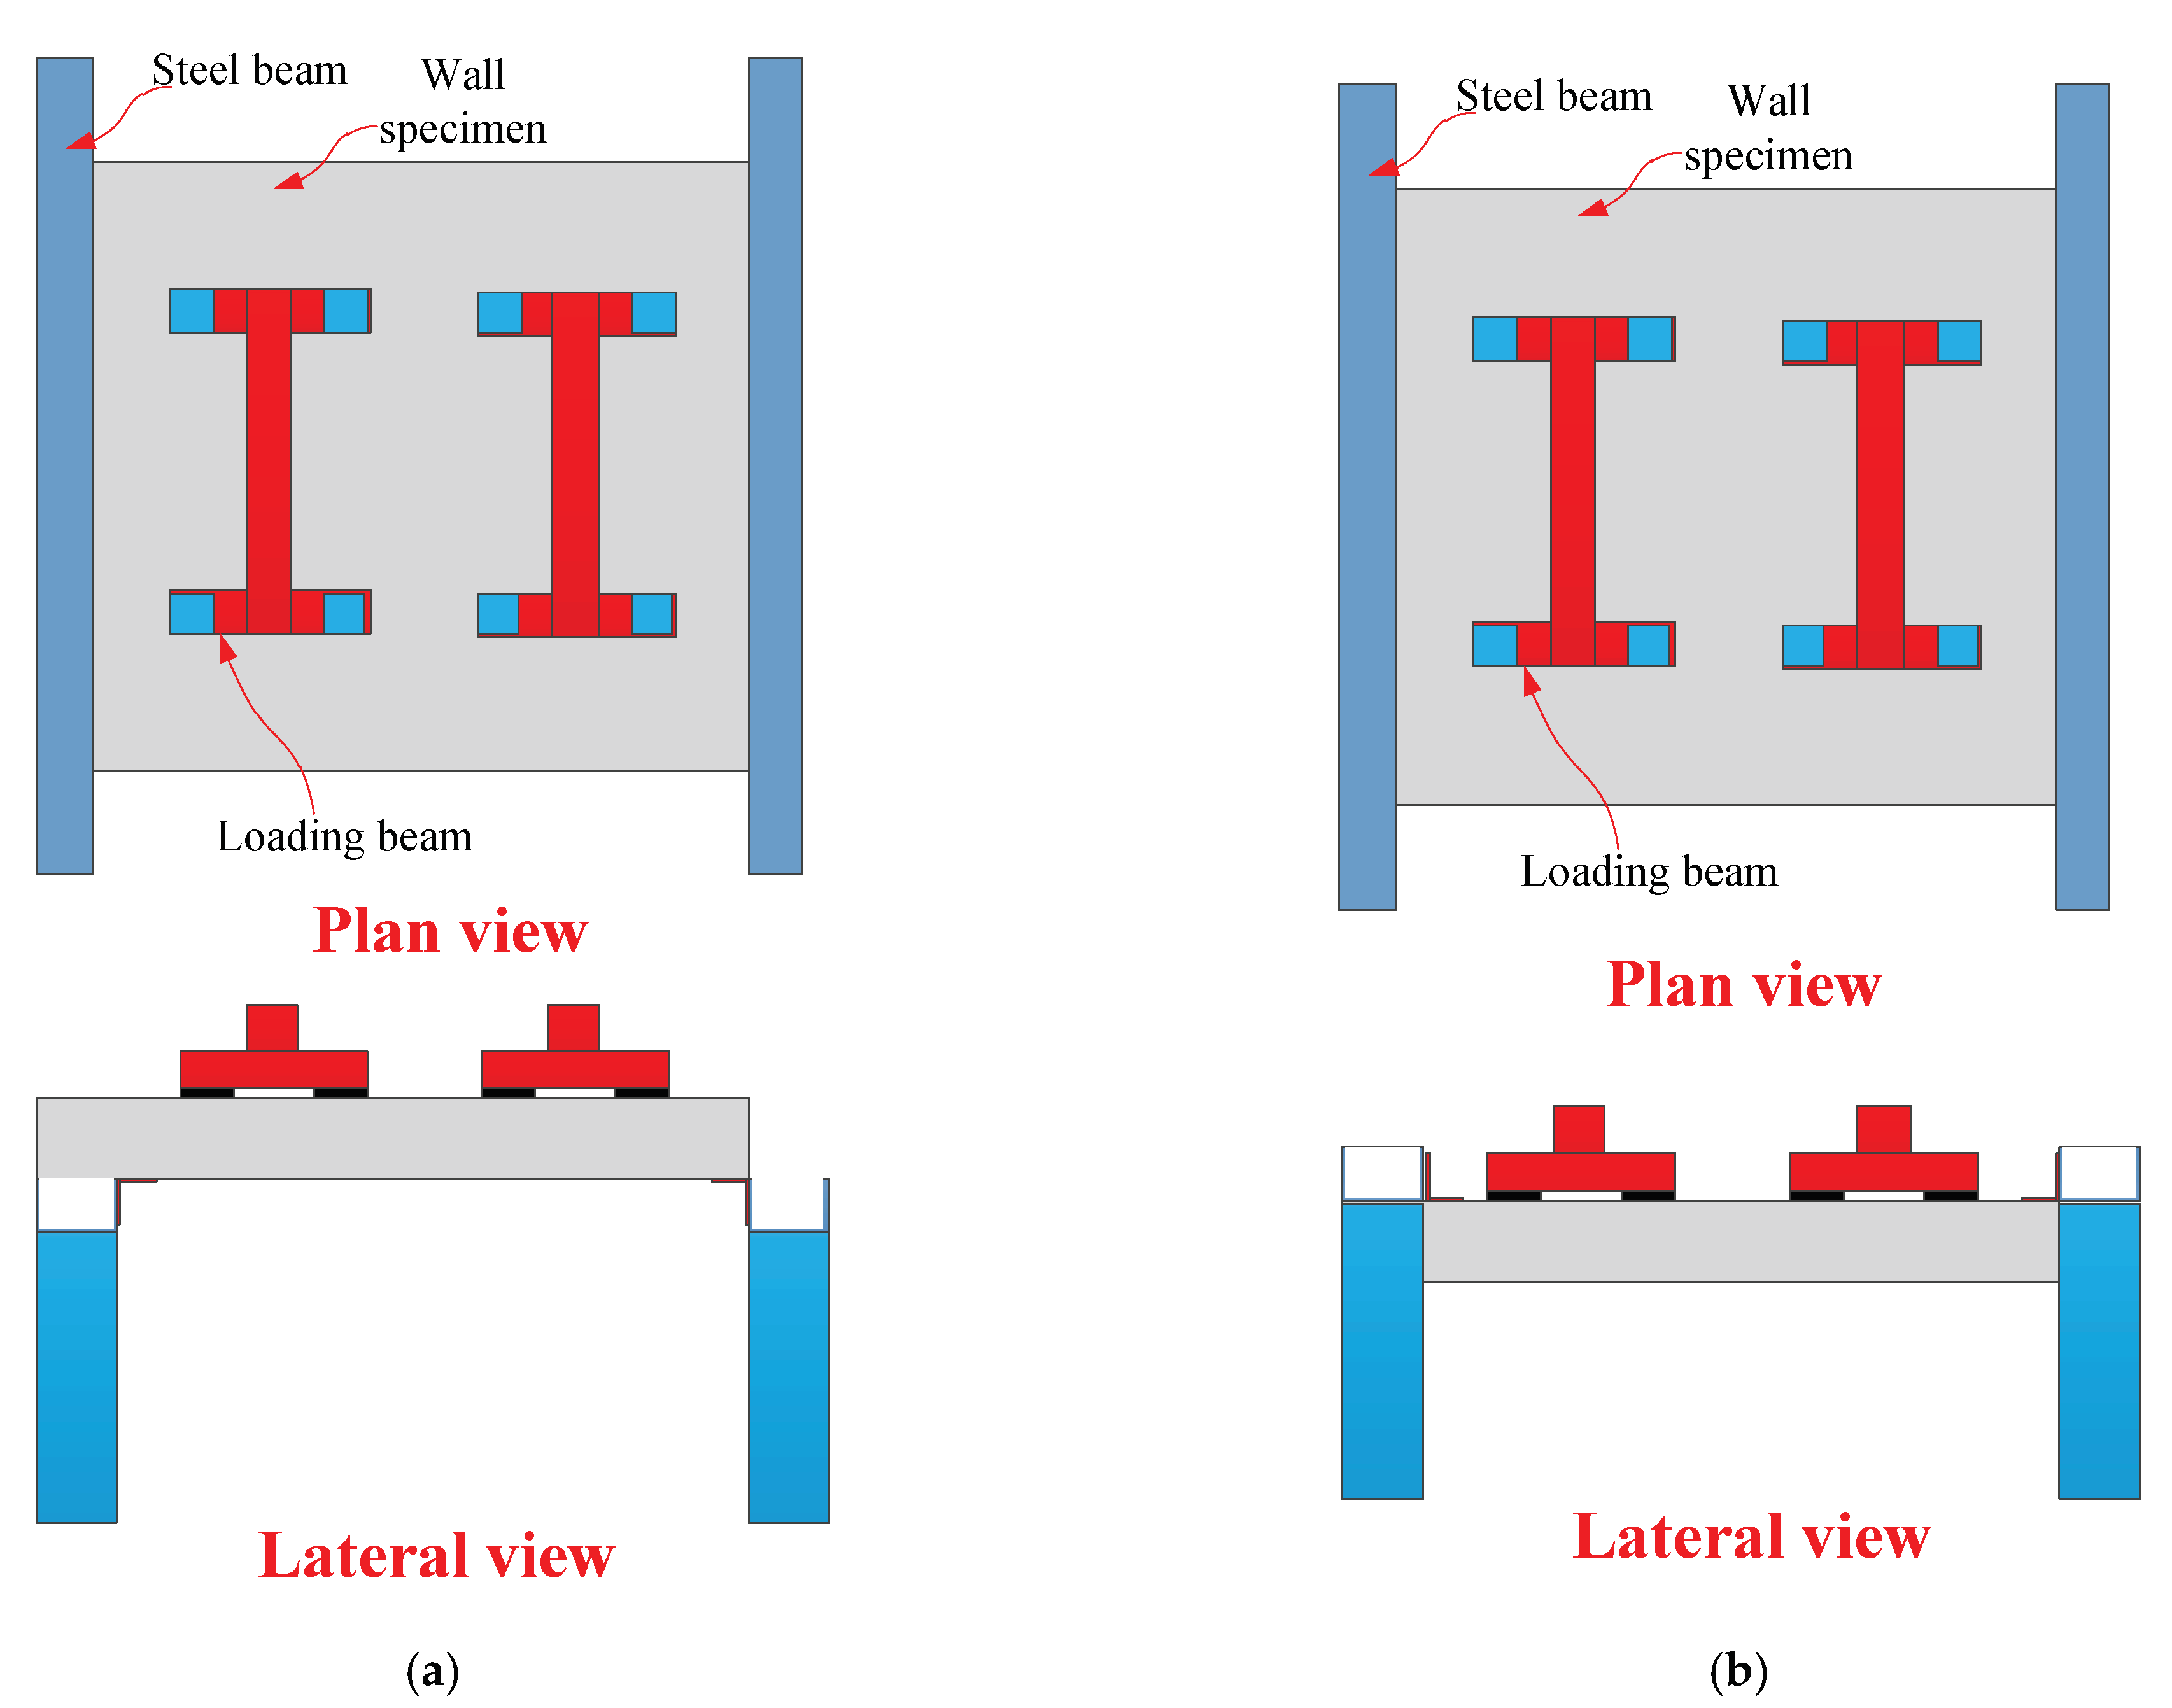
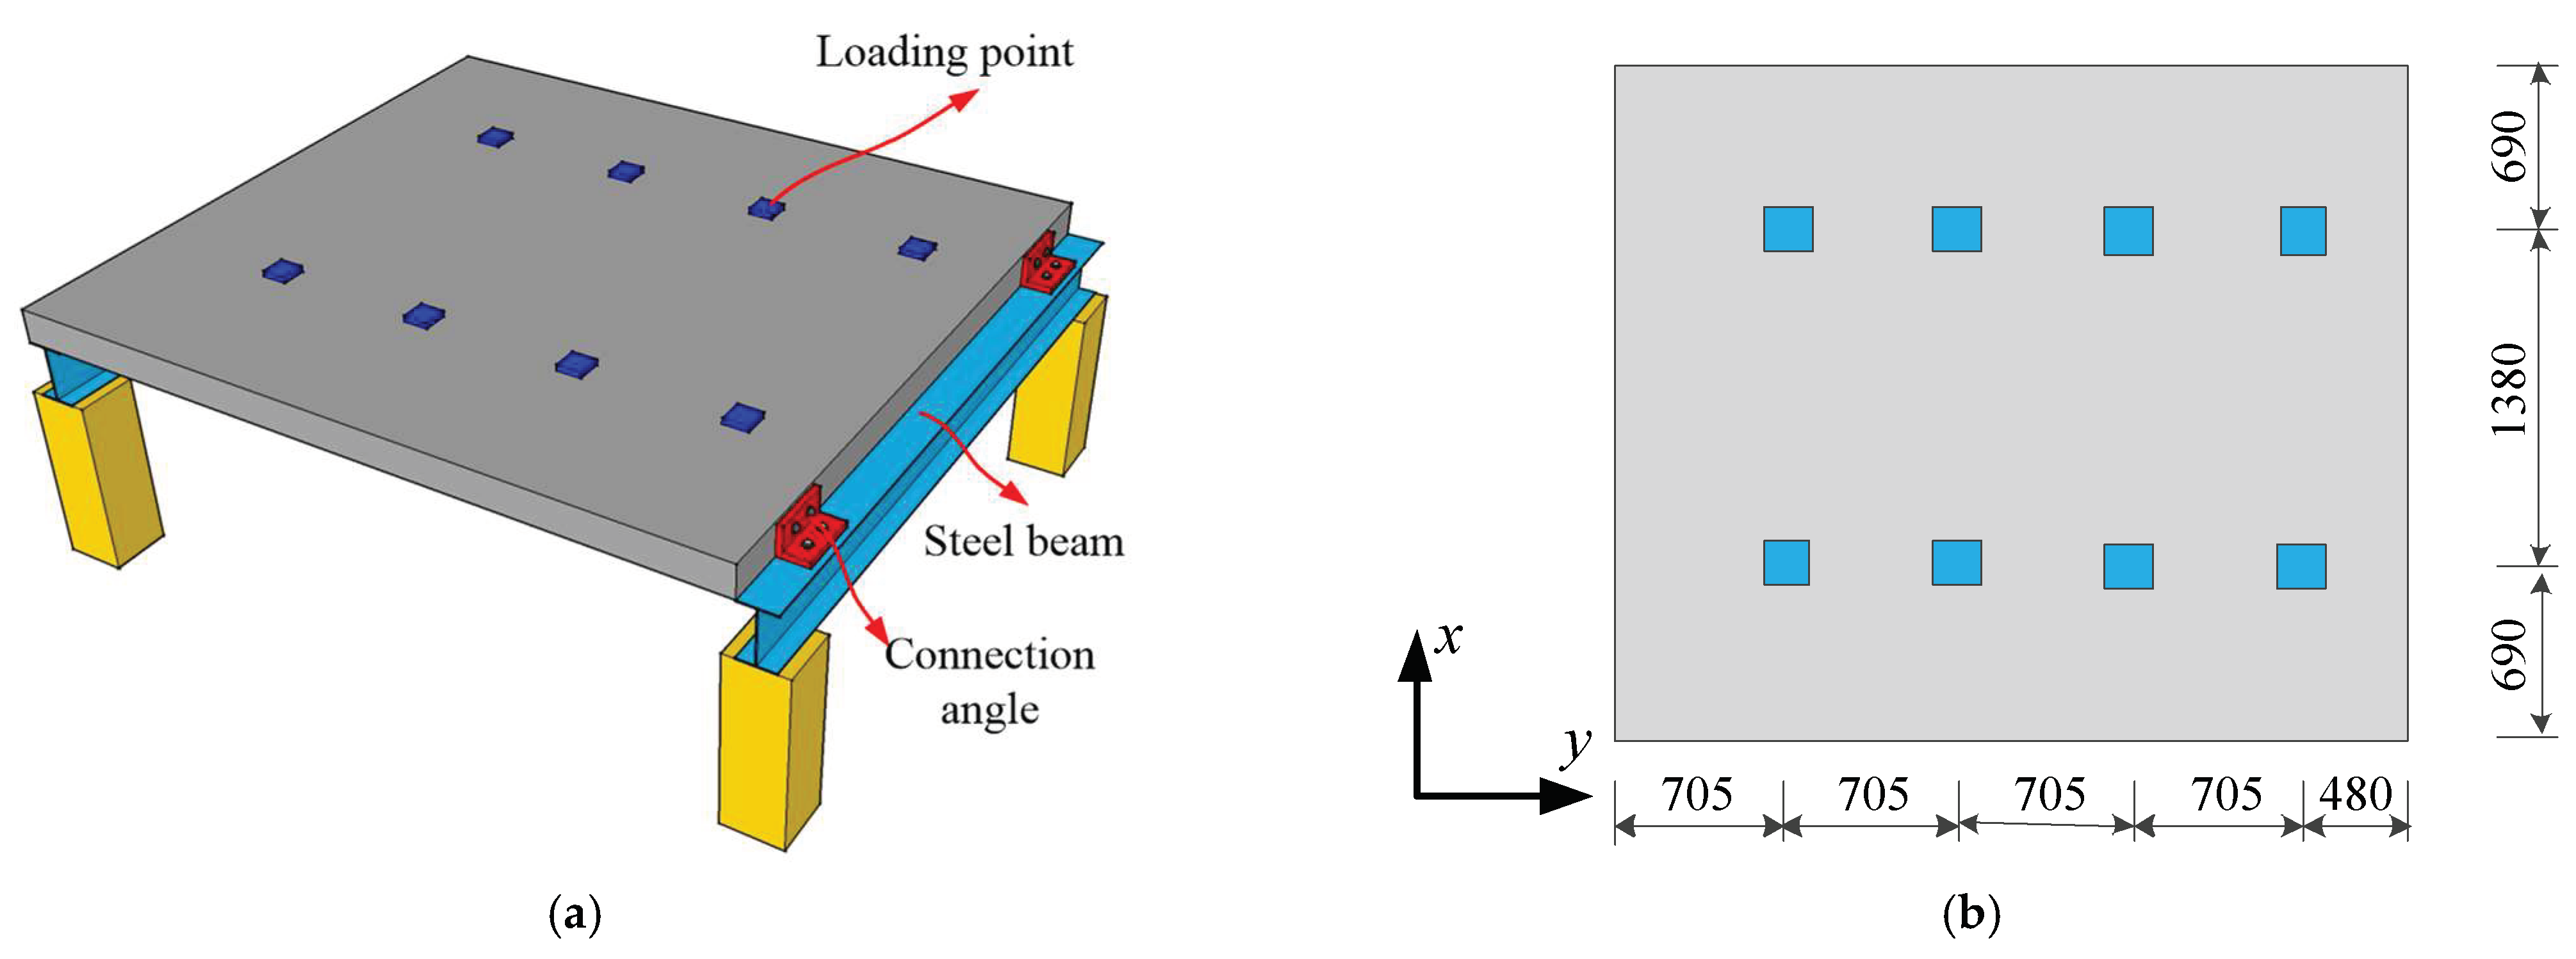
Figure 3 displays the schematic view of the test setup. It is relatively difficult to simulate uniform loads on the wall surface. A simplified loading method was employed using rigid beams to allocate the concentrate force on eight points on the top of sandwiched concrete wall, as shown in Figure 4. Moreover, the exterior sandwiched concrete wall was generally connected to the top and bottom steel beams through steel angles and bolts in engineering practice. Therefore, the similar connection method was also employed in this paper, as shown in Figure 4a.
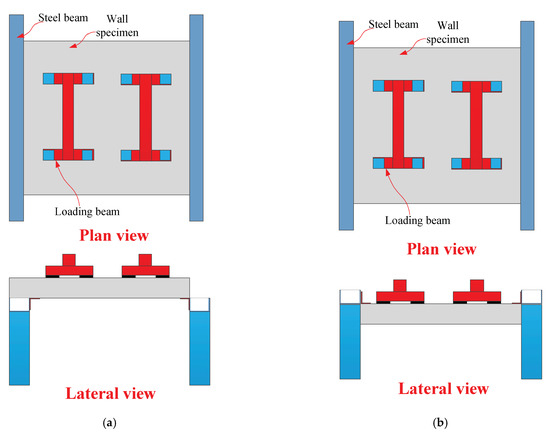
Figure 3.
Test setup. (a) Loading in a positive direction. (b) Loading in a negative direction.

Figure 4.
Layout of loading points (Unit: mm). (a) Loading schematic. (b) Loading points.
Before the formal loading, preloading was performed to check whether the equipment was functional. During the formal loading, a step-by-step loading procedure was adopted using a hydraulic jack. The increments in loading force of each step were set at 10 kN. Test specimens were subjected to the loading of each step for about 15 min until failure.
3. Test Results
3.1. Failure Modes
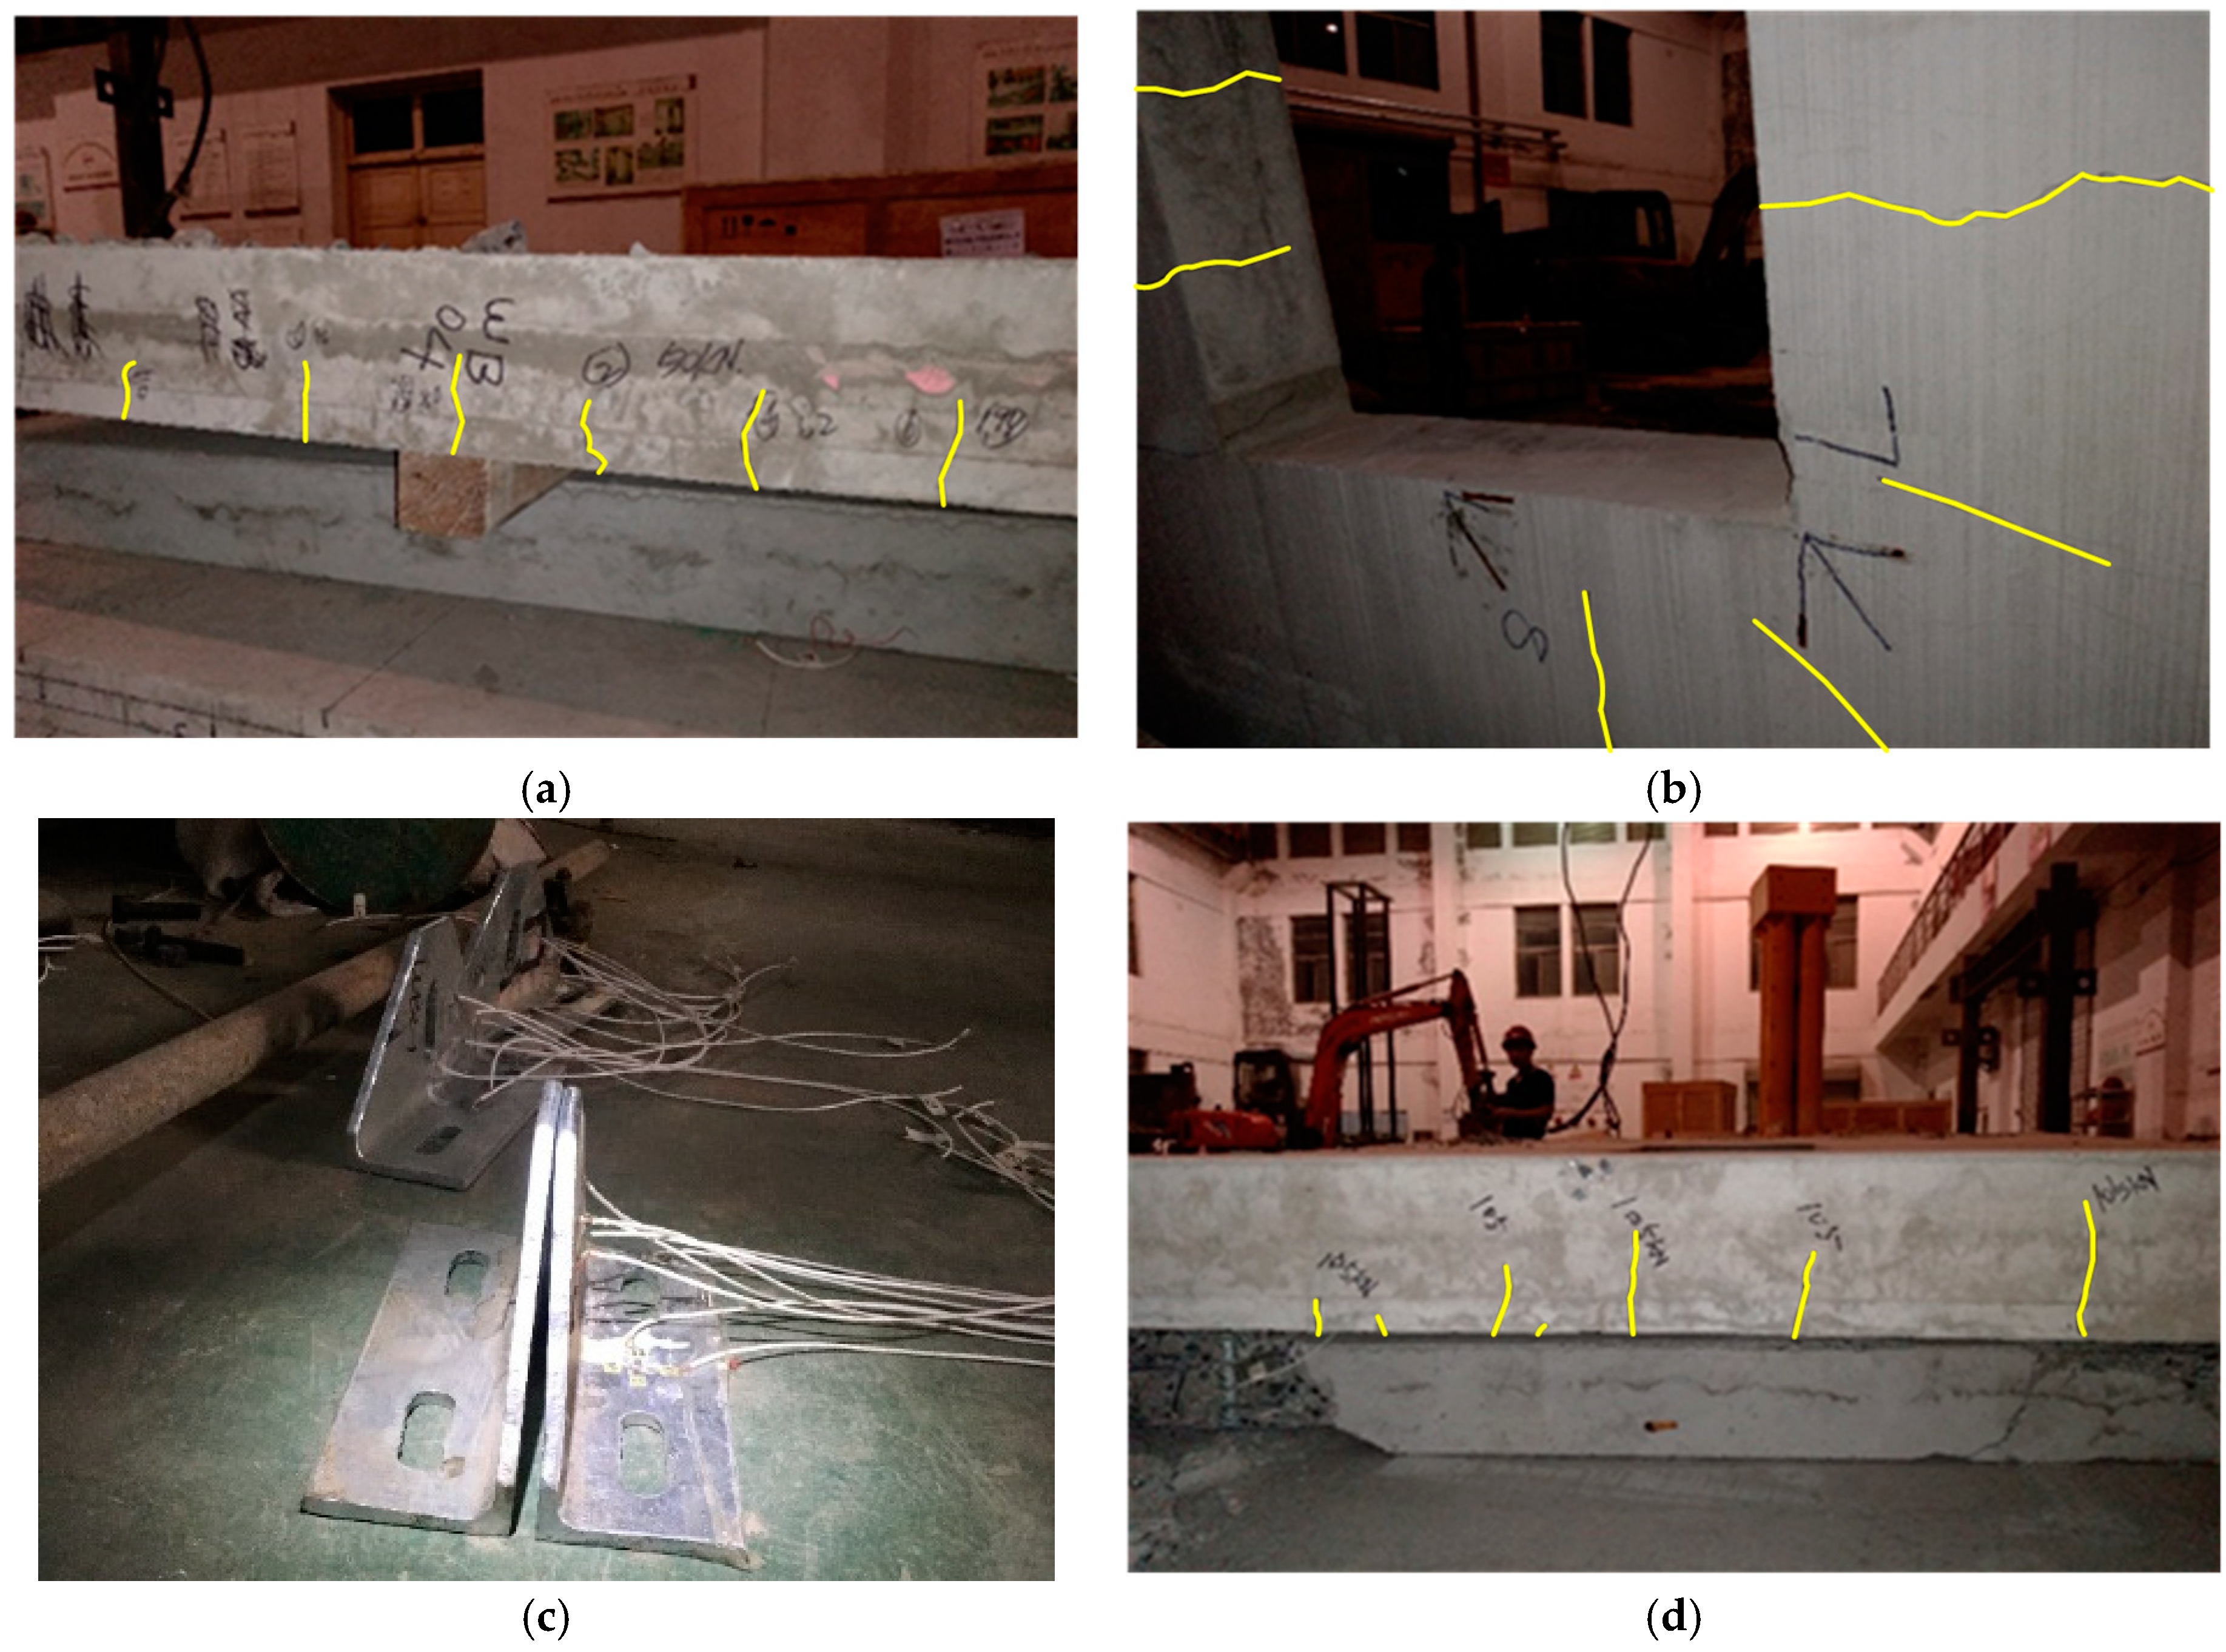
In total, 29 regions, each with a width of 100 mm, were divided along its span, identified as #1–29. Specimens WP and WN exhibited similar failure patterns. Specimen WP was set as the example used to describe the failure modes. No obvious failure modes and bending deformations were noticed in the specimen before cracking. When the loading force reached 35 kN, cracking was initiated in section #16 and its depth was about 2/3 times that of the wall thickness. When the load increased to 50 kN, another crack appeared in region #12. As the load increased to 78 kN, slight bending deformation was noticed. With the further increase in load, more and more cracks were noticed and penetrated the thickness of the wall. When the load equaled 140 kN, slippage between the concrete layer and XPS was detected, and the crack along the span was noticed. When the load increased to 150 kN, the width of crack along the span grew to 5 mm and the XPS fractured. Afterwards, the deflection of the wall specimen increased sharply when the load reached to 160 kN and the loading procedure was terminated. Typical failure modes of specimen WP are shown in Figure 5.
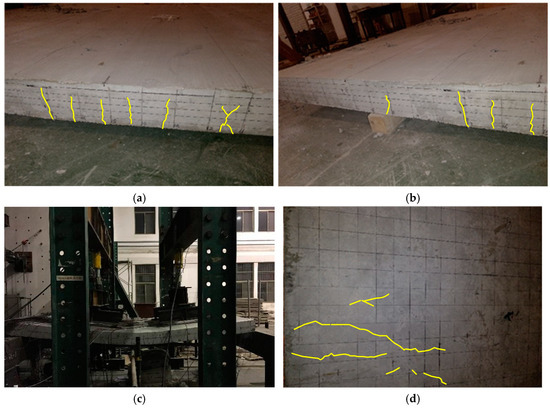
Figure 5.
Typical failure modes of specimen WP. (a) First crack at the load of 35 kN. (b) Bending deformation at the end of the test. (c) Bending deformation in the test. (d) Cracks at the bottom of the wall.
Moreover, specimens WPO and WNO exhibited similar failure modes. Before the load increased to 33 kN, no test phenomena were detected among the specimens. Subsequently, a series of cracks emerged and spread to the middle of the wall thickness. When the load increased to 52 kN, obvious bending deformation was noticed in the test specimens. A penetration crack along the wall thickness was observed when the load reached 100 kN. At the same time, some cracks also appeared around the openings. As the load increased to 135 kN, slippage between the XPS and concrete was also noticed. With the load further increasing to 145 kN, the deflection increased significantly, whereas the load was kept almost constant. The test also ended at this time. After the loading, it demonstrated that the sandwich wall remained almost flat, and the connection angle exhibited obvious deformation. Typical failure modes are displayed in Figure 6.
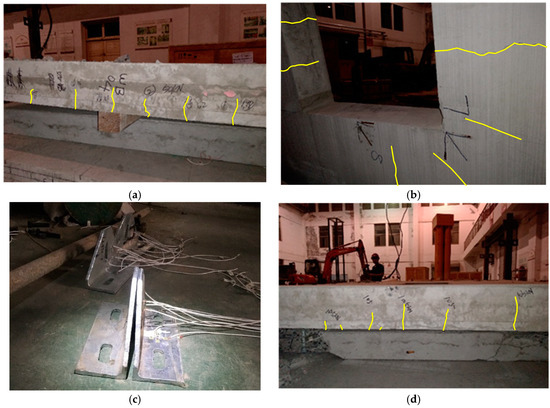
Figure 6.
Typical failure modes of specimen WPO. (a) Cracks at a load of 50 kN. (b) Cracks around the opening. (c) Deformation of the connection angle. (d) Residual deformation after the loading.
In conclusion, the bottom concrete first cracked under bending. Subsequently, the XPS layer also exhibited fracture and slippage between the XPS and concrete, which was detected both under positive and negative bending conditions. However, the crack was mainly located on the 1/3 and middle span, and did not penetrate the wall along its thickness, which indicated that the two layers of concrete could work together through the steel truss connection. In addition, no local crushing was found during the test. Meanwhile, the additional constraints provided by the actual boundary conditions increased the stiffness and strength of the sandwiched wall to some extent.
3.2. Load–Deflection Curves
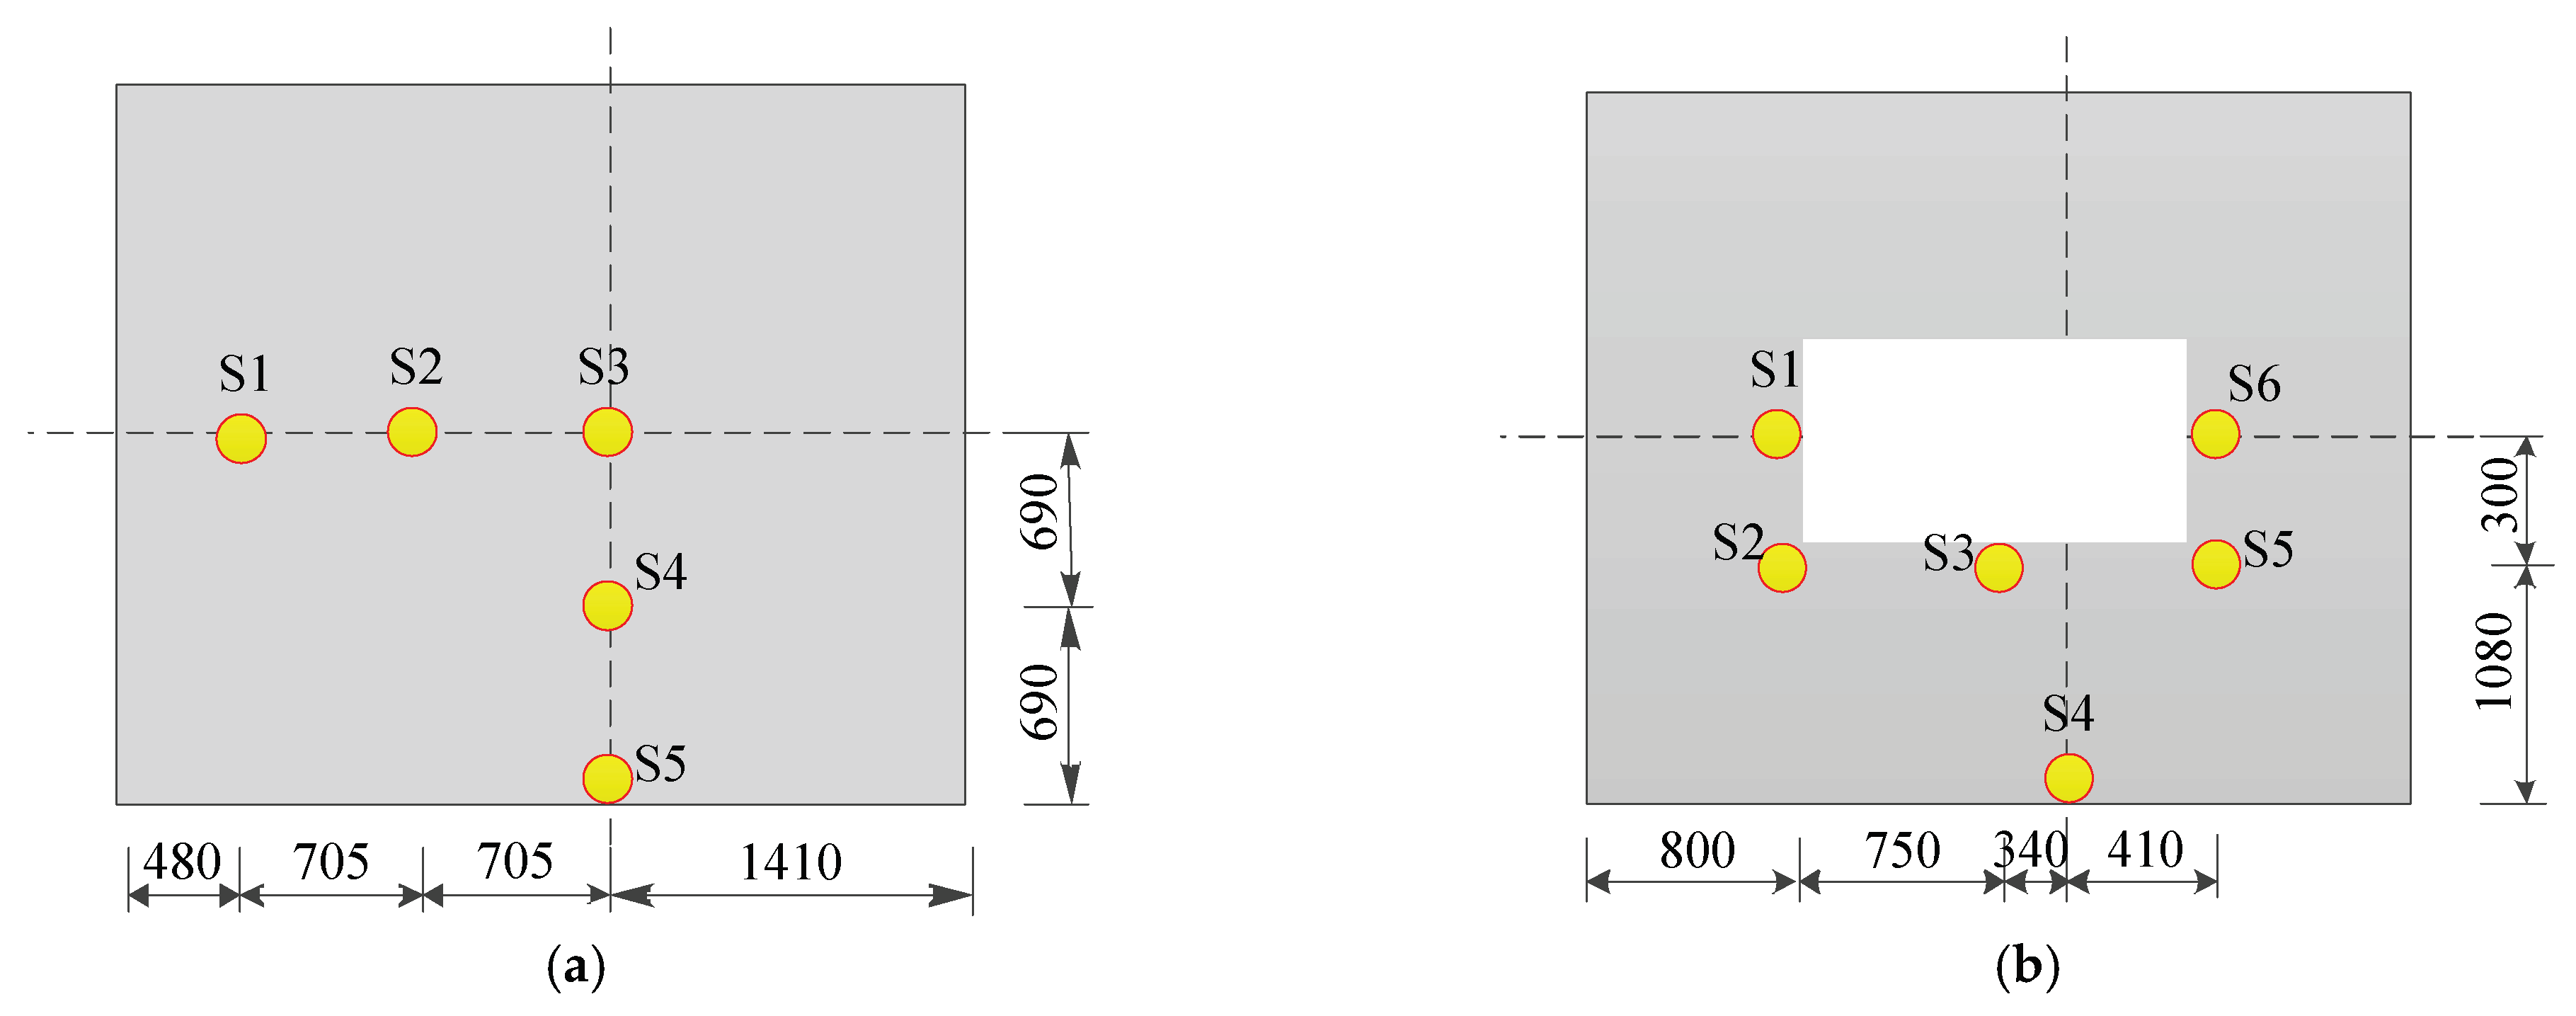
Several key points were selected to analyze their deflection during the test. The deflections of the key points were measured by the LVDTs, and the load was recorded by the pressure sensor. For specimens WP and WN, the deflections of five points were recorded in the test. For specimens WPO and WNO, the deflections of six points were recorded, as can be seen in Figure 7.
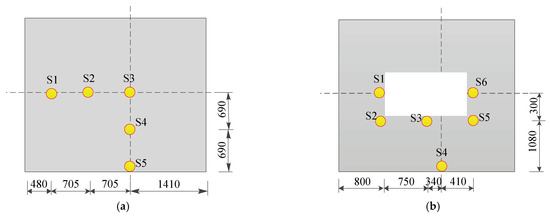
Figure 7.
Selected deflection points. (a) Deflection points of specimens WP and WN. (b) Deflection points of specimens WPO and WNO.
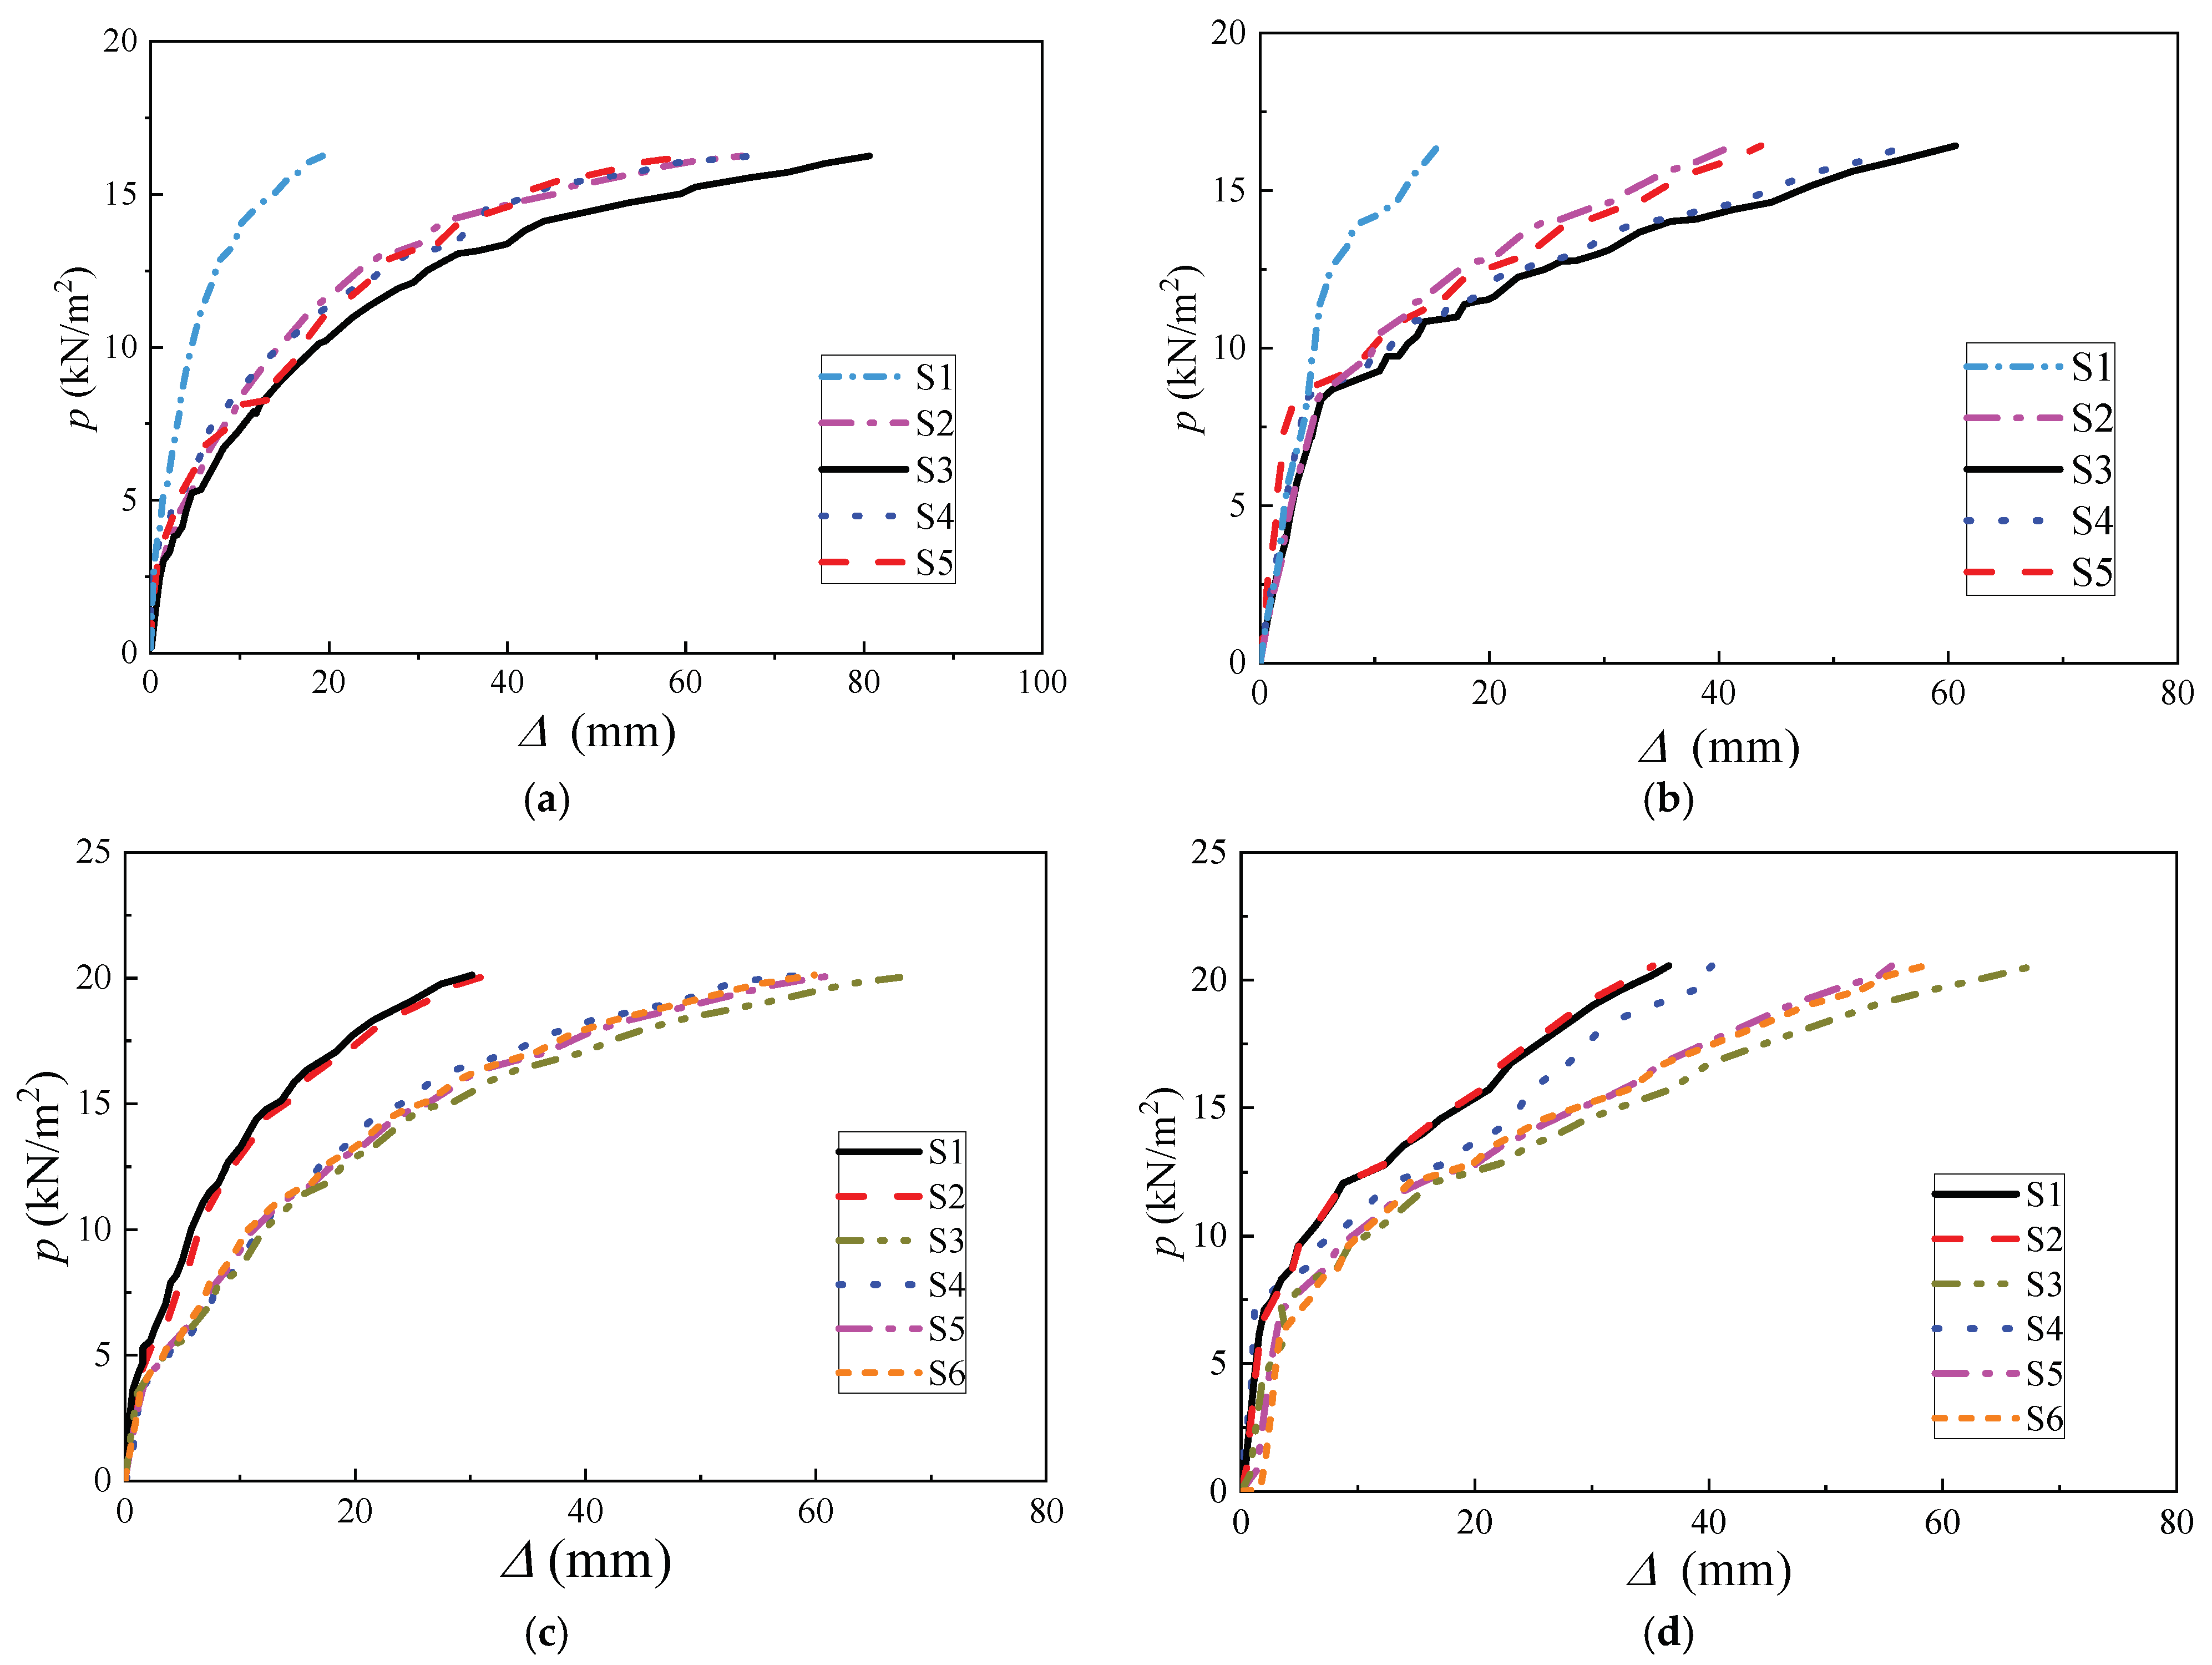
The load–deflection curves of test specimens are presented in Figure 8. For specimens WP and WN, similar load–deflection curves were displayed at the five points. Overall, the results showed that the deflection increased with the decrease in the distance between the points and middle span. In comparison, the deflection of specimen WP was larger than that of specimen WN, owing to the fact that the steel beam provided additional vertical constraints for the wall specimens when subjected to negative bending conditions. Moreover, the load–deflection curve of specimen WP reached the first inflection point when the uniform load (q) equaled to 3 kN/m2 due to the concrete cracking, whereas that of specimen WN reached the first inflection point when q reached 9 kN/m2. The load–deflection curve of specimen WP reached the second inflection point when q was 13 kN/m2, and that of specimen reached the second inflection point when q was 13.5 kN/m2. This also indicated that the cracking load of specimen WN was higher than that of specimen WP.
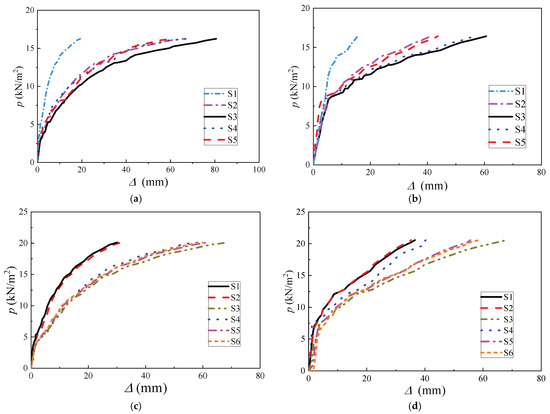
Figure 8.
Load–deflection curves. (a) Specimen WP. (b) Specimen WN. (c) Specimen WPO. (d) Specimen WNO.
Figure 8 depicts the load–displacement curves of specimens WPO and WNO. It also demonstrated that the deflection of the points increased with the decrease in the distance between the point and the middle span. However, the maximum deflection of specimen WPO was almost equal to that of specimen WNO. In comparison, the inflection on the load–displacement curve of specimen WPO appeared when q equaled to 3 kN/m2, indicating that the concrete started cracking, while that of specimen WNO emerged when q was about 7.5 kN/m2. Afterwards, the load–displacement curves of specimens WPO and WNO both exhibited their second points of inflection when q increased to 12.5 kN/m2. Therefore, it could be determined that the cracking load of specimen WPO was lower than that of WNO. It also showed that the deflections on S5 and S6 were significantly larger than those of S1 and S2. This could be explained by the fact that the center of the eight loading points was closer to S5 and S6.
3.3. Strain Responses
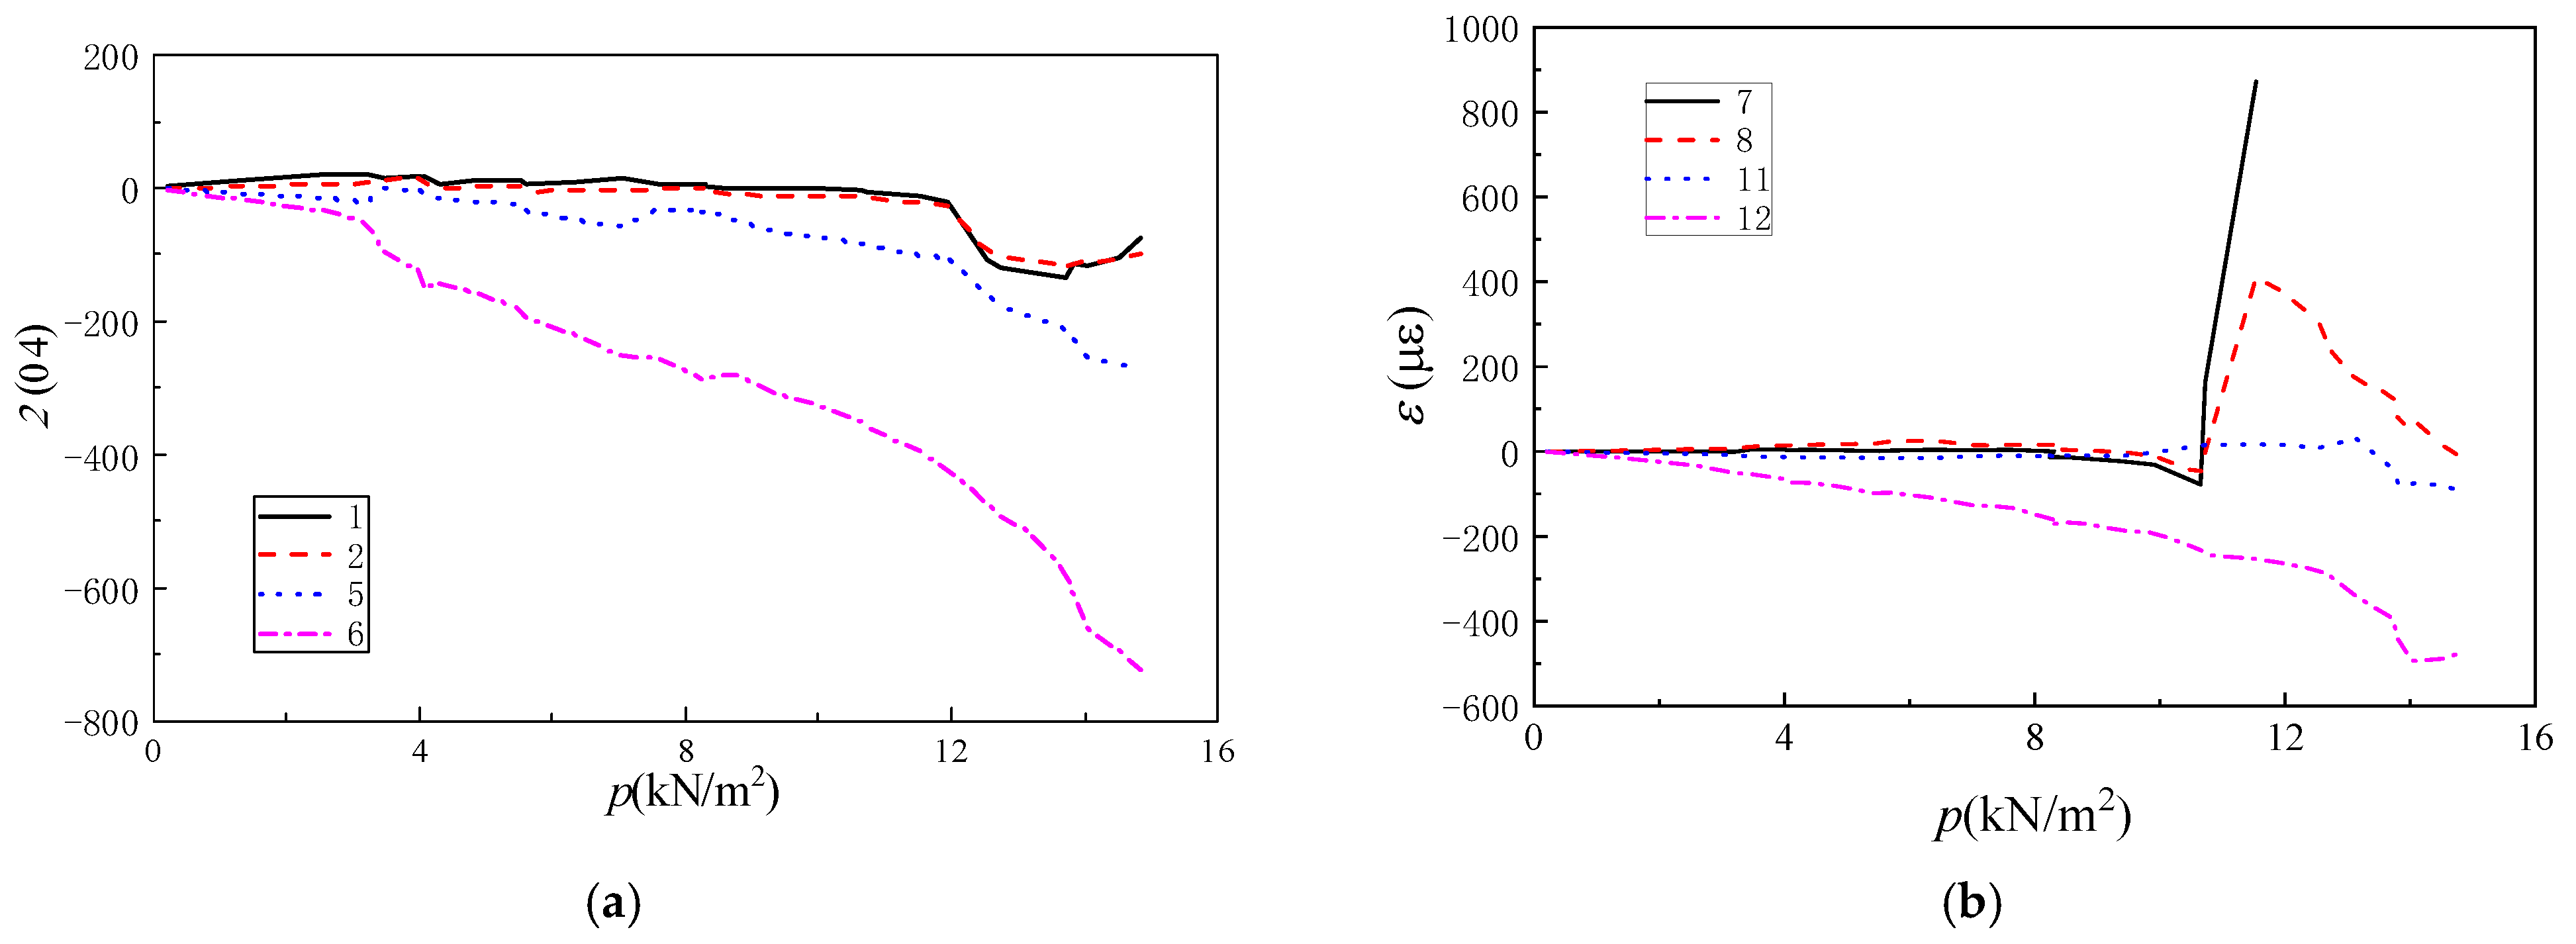
Figure 9 shows the positions of strain gauges distributed throughout specimen WP in the 1/4 and middle span. As can be seen in Figure 10, the strain remained almost at zero before q reached 12 kN/m2. Afterwards, strains #5 and #6 decreased significantly, indicating that the upper concrete was in compression, whereas strains #1 and #2 of the lower concrete layer remained at zero due to the fact that the concrete in the middle span exhibited serious cracking and the strain gauges were broken. Similarly, strains #11 and #12 also decreased, whereas strains #7 and #8 increased sharply when q was higher than 12 kN/m2. This revealed that the upper and lower layers of concrete were in states of compression and tension, respectively.
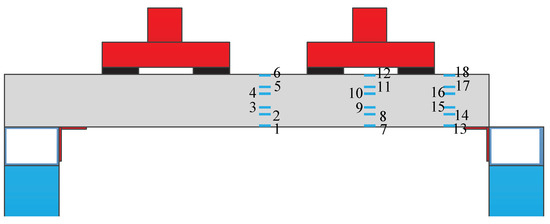
Figure 9.
Strain distributions.
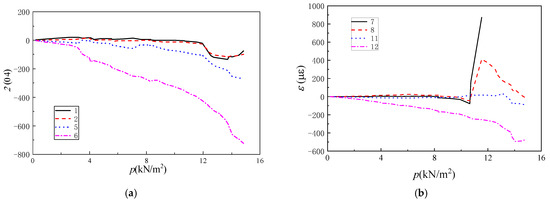
Figure 10.
Strains of specimen WP. (a) Middle span. (b) 1/4 span.
4. Finite Element Modeling
To gain insights into the stress state and work mechanism of the sandwich wall under bending conditions, the numerical model was developed by ABAQUS software in this section, which was also beneficial for proposing design equation of the sandwiched wall.
4.1. Material Models
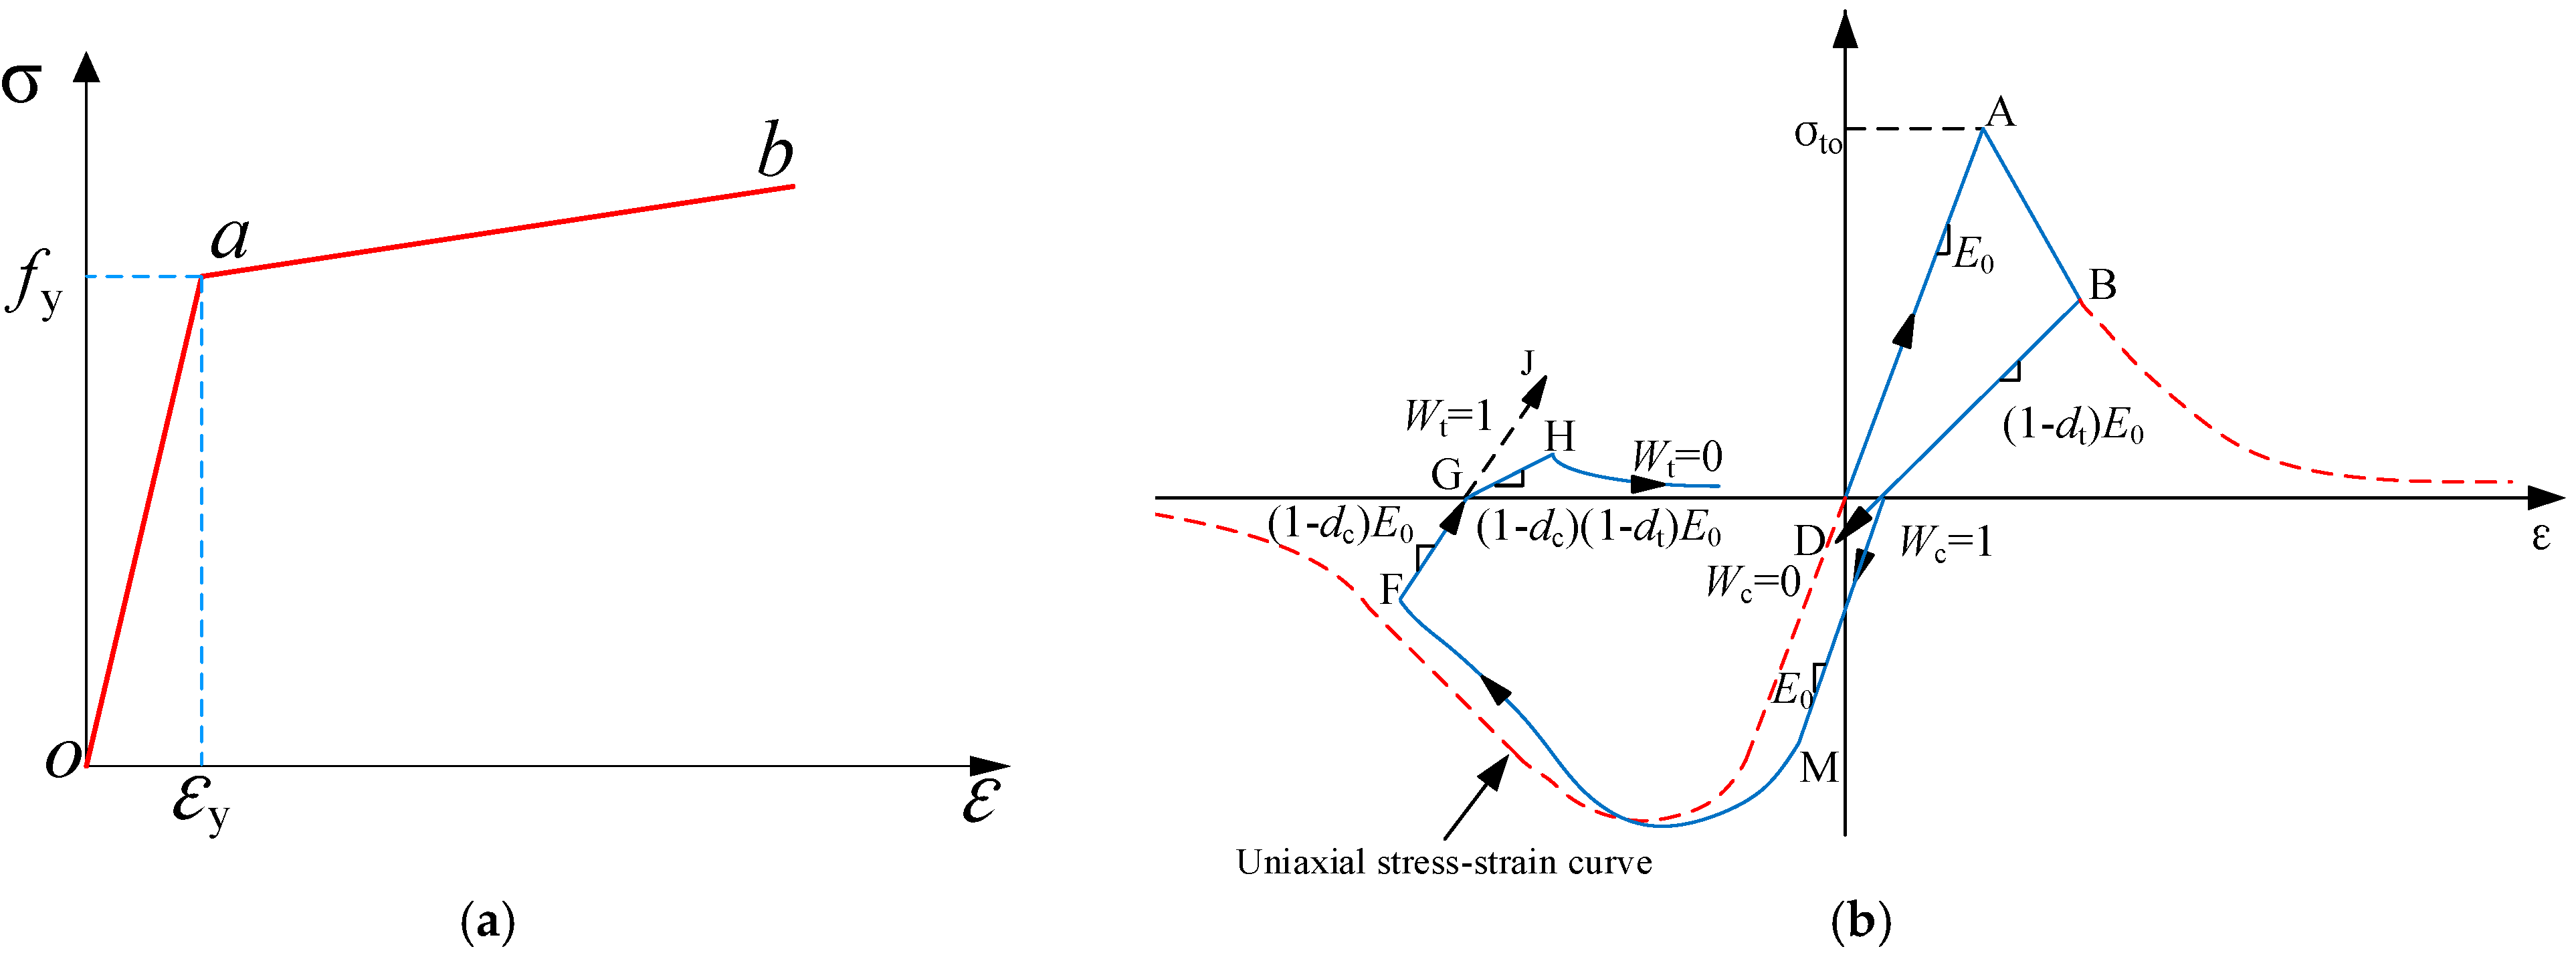
For the reinforcements embedded in the concrete slab, a bilinear model was generally employed to simulate the behavior of reinforcements, as shown in Figure 11a.
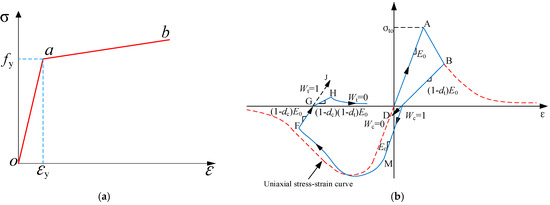
Figure 11.
Material models of concrete and reinforcements. (a) Reinforcements. (b) Concrete.
For the concrete in the sandwich wall, the stress–strain relationship demonstrated in GB 50010 [24] was adopted, and the concrete damage plastic model in ABAQUS was also employed to simulate the behavior of concrete, which is shown in Figure 11b. In the concrete damaged plasticity model, the dilation angle, eccentricity, stress ratio between the concrete under biaxial compression and uniaxial compression, K and viscosity parameter were taken as 30, 0.1, 1.16, 0.667, and 0.0005, respectively. Moreover, the damage variables in GB 50010 [24] were also assigned for the concrete in the sandwich wall. XPS exhibited relatively low stiffness and strength compared with the concrete and provided little contribution on the strength and stiffness of the sandwich wall, which is tentatively ignored in the FEM.
4.2. Element and Mesh Size
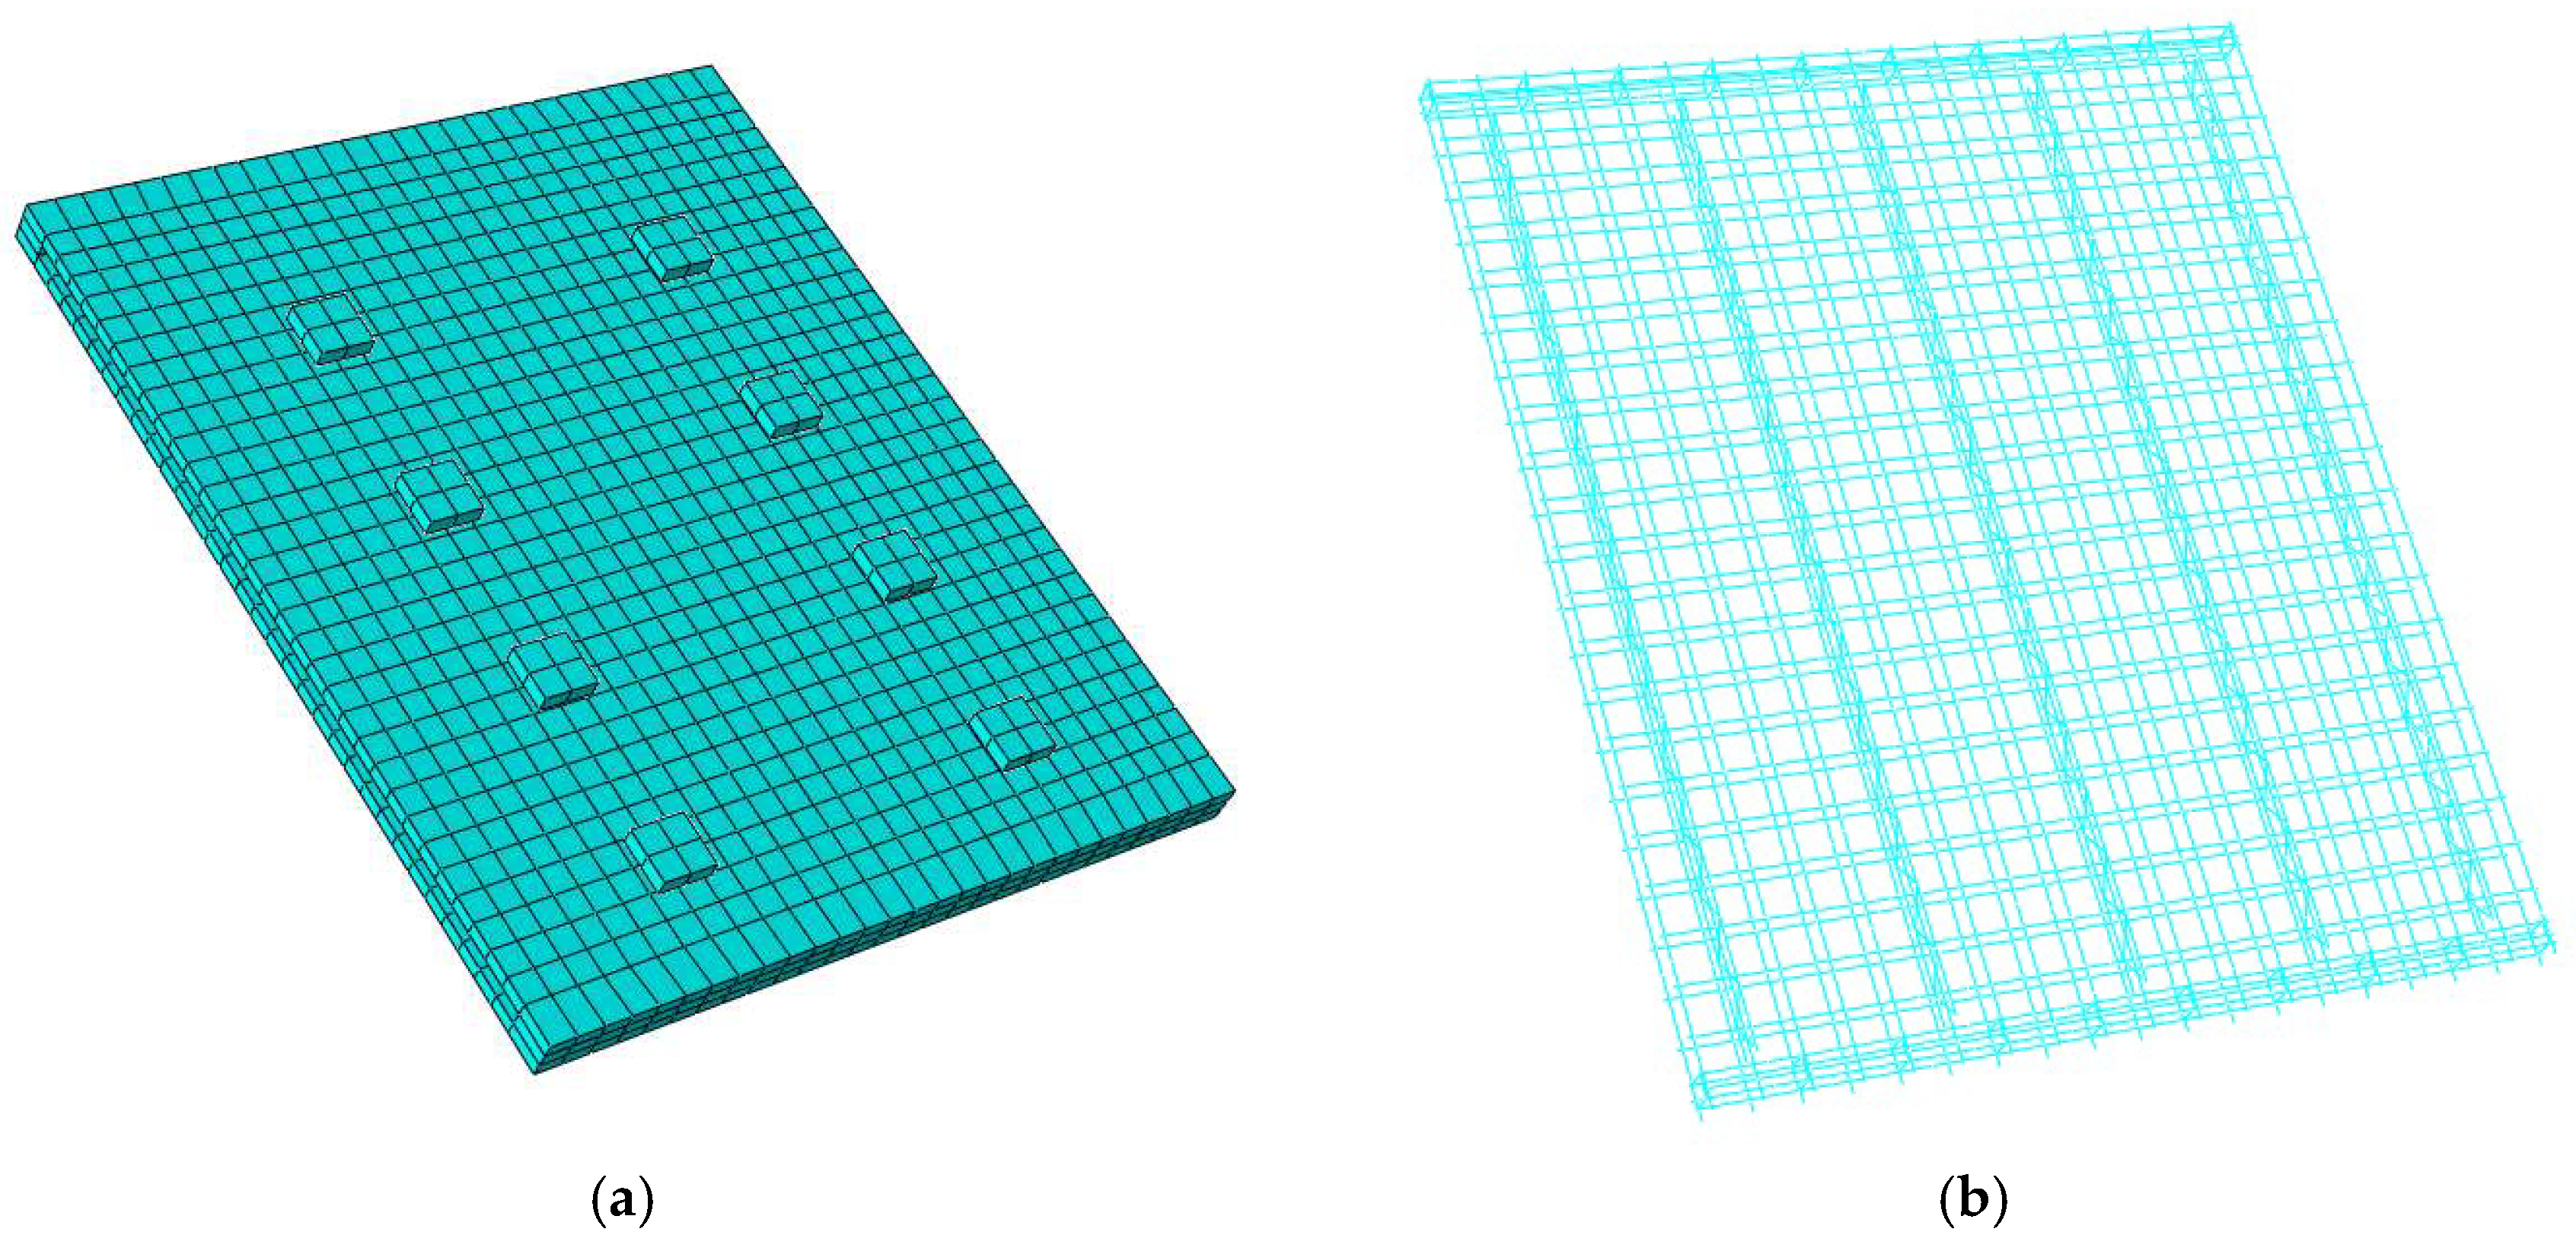
The concrete and XPS layers were all modeled using solid elements (C3D8R). Truss elements were assigned for reinforcement. Both XPS and reinforcements were embedded in the concrete without considering separation. The mesh sizes of XPS, concrete and reinforcements were set as 50 mm, whereas that of the sandbag was taken as 100 mm. A detailed FEM model is displayed in Figure 12. The static analysis step was employed to apply the out-bending loads and the complete integral algorithm was used. The actual run time of each model was about 40 min. The sandwiched wall was tied to the supports and all degree of freedoms of the supports were constrained.

Figure 12.
Finite element model of sandwich wall with reasonable mesh sizes. (a) Concrete layer. (b) Reinforcements.
4.3. Analysis of FEM Results
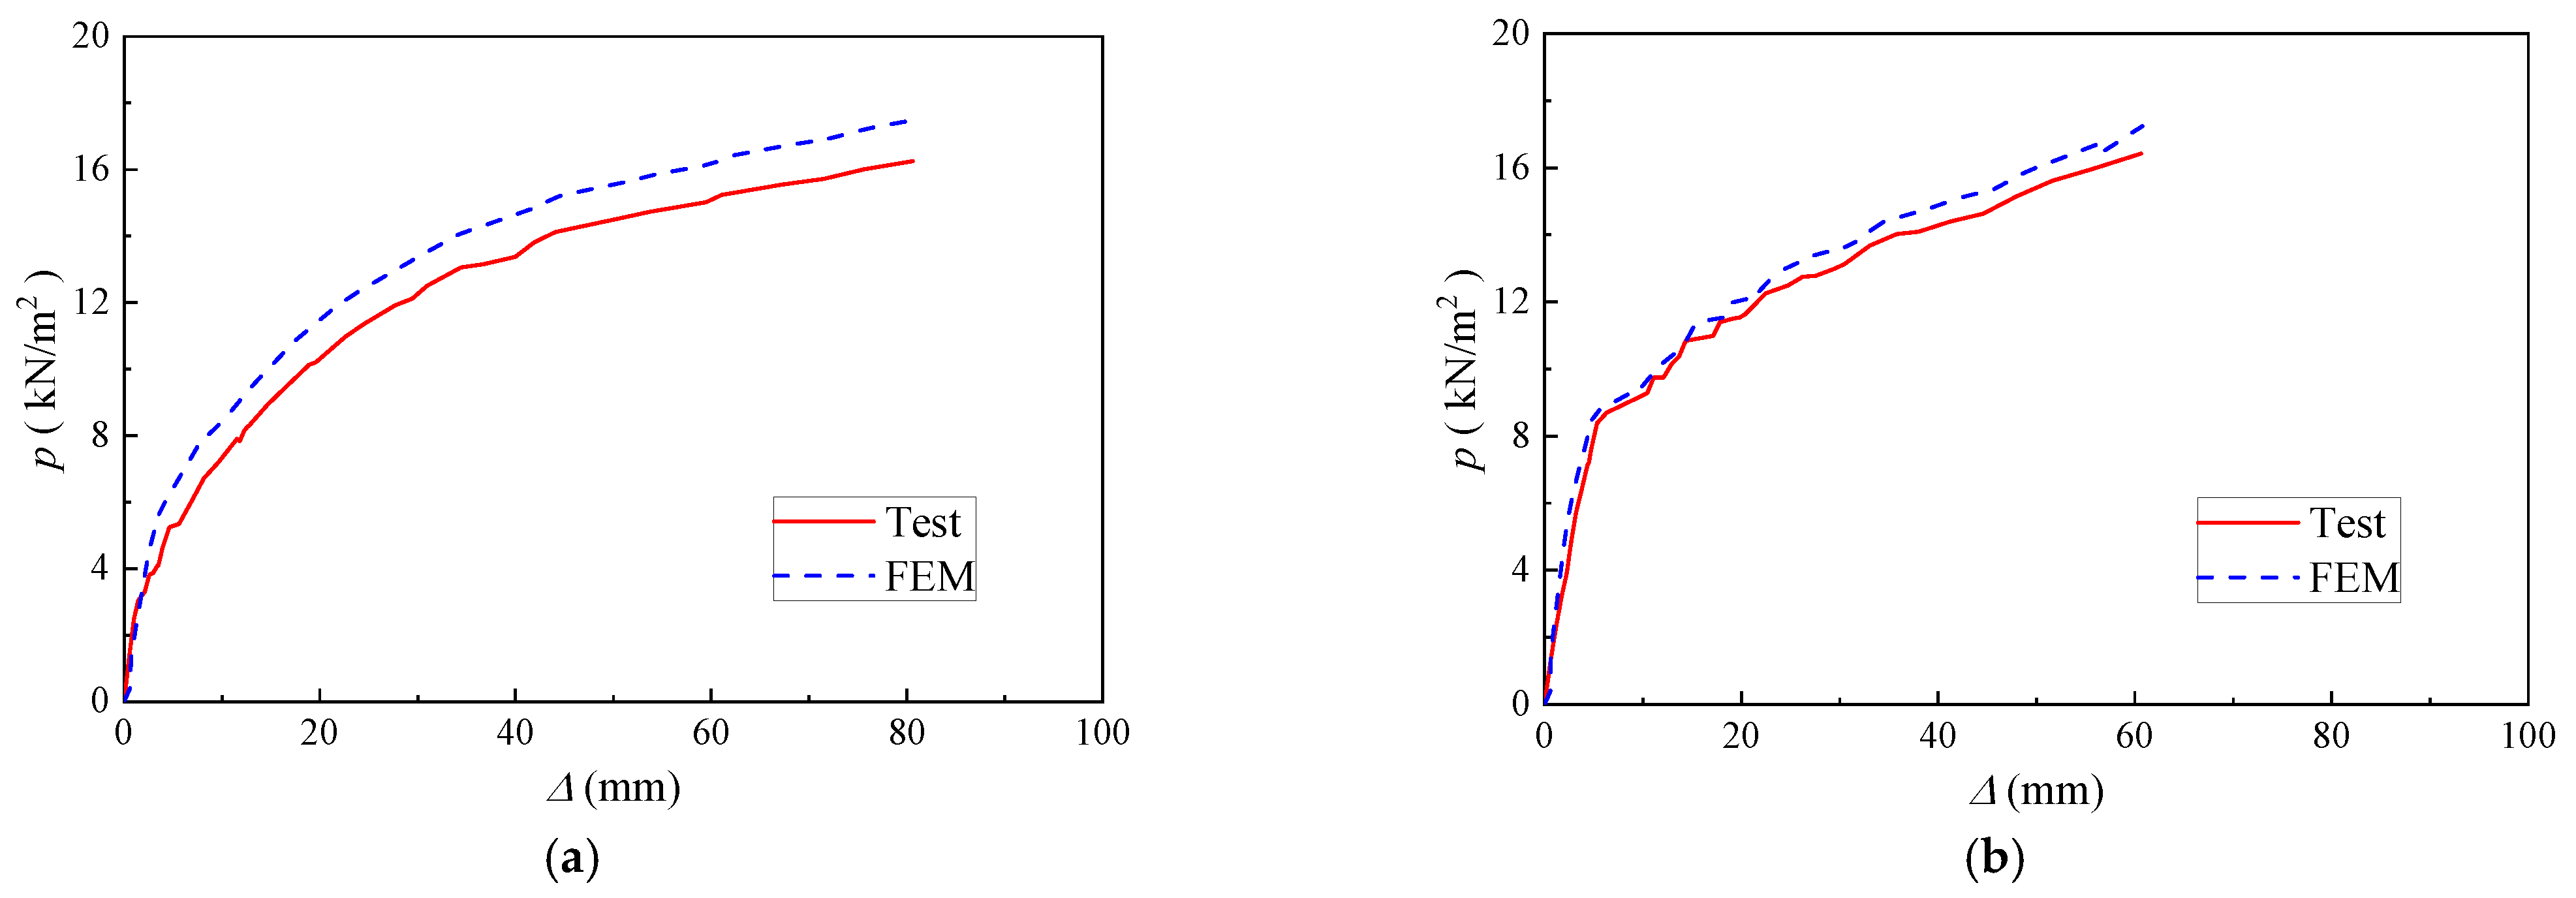
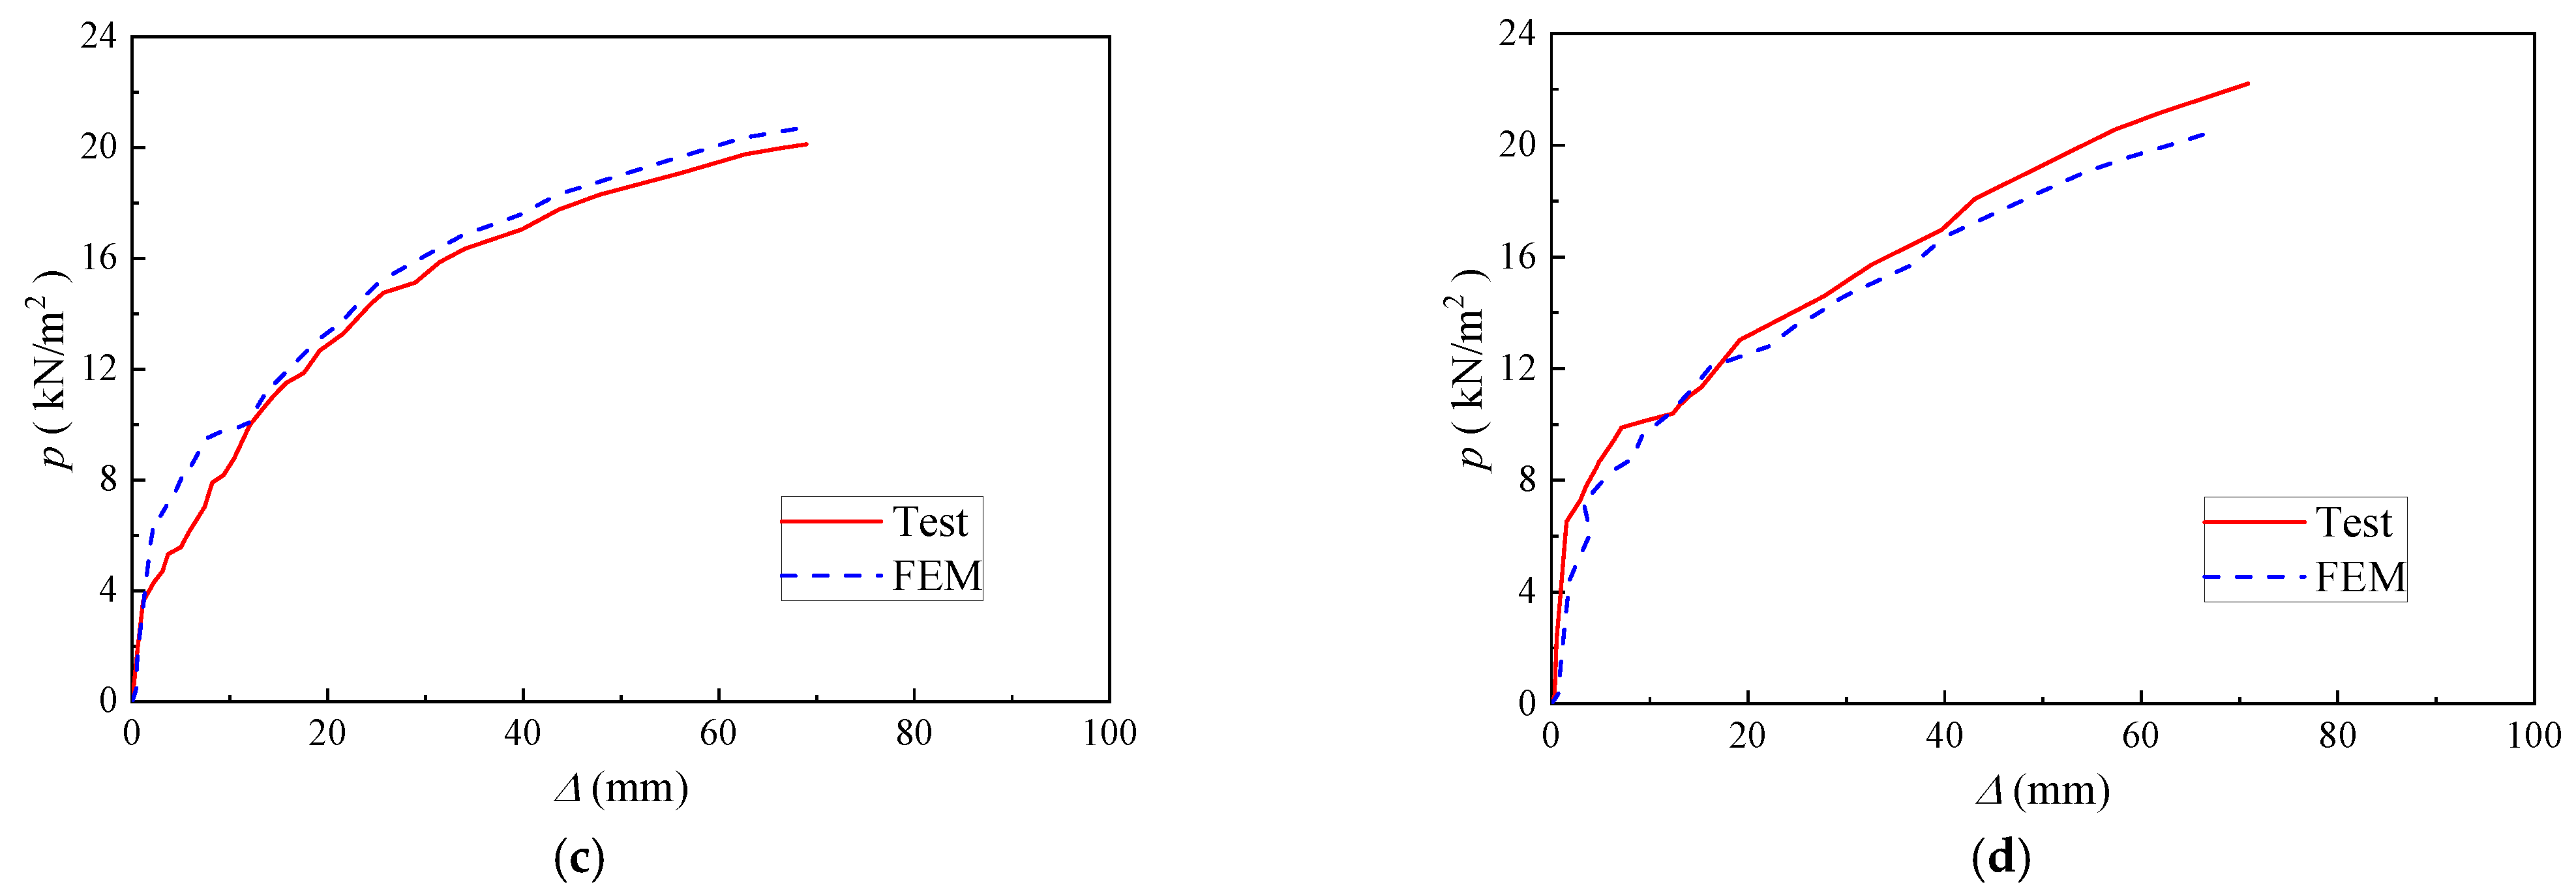
The comparison results between the FEM and test results are demonstrated in Figure 13. It can be concluded that the load–displacement curve of FEM coincided well with the test results, indicating that the FEM was able to reasonably predict the bending performance of the concrete sandwich wall.
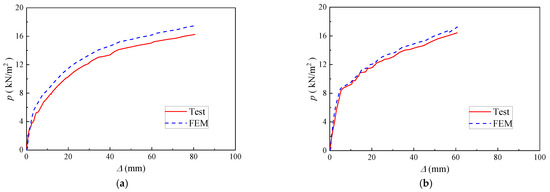
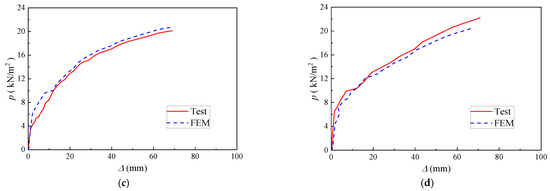
Figure 13.
Comparison between FEM and test. (a) WP. (b) WN. (c) WPO. (d) WPN.
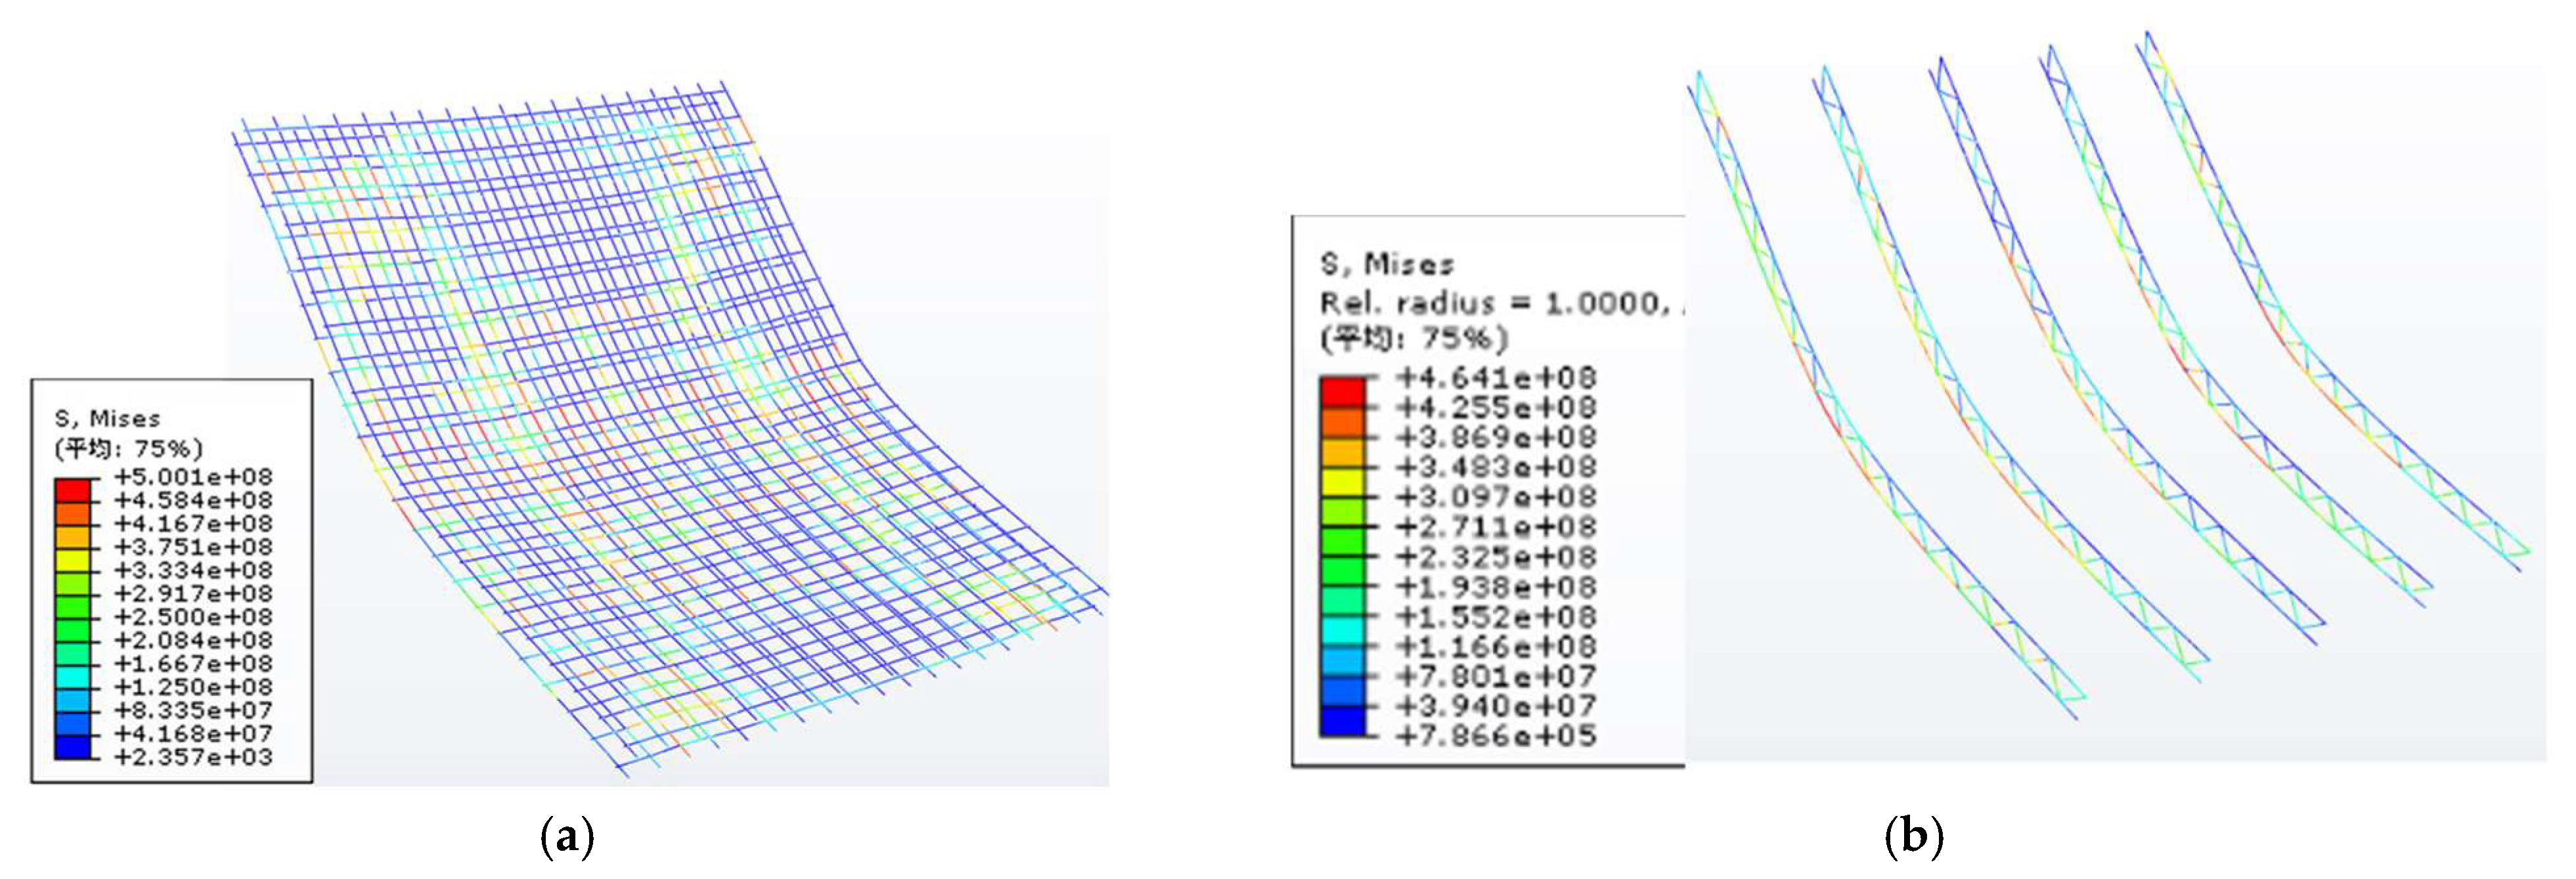
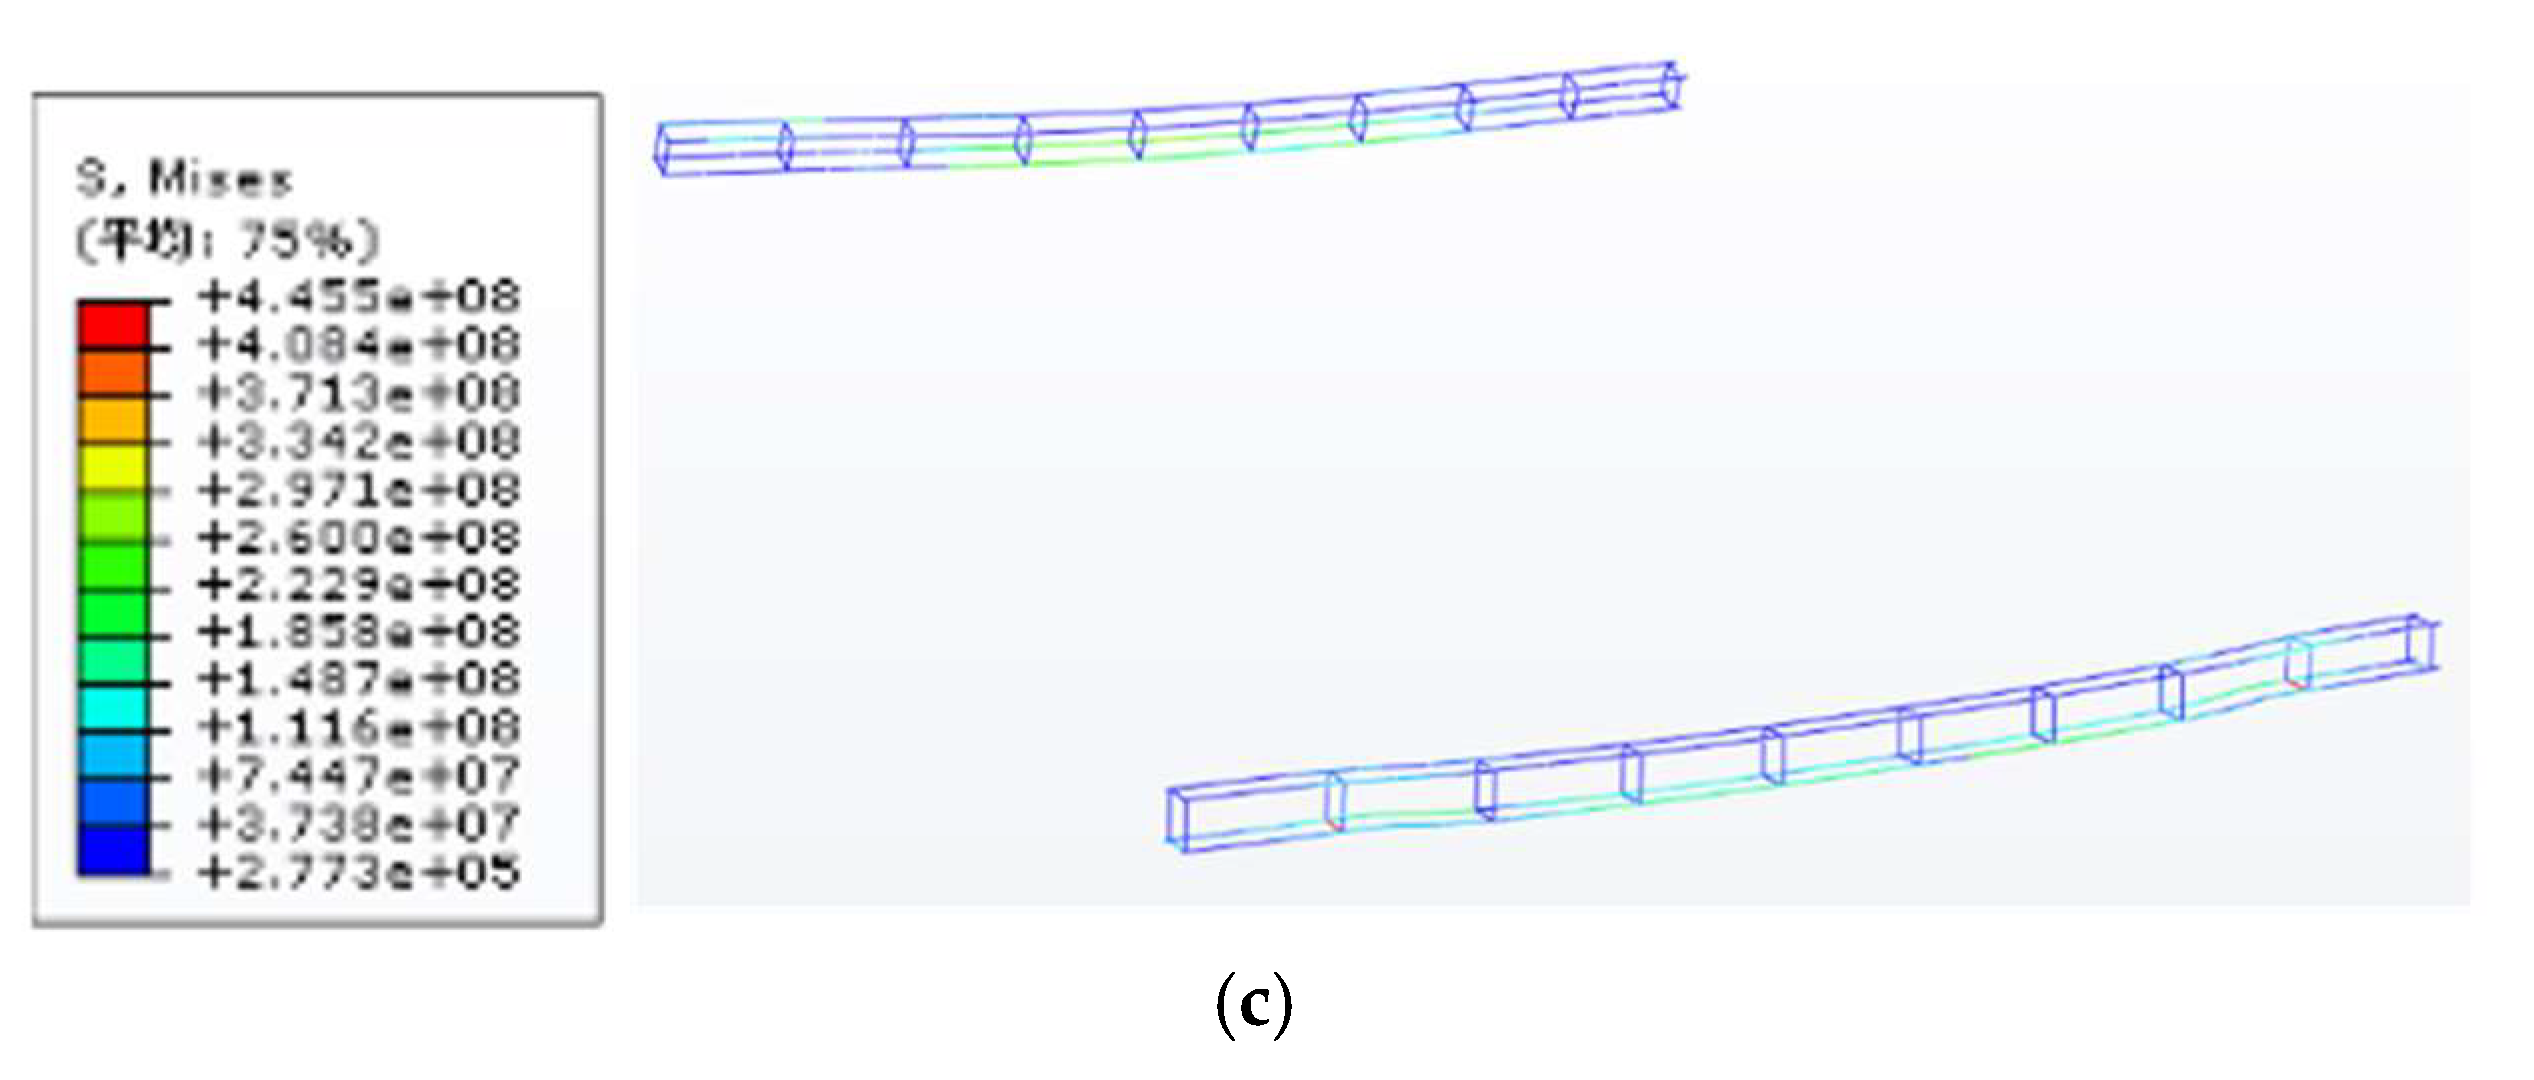
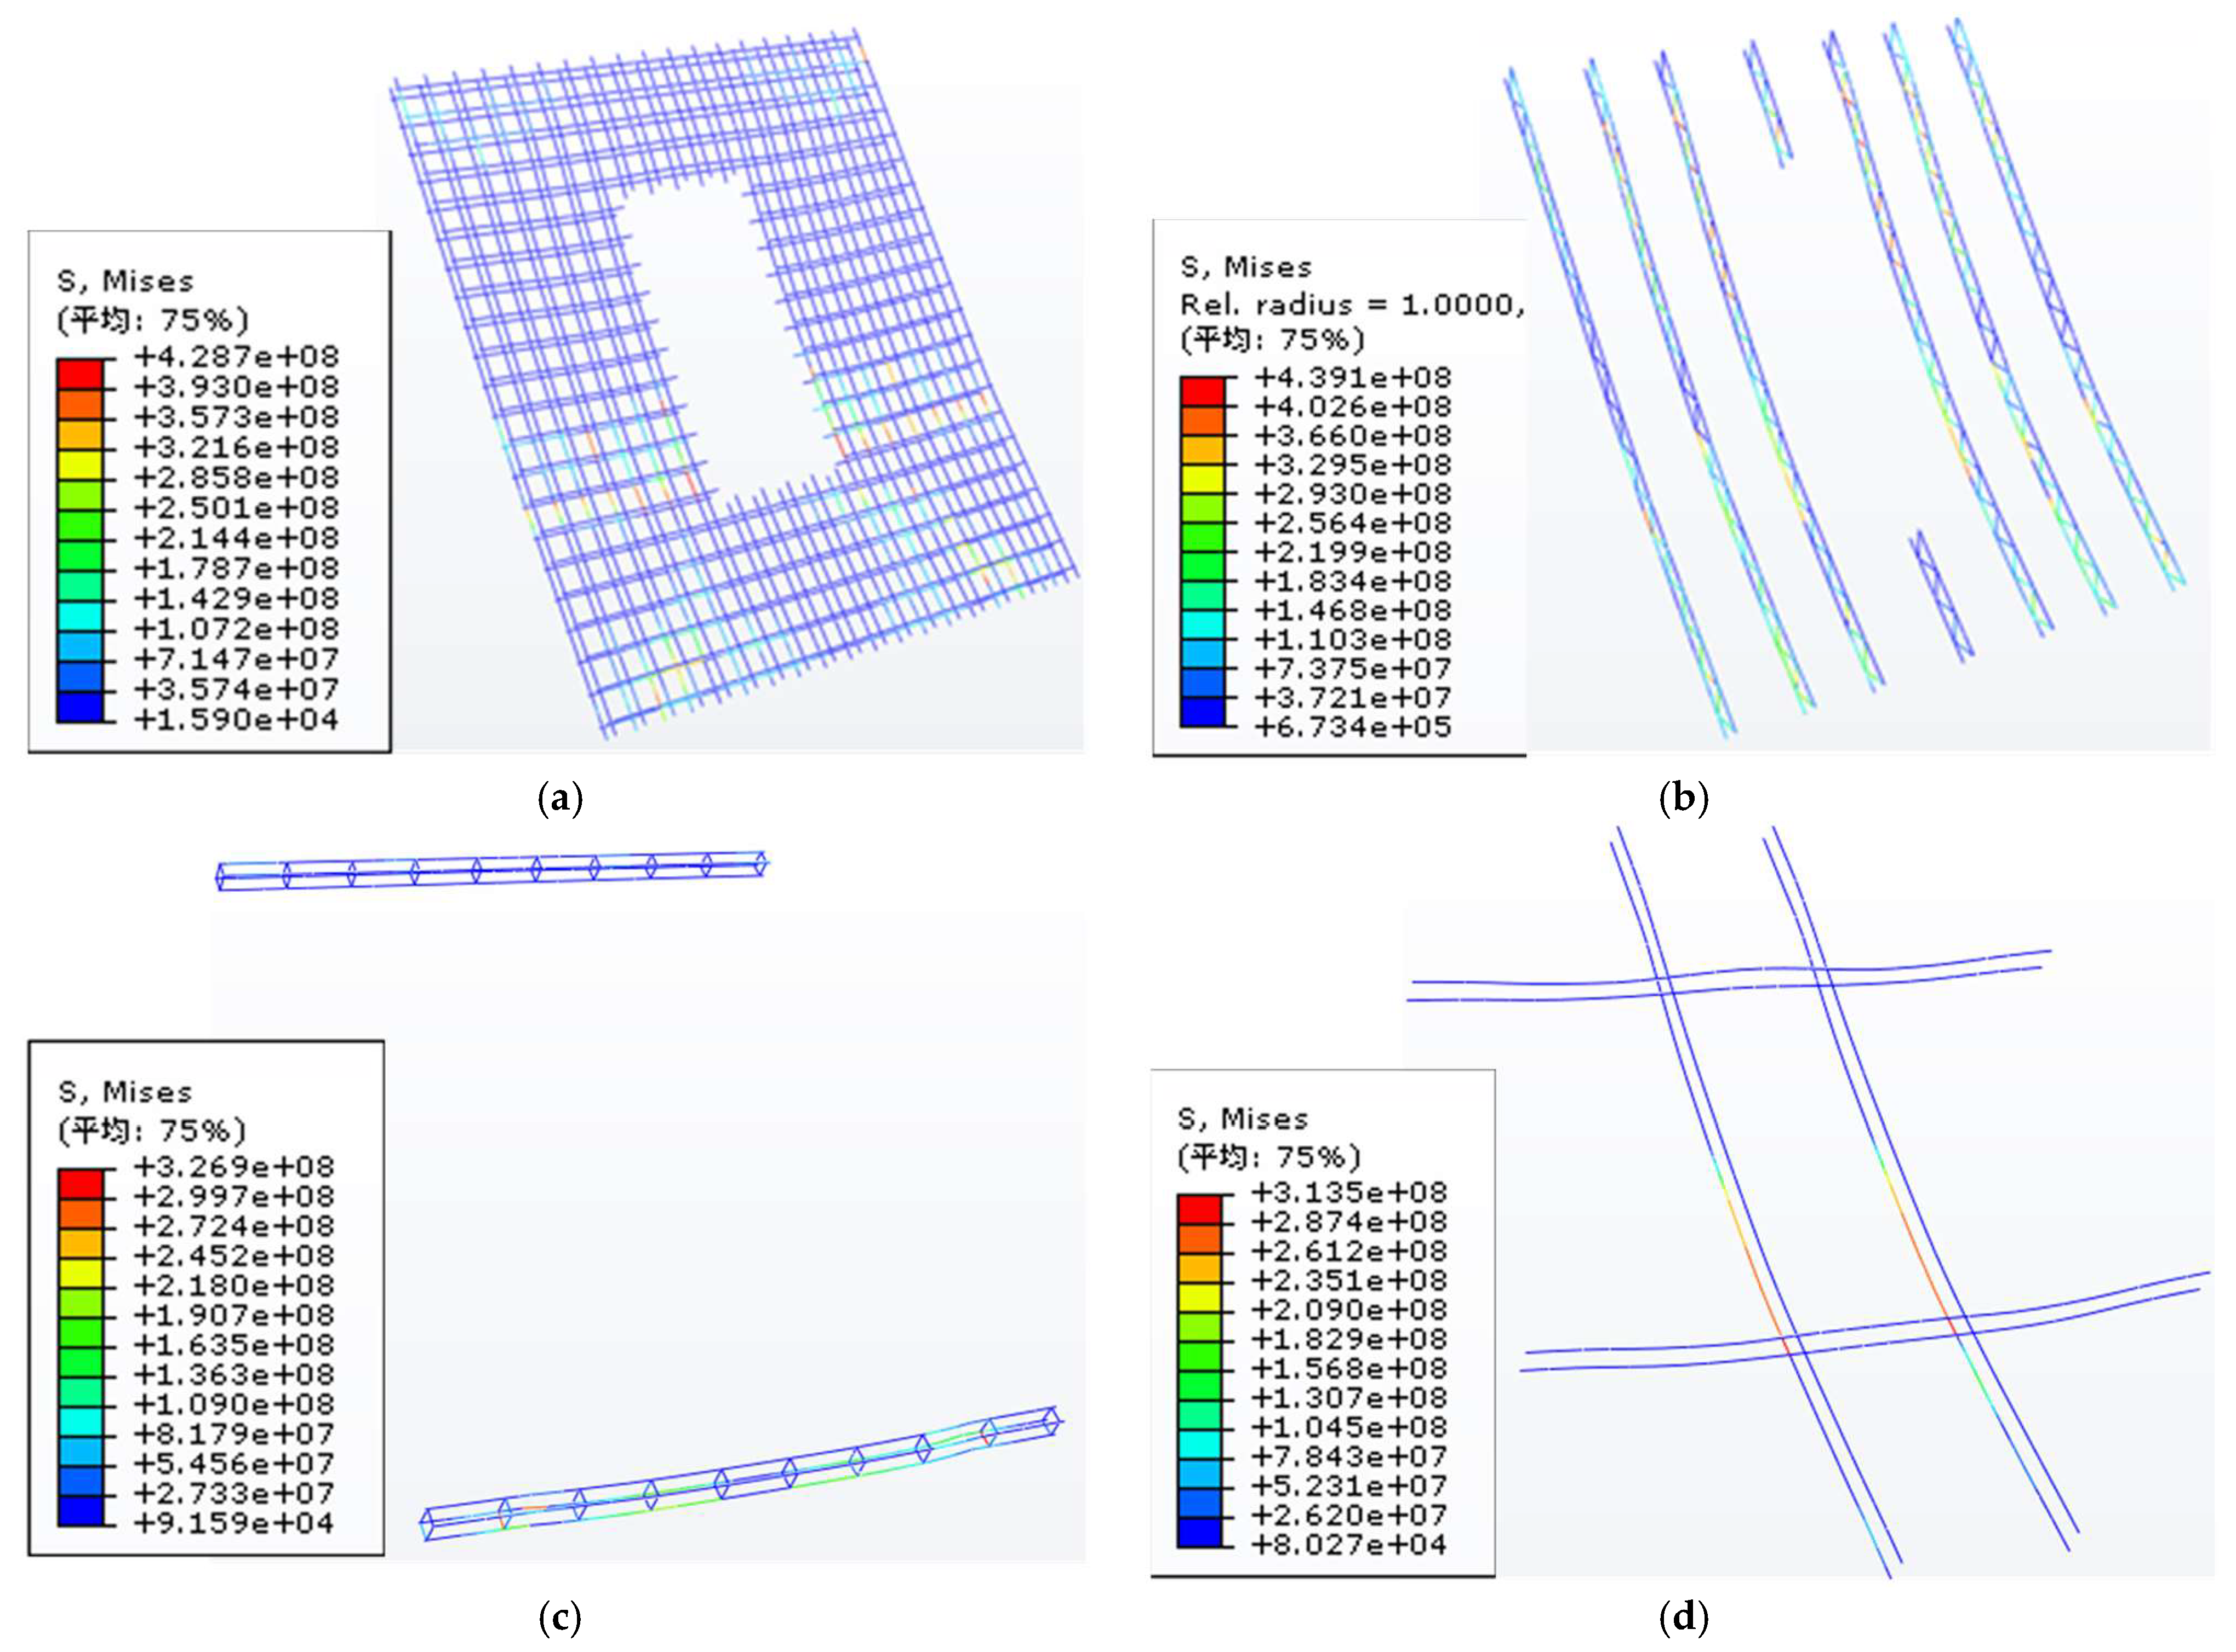
Figure 14 presents the stress distributions of reinforcements in specimen WP. It showed that the reinforcement wire mainly appeared to yield in the middle span and its supports. The maximum stress was about 500 MPa. On the other hand, the steel truss parallel to the span direction exhibited yielding mainly in the middle span, and the maximum stress of the steel truss was 464 MPa, lower than that of the reinforcement wire. However, the steel truss perpendicular to the span direction showed relatively lower stress than the truss which was parallel to the span direction. Figure 15 displays the stress distributions of reinforcements of specimen WPO. It could be noticed that only a small portion of reinforcements in the wire achieved their yield stress, mainly located with the middle and 1/3 span near the opening. Comparatively, the reinforcements in steel truss parallel to the span direction showed higher stress levels with the maximum stress value of 439 MPa mainly distributed on the web reinforcements. Moreover, the strengthen reinforcements around the opening showed relatively high stress levels, indicating that the stress concentration appeared around the opening. It could be concluded that the reinforcements in the concrete sandwich walls did not all reach their yield strength, indicating that the two layers of concrete could not work together fully in the concrete sandwich wall. Therefore, it is necessary to discuss the composite action between the two layers of the concrete for the concrete sandwich wall.

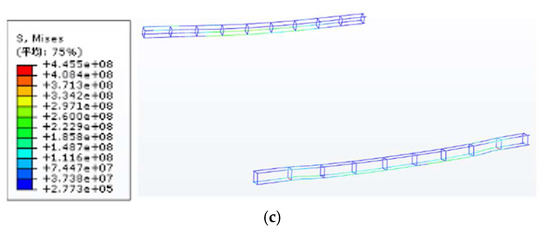
Figure 14.
Stress distributions of specimen WP. (a) Stress of reinforcement wire. (b) Stress of steel truss parallel to the span. (c) Mises stress contour plots of steel truss perpendicular to the span. The non-English term ‘平均’ means ‘Average’.
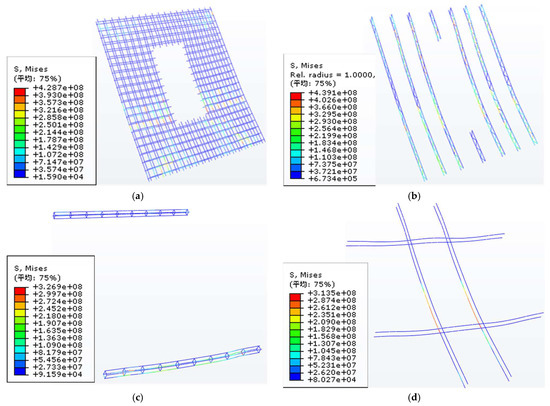
Figure 15.
Stress distributions of specimen WPO. (a) Stress of reinforcement wire. (b) Stress of steel truss parallel to the span. (c) Stress of steel truss perpendicular to the span. (d) Stress of strengthened steel truss. The non-English term ‘平均’ means ‘Average’.
5. Analytical Model of Composite Action
The degree of composite action (K) of the sandwich wall is an important factor that can reveal the interactive working degree of the components. When K equals to 0, it means that the two layers of concrete worked separately and the moment of inertia of the wall should be the summation of two layers of concrete. When K equals to 1, it means that the two layers of concrete works together, the moment of inertia of the wall should be calculated based on the whole section. Currently, there are two methods assessing the composite action of sandwich walls. One is related to the level of stiffness [25], and the other is related to the bearing capacity [26], both of which are expressed as:
in which Ks and Kb denote the degree of composite action related to stiffness and bearing capacity, respectively. Inc and Ic represent the moment of inertia of the sandwich wall, with the degrees of composite action being 0 and 1, respectively. I0 is the moment of inertia of the sandwich wall when reaching the cracking load. Fnc and Fc represent the ultimate bearing capacity of the sandwich wall with composite action degrees of 0 and 1, respectively. F0 represents the ultimate bearing capacity of the sandwich wall.
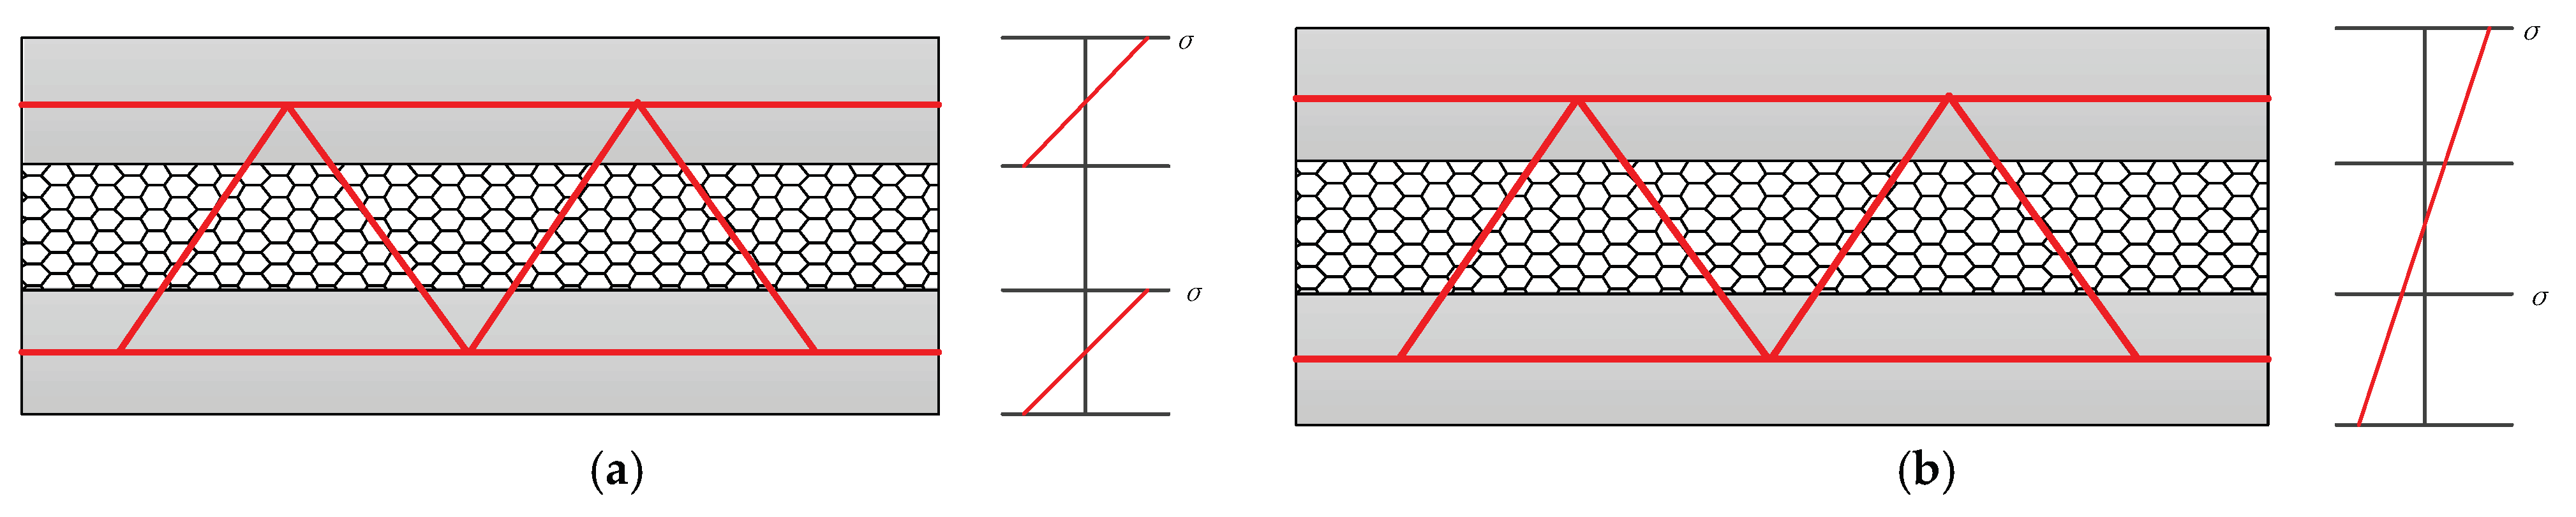
Generally, the degree of composite action for the sandwich wall gradually decreased with the increase in load. Figure 16 presents the strain distribution of the sandwich wall with K values of 0 and 1.
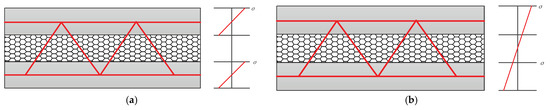
Figure 16.
Strain distributions of the sandwich wall. (a) K = 0. (b) K = 1.
For the sandwich wall before cracking, the moment of inertia could be expressed as [27]:
in which As is the area of reinforcements under tension, and b and h represent the width and thickness of the sandwich wall.
After cracking, the moment of inertia could be expressed as:
in which and .
The ultimate bearing capacity could be easily calculated according to the strain distribution. Table 3 and Table 4 list the degree of composite action for test specimens based on their strength and stiffness, respectively.
Table 3.
Degree of composite action related to strength.
Table 4.
Degree of composite action related to stiffness.
It could be observed that the degree of composite action of the test specimens based on their bearing capacities ranged from 33.05% to 45.53%, and, based on the moment of inertia, varied from 58.65% to 66.83%. It could also be seen that the degree of composite action of the sandwich walls under negative direction was slightly higher than that under positive direction, due to the fact that the steel beam provided additional constraints under negative bending conditions. The composite action degree of the sandwich wall without an opening was also slightly lower than that with an opening, owing to the fact that the two area layers of concrete decreased, whereas the connection force of the steel bar truss remained constant. Therefore, it is advised to judge the degree of composite action related to the bearing capacity of the sandwich concrete wall with an XPS layer of 30%, and with the degree at the moment of inertia at 50%. Once the degrees of composite action have been determined, the bearing capacity and moment of inertia could be calculated and used in designing this type of sandwich concrete wall.
6. Conclusions
In this paper, the concrete sandwich wall specimens considering the actual boundary conditions under positive and negative bending were analyzed using experimental and analytical methods. The following conclusions can be drawn:
- Typical failure modes of the sandwich wall specimens observed from the test were the cracking of concrete, fracture of XPS and bending deformation. In comparison, the specimens under positive and negative bending conditions exhibited similar failure modes, and the deflection under positive bending conditions was larger than that under negative bending conditions, owing to the fact that the constraints provided by the steel beam increased the stiffness of the wall under negative direction to some extent.
- The FEM considering the concrete damaged model was developed and compared with the experimental results. It demonstrated that the FEM could accurately capture the load-deflection curves of test specimens.
- Through the analyses of reinforcements embedded in the wall, it could be observed that the reinforcement wire of the specimen all reached their yield stress in the area occurring maximum deflection in the test. In addition, the reinforcements near the opening demonstrated the stress concentration effect.
- The composite action degree between the two layers of concrete was assessed in terms of the stiffness and bearing capacity. The composite action degrees related to the stiffness and bearing capacity were 58.65–66.83% and 33.05–45.53%, respectively. It is suggested that the moment of inertia of the sandwich wall panel could be calculated by taking the composite action degree of 50%, and the bearing capacity of the concrete sandwich wall could be observed by taking the composite action degree of 30%.
Author Contributions
Conceptualization, D.Y. and H.W.; methodology, A.C.; software, B.W.; validation, D.Y.; formal analysis, A.C.; investigation, D.Y.; resources, A.C.; data curation, B.W.; writing—original draft preparation, D.Y.; writing—review and editing, A.C.; visualization, H.W.; supervision, A.C.; project administration, A.C.; funding acquisition, A.C. All authors have read and agreed to the published version of the manuscript.
Funding
This research was funded by the University Synergy Innovation Program of Anhui Province [GXXT-2019-005].
Institutional Review Board Statement
Not applicable.
Informed Consent Statement
Not applicable.
Data Availability Statement
Data are contained within the article.
Acknowledgments
This work is supported by the University Synergy Innovation Program of Anhui Province (GXXT-2019-005). The financial support is highly appreciated.
Conflicts of Interest
The authors declare no conflict of interest.
References
- Sahoo, S.; Panda, S.; Singh, V.K. Experimental and numerical investigation of static and free vibration responses of woven glass/epoxy laminated composite plate. Proc. Inst. Mech. Eng. Part L. J. Mater. Des. Appl. 2017, 231, 463–478. [Google Scholar] [CrossRef]
- Nguyen, T.; Dung, M.; Phung, V.; Phan, H.C.; Ta Duc, T.; Nguyen Thi Cam, N.; Nguyen Thi, D. Bending of Symmetric Sandwich FGM Beams with Shear Connectors. Math. Probl. Eng. Theory Methods Appl. 2021, 2021 Pt 30, 7596300.1–7596300.15. [Google Scholar] [CrossRef]
- Nguyen, C.T.; Do Van, T.; Cong, P.H.; Zenkour Ashraf, M.; Doan, D.H.; Minh, P.V. Finite element modeling of the bending and vibration behavior of three-layer composite plates with a crack in the core layer. Compos. Struct. 2023, 305, 116529. [Google Scholar]
- Kumar, S.; Chen, B.Q.; Xu, Y.Y.; Dai, J.G. Structural behavior of FRP grid reinforced geopolymer concrete sandwich wall panels subjected to concentric axial loading. Compos. Struct. 2021, 270, 114117. [Google Scholar] [CrossRef]
- Xu, G.; Li, A.Q. Seismic performance of a new type precast concrete sandwich wall based on experimental and numerical investigation. Soil Dyn. Earthq. Eng. 2019, 122, 116–131. [Google Scholar] [CrossRef]
- Lee, Z.J.; Pessiki, S. Thermal performance evaluation of precast concrete three-wythe sandwich wall panels. Energy Build. 2006, 38, 1006–1014. [Google Scholar] [CrossRef]
- Jensen, K.; Al-Rubaye, S.; Thomas, R.J.; Maguire, M. Mechanics-Based model for elastic Bending, Axial, thermal Deformations, and asymmetry of concrete composite sandwich wall panels. Structures 2020, 23, 459–471. [Google Scholar] [CrossRef]
- Rao, G.A.; Poluraju, P. Cyclic behaviour of precast reinforced concrete sandwich slender walls. Structures 2020, 28, 80–92. [Google Scholar] [CrossRef]
- Xue, W.C.; Li, Y.; Yang, J.L.; Hu, X. Experimental study on seismic behavior of precast concrete sandwich shear walls under high axial compression ratio. Structures 2022, 45, 400–414. [Google Scholar] [CrossRef]
- Kontoleon, K.J.; Georgiadis-Filikas, A.; Tsikaloudaki, K.G.; Theodosiou, T.G.; Giarma, C.S.; Papanicolaou, C.G.; Triantafillou, T.C.; Asimakopoulou, E.K. Vulnerability assessment of an innovative precast concrete sandwich panel subjected to the ISO 834 fire. J. Build. Eng. 2022, 52, 104479. [Google Scholar] [CrossRef]
- Yu, S.S.; Liu, Y.F.; Wang, D.J.; Ma, C.; Liu, J.P. Theoretical, experimental and numerical study on the influence of connectors on the thermal performance of precast concrete sandwich walls. J. Build. Eng. 2022, 57, 104886. [Google Scholar] [CrossRef]
- Li, Y.; Xue, W.C.; Yun, Y.C.; Ding, H. Reversed cyclic loading tests on precast concrete sandwich shear walls under different axial compression ratios. J. Build. Eng. 2022, 54, 104619. [Google Scholar] [CrossRef]
- Garhwal, A.; Sharma, S.; Danie, R.A.B. Performance of Expanded Polystyrene (EPS) sandwiched concrete panels subjected to accelerated corrosion. Structures 2022, 43, 1057–1072. [Google Scholar] [CrossRef]
- Bishnoi, U.; Danie, R.A.B.; Kwatra, N. Out of plane performance of novel concrete sandwich panel using different geosynthetics. Constr. Build. Mater. 2021, 300, 124186. [Google Scholar] [CrossRef]
- Zhou, G.; Leung, H.L.; Robinson, B.; Zheng, C. New method for the evaluation of residual compressive strengths of sandwich panels via four-point bending. Mech. Mater. 2019, 136, 103075. [Google Scholar] [CrossRef]
- Ma, M.Z.; Yao, W.X.; Jiang, W.; Jin, W.; Chen, Y.; Li, P. A multi-area fatigue damage model of composite honeycomb sandwich panels under three-point bending load. Compos. Struct. 2021, 261, 113603. [Google Scholar] [CrossRef]
- Darzi, S.; Karampour, H.; Bailleres, H.; Gilbert, B.P.; McGavin, R.L. Experimental study on bending and shear behaviours of composite timber sandwich panels. Constr. Build. Mater. 2021, 259, 119723. [Google Scholar] [CrossRef]
- Xia, F.K.; Durandet, Y.; Tan, P.J.; Ruan, D. Three-Point bending performance of sandwich panels with various types of cores. Thin-Walled Struct. 2022, 179, 109723. [Google Scholar] [CrossRef]
- Mercedes, L.; Bernat-Maso, E.; Martínez, B. Bending behaviour of sandwich panels of vegetal fabric reinforced cementitious matrix: Experimental test and numerical simulation. Constr. Build. Mater. 2022, 340, 127820. [Google Scholar] [CrossRef]
- Galletti, G.G.; Vinquist, C.; Es-Said, Y.; Zou, Y.X.; Xu, L.; Xiang, Y.; Ke, K. Theoretical design and analysis of a honeycomb panel sandwich structure loaded in pure bending. Eng. Fail. Anal. 2008, 15, 555–562. [Google Scholar] [CrossRef]
- McCann, F. Analysis and design of recycled glass bead sandwich panels in bending. Compos. Struct. 2021, 265, 113730. [Google Scholar] [CrossRef]
- Liu, J.; Chen, J.Z.; Lv, Y.; Zeng, A.J.; Zhang, X.Y.; Huang, L. Bending performance of curved sandwich panels comprising GFRP face sheets and web cores: Experimental investigation and theoretical model. Thin-Walled Struct. 2022, 181, 110156. [Google Scholar] [CrossRef]
- GB/T 2975; Steel and Steel Products—Location and Preparation of Samples and Test Pieces for Mechanical Testing. China Plan Press: Beijing, China, 2017. (In Chinese)
- GB50010; Code for Design of Concrete Structures. China Plan Press: Beijing, China, 2010. (In Chinese)
- Salmon, D.C.; Einea, A.; Tadros, M.K. Full Scale Testing of Precast Concrete Sandwich Panels. ACI Struct. J. 1997, 94, 354–362. [Google Scholar]
- Natio, C.J.; Hoemam, J.M.; Shull, J.S. Precast/Prestressed Concrete Experiments Performance on Non-Load Bearing Sandwich Wall Panels; Lehigh University: Bethlehem, PA, USA, 2011; pp. 1–150. [Google Scholar]
- ACI 318-05; Building Code Requirements for Structural Concrete. American Concrete Inst.: Indianapolis, IN, USA, 2004.


Disclaimer/Publisher’s Note: The statements, opinions and data contained in all publications are solely those of the individual author(s) and contributor(s) and not of MDPI and/or the editor(s). MDPI and/or the editor(s) disclaim responsibility for any injury to people or property resulting from any ideas, methods, instructions or products referred to in the content. |
© 2023 by the authors. Licensee MDPI, Basel, Switzerland. This article is an open access article distributed under the terms and conditions of the Creative Commons Attribution (CC BY) license (https://creativecommons.org/licenses/by/4.0/).